Article

Multi-Scale Estimation of Land Use Efficiency (SDG 11.3.1) across 25 Years Using Global Open and Free Data

1
European Commission-Joint Research Centre, Via E. Fermi 2749, 21027 Ispra, Italy
2
Engineering S.p.a, Piazzale dell’Agricoltura 24, 00144 Roma, Italy; [email protected]
*
Author to whom correspondence should be addressed.
Sustainability 2019, 11(20), 5674; https://doi.org/10.3390/su11205674
Submission received: 12 September 2019 / Revised: 7 October 2019 / Accepted: 9 October 2019 / Published: 14 October 2019
(This article belongs to the Section Sustainable Urban and Rural Development)

Abstract

:
Sustainable Development Goal (SDG) 11 aspires to “Make cities and human settlements inclusive, safe, resilient and sustainable”, and the introduction of an explicit urban goal testifies to the importance of urbanisation. The understanding of the process of urbanisation and the capacity to monitor the SDGs require a wealth of open, reliable, locally yet globally comparable data, and a fully-fledged data revolution. In this framework, the European Commission–Joint Research Centre has developed a suite of (open and free) data and tools named Global Human Settlement Layer (GHSL) which maps the human presence on Earth (built-up areas, population distribution and settlement typologies) between 1975 and 2015. The GHSL supplies information on the progressive expansion of built-up areas on Earth and population dynamics in human settlements, with both sources of information serving as baseline data to quantify land use efficiency (LUE), listed as a Tier II indicator for SDG 11 (11.3.1). In this paper, we present the profile of the LUE across several territorial scales between 1990 and 2015, highlighting diverse development trajectories and the land take efficiency of different human settlements. Our results show that (i) the GHSL framework allows us to estimate LUE for the entire planet at several territorial scales, opening the opportunity of lifting the LUE indicator from its Tier II classification; (ii) the current formulation of the LUE is substantially subject to path dependency; and (iii) it requires additional spatially-explicit metrics for its interpretation. We propose the Achieved Population Density in Expansion Areas and the Marginal Land Consumption per New Inhabitant metrics for this purpose. The study is planetary and multi-temporal in coverage, demonstrating the value of well-designed, open and free, fine-scale geospatial information on human settlements in supporting policy and monitoring progress made towards meeting the SDGs.

Graphical Abstract

1. Introduction

Settlements have been among the key markers of human life on Earth since ancient history and have evolved with the development of civilizations [1]. Currently, Earth’s population exceeds 7 billion, and the additional 2.3 billion people projected to inhabit the globe by 2050 [2] pose serious challenges to the use of natural resources. The human impacts on the planet and the resulting modifications have gained traction in research and policy response, especially after the Earth Summit in 1992 (which gathered United Nations Member States to adopt a global agenda on sustainable development). Still, the degree of human impact on the planet is deemed to be so high that scientists suggest that Earth has entered a new geological era: the Anthropocene [3,4].
Land is among the natural resources exposed to the transformative dynamics of the Anthropocene. Humans modify land through direct intervention (e.g., agriculture, soil sealing infrastructures, housing, etc.) [5] or by means of the externality of a direct intervention (e.g., pollution) [6], and the synthesis of land use changes often results in biodiversity loss and degradation [7], the depletion of natural resources, and urbanisation, which is a defining trend of the Anthropocene [8,9,10].
Contemporary urbanisation processes have attained a planetary reach, as theory [11] and empirical evidence suggest [12], and they are substantially more intense compared to previous epochs [13], with a sizable spatial and demographic connotation. The urbanisation process takes place through spatial expansion and population densification [14,15,16]. However, most recent urbanisation directions no longer imply only rural–urban shifts, spatial expansion at city edges and demographic growth captured by urban areas, but also a trend of density convergence between metropolises and regions [17] deriving from a dispersion of built-up areas away from major human settlements. This process of the spatial expansion of settlements causes extensive land transformation/conversion; these processes are looked at from multidisciplinary angles to capture the interplay between civilizations’ development and the planet Earth [13].
In this context, the world polity reached consensus in 2015 on a new sustainable development agenda (the 2030 Development Agenda) [18] to take over the Millennium Development Goals (MDG) with the Sustainable Development Goals (SDG), stressing the principle of universality and the importance of recording progress and implementation. The Agenda is jointly designed with a broad monitoring framework of goals and an aspirational reporting schema of targets, marking a significant advance compared to the MDGs. Although supported by the scientific community [19], the ambition to monitor progress towards reaching targets is affected by wide gaps in data availability and comparability for indicators. Innovative ways to source data through a data revolution were called for in parallel to the Post-2015 negotiation process [20] to support the established statistical capacity in coping with SDG monitoring [21]. Aware of prospective difficulties in SDG monitoring, the Inter-Agency Expert Group on SDG Indicators (IAEG-SDGs) developed a three-tier schema to classify SDG indicators according to the availability of an internationally established methodology and the availability of data supporting the method. According to this classification, Tier 1 indicators are conceptually clear, have an internationally established methodology and standards, and the data are regularly produced by countries. Tier 2 indicators are at the same level of maturity as Tier 1 indicators in terms of methodology and standards, but data are not regularly produced by countries. For Tier 3 indicators, both the methodology and standards are being (or will be) developed or tested. As methodologies are continuously being developed and data availability may increase over time, the tier classification for many indicators is expected to change. Therefore, the IAEG-SDGs reviews the tier classification and regularly updates this classification.
It is important that the process of upgrading the indicators from Tier II to Tier I speeds up in order to make sure that reporting is not done only on a limited set of Tier I indicators, which by no means measure up to the scope and ambition of the 2030 Agenda [22].
Several indicators require data that are not currently available, disaggregated as desired, or for which collection is significantly expensive (methodologically, economically or timewise). Earth Observations (EO) were advocated as key data source for several SDG indicators [23], and the potential of geospatial information and EO to monitor SDG indicators has been assessed and proved particularly suitable for SDGs 2, 11, 14 and 15 [24] across multiple levels of information production and integration [25]. In particular, EO is of prime importance for SDG 11 and 15 to source information with worldwide coverage over repeated periods of time and at relatively low marginal cost, potentially filling the gap of data scarcity for the SDG monitoring framework [23,26,27]. In these two SDGs, land is the main asset monitored, and land consumption is the focus of SDG 11.3.1 (i.e., “ratio of land consumption rate to population growth rate” or the land use efficiency (LUE indicator), the aim of which is to “enhance inclusive and sustainable urbanisation, […] sustainable human settlement planning and management”.
Land use and land cover (LULC) changes are broadly studied as a proxy for human development [28]. Most prominent manifestations of LULC change phenomena include deforestation, agricultural intensification, and urbanisation [29]. Their impacts affect ecological systems [30], climate [31,32], health [33], and a wider spectrum of fundamental ecosystem services for life on the planet [34,35].
Information on land cover is mainly derived from Earth Observation and Remote Sensing with progressive improvements in spatial resolution [36] and the accuracy of the thematic classification [37]. Results of land cover change studies with recent global and multi-temporal products (e.g., US Geological Survey Moderate Resolution Imaging Spectroradiometer, MODIS, and Global Land 30, GLC30) constituted an early core baseline of information to explore the extent of human settlements [38,39]. While LULC maps are useful to explore the changes of a multitude of land cover typologies (e.g., forest areas) and to propose estimates of land conversion to urban area, recent thematic maps that have a clear semantic classification for built-up areas structures and generalize the delineation of urban areas are also used in urban studies. Thematic maps on human settlement and urban extents are directly developed to map impervious areas that are associated with urban areas and human settlements, even if various definitions are provided [38,39,40,41] (for a comprehensive review see [42]), and make it possible to understand the extent and the ways in which land is modified in such areas. While specific figures of such modifications are heterogeneous across products [16,43,44], it was collectively understood that the land conversion induced by the spatial expansion of urban areas is a prominent development challenge [45,46].
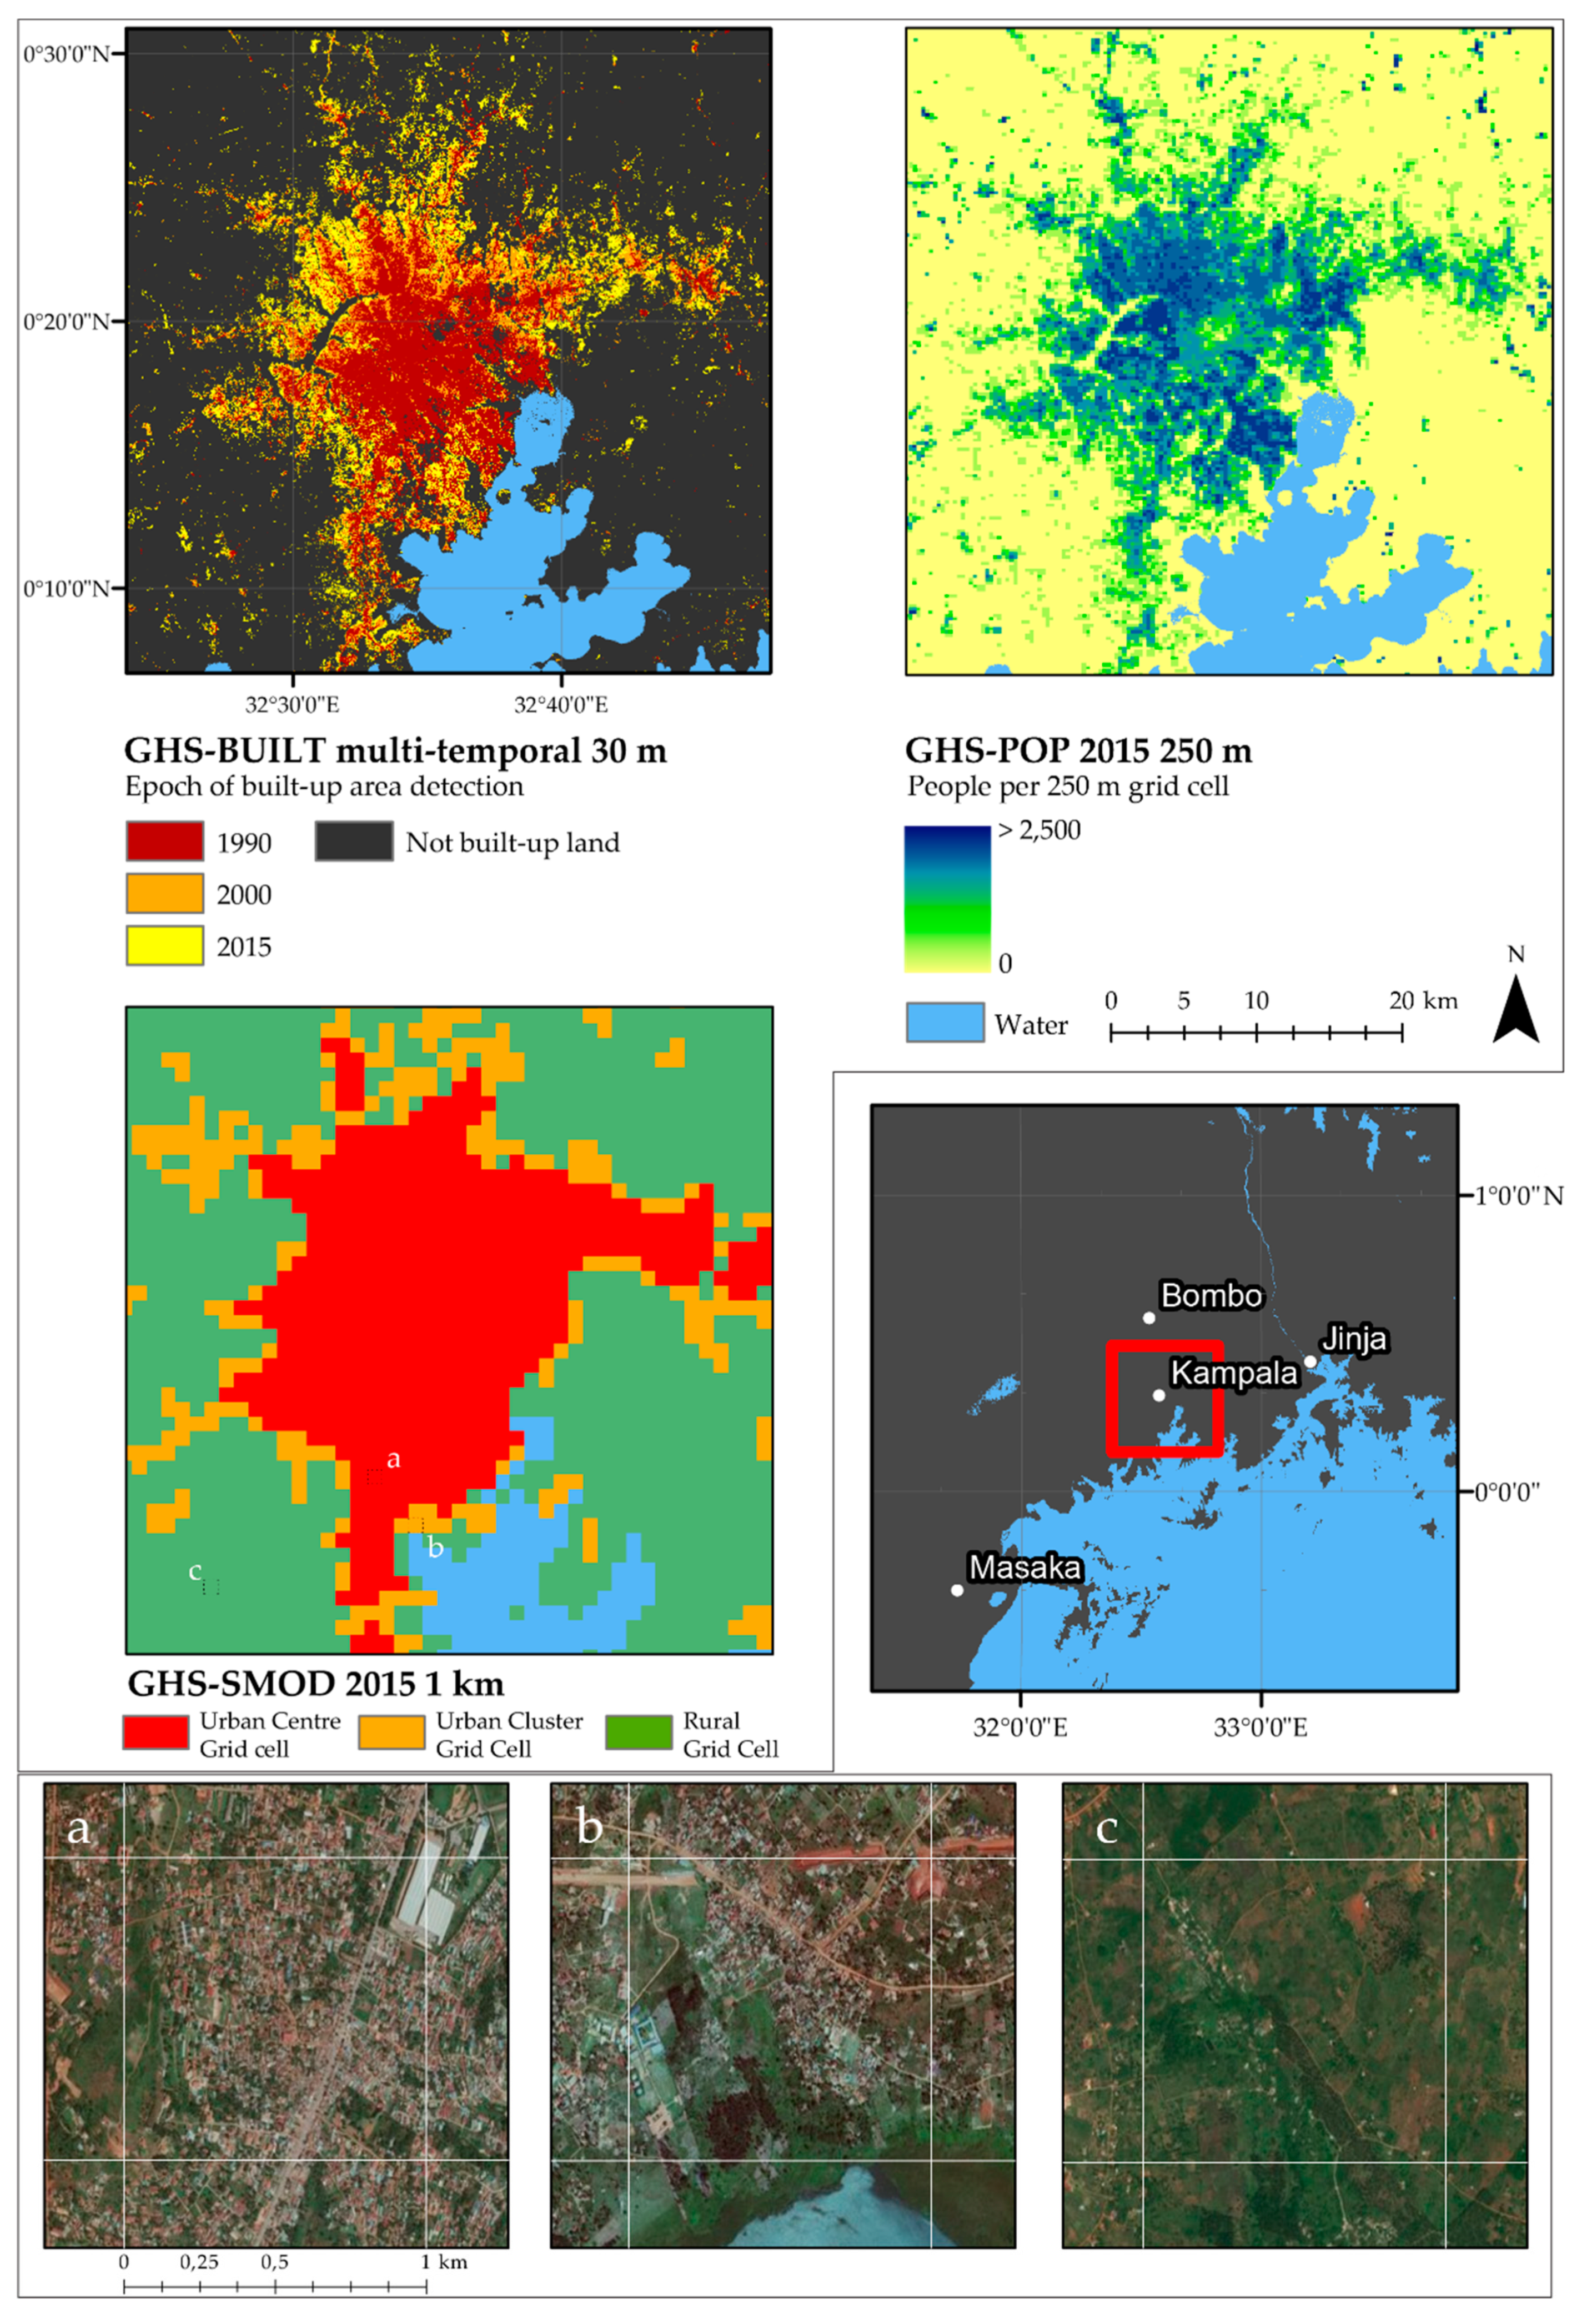
Progressively refined thematic mapping products [47], [38], [41] paved the way for a new generation of layers that have reached the spatial detail to map small settlements (Figure 1), with products such as the built-up grid (GHS-BUILT) produced in the Global Human Settlement Layer (GHSL) framework at the European Commission–Joint Research Centre (EC-JRC), and the Global Urban Footprint (GUF) produced at the German Aerospace Agency (DLR). Both layers represent a new generation of EO products that possess high spatial resolution (decametric resolution), abstract artificial land as built-up areas and urban footprints [43,48,49], and have global coverage. Information extracted from these layers provides the most recent representation of the extent of human settlements (2011–2012 in GUF and 2014 in GHS-BUILT) [43,50] and substantially contributes to the understanding of the extent of the urbanisation process [12,51]. An additional limitation of several land cover products and urban mapping products is the unavailability or incompatibility of information over time (multi-temporal data) to monitor pattern changes and to identify long-term trajectories of land consumption. Currently, GHSL represents the only dataset allowing the assessment of changes in built-up areas over 40 years [50] and supporting methods to monitor single class (built-up areas) changes [52].
Historically, although there are several interacting factors involved [53,54,55], population growth has generally driven land consumption. The decoupling of these two processes is a significant force of the globalized economy [56]. Urban population data are collected and distributed by the United Nations Department for Economic and Social Affairs (UNDESA) which issues periodical updates of the World Urbanization Prospects (WUP) based on national reporting. Despite national data being compiled on the basis of the heterogeneous national definitions of urban areas and cities [57,58,59,60] (based on administrative, functional designations and/or population size and population density thresholds)—thus determining inconsistencies across spatial units and epochs due to a shortage of alternative sources—the UNDESA WUP has become the main source for urbanisation analyses and urbanisation studies [61]. Advanced georeferenced approaches to grid population data [62,63] offer alternative local and spatial information to map populated places on the planet. This is generally achieved with a combination of EO-derived information and census data [64]. Improved global geospatial data on population distribution and densities, in particular concerning temporal and spatial resolution, are required for a better understanding of the interplay between land consumption and demographic changes (i.e., between spatial expansion of settlements and population change), as needed to estimate SDG 11.3.1 indicators.
The state of the art in SDG 11.3.1 currently includes materials produced by four main types of stakeholder: intergovernmental institutions, national authorities and agencies, international expert groups, and research institutions. This architecture follows the implementation plan of SDG, whereas the custodian Agency of SDG 11 (UN-Habitat) assisted by international expert groups (especially the one convened by the United Nations Global Geospatial Information Management, UNGGIM) coordinates and establishes partnerships with focal points in member States. This latter agent has the responsibility to report progress made in meeting the SDG and produce national reports. The scientific community provides empirical results, critical reviews and scientific advice for improving SDG monitoring. The main documentation and reporting on SDG 11.3.1 includes a training module produced by UN-Habitat on “Land Consumption” (with methodological insights, proposed data sources and hints to interpret results of calculations), a preliminary “Progress Report on SDG11” presented at the High Level Political Forum on Sustainable Development 2018, a concise list of country practices and reports of SDG 11.3.1 monitoring (including France, Italy, Colombia and the United Kingdom), and a few peer-reviewed research articles on methodological perspectives and quantitative results on 11.3.1 case study monitoring at the national level [65] and global scale [66]. National reporting from data-rich parties underlines the heterogeneity in the selection of input data and time spans to quantify the indicator, while reporting from the Global South is still in the exploratory phase. Instead, scientific contributions have focused on the limitations and opportunities to apply the presently agreed methodology. In particular, in [65], it is emphasized that further work is needed to clarify and agree on concepts and assumptions but also on mathematical formulations and methods for the estimation of the indicator.
This paper aims to nurture this ongoing science-policy debate with major and comprehensive analytics of the SDG 11.3.1 indicator by analysing the interplay between land consumption and sustainable urban development (in its spatial and demographic components) from a global point of view. In particular, utilizing the GHSL framework of data and tools derived from EO, we propose a multiscale quantification of the land use efficiency indicator, currently classified as a Tier II indicator (https://unstats.un.org/sdgs/metadata/files/Metadata-11-03-01.pdf). We do so by presenting the land use efficiency value (“LCRPGR” in the UNDESA metadata) at multiple scales: a) at the global level and by major regions of the World [2]; b) by settlement typologies, applying the “Degree of Urbanisation” [67]; c) in about 10,000 urban centres [68]; and d) in selected urban centres. We focus on the period 1990–2015 and two sub-periods (1990–2000 and 2000–2015). The advantages of our analysis are the quantification of the LUE across multiple scales, in the most comprehensive city dataset available (about 10,000 urban centres); the capacity to analyse in depth the interplay between spatial expansion and population change; and the exploration of land use efficiency in three different settlement typologies—urban centres, urban clusters and rural areas. These are identified by the Global Definition of Cities and Settlements which aspires to harmonize data collection for SDG reporting (currently developed by the European Commission and to which the Organisation for Economic Cooperation and Development, OECD, the World Bank, the Food and Agriculture Organization, FAO, and the United Nations Settlement Programme, UN-Habitat, voluntarily committed). The paper is developed using a methodology tailored to UNGGIM recommendations, which proposes a minimum set of assumptions to estimate LUE with GHSL [66].
Our results point out that (i) multi-temporal, global, gridded, open data, such as that produced in the GHSL framework, make it already possible to estimate LUE for the entire planet at several territorial scales, paving the way for lifting the LUE indicator from its Tier II classification; (ii) the current formulation of the LUE is substantially subject to path dependency in quantifying the efficiency of new development (i.e., the same LUE value can be achieved in completely different land take situations); and (iii) the indicator requires spatially explicit metrics for its interpretation and inter-comparison across territories and scales of analysis that more closely capture the characteristics of the socio-spatial development.
The geographical coverage and the number of urban centres analysed make the present work the most extensive LUE estimation attempted to date.

2. Materials and Methods

This research develops on the Tier II nature of SDG 11.3.1 exploring the results of the indicator with data derived from the Global Human Settlement Layer. In this section, we present the internationally agreed-upon methodology for the LUE estimation, and we also introduce two more distinctive indicators that possess a spatially explicit nature (to accompany the Land Use Efficiency metric) to quantify the characteristics of socio-spatial dynamics in areas of urban expansion.

2.1. Methods

The methodology for SDG 11.3.1 is established and referenced in the SDG indicator Metadata Repository managed by UNDESA (https://unstats.un.org/sdgs/metadata). LUE monitors the “ratio of land consumption rate to population growth rate” and aims to quantify the use of land as a consequence of urban expansion pressures (demographic and economic) [54,69,70,71,72,73] with a dimensionless number. To estimate LUE, it is first necessary to quantify the rate of land consumption (LCR) and the population growth rate (PGR) in a given spatial unit and time span (Δt). The two rates (LCR and PGR) are computed as follows:
LCR =   L N   ( U r b t + n U r b t ) y   PGR =   L N   ( P o p t + n P o p t ) y
where Urbt and Urbt+n capture the total areal extent of the land consumed (extent of the human settlement, built-up areas) at the initial reference year t and at the final reference year t+n, respectively; Popt and Popt+n input the total population of the spatial unit at the initial reference year and at the final reference year, respectively; and y is the number of years between t and t+n (LN refers to the natural logarithm of the ratio). Equation (2) expresses the estimate of the ratio of land consumption rate to population growth rate (referred to in the UN metadata as LCRPGR, and LUE in this paper):
LUE   =   LCR PGR
Besides the LUE, we also propose and calculate two additional indicators: one representing the Abstract Achieved Population Density in Expansion Areas (AAPDEA—Equation (3)), and the other the Marginal Land Consumption per New Inhabitant (MLCNI—Equation (4)). The latter indicator was included in the national reporting on land consumption and ecosystem services of the Ministry of Environment of Italy by the “Istituto Superiore per la Protezione e la Ricerca Ambientale” [74].
The AAPDEA and MLCNI are reciprocal mathematical formulations and are computed on the basis of the absolute difference between the spatial expansion of the settlement (built-up areas) and the change in population in the same spatial unit.
AAPDEA   ( number   of   people   per   km 2 of   built - up   area ) =   Pop t + n -   Pop t Urb t + n -   Urb t
MLCNI   ( area   per   capita   of   new   inhabitant   in   m 2 ) =   Urb t + n -   Urb t Pop t + n - Pop t

2.2. Input Population and Built-Up Datasets

The LUE formulation requires multi-temporal data regarding the spatial extent of the settlement and the respective population. Data to quantify LCR are scarcely available, as the concept of consumed land lacks objective assessments and is semantically contentious. Data to accurately quantify PGR are often not directly available at the city level and for all the spatial units of interest around the globe (especially due to limits to disaggregate information and to the spatial detail and multi-temporal consistency of data). To quantify LUE, we therefore adopted a new generation of data derived from EO, as this information source emerges as a key contributor to provide data to support SDG monitoring [23,24]. In the specific case of the SDG 11.3.1, the GHSL is currently the only dataset that covers the entire globe, with multi-temporal open and free data on a) the spatial extent of settlements, b) the resident population, and c) the classification of settlement typologies. To carry out our analysis, we relied on the open data displayed in Table 1 and in Figure 2. GHSL datasets are produced using artificial intelligence and symbolic machine learning processes developed at the European Commission Directorate General Joint Research Centre (EC-JRC). GHSL is a raster geospatial dataset which—for each of the 1 km grid cells on the landmass—quantifies the density of built-up areas (GHS-BUILT), the density of people (GHS-POP) and the settlement typology (GHS-SMOD) in 1975, 1990, 2000, and 2015. In this study, we maintain as much consistency as possible with the methodological exploration in [66] for the proxy of land consumption and the population growth rate and are constrained to GHSL data (discussed in Section 4.3). For the assessment of LCR, the GHSL multi-temporal grids of a built-up surface were used (GHS-BUILT). Built-up areas were mapped from Landsat satellite data archives using a fully automated information extraction method [48]. The GHS-BUILT product encodes the presence of built-up surfaces in grid cells of 1 km and 250 m for the epochs 1975, 1990, 2000 and 2015. For the assessment of PGR, the GHSL population grids for the corresponding epochs were used (GHS-POP). The population grids were produced by disaggregating population counts from the best-available harmonized census data to built-up areas (as mapped in the GHS-BUILT layer for the same epochs) in a linear proportion to the built-up density [75]. The resulting grids represent population counts and densities for grid cells of 1 km, allowing the computation of their changes in time over the periods 1990–2000 and 2000–2015.
For the delineation of urban centres and the other settlement typologies, we relied on the GHSL settlement model (SMOD) producing the GHS-SMOD raster dataset. The SMOD classifies settlements in three typologies (i.e., urban centres, urban clusters and rural areas) by porting the “Degree of Urbanisation” definition [67] to the GHSL environment [76]. The three settlement typologies are presented in [67], while the delineation of urban centres is further explained in [77] and [68]. Urban centres consist of settlements with high built-up areas (>50%) or population densities (>1500 inhabitants per km2) that host at least 50,000 inhabitants. Urban clusters are settlements with at least 5000 inhabitants and with a minimum population density of 300 inhabitants per km2; rural areas are populated grid cells (single or contiguous) that do not reach the threshold for an urban cluster. Given the gridded raster nature of GHS-SMOD layers, each cell has a mutually exclusive classification despite the logical definition of urban cluster containing urban centres (thus, a cell’s classification as an urban centre prevails over an urban cluster, Figure 2). In this research, LUE has been quantified at the global, regional and national level using the country boundaries provided by the Database of Global Administrative Areas (GADM v2.8—https://gadm.org/index.html). The classification of countries by their region of the world follows WUP 2018 [2], and statistics on built-up areas and population at different territorial scales were extracted in a Geographic Information System environment (GIS) through zonal statistics operations.

3. Results

This section presents the results of our analysis; it is organized according to the territorial scales we addressed. First, in Section 3.1, we compare the LUE across regions of the world in the periods 1990–2000, 2000–2015 and the aggregated period 1990–2015; second, in Section 3.2, we compare the LUE across settlement typologies; then, in Section 3.3, we perform this comparison for urban centres across regions of the world, and then we compare LUE across 10,000 urban centres (in Section 3.4); in Section 3.5, we focus on the two additional proxy and spatially explicit indicators we propose; and in Section 3.6, we present a list of cities with comparable LUE values and argue that a spatially explicit metric to estimate LUE is required.

3.1. Land Use Efficiency Per Region of the World in the Period 1990–2015

Between 1990 and 2015, according to GHSL data, the built-up surface on Earth (in urban centres, clusters and rural grid cells) expanded by almost 50%, from 522,000 km2 in 1990 to more than 777,000 km2 in 2015, while population increased by almost 40%, from 5.3 billion people in 1990 to 7.3 billion in 2015 (Table 2). This trajectory of development is captured by a global LUE value of 1.22, with a rate of spatial expansion prevailing over that of population growth. Considering the separate time intervals—1990–2000 and 2000–2015—it is observed that the LUE value is higher in the first (1.57) compared to the second interval (0.95). The difference is substantial: in the period 1990–2000, the land consumption prevails over the demographic growth (LUE > 1); in the second period, the rate of population growth is faster than that of spatial expansion (0 < LUE ≤ 1), indicating a more efficient use of land compared to the previous 10 years.
When disaggregated by region, LUE values show considerable variations. In Africa, Asia, and Latin America and the Caribbean, the LUE is around 1 in the first interval (1.08, 1.72, and 1.64, respectively), while it is much higher in Northern America (2.21) and an order of magnitude higher in Europe (20.22). In these last two regions, the spatial expansion of built-up areas was twice to 20 times greater than population growth (Table 2).
In the subsequent period—2000–2015—the LUE is below 1 in Africa (0.43), Latin America and the Caribbean (0.78), and Oceania (0.45), implying more sustained population growth compared to built-up areas expansion and a process of densification of settlements. Table 2 displays the multi-temporal built-up areas and population statistics per region of the world and the corresponding LUE value, including the relative change of the variables between 1990 and 2015. In Europe, the region with the highest LUE value in the period 1990–2015 (11.62), the population increased in 25 years by 2.4% (from 721 to 738 million people, +17 million) while built-up areas expanded by more than 30% (from to 145,000 to 192,000 km2, +46,000 km2). In Africa, the region with the second-lowest LUE value (0.7), the population increased by almost 90% (from 632 million people to 1.1 billion, +554 million) and built-up areas expanded by 55% (from 27,000 to 42,000 km2, +14,000 km2).
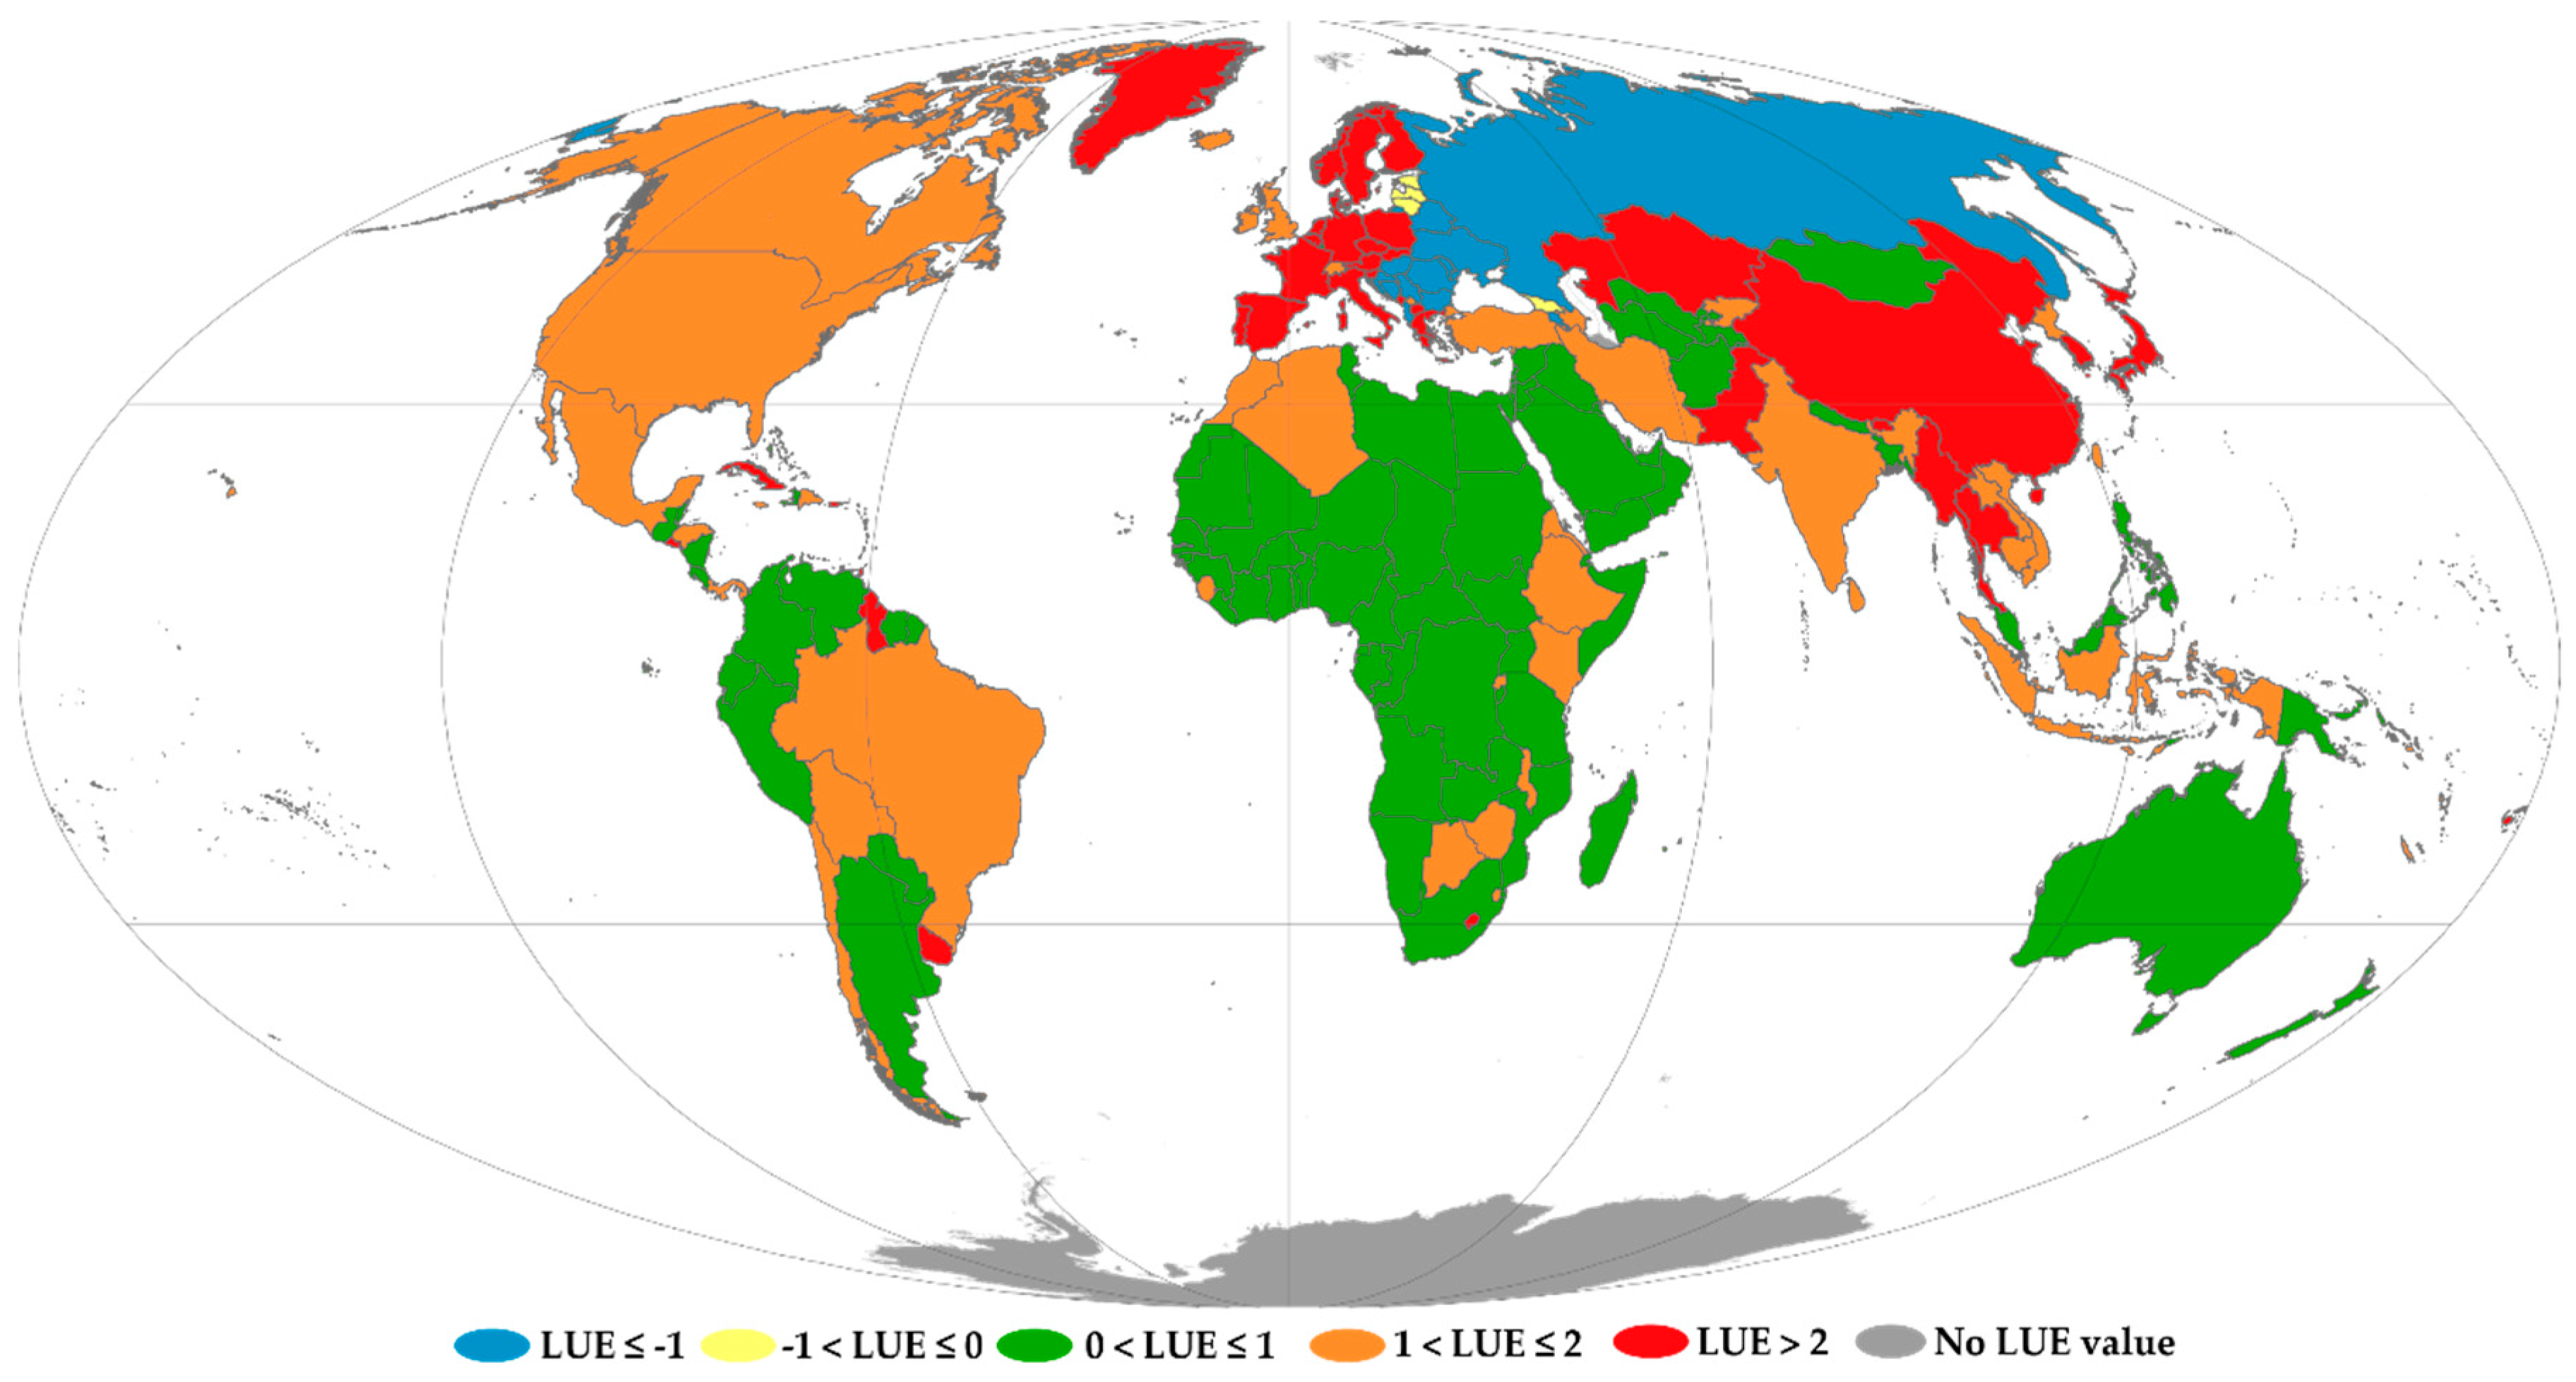
Based on national-level analysis (Figure 3), almost half the countries developed with a trajectory described by a LUE value between 0 and 1 (population densification; see Section 4.3).
Of the other countries, 24% had a LUE exceeding 2 (land consumption at a rate double that of population growth; see Section 4.3); and 22% had a LUE between 1 and 2 (a moderate rate of expansion over land and an inferior rate of population growth; see Section 4.3). LUE is substantially negative (below −1) in 14 countries (11 of which are in Eastern Europe, and the others in Asia), between 1 and 0 in five countries (three in Europe and one in Asia and Latin America and the Caribbean), between 0 and 1 in 111 countries (the majority in being in Africa, at 43; 31 are in Asia, and 20 are in Latin America and the Caribbean), between 1 and 2 in 51 countries (especially in the Americas, and parts of Africa and Asia), and above 2 in 56 countries (in particular, 23 in Central and Western Europe, and 14 in Asia).

3.2. Land Use Efficiency Per Settlement Typology in the Period 1990–2015

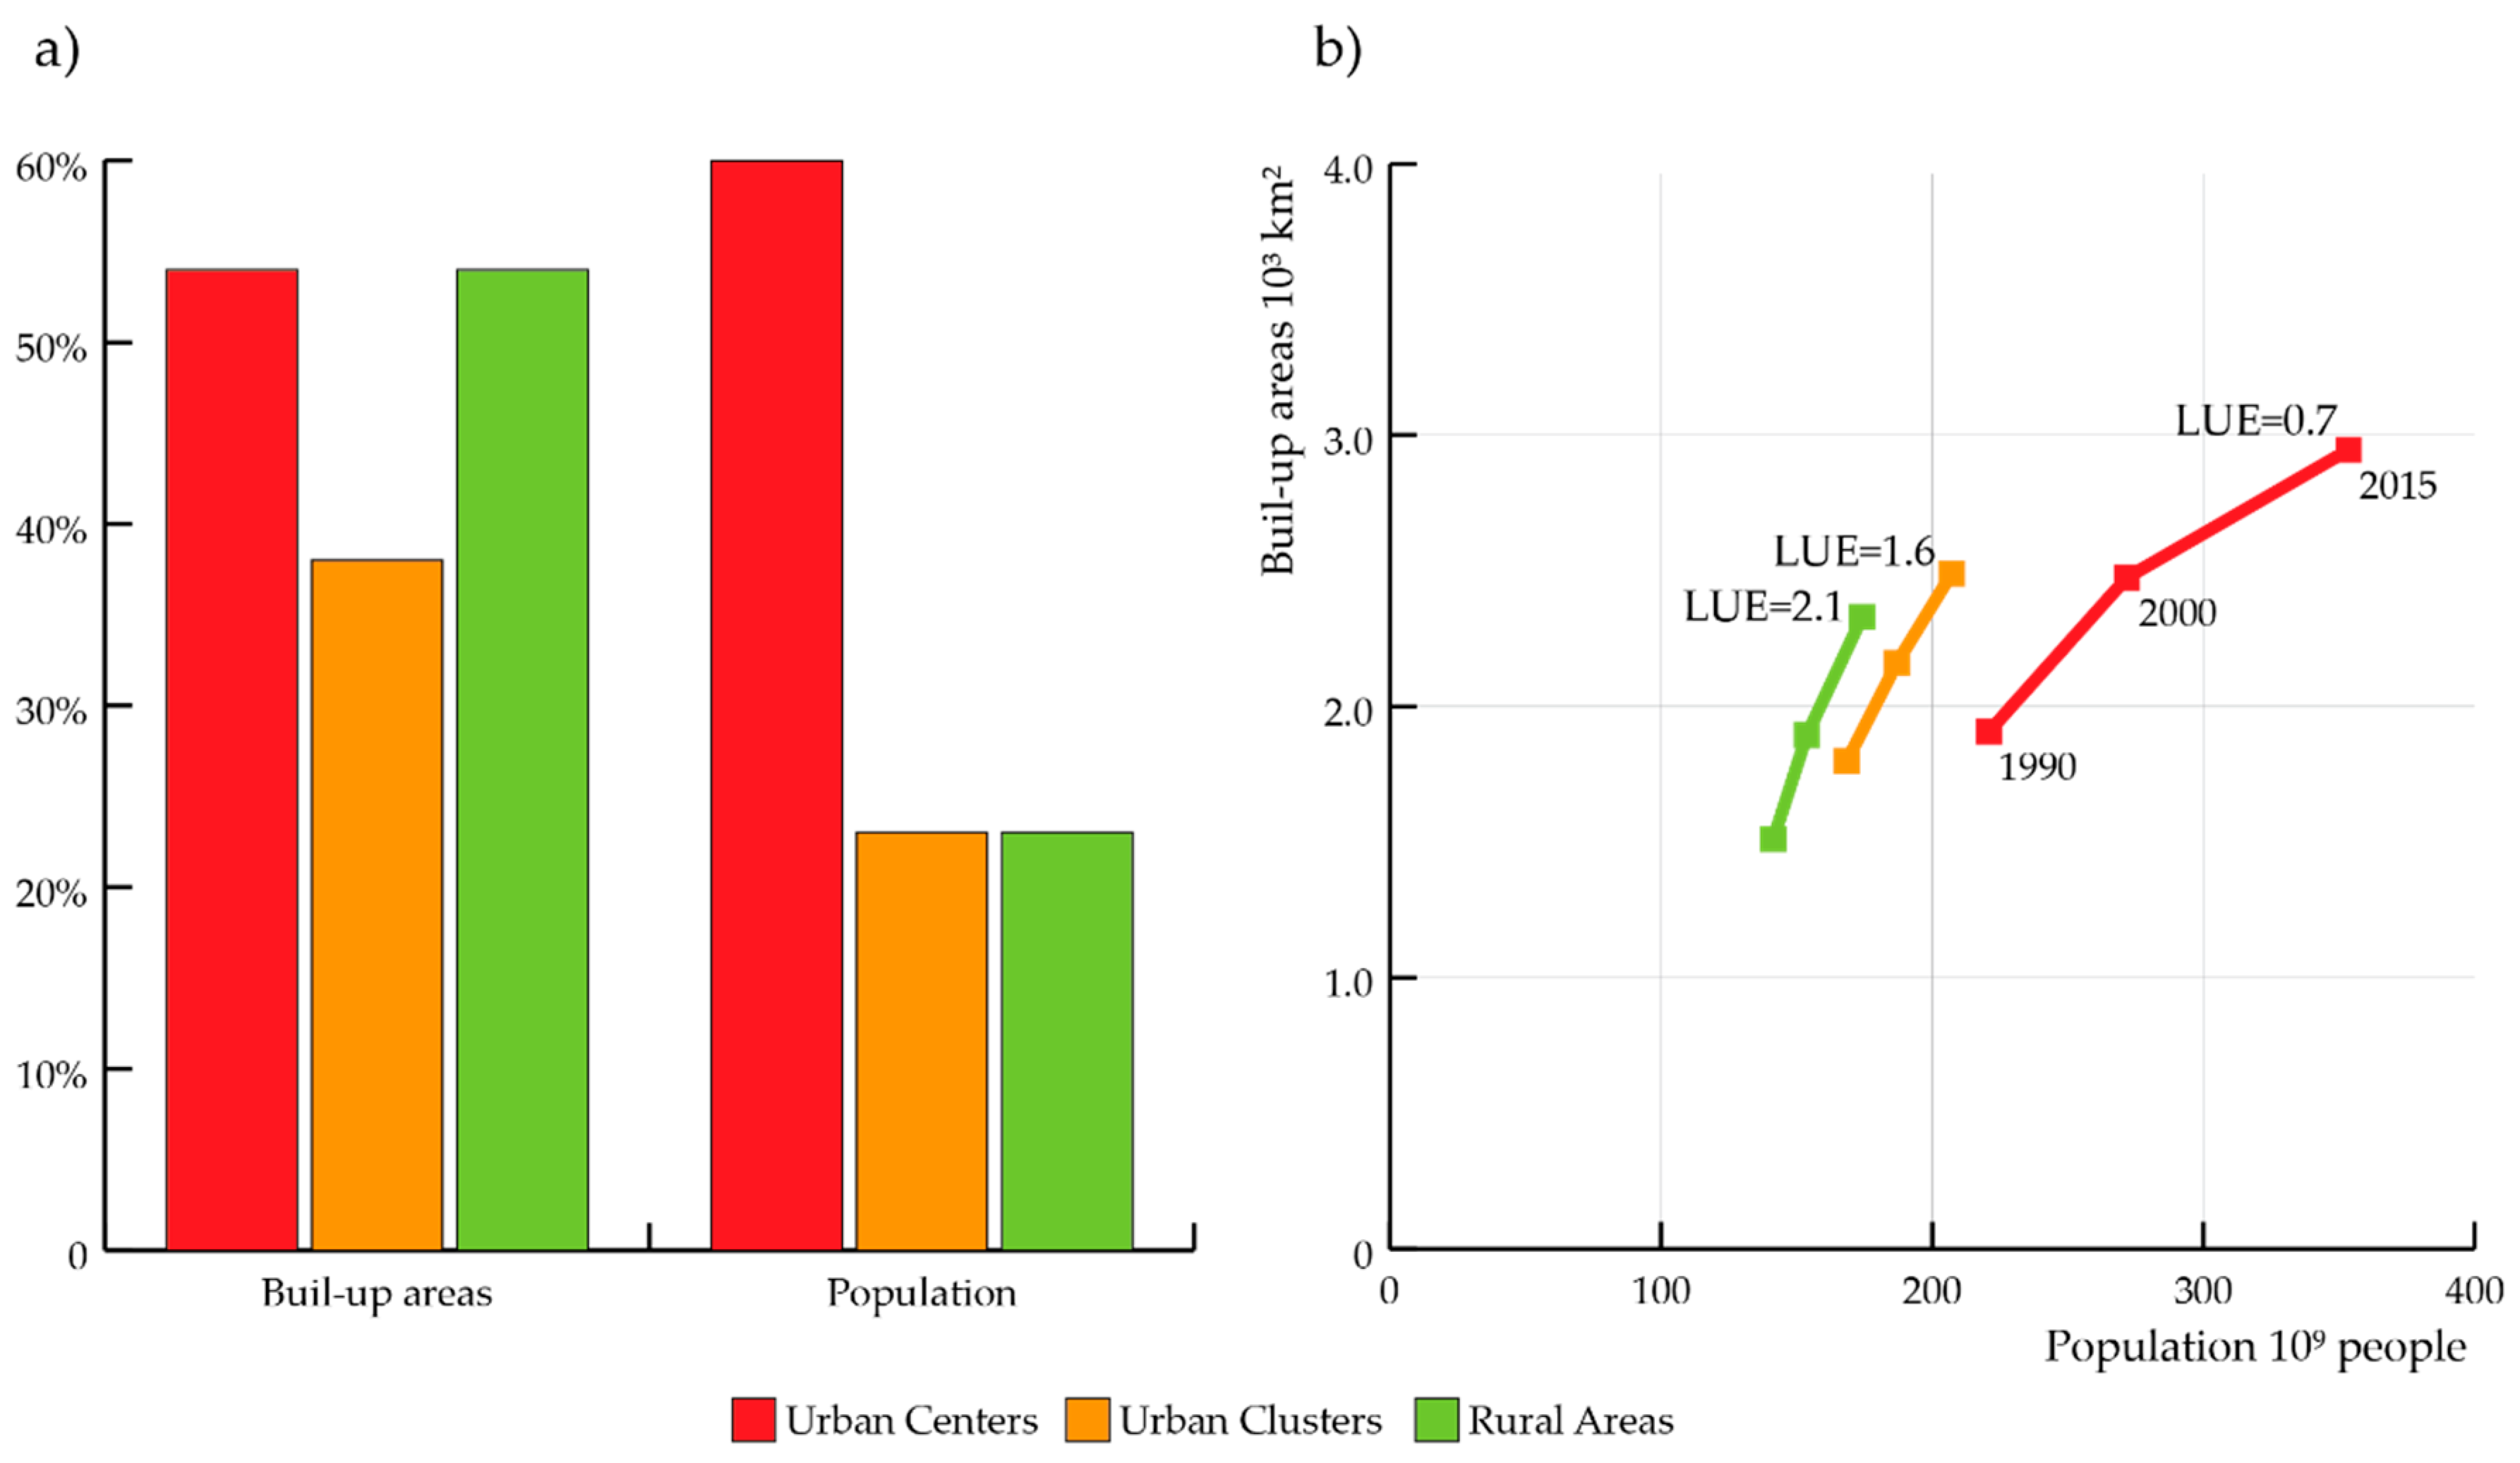
The three main settlement typologies outlined in the Global Definition of Cities and Settlements confirm the consolidated notion of higher efficiency of urban areas [78], in particular regarding the use of land [79]. Between 1990 and 2015, urban centres developed with a LUE of 0.72 expanding over land by 30% and increasing in population by 44%. Regarding urban clusters, we obtained a LUE of 1.57, increasing by half in size and by 34% in population. For rural areas, we calculated a LUE of 1.99 with an expansion over land of 54% and one in population by 23% (Figure 4). Considering a dichotomous classification of settlements (urban vs. rural) by merging urban centres and urban clusters, the LUE value in urban areas between 1990 and 2015 equals 1 (more precisely, 1.05), whereas built-up areas expanded by 47% and population increased by 44%. Also, in this binary class, the LUE value is higher (and above 1) between 1990 and 2000 and lower (below 1) between 2000 and 2015. In addition to that, 65% of global demographic growth and 40% of the spatial expansion of built-up areas took place between 1990 and 2015 in urban centres. However, despite a concentration of more than 30% of the total expansion of built-up area, rural areas have settled about 16% of the new population on Earth from 1990 to 2015. As indicated by trajectories of socio-spatial development (Figure 4), both the demographic profile and spatial extent are diverse for each of the settlement typologies, implying that these develop with different models.
The magnitude of the population increase and spatial expansion is highest in dense urban settings and is lower in urban clusters (towns and suburbs) and rural areas. In 2015, urban centres hosted 1 billion people more than in 1990 and expanded over almost 70,000 km2. In the same period, the population of urban clusters increased by almost 620 million people and expanded over more than 87,000 km2. Population in rural areas increased by almost 350 million people, and the built-up areas expanded by almost 100,000 km2.

3.3. Land Use Efficiency in Urban Centres Per Region of the World 1990–2015

Table 3 shows that the land use efficiency is systematically better (i.e., it has a lower positive LUE value) in urban centres in all regions of the world compared to aggregate national values, implying that centres are consistently more efficient than other settlement typologies within the country. Regional LUE values (1990–2015) in urban centres range between 0.49 (Africa) and 2.51 (Europe), excluding Oceania. In Africa and Latin America and the Caribbean, urban centres expanded, with the lowest positive LUE values (i.e., the highest efficiency in the use of land) of 0.49 in Africa and 0.78 in Latin America and the Caribbean, and both spatial and demographic absolute urban growth were substantial. Urban centres in Latin America and Caribbean centres expanded in surface area by around 50% (+7000 km2) and grew in population by 42% (+105 million people), while urban centres in Africa expanded by 54% in space (+6500 km2), and by almost 90% in population (+ 273 million people). Over the same period, urban centres in Europe accommodated 12 million new people and expanded over 7000 km2 (LUE = 2.5), while centres in Northern America added 38 million new inhabitants and expanded over 13,200 km2 (LUE = 0.9). Overall, only in European urban centres did the spatial expansion prevail over that of population (the only region with an LUE > 1 in urban centres; see Table 3). In Asia, the spatial expansion and population growth occurred at equal rates. The considerations presented in Section 3.1 regarding the higher LUE value in the period 1990–2000 compared to 2000–2015 are valid also for urban centres.

3.4. Land Use Efficiency in 10,000 Urban Centres

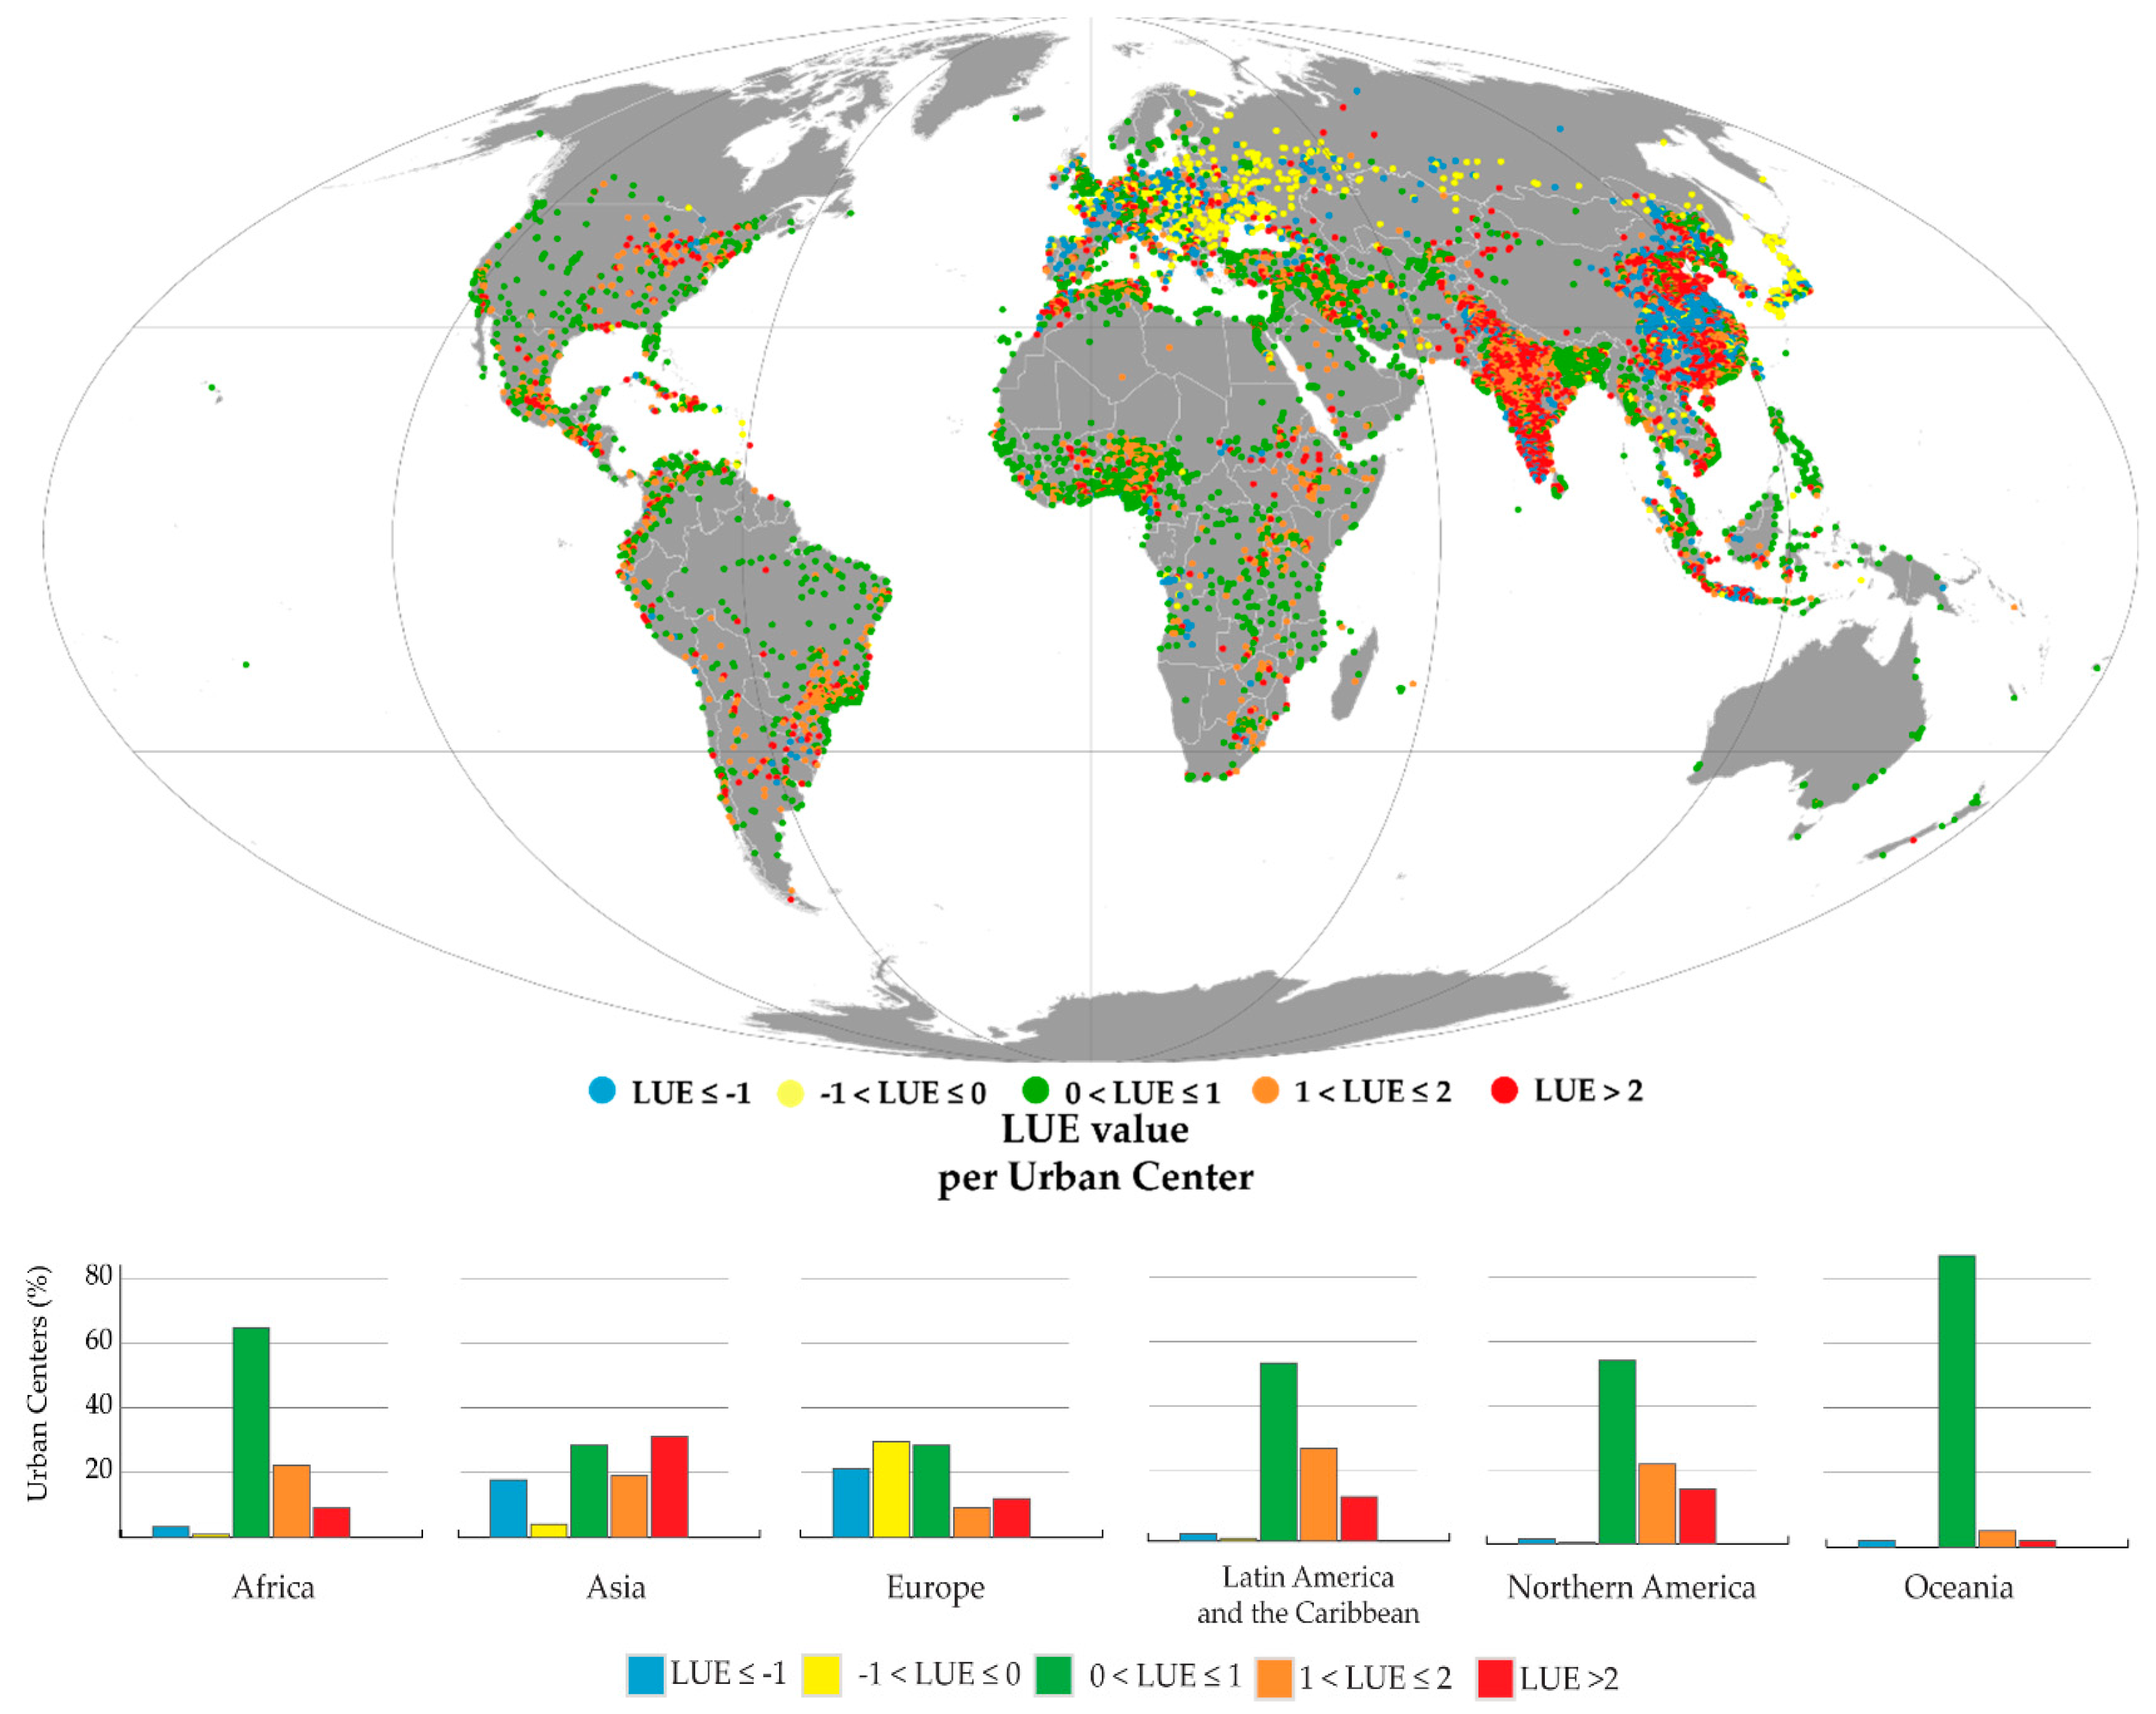
LUE has been estimated for circa 10,000 urban centres, and Figure 5 displays a comprehensive overview of the SDG 11.3.1 quantified with GHSL data over a period of 25 years between 1990 and 2015 [66]. In general, urban centres follow the national tendencies presented in the previous sub-section (cross-country comparisons). It emerges that between 1990 and 2015, 13% of the global centres developed with a substantially negative LUE value (<−1), in particular in countries in central and western Europe, central China and southern India. Values in the range −1 < LUE ≤ 0 are observed for 6% of global centres, with this share reaching 21% in Europe (especially in Eastern Europe and Russia), and 18% in Asia (mainly Japan). The most common LUE class across the globe is that ranging between 0 < LUE ≤ 1 (39% of the centres in the dataset). On a regional basis, this class is representative of 65% of the centres in Africa, of more than half of those in Latin America and the Caribbean, 39% of the centres in Oceania, and almost one-third of those in Asia and Europe. The class 1 < LUE ≤ 2 includes 20% of global centres, but almost one-third of those in Latin America and the Caribbean, one-quarter of those in Northern America, and 22% of those in Africa. The last class (LUE > 2) globally accounts for 22% of the centres, this share increases in Asia, at 31%, especially including centres in India and north-eastern and southern China.
Below, we focus on a subset of these centres in which the LUE was estimated to be in the range of −5.75 – +7.75 (with a 0.25 interval), capturing cities where the rate of spatial expansion exceeds that of population growth by 7 times and others where built-up areas expansion is strong but coupled with sharp population decline. This set includes 7813 urban centres. LUE is a) negative in circa 1250, between 0 and 1 in around 3,400 centres and greater than 1 in some 3,300 urban centres. Most frequent LUE values are classes: 0.25–0.5 (1,077 centres), 0.5–0.75 (944 centres), and 0.75–1 (774 centres). In all these classes, population growth rates were higher than built-up area expansion rates; therefore, population densification occurred.
This broad pattern is partially subject to regional variations. In Europe in particular, the frequency has two peaks: one in the common class of 0.25–0.5 (10% of the centres in the region), but also another one in the class −0.5 to −0.25 (12% of the centres), corresponding to a net decline in population yet with spatial expansion. In Asia, up to 30% of the centres have a LUE value above 2. Grouping average built-up area expansion and population growth in urban centres across regions of the world in four LUE classes (broadly between 0 and 1), it is possible to observe sizable differences.
Percentages of increase demonstrate that the vibrancy of urban expansion in space and population across regions of the world is very different across centres that develop with the same pattern of development (LUE class). Centres in Africa in which the LUE has been between 0.75 and 1 increased in population (on average; see Table 4) by up to seven times more than the centres that developed with same LUE elsewhere. Thus, although centres have developed within similar trajectories, the extent of their growth is substantially heterogeneous. In terms of absolute changes, in fact, centres that developed between 1990 and 2015 in Latin America and the Caribbean with a LUE value between 0.75 and 1 had a land consumption of about 1,100 km2 and accommodated 13.7 million people. Over the same period, centres in Asia expanded in terms of land extent four times more than Latin America (equivalent to 2,600 km2) but accommodated 2.5 times the people (some 55.7 million people).

3.5. Land Use Efficiency Dynamics, Abstract Achieved Densities and Marginal Land Consumption Per New Inhabitant

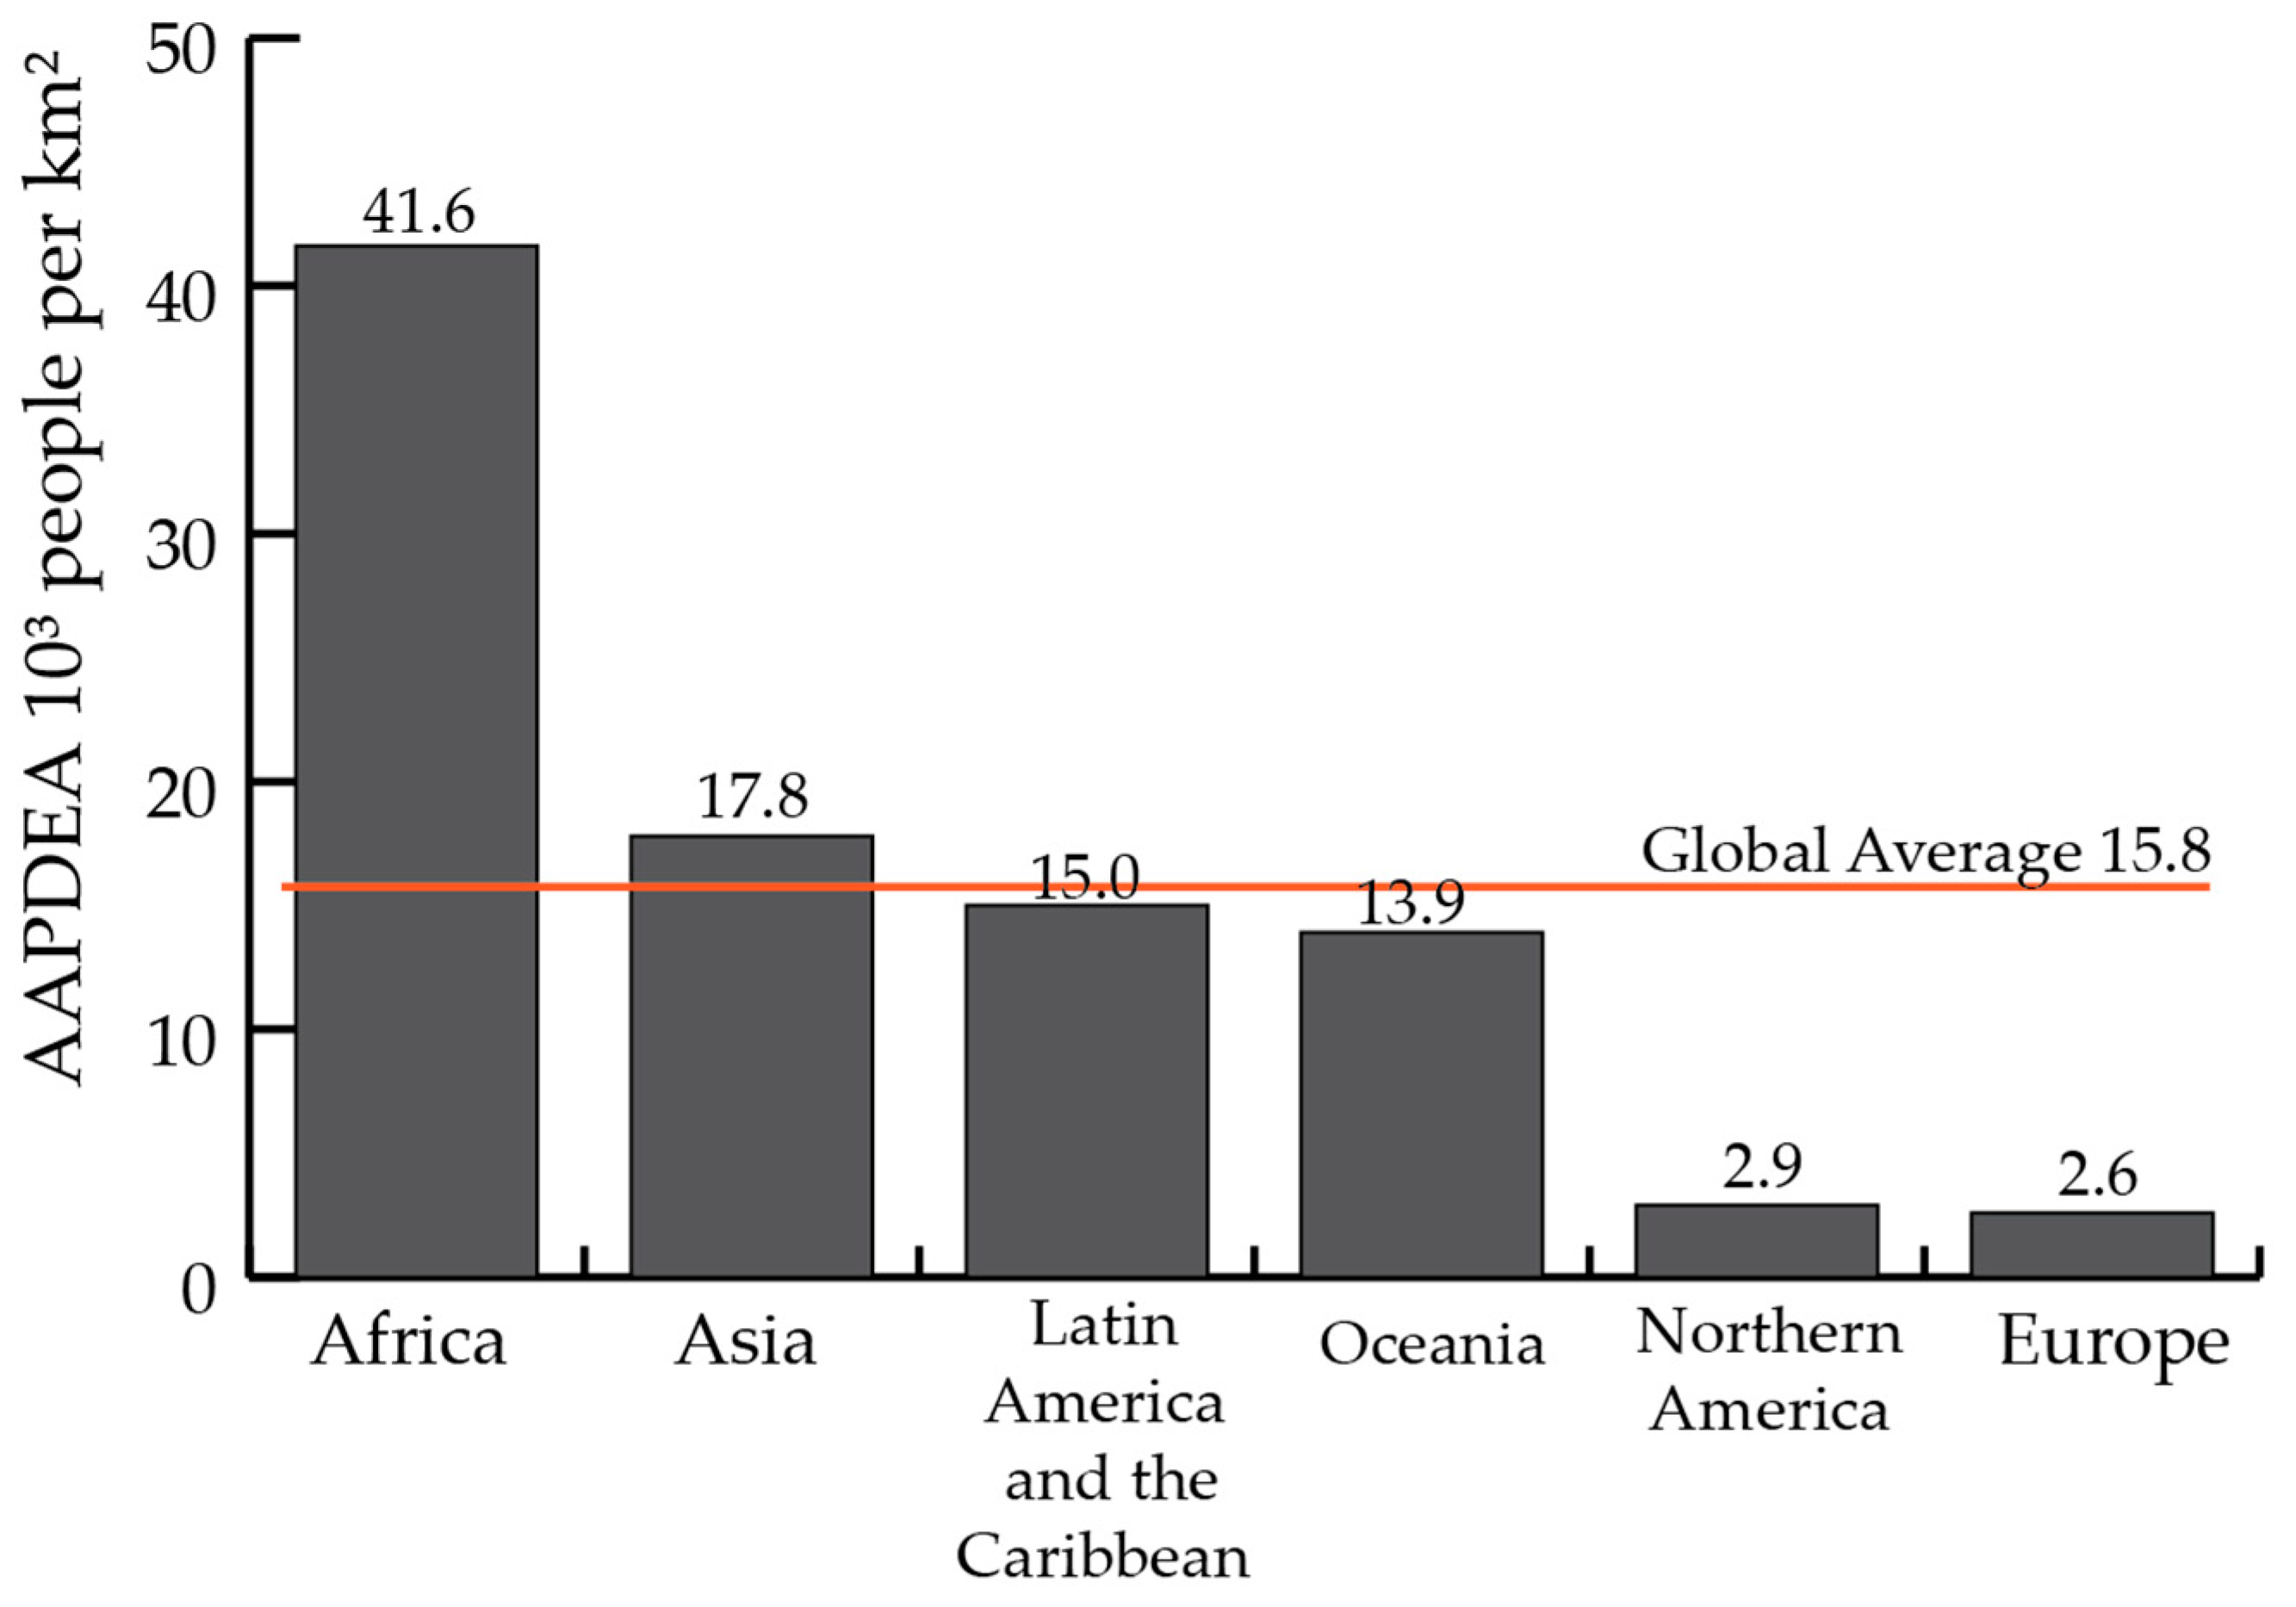
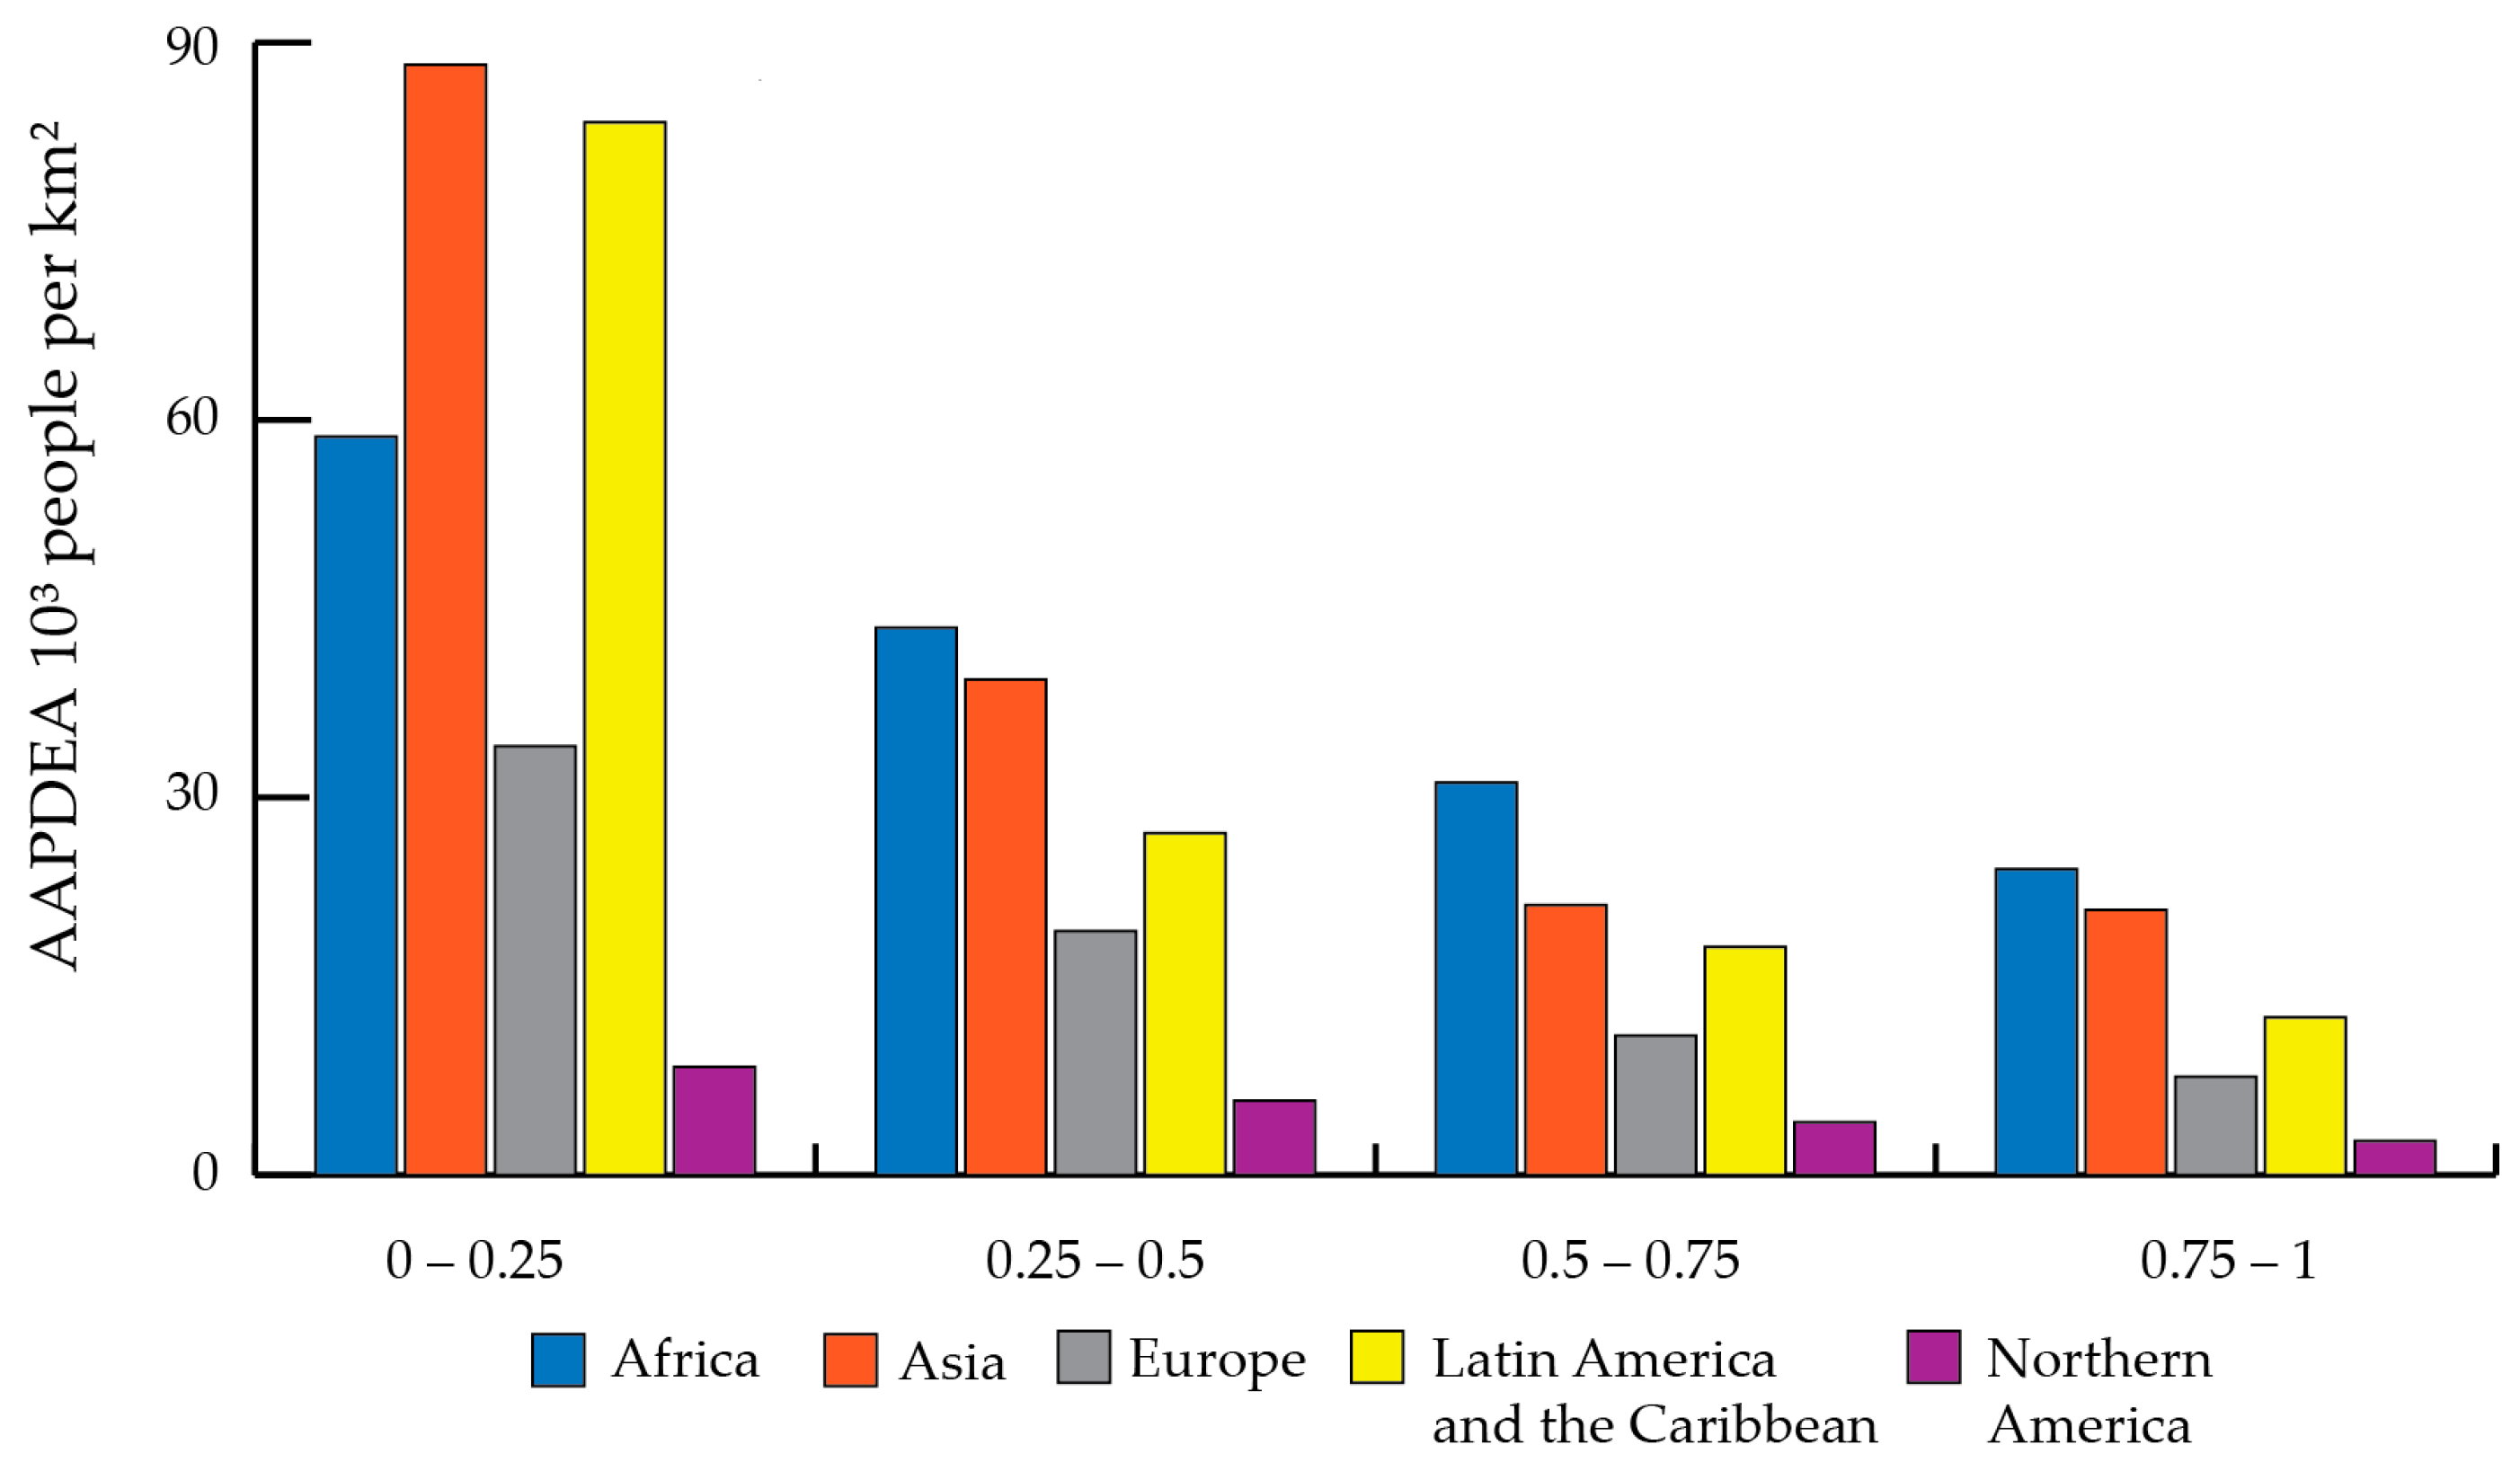
In the previous section, we presented the results of LUE estimation using GHSL data and according to the internationally recognized LUE formulation. Below, we compare these results with the AAPDEA and MLCNI metrics to compare settlement typologies across regions of the world. This is shown by comparing the trajectory of development of urban centres in Northern America to those in Latin America and the Caribbean. In Table 3, the reported LUE values are, respectively, 0.9 and 0.8 in these regions. By the definition of the land use efficiency indicator, the value corresponds to higher efficiency in urban centre expansion in Northern America (with a LUE close above 0 and below 1). However, by quantifying the AAPDEA, in Northern America, for each 1 km2 of built-up expansion of an urban centre, a corresponding average population of 2,870 people was allocated. In Latin America and the Caribbean, for each 1 km2 of built-up area expansion of an urban centre, 15,011 people theoretically settled there (the values for the other regions of the world are reported in Figure 6). This striking difference can also be captured by the MLCNI. In Latin America and the Caribbean, each new inhabitant that settled in urban centres between 1990 and 2015 is associated with a land consumption in the same urban centre of 66.6 m2, while each new inhabitant in Northern America would consume 348.4 m2. These spatially explicit values are the basis of the substantially different total land consumption in the regions, where for the almost 38 million new inhabitants of urban centres in Northern America, an overall 13,200 km2 of land was consumed. In Latin America, a population increase of 105 million people corresponded to an expansion of 7000 km2. Additionally, considering the trajectories of development in selected LUE classes as outlined in Section 3.4, substantial differences are reported (Figure 7). In the case of the development trajectory at LUE values between 0.75 and 1, AAPDEA values indicate that for each 1 km2 of built-up expansion of urban centre in Asia, approximately 21,000 people were settled, whereas in Latin America and the Caribbean, this density value is halved, at 12,500 people.
Similar considerations hold for other and more land-efficient development trajectories (towards the 0–0.25 class) as displayed in Figure 7: within the same classes of LUE values, AAPDEA is subject to substantial differences across regions. By the definition of LUE, abstract densities grow towards lower LUE values, but across regions of the world, the achieved densities within the same LUE class vary significantly. The least land-use-efficient development trajectories (considered in this subset of LUE values ranging between 0.75–1) of urban centres in Europe (7,800 inhabitants per km2 of built-up area of expansion) are almost as dense as most efficient development paths (LUE span 0–0.25) in Northern America (8,500 inhabitants per km2 of built-up area of expansion). Similarly, the least efficient development in urban centres in Africa (almost 25,000 inhabitants per km2 of built-up area of expansion) are twice as dense as the newly built-up areas in urban centres in Latin America and the Caribbean (12,000 inhabitants per km2 of built-up area of expansion). The highest AAPDEA values are reached in Asia and Latin America and the Caribbean (in the class of the highest land use efficiency), where, respectively, more than 88,000 and 83,500 inhabitants are modelled for each new km2 of built-up area of expansion.

3.6. Land Use Efficiency Dynamics and Spatially Explicit Metrics

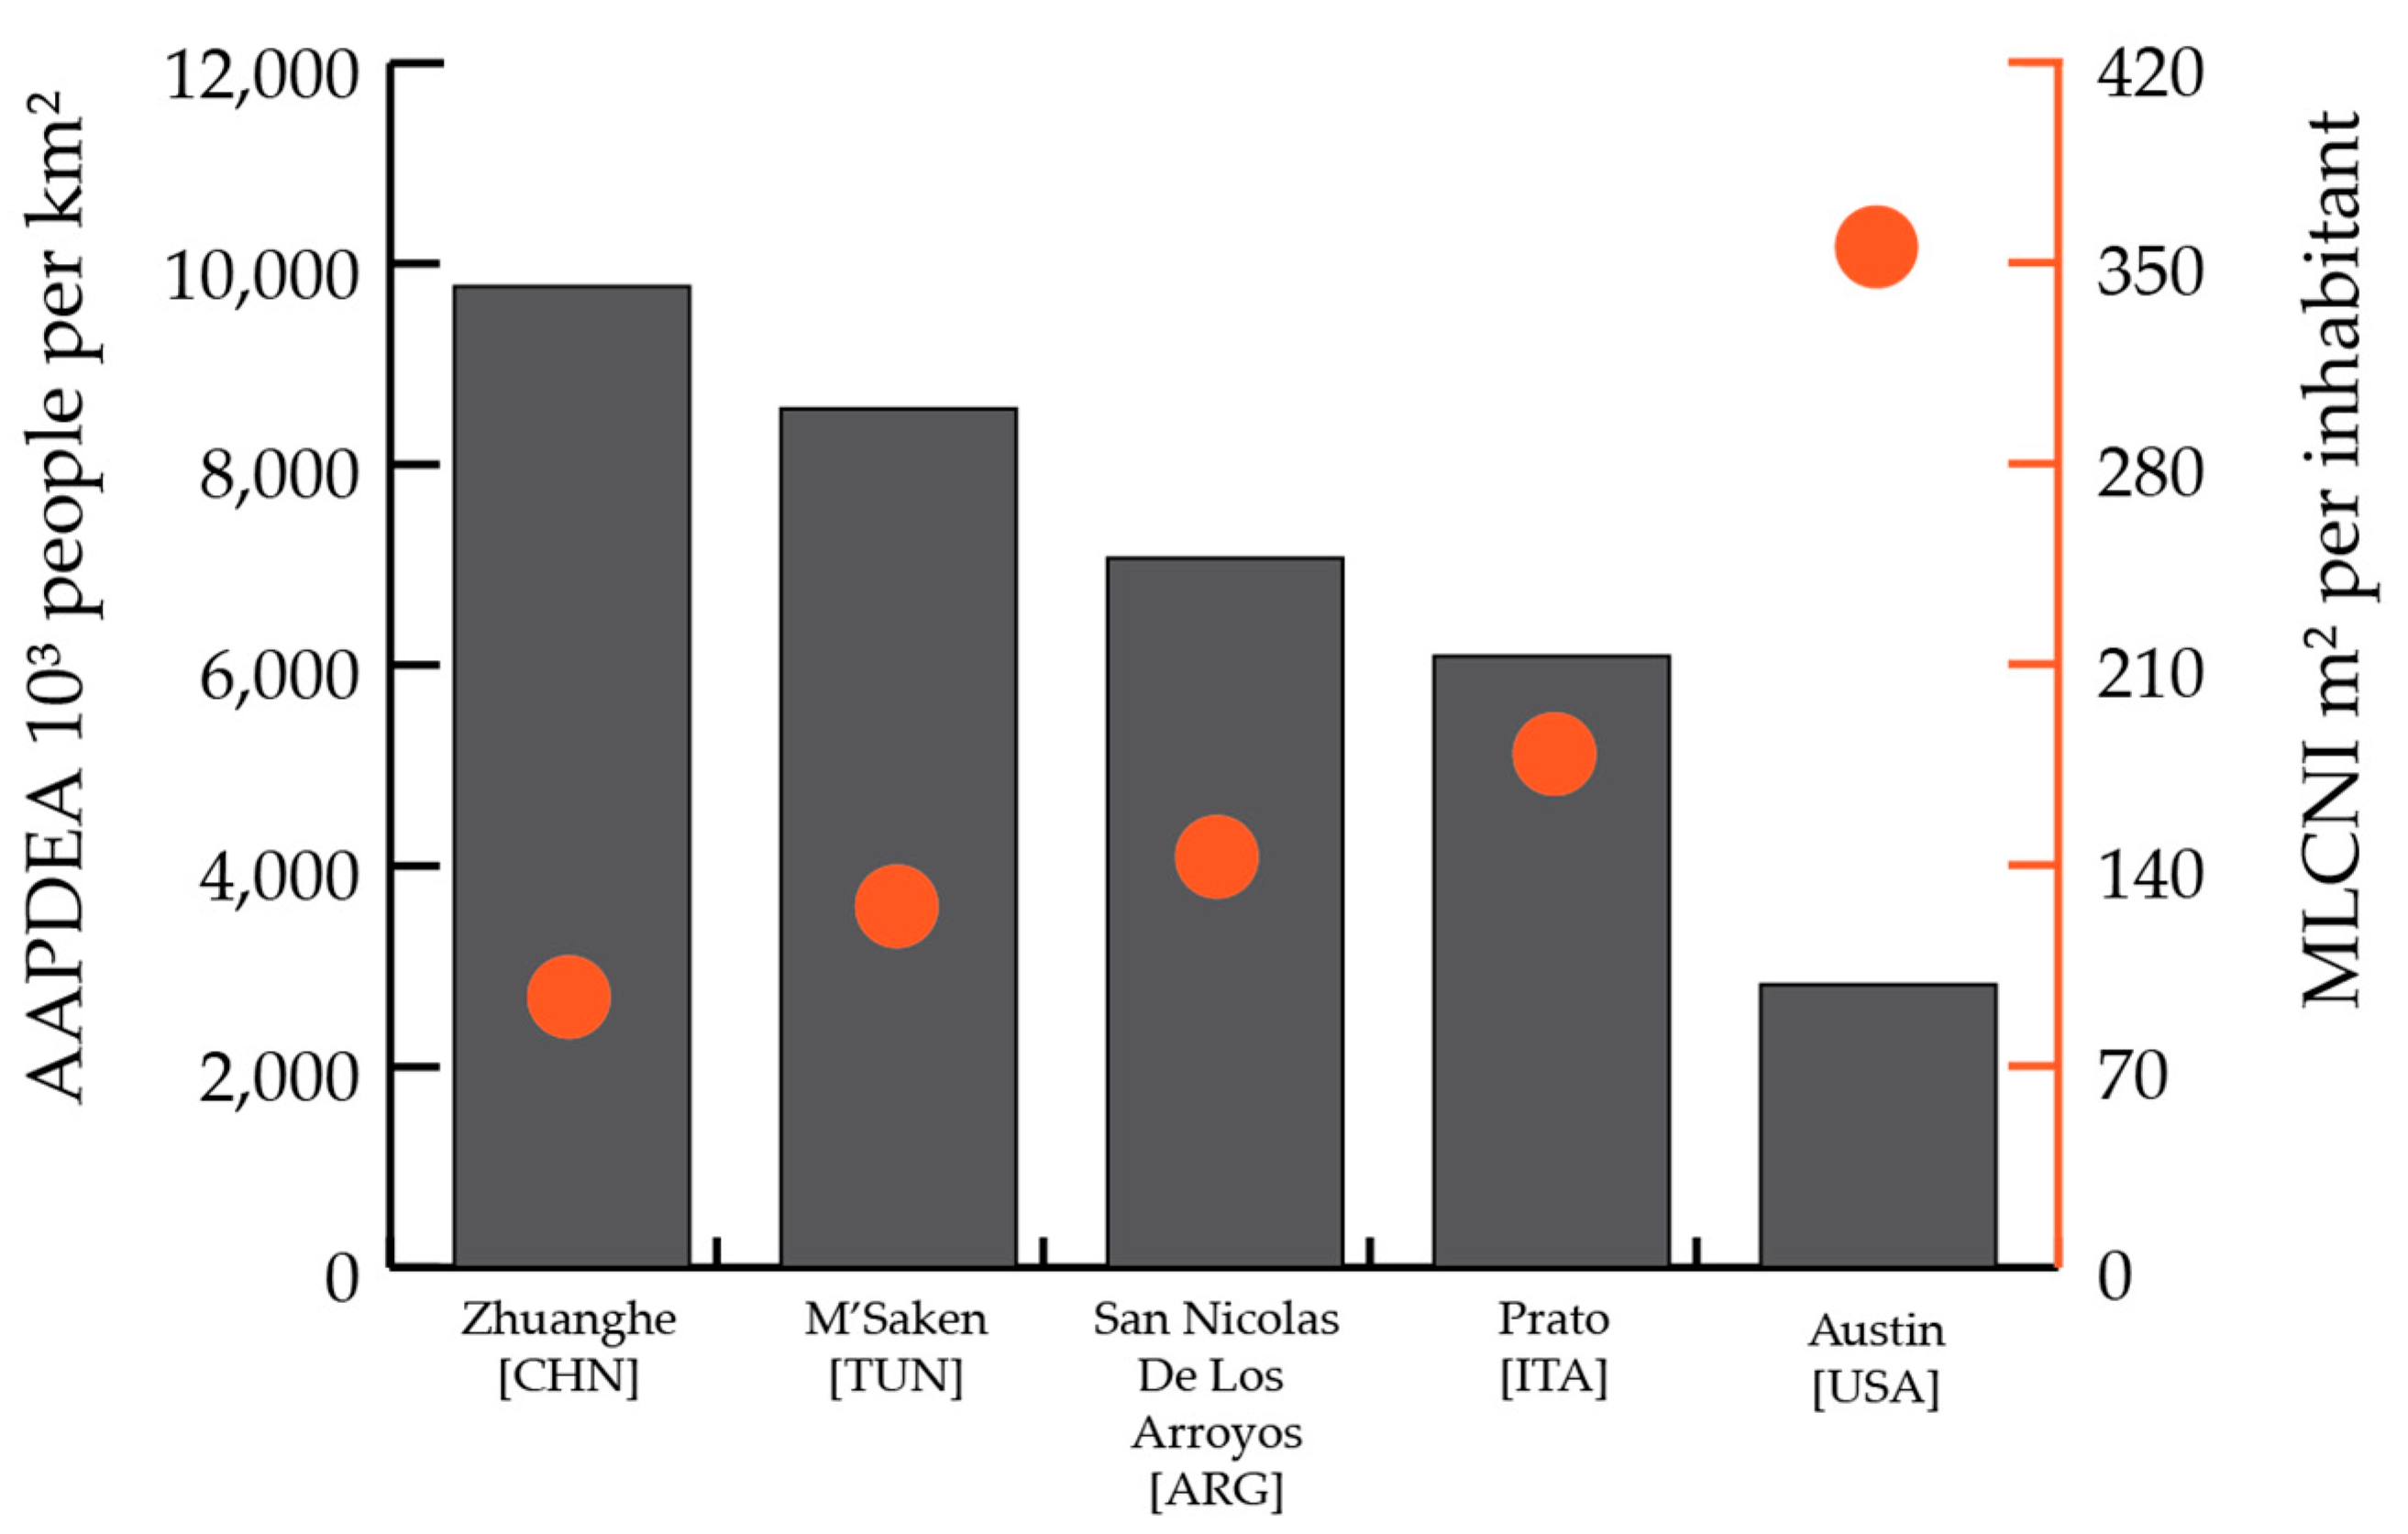
Figure 7 shows the high variability of AAPDEA and MLCNI within homogeneous LUE classes. To highlight this nature of the LUE indicator in the internationally agreed formulation, we selected five urban centres with the same LUE value (equal to 1) in different geographical regions, namely M’Saken (Tunisia), Zhuanghe (China), Prato (Italy), San Nicolas De Los Arroyos (Argentina), and Austin (United States of America) (Table 5). To preserve the regional coverage and the LUE value comparability, the size of cities (population in 2015) varies (Austin, 1 million people; and M’Saken, 65,000 people) and also the relative change of population and spatial expansion between 1990 and 2015 are heterogeneous. This characteristics of the selected cities may in fact reinforce the experiment in displaying how settlements with different sizes perform in terms of estimated LUE. A development trajectory with LUE = 1 implies a constant built-up area per capita and population density across epochs, accordingly the MLCNI and AAPDEA values. Therefore, each settled new inhabitant is related to a land consumption equal to the built-up area per capita of the inhabitants of the urban centres at the initial year, and each km2 of newly detected built-up area corresponds to the same population (density) of the existing urban centre (same population density). Accordingly, it can be argued that the selected cities maintained a constant pattern of spatial and demographic development, developing with a fully path-dependent trajectory. However, as for the five cities developed with LUE = 1, the sole LUE indicator proves ineffective in capturing the actual differences across urban centres (in spatially explicit terms, therefore in absolute land consumption). MLCNI values for these centres show that each new inhabitant in Zhuanghe (China) is related to a land consumption of around 100 m2, which is almost 30% less than that of a new inhabitant of San Nicolas De Los Arroyos (Argentina), almost 40% less that of a new inhabitant of Prato (Italy), or one-third of the space consumed by each new inhabitant of Austin (United States of America, consuming more than 355 m2). Similarly, the abstract compactness of expansion areas—the efficiency in the use of land to settle people (AAPDEA)—is substantially diverse (Figure 8). Austin settled fewer than 3000 people in each km2 of built-up area expansion, Prato settled about 6000, San Nicolas De Los Arroyos about 7000 and M’Saken about 8500, while Zhuanghe accommodated almost 9800 people.

4. Discussion

The results of our analysis have characterized, by means of the LUE indicator, the trajectories of the development of human settlements in space and demographic terms between 1990 and 2015 across multiple spatial scales using GHSL data. In the following paragraphs, we discuss the results of our research with respect to three critical instances in the estimation of LUE: LUE value variation according to the population size class and built-up area density of the city (in Section 4.1), the effects of the comparison between dimensionless versus spatially explicit LUE metrics and proxies (Section 4.2), and the semantics and generalization of the estimation of SDG 11.3.1 with GHSL data (Section 4.3).

4.1. Population Size and Built-Up Area Density Effects of LUE of Cities

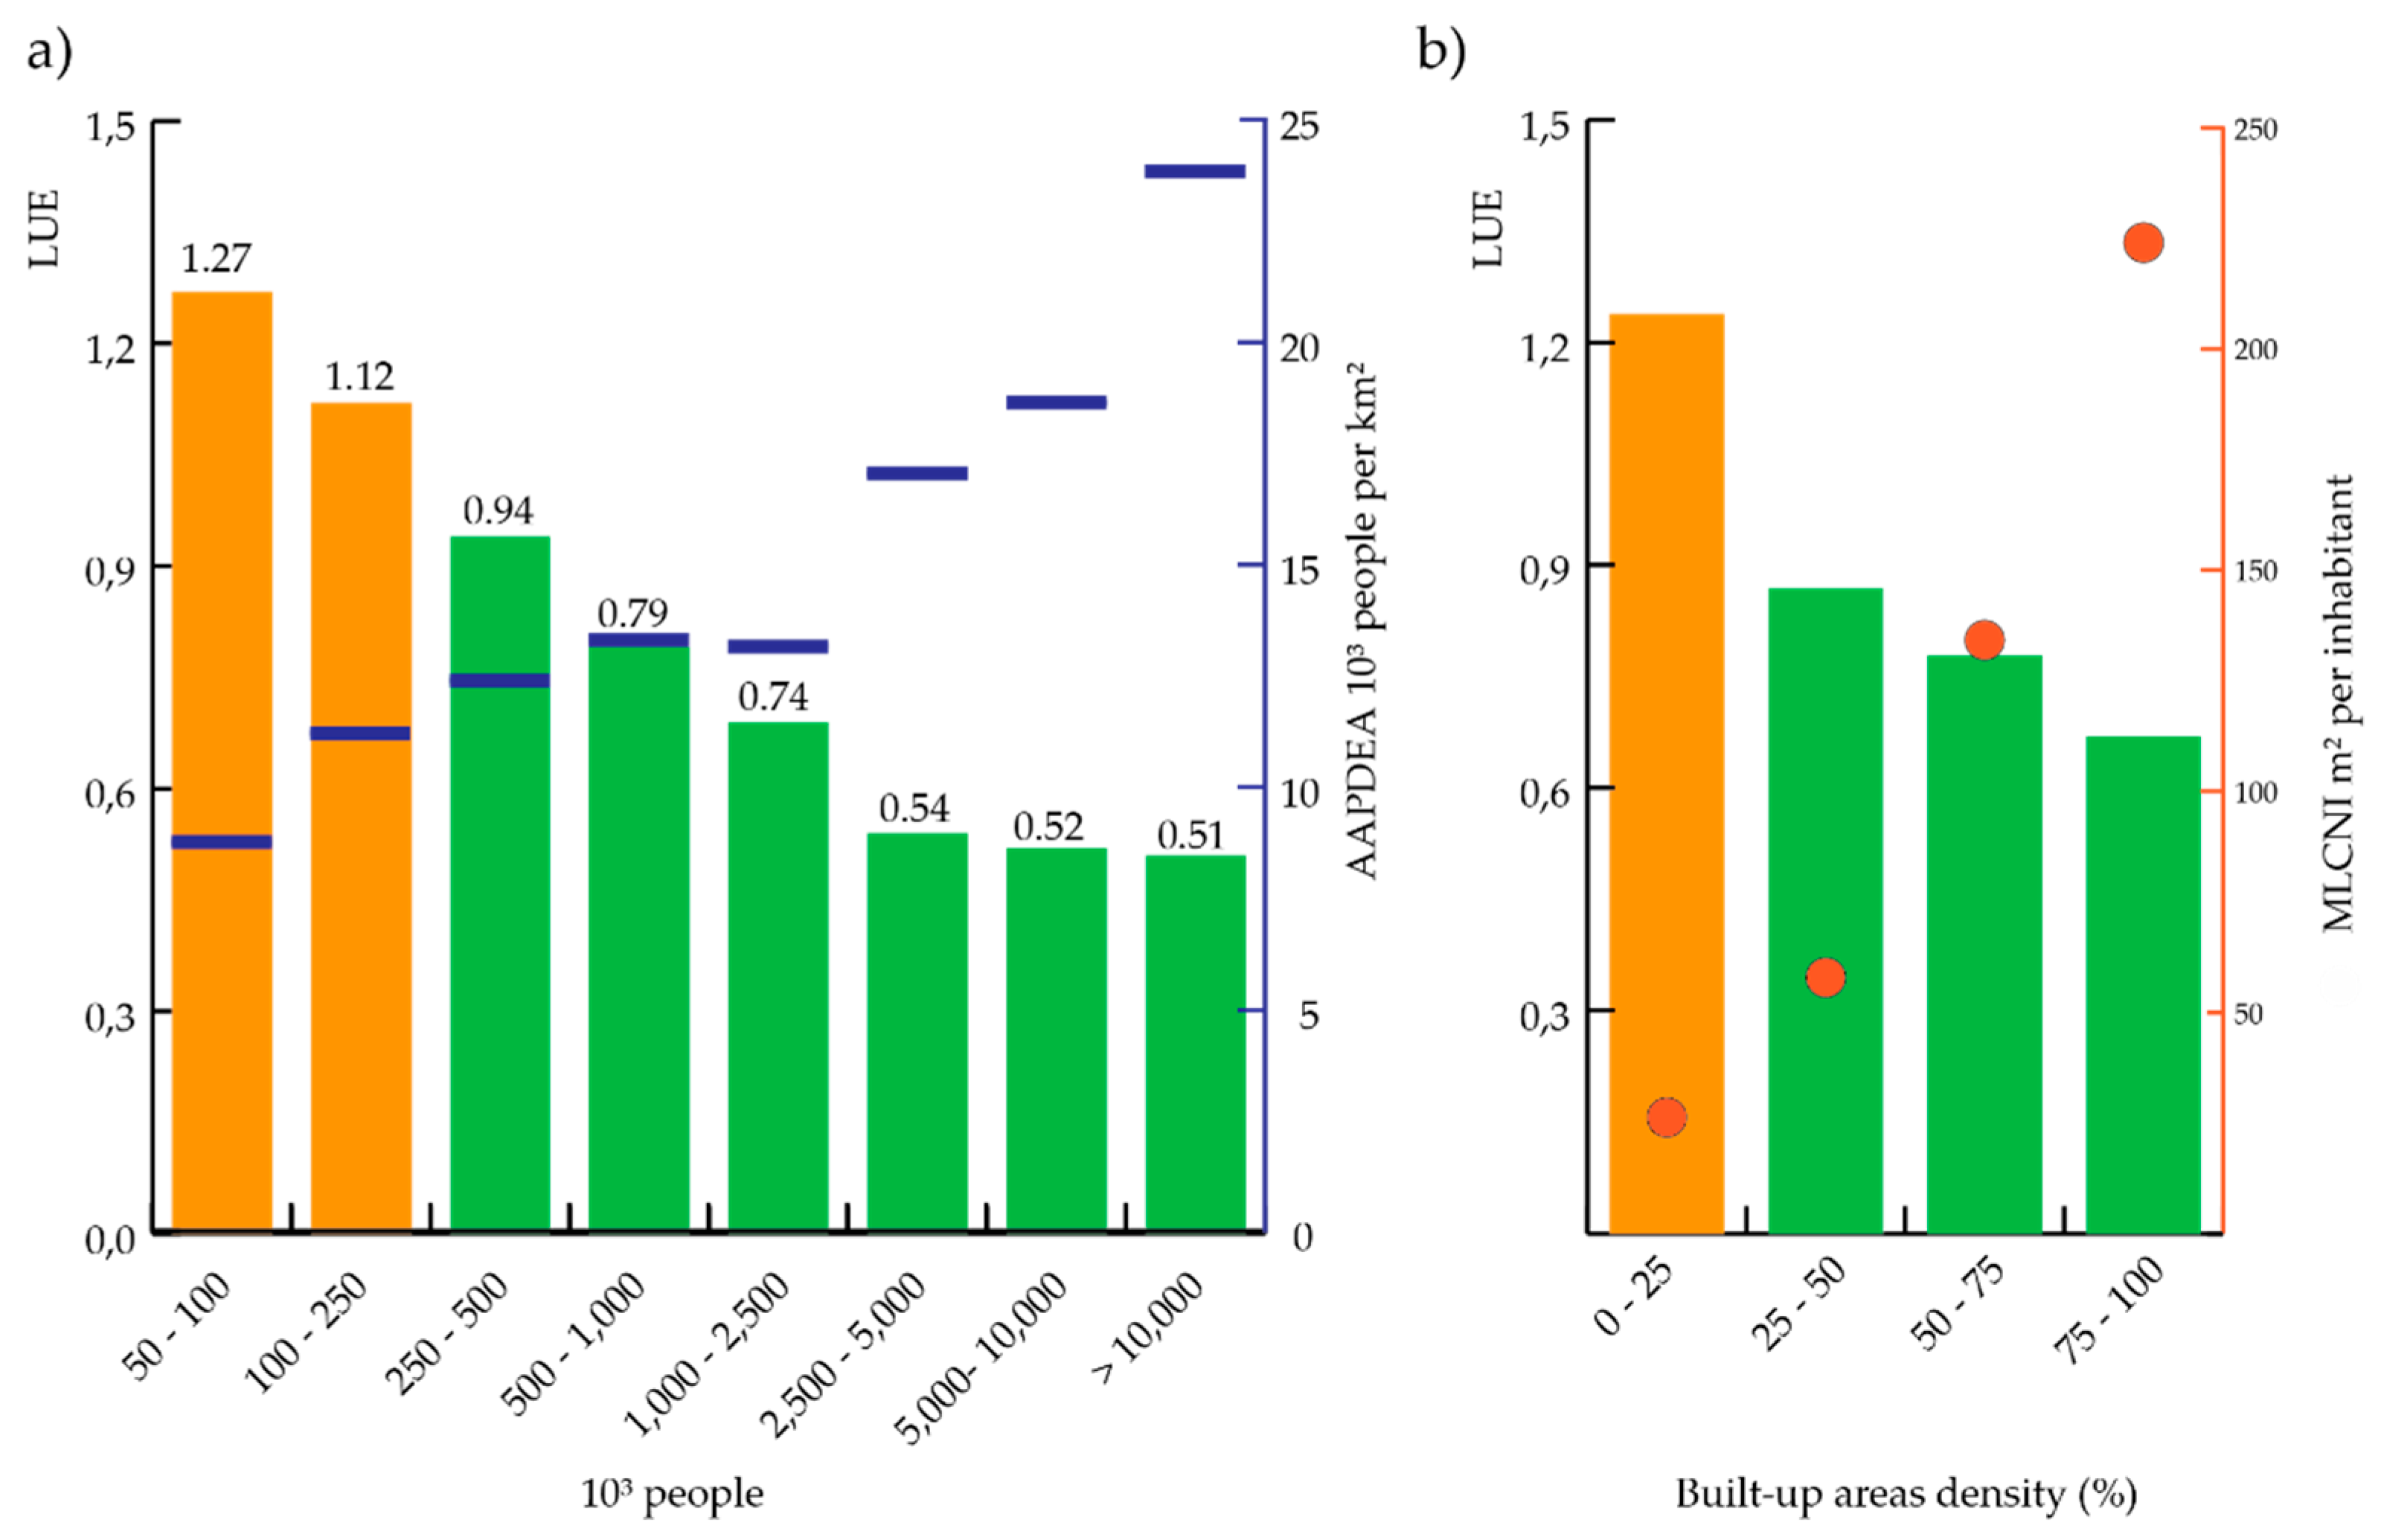
In Section 3.2, it was noted that efficiency in the use of land increased from rural areas (LUE = 2.1) to urban clusters (LUE = 1.6) and urban centres (LUE = 0.7). Below, we present the LUE values of urban centres with different population sizes between 1990 and 2015. Figure 9 displays a clear pattern of LUE value reduction with increasing urban centre population size. Under this trajectory, efficiency in the use of land is lower in smaller settlements compared to that of large urban centres. A LUE > 1 is only observed in small and medium-size urban centres (with a population between 50 and 250 thousand inhabitants), while in all other size classes, the relationship PGR > LCR holds (LUE < 1). Additionally, considering the AAPDEA between 1990 and 2015, it emerges that the population density per unit of built-up area expansion in small centres is one-third that of megacities (about 8,700 people per km2). In megacities in 2015 (urban centres with a population of at least 10 million people), each 1 km2 of built-up area added since 1990 added a population exceeding 23,000 people. Half of these densities are estimated in centres with a size between 500,000 and 2,500,000 people. It is also interesting to note that while the LUE in centres of population classes above 2,500,000 inhabitants is rather stable (around 0.5), the population density in areas of expansion vary between 17,000 and more than 23,000 people per km2.
LUE and MLCNI also vary considerably depending on the average density of built-up areas of urban centres in 2015. Figure 9 (b) shows the decrease of the LUE value from 1.24 (density <25%) to 0.68 (density >75%) with the increase of the built-up area density (in bins of 25%). Only in the first density class (0–25%) is the ratio of the land consumption rate to population growth rate greater than 1 (LCR > PGR). In the remaining three classes, the LUE is below 1 (PGR > LCR). In the area of highest built-up density, the LUE value is one-third that of centres with a density of built-up areas below 25%. Additionally, the MLCNI varies significantly by density class. It is the highest in the class of highest density, in which about 220 m2 of new built-up area is related to each new inhabitant, and it declines to a value as low as 26 m2 in the lowest-density area. This phenomenon could be related to a path dependency effect. As highlighted in [80], this can be also related to differences in built-up area per capita in the initial year. This result points out that in settlements in which built-up area density is low (although, by definition, an urban centre has a population of at least 50,000 people), each new inhabitant is related to a land consumption of 26 m2, and this corresponds to a LUE > 1. However, in centres with a higher density of built-up area, each new inhabitant is related to a land consumption exceeding 200 m2, with an LUE <1. Even if this behaviour is fully in line with the mathematical formulation of the SDG 11.3.1, some concerns about inequality may arise in the interpretation of the LUE value. In fact, urban centres in which inhabitants relate to a higher MLCNI are rewarded with an LUE <1 (corresponding to a higher perceived efficiency in the use of land compared to the past). It is understood that this is due to the reduction in the built-up area per capita of the new inhabitants (compared to the resident population of the centre in 1990), although dwellers in worse-off centres are labelled with an inefficient LUE value even if they are probably improving their living conditions.

4.2. Land Use Efficiency Monitoring and Path Dependency

The second finding of relevance focuses on the interdependence between AAPDEA/MLCNI and LUE and on the fact that these two metrics significantly support the interpretation of LUE as insufficient for comparing development trajectories. As noted in Section 3.5, an efficient trajectory of development in one urban centre (0 < LUE < 1) might be associated with a substantially higher MLCNI (and lower AAPDEA) compared to the same LUE values in other spatial units. To demonstrate this limitation, we presented the development trajectory of the Americas (Northern America with a LUE = 0.9, and Latin America and the Caribbean with a LUE = 0.8). Here, we want to simulate the resulting total consumption of land due to the spatial expansion of urban centres if Latin America and the Caribbean countries developed with a lower LUE value (than that of Northern America) at the corresponding MLCNI values of Northern America (348.4 m2 per each new inhabitant). In practice, we scale the absolute population change of urban centres in Latin America and the Caribbean and we multiply that by the MLCNI of Northern America. Therefore, we demonstrate that even if Northern American centres developed with a lower LUE value (0.8), this does not necessarily imply a wiser development trajectory. If, for each of the 105 million new inhabitants of urban centres in Latin America and Caribbean, these centres expanded by 348.4 m2, the spatial expansion of settlements would have exceeded 36,000 km2, equivalent to five times the land that has been actually consumed (according to GHSL estimates). On the contrary, if we apply to Northern America the same absolute population change as the Latin American and the Caribbean MLCNI, we see that urban centres would have consumed less than 20% of the 13,000 km2 over which they actually expanded. According to this abstract but meaningful scaling, it is argued that LUE values should be supported by spatially explicit metrics such as MLCNI (a land consumption per capita) or AAPDEA (a proxy for urban densification). In principle, AAPDEA could be more significant for cases of substantial spatial and demographic change or low LUE values, as a proxy of achieved densities, while the MLCNI value would be useful for more mature countries in which population growth is limited and spatial expansion takes place at faster rates.
Further explaining the relative significance of LUE values, we also argue that the proposed indicator quantifies the efficiency of new development, anchoring it to past development trajectories, as in path dependency theory [81]. Path dependency is well explained by the example of the Americas mentioned above and by other ones mentioned in the comparison of urban centres in Section 3.5. The selected cities were all equally efficient according to LUE, and in all of them, the rate of land consumption has been as intense as the population growth rate. New inhabitants imply a land take equal to the built-up area per capita of the initial year, reiterating the same relationship between people and space in the new development. The spatial units with a high MLCNI consumed remarkably more land to settle the same people than spatial units with a higher AAPDEA, but this spatially explicit phenomenon is hidden in the LUE formulation, allowing spatial units with different AAPDEA or MLCNI values to display the same land use efficiency value.

4.3. Levels of Abstraction, Semantics and Generalizations to Estimate LUE with GHSL

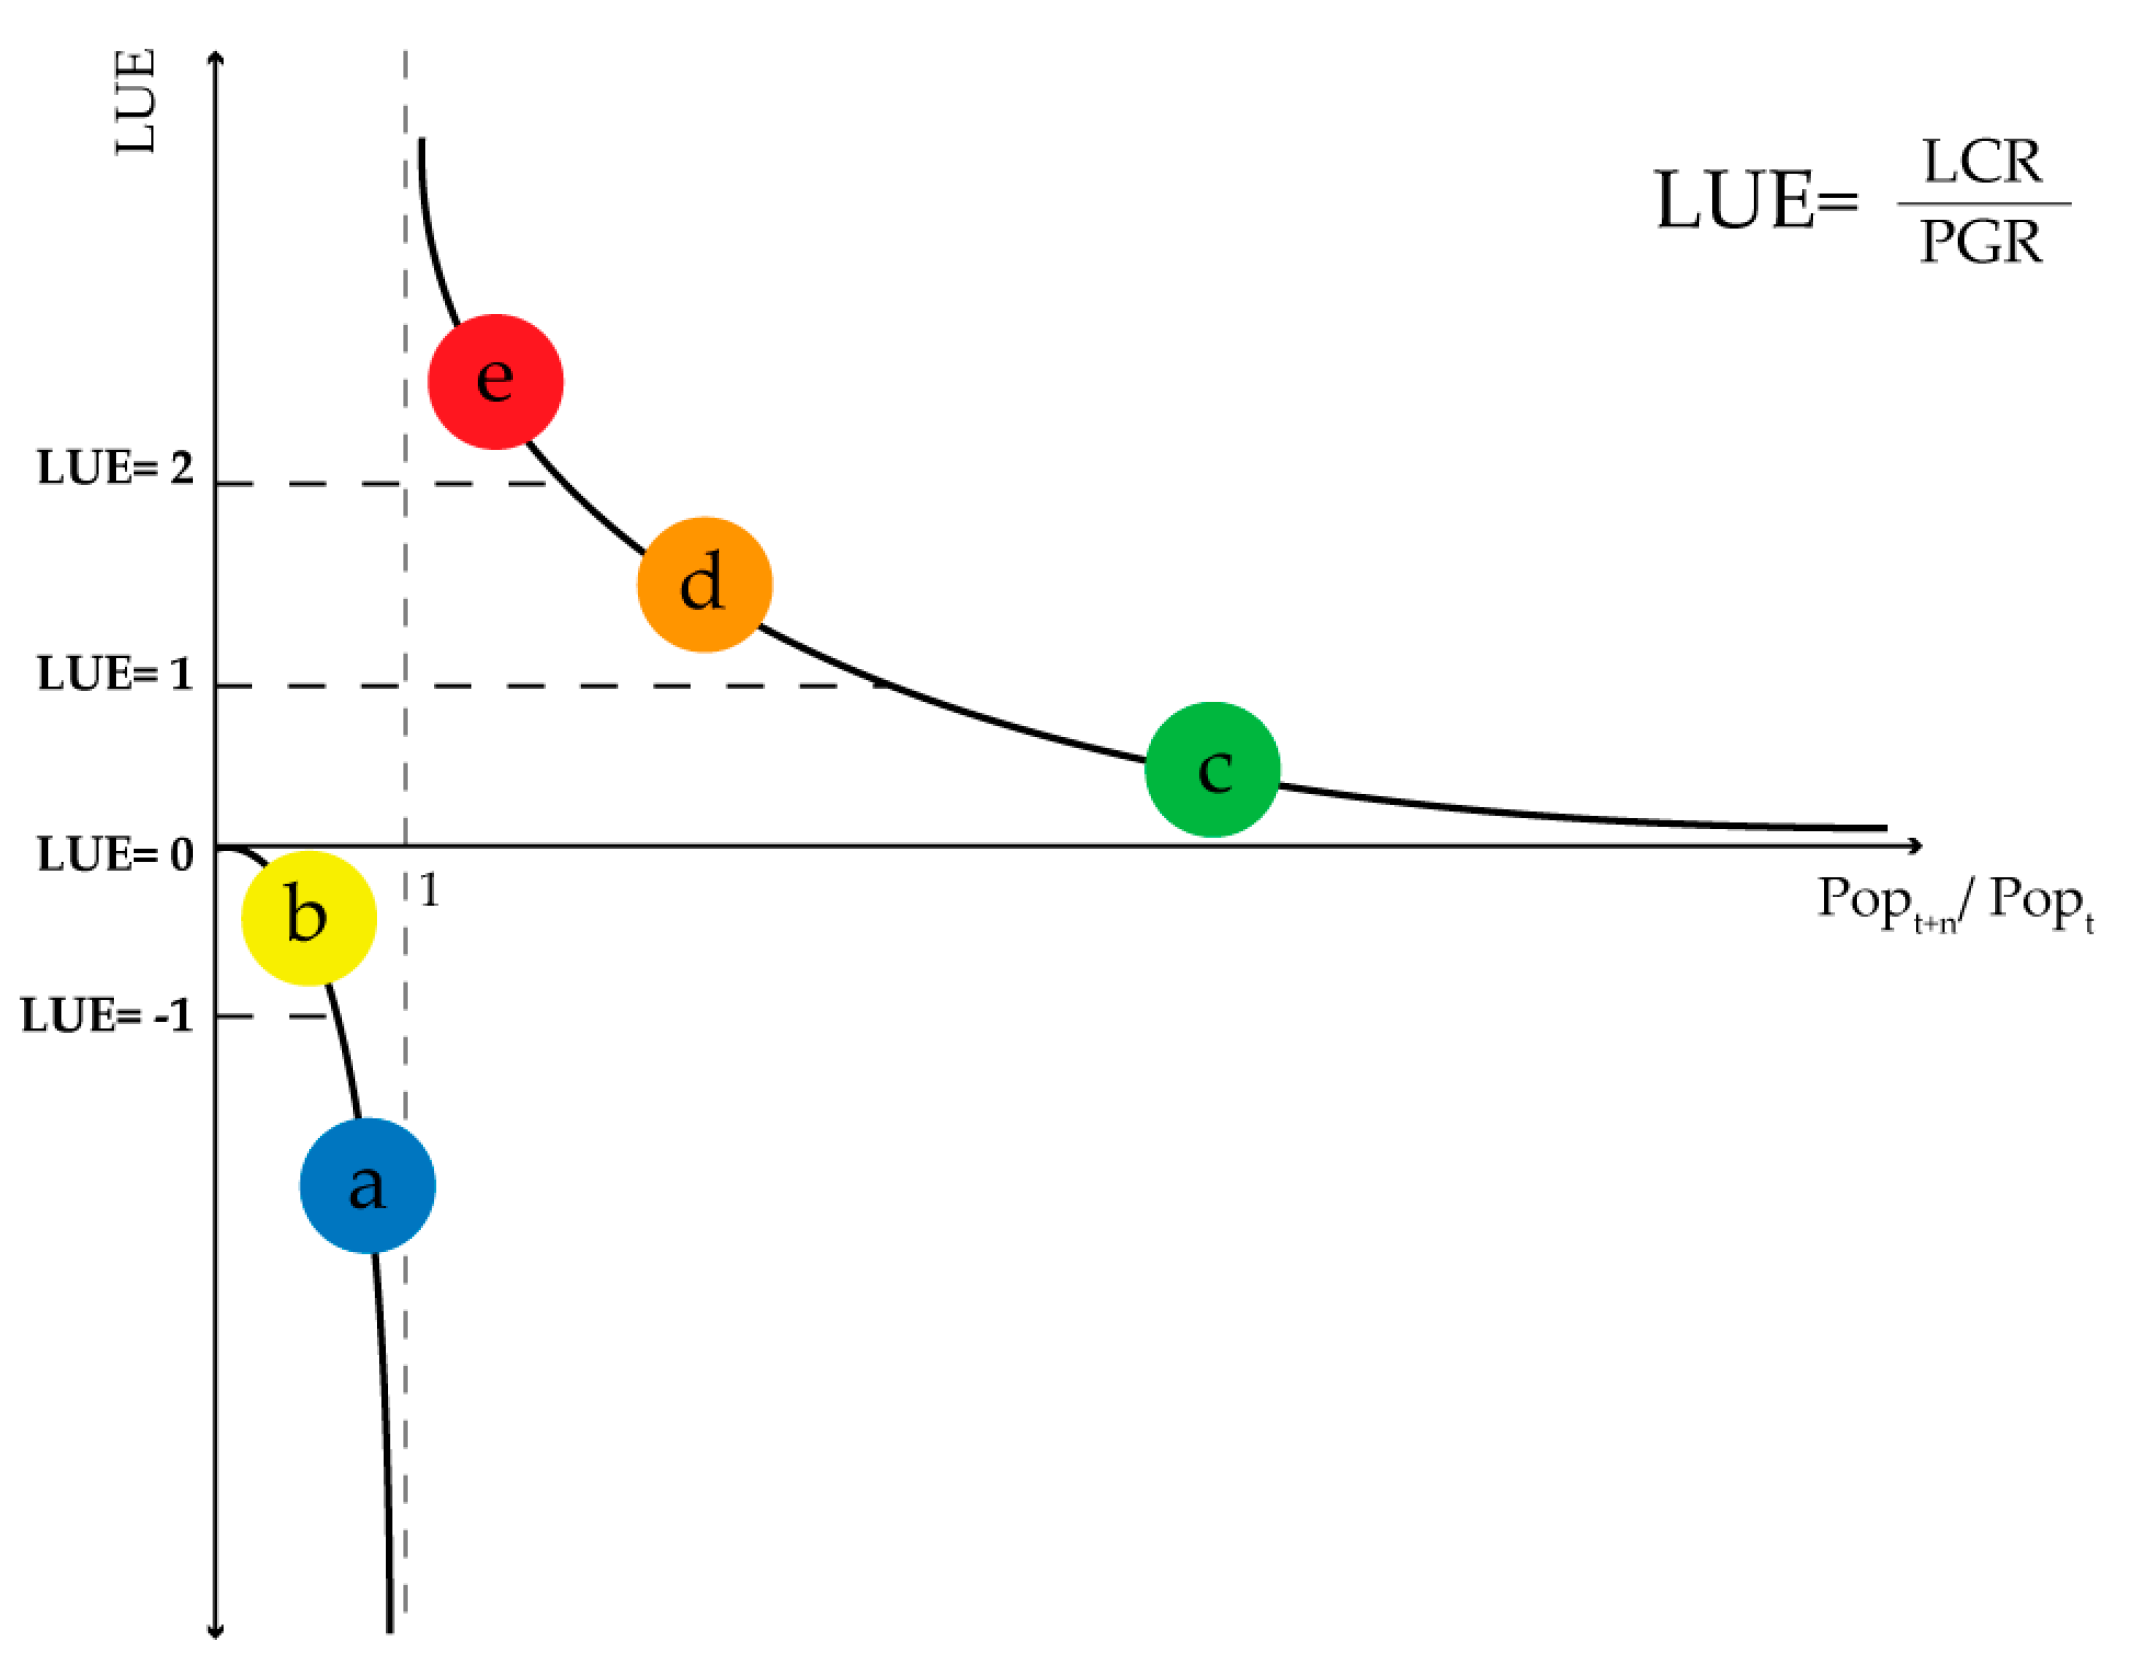
Lastly, it is fair to note a number of caveats related to the estimation of LUE in our research. The Tier II nature of SDG 11.3.1, for which data are not largely available or not regularly updated, invites the identification of potential data sources to quantify the indicator. The scientific validity of using the GHSL to estimate LUE was proved in [66] as the only presently available dataset to source fine scale, global coverage, multi-temporal data regarding the spatial extent and population for each 1 km grid cell on the landmass, despite some generalizations (Table 6). The GHSL is produced from the best open and free source data available to map the dynamics of built-up areas in recent decades: Landsat imagery [82] and Gridded Population of the World v4 (GPW4) population estimates [63] with multi-temporal depth [48]. The areas of interest (AOI, the extent of the urban centre) are delineated applying the “harmonised definition of cities and settlements” [67] to GHSL data to identify urban areas for analysis with common criteria across the world. Current methods and criteria to define urban areas are highly heterogeneous [59], and forms of sampling to identify cities of interest while limiting the complexity of data sourcing, management, and analysis may introduce biases. The other abstractions for estimating LUE with GHSL are related to LCR and PGR. LCR is estimated based on the semantics of GHS-BUILT, namely the roofed surfaces mapped in GHS-BUILT. Built-up areas mapped in GHS-BUILT in different epochs are therefore adopted as a proxy for land consumption. This pragmatic operation transfers the limitations in information extraction to LCR with remote sensing techniques applied to decametric resolution imagery. Among them are omission and commission error [83], namely the under and over detection of built-up areas compared to reference information (scarcely available in terms of global coverage), an inability to detect settlements or portions of them that are not physically observable (i.e., dwellings under dense vegetation canopies, or assembled with same raw materials as the surrounding landscape, i.e., dirt huts in a semiarid landscape), and the non-characterization of built-up areas by use or functional typologies and building volumes. Moreover, GHS-BUILT is designed to capture only increases in built-up areas. Therefore, Figure 10 presents the possible LUE values as a function of PGR under the GHS-BUILT bounding condition of an LCR >0. As presented in Section 3, we adopted five main classifications of LUE values: a) and b) are characterized by a declining population in the AOI, with a) LUE < -1 and b) -1 ≤ LUE < 0 if the negative pace of population rate is faster or slower than the built-up rate, respectively; c) 0 ≤ LUE < 1, related to a growing population at a higher rate than built-up area (i.e., LCR < PGR); in d) and e), the population grows at a slower pace than built-up area (i.e., LCR > PGR), with d) 1≤ LUE < 2 and e) LUE > 2 to differentiate whether PGR is positive but LCR is slightly or at least twice the PGR, respectively.
A few generalizations are also introduced by the PGR semantics and are mostly due to the input data. As all population grids are derived from censuses, GHS-POP, derived from GPW4 data, is subject to two main typologies of shortcomings in population statistics, with one affecting geography reporting units (lack of spatial detail and low spatial accuracy), and the other affecting attributes and population counts (under and over counting and/or reporting, and interpolation for reference years in between census dates); however, some of these issues have been addressed in [64], which resulted in the harmonization of coastlines in about 30 countries and revised unpopulated areas in about 15 countries [84].
In the general LUE formulation context, in which LCR can be negative (incompatible with GHSL architecture and most EO thematic products), the interpretation of the LUE indicator is more complex and ambiguous. Identical LUE values can be obtained in completely different scenarios. For example, an LUE between 0 and 1 (e.g., 0.7, as presented for urban centres) with a positive LCR characterizes population densification in terms of the land consumed (i.e., LCR < PGR); with a negative LCR, the area of interest would experience land restoration at a rate slower than the depopulation rate (i.e., LCR > PGR).
Nevertheless, this further attempt to systematically estimate the LUEs of all urban centres mapped by GHSL and across multiple scales is consistent with the UN-GGIM Work Group level practice that envisages the use of the GHSL to estimate LUE, thus filling the gap in information availability and moving SDG 11.3.1 to Tier I indicator status, also in view of the improvement of information extraction from more-recent satellite platforms (i.e., the Sentinel constellation [85,86]) [66].

5. Conclusions

The surge of sustainable urban development challenges at the intergovernmental level during the Post-2015 Development Agenda process and the consolidation of specific goals and indicators leave no room for gaps in understanding urban processes and reporting on their sustainability indicators.
In this article, we presented estimates of land use efficiency (LUE)—an important indicator for Sustainable Development Goal 11 (“make cities and human settlements inclusive, safe, resilient and sustainable”). The “ratio of land consumption rate to population growth rate” (SDG 11.3.1) is currently classified as a Tier II indicator because a globally agreed methodology exists but data are not available or not regularly updated.
Our contribution provided an estimate of the SDG 11.3.1 indicator using open data at multiple territorial scales. The challenge in estimating the LUE is related to the need for information on the extent of human settlements, the amount of built-up area, and population at multiple points in time. The LUE has been quantified with the internationally agreed-upon method on the basis of the data produced in the Global Human Settlement Layer framework of the European Commission Joint Research Centre. The GHSL supplied open data on the spatial distribution of built-up areas, population and settlement typologies for the corresponding epochs 1990, 2000, and 2015, and tools for the independent production of the same data. Our study finds that, globally, between 1990 and 2015, the spatial expansion of built-up areas consumed almost 255,000 km2 of land to accommodate some 2 billion new people, corresponding to a LUE value of 1.2, leading us to conclude that spatial expansion has slightly prevailed over population growth. In the two sub-epochs, this overall trajectory diverges in an LUE value >1 in the first period, and <1 in the second, whereas spatial expansion is prevalent between 1990 and 2000, while population growth exceeds the pace of spatial expansion in the second sub-epoch (2000–2015). This pattern may suggest that between the 1990s and 2000s, humans have improved the land use efficiency of development.
However, substantial deviations from these overall values are observed, mainly of two kinds: one of a geographical nature, the other with settlement typology dependence. Regions of the world have developed along heterogeneous paths: in some, spatial expansion prevailed (especially in Europe); in others, the demographic component did (in particular, in Africa). These findings challenge the coupling of demographic growth to the need for settlement space. The second diversification derives from the different efficiencies of rural, urban and high-density urban settings in the ways in which new population drives built-up expansion. Our study confirms that dense urban centres systematically report better land use efficiency performance compared to other settlement types, even though the LUE values of urban centres are subject to the geographic variations mentioned above, confirming the evidence that cities are more land-efficient than other settlement types, but also that cities in certain regions are less land-efficient than other cities elsewhere.
This second finding indicates that the internationally adopted mathematical formulation for the LUE indicator nests path dependency in the quantification of efficiency. The LUE value identifies whether the ratio of the land consumption rate to population growth rate is improved compared to the reference year (i.e., 0 ≤ LUE < 1), or worsened (all other cases); therefore, if new population is related to higher or lower land consumption. This relationship is nevertheless captured by a dimensionless ratio. In contrast to this approach, SDG 15.3.1 quantifies the land subject to degradation with a spatially explicit metric. This differentiated treatment (of the same natural resource, land) could be reconciled supporting SDG 11.3.1 with a spatially explicit metric of land take per person. This aspect has been presented and questioned throughout the paper, demonstrating the high diversification of Marginal Land Consumption per New Inhabitant (MLCNI) and Abstract Achieved Population Density in Expansion Areas (AAPDEA) that establish an absolute relationship between the extent of spatial expansion and net population change. These two spatially explicit metrics proved to be key to the diversification of spatial units that developed within similar LUE classes or with the same LUE values. The comparison among five urban centres demonstrated that the MLCNI for a centre can be a mere fraction of that in another, despite them having the same rate of land consumption and the same rate of population growth. These findings have implications for the actual capacity to use the SDG 11.3.1 indicator for the inter-comparison of development patterns across territories.
As a concluding statement, we tentatively add the extent of spatial expansion corresponding to UNDESA population projections to 2050 using the global LUE average of the past 25 years (1.22) and its corresponding MLCNI (equivalent to 124.9 m2 per person). If this trajectory is to continue to 2050, it would result in an expansion of human settlements over almost 150,000 km2 of new land, putting the global footprint of built-up areas at more than 900,000 km2. This figure should be adjusted by net population change for each region of the world and settlement typology, but it can be taken as illustrative value.
In conclusion, thanks to technological developments in the field of human settlement mapping and to the availability of open data, we were capable to estimate the LUE in 10,000 urban centres across the globe and at multiple scales. With the intention of supporting the ongoing dialogue on SDG 11.3.1, we point out that these results were obtained with a limited number of abstractions and generalizations as conceived in the GHSL data and approach. The paper demonstrates the potential of Earth observation and open data in service of SDG monitoring and reporting in the operational phase. If the SDG LUE target had been agreed in 1990, the figure shown could have served as its status as of 2015; however, SDG monitoring since 2015 requires a regular update of the corresponding data. The European Copernicus Land Monitoring Service (https://land.copernicus.eu) could play a key role in the sustainable production of the baseline data until 2030.

Author Contributions

Conceptualization, M.M.; methodology, M.S. and M.M.; validation, A.J.F., M.P. and T.K.; formal analysis, M.M. and S.F.; data curation, A.J.F., M.S., C.C. and S.F.; writing—original draft preparation, M.M; writing—review and editing, M.S., C.C. and S.F.; supervision, T.K. and M.P.; project administration, T.K.; funding acquisition, T.K.

Funding

This work has been carried out in the frame of the institutional work program of the Joint Research Centre (JRC, European Commission) and supported by the administrative arrangement No. 33,994 between the JRC and the Directorate General for Regional and Urban Policies (DG REGIO, European Commission).

Conflicts of Interest

The authors declare no conflict of interest.

References

  1. Clark, P. The Oxford Handbook of Cities in World History, 1st ed.; Oxford University Press: Oxford, UK, 2013; ISBN 978-0-19-958953-1. [Google Scholar]
  2. United Nations, Department of Economic and Social Affairs. Population Division World Urbanization Prospects: The 2018 Revision; UN: New York, NY, USA, 2019. [Google Scholar]
  3. Beach, T.; Luzzadder-Beach, S.; Cook, D.; Dunning, N.; Kennett, D.J.; Krause, S.; Terry, R.; Trein, D.; Valdez, F. Ancient Maya impacts on the Earth’s surface: An Early Anthropocene analog? Quat. Sci. Rev. 2015, 124, 1–30. [Google Scholar] [CrossRef]
  4. Beach, T.; Johnson, K.M.; Hill, M.M.; Munoz, S.; Peros, M. The view from the “Anthropocene”: New perspectives in human-induced environmental change. Anthropocene 2016, 15, 1–2. [Google Scholar] [CrossRef]
  5. Long, H.; Qu, Y. Land use transitions and land management: A mutual feedback perspective. Land Use Policy 2018, 74, 111–120. [Google Scholar] [CrossRef]
  6. The Lancet Planetary Health. Land degradation: A solution is possible. Lancet Planet. Health 2018, 2, e184. [Google Scholar] [CrossRef]
  7. Newbold, T.; Hudson, L.N.; Arnell, A.P.; Contu, S.; De Palma, A.; Ferrier, S.; Hill, S.L.L.; Hoskins, A.J.; Lysenko, I.; Phillips, H.R.P.; et al. Has land use pushed terrestrial biodiversity beyond the planetary boundary? A global assessment. Science 2016, 353, 288–291. [Google Scholar] [CrossRef]
  8. Burdett, R. The Endless City: The Urban Age Project by the London School of Economics and Deutsche Bank’s Alfred Herrhausen Society; Phaidon: London, UK, 2007; ISBN 978-0-7148-4820-4. [Google Scholar]
  9. Biermann, F.; Bai, X.; Bondre, N.; Broadgate, W.; Arthur Chen, C.-T.; Dube, O.P.; Erisman, J.W.; Glaser, M.; van der Hel, S.; Lemos, M.C.; et al. Down to Earth: Contextualizing the Anthropocene. Global Environ. Chang. 2016, 39, 341–350. [Google Scholar] [CrossRef] [Green Version]
  10. Pincetl, S. Cities in the age of the Anthropocene: Climate change agents and the potential for mitigation. Anthropocene 2017, 20, 74–82. [Google Scholar] [CrossRef]
  11. Brenner, N. Theses on Urbanization. Public Cult. 2013, 25, 85–114. [Google Scholar] [CrossRef]
  12. Melchiorri, M.; Florczyk, A.; Freire, S.; Schiavina, M.; Pesaresi, M.; Kemper, T. Unveiling 25 Years of Planetary Urbanization with Remote Sensing: Perspectives from the Global Human Settlement Layer. Remote Sens. 2018, 10, 768. [Google Scholar] [CrossRef]
  13. Seto, K.C.; Sánchez-Rodríguez, R.; Fragkias, M. The New Geography of Contemporary Urbanization and the Environment. Ann. Rev. Environ. Resour. 2010, 35, 167–194. [Google Scholar] [CrossRef] [Green Version]
  14. Seto, K.C.; Fragkias, M.; Güneralp, B.; Reilly, M.K. A Meta-Analysis of Global Urban Land Expansion. PLoS ONE 2011, 6, e23777. [Google Scholar] [CrossRef] [PubMed]
  15. Angel, S.; Blei, A.M.; Civco, D.M.; Lamson-Hall, P.; Parent, J.; Galarza Sanchez, N.; Thom, K. Atlas of Urban Expansion-The 2015 Edition; The NYU Urbanization Project: New York, NY, USA; The Lincoln Institute of Land Policy: Cambridge, MA, USA; U.N. Habitat: Nairobi, Kenya, 2015. [Google Scholar]
  16. Schneider, A.; Woodcock, C.E. Compact, Dispersed, Fragmented, Extensive? A Comparison of Urban Growth in Twenty-five Global Cities using Remotely Sensed Data, Pattern Metrics and Census Information. Urban Stud. 2008, 45, 659–692. [Google Scholar] [CrossRef]
  17. Soja, E.W. Regional Urbanization and the End of the Metropolis Era. In The New Blackwell Companion to the City; Bridge, G., Watson, S., Eds.; Wiley-Blackwell: Oxford, UK, 2012; pp. 679–689. ISBN 978-1-4443-9510-5. [Google Scholar]
  18. UN. Transforming our World: The 2030 Agenda for Sustainable Development A/RES/70/1; UN: New York, NY, USA, 2015. [Google Scholar]
  19. Colglazier, W. The Sustainable Development Goals: Roadmaps to Progress. AAAS Sci. Dipl. 2018, 7. [Google Scholar]
  20. UN Secretary-General’s Independent Expert. Advisory Group on the Data Revolution for Sustainable Development. A World that Counts Mobilising the Data Revolution for Sustainable Development; UN: New York, NY, USA, 2014. [Google Scholar]
  21. UN. Work of the Statistical Commission Pertaining to the 2030 Agenda for Sustainable Development A/RES/71/313; UN: New York, NY, USA, 2017. [Google Scholar]
  22. Bissio, R. SDG Indicators: The Forest is Missing; 23, Global Policy Watch Forum: New York, NY, USA, 2018. [Google Scholar]
  23. Anderson, K.; Ryan, B.; Sonntag, W.; Kavvada, A.; Friedl, L. Earth observation in service of the 2030 Agenda for Sustainable Development. Geo Spat. Inf. Sci. 2017, 20, 77–96. [Google Scholar] [CrossRef]
  24. Andries, A.; Morse, S.; Murphy, R.; Lynch, J.; Woolliams, E.; Fonweban, J. Translation of Earth observation data into sustainable development indicators: An analytical framework. Sustain. Dev. 2018, 27, 366–376. [Google Scholar] [CrossRef] [Green Version]
  25. Scott, G.; Rajabifard, A. Sustainable development and geospatial information: A strategic framework for integrating a global policy agenda into national geospatial capabilities. Geo Spat. Inf. Sci. 2017, 20, 59–76. [Google Scholar] [CrossRef]
  26. Donaldson, D.; Storeygard, A. The View from Above: Applications of Satellite Data in Economics. J. Econ. Perspect. 2016, 30, 171–198. [Google Scholar] [CrossRef] [Green Version]
  27. Paganini, M.; Petiteville, I. Satellite Earth Observations in Support of the Sustainable Development Goals. The CEOS Earth Observation Handbook; CEOS–ESA: Roma, Italy, 2018. [Google Scholar]
  28. Steffen, W.; Richardson, K.; Rockstrom, J.; Cornell, S.E.; Fetzer, I.; Bennett, E.M.; Biggs, R.; Carpenter, S.R.; de Vries, W.; de Wit, C.A.; et al. Planetary boundaries: Guiding human development on a changing planet. Science 2015, 347, 1259855. [Google Scholar] [CrossRef] [Green Version]
  29. Lambin, E.F.; Turner, B.L.; Geist, H.J.; Agbola, S.B.; Angelsen, A.; Bruce, J.W.; Coomes, O.T.; Dirzo, R.; Fischer, G.; Folke, C.; et al. The causes of land-use and land-cover change: Moving beyond the myths. Glob. Environ. Chang. 2001, 11, 261–269. [Google Scholar] [CrossRef]
  30. Lambin, E.F.; Meyfroidt, P. Global land use change, economic globalization, and the looming land scarcity. Proc. Natl. Acad. Sci. USA 2011, 108, 3465–3472. [Google Scholar] [CrossRef] [Green Version]
  31. Pielke, R.A., Sr. Atmospheric Science: Land Use and Climate Change. Science 2005, 310, 1625–1626. [Google Scholar] [CrossRef] [PubMed]
  32. Clavero, M.; Villero, D.; Brotons, L. Climate Change or Land Use Dynamics: Do We Know What Climate Change Indicators Indicate? PLoS ONE 2011, 6, e18581. [Google Scholar] [CrossRef] [PubMed]
  33. Patz, J.A.; Olson, S.H. Land Use/Land Change and Health. In International Encyclopedia of Public Health; Elsevier: Amsterdam, The Netherlands, 2017; pp. 358–363. ISBN 978-0-12-803708-9. [Google Scholar]
  34. Foley, J.A. Global Consequences of Land Use. Science 2005, 309, 570–574. [Google Scholar] [CrossRef] [PubMed] [Green Version]
  35. Sterling, S.M.; Ducharne, A.; Polcher, J. The impact of global land-cover change on the terrestrial water cycle. Nat. Climate Chang. 2013, 3, 385–390. [Google Scholar] [CrossRef]
  36. Belward, A.S.; Skøien, J.O. Who launched what, when and why; trends in global land-cover observation capacity from civilian earth observation satellites. ISPRS J. Photogramm. Remote Sens. 2015, 103, 115–128. [Google Scholar] [CrossRef]
  37. Townshend, J.; Justice, C.; Li, W.; Gurney, C.; McManus, J. Global land cover classification by remote sensing: Present capabilities and future possibilities. Remote Sens. Environ. 1991, 35, 243–255. [Google Scholar] [CrossRef]
  38. Schneider, A.; Friedl, M.A.; Potere, D. A new map of global urban extent from MODIS satellite data. Environ. Res. Lett. 2009, 4, 044003. [Google Scholar] [CrossRef] [Green Version]
  39. Chen, J.; Chen, J.; Liao, A.; Cao, X.; Chen, L.; Chen, X.; He, C.; Han, G.; Peng, S.; Lu, M.; et al. Global land cover mapping at 30m resolution: A POK-based operational approach. ISPRS J. Photogramm. Remote Sens. 2015, 103, 7–27. [Google Scholar] [CrossRef] [Green Version]
  40. ESA. ESA CCI Land Cover v2.0.7; ESA: Paris, France, 2017.
  41. Center for International Earth Science Information Network-CIESIN; Columbia University. Global Rural-Urban Mapping Project, Version 1 (GRUMPv1): Urban Extent Polygons, Revision 01; SEDAC: Palisades, NY, USA, 2017. [Google Scholar]
  42. Florczyk, A.J.; Melchiorri, M.; Zeidler, J.; Corbane, C.; Schiavina, M.; Freire, S.; Sabo, F.; Politis, P.; Esch, T.; Pesaresi, M. The Generalised Settlement Area: mapping the Earth surface in the vicinity of built-up areas. Int. J. Dig. Earth 2019, 1–16. [Google Scholar] [CrossRef]
  43. Esch, T.; Heldens, W.; Hirner, A.; Keil, M.; Marconcini, M.; Roth, A.; Zeidler, J.; Dech, S.; Strano, E. Breaking new ground in mapping human settlements from space–The Global Urban Footprint. ISPRS J. Photogramm. Remote Sens. 2017, 134, 30–42. [Google Scholar] [CrossRef]
  44. Liu, X.; Hu, G.; Chen, Y.; Li, X.; Xu, X.; Li, S.; Pei, F.; Wang, S. High-resolution multi-temporal mapping of global urban land using Landsat images based on the Google Earth Engine Platform. Remote Sens. Environ. 2018, 209, 227–239. [Google Scholar] [CrossRef]
  45. Seto, K.C.; Reenberg, A.; Boone, C.G.; Fragkias, M.; Haase, D.; Langanke, T.; Marcotullio, P.; Munroe, D.K.; Olah, B.; Simon, D. Urban land teleconnections and sustainability. Proc. Natl. Acad. Sci. USA 2012, 109, 7687–7692. [Google Scholar] [CrossRef] [PubMed] [Green Version]
  46. Kennedy, C.M.; Oakleaf, J.R.; Theobald, D.M.; Baruch-Mordo, S.; Kiesecker, J. Managing the middle: A shift in conservation priorities based on the global human modification gradient. Glob. Chang. Biol. 2019, 25, 811–826. [Google Scholar] [CrossRef] [PubMed]
  47. Elvidge, C.D.; Tuttle, B.T.; Sutton, P.C.; Baugh, K.E.; Howard, A.T.; Milesi, C.; Bhaduri, B.; Nemani, R. Global distribution and density of constructed impervious surfaces. Sensors 2007, 7, 1962–1979. [Google Scholar] [CrossRef] [PubMed]
  48. Corbane, C.; Pesaresi, M.; Kemper, T.; Politis, P.; Florczyk, A.J.; Syrris, V.; Melchiorri, M.; Sabo, F.; Soille, P. Automated global delineation of human settlements from 40 years of Landsat satellite data archives. Big Earth Data 2019, 3, 140–169. [Google Scholar] [CrossRef]
  49. Corbane, C.; Pesaresi, M.; Politis, P.; Syrris, V.; Florczyk, A.J.; Soille, P.; Maffenini, L.; Burger, A.; Vasilev, V.; Rodriguez, D.; et al. Big earth data analytics on Sentinel-1 and Landsat imagery in support to global human settlements mapping. Big Earth Data 2017, 1, 118–144. [Google Scholar] [CrossRef] [Green Version]
  50. Pesaresi, M.; Melchiorri, M.; Siragusa, A.; Kemper, T. Atlas of the Human Planet 2016. Mapping Human Presence on Earth with the Global Human Settlement Layer; Publications Office of the European Union: Luxembourg, 2016. [Google Scholar]
  51. Esch, T.; Bachofer, F.; Heldens, W.; Hirner, A.; Marconcini, M.; Palacios-Lopez, D.; Roth, A.; Üreyen, S.; Zeidler, J.; Dech, S.; et al. Where We Live—A Summary of the Achievements and Planned Evolution of the Global Urban Footprint. Remote Sens. 2018, 10, 895. [Google Scholar] [CrossRef]
  52. Hascic Haščič, I.; Mackie, A. Land Cover Change and Conversions: Methodology and Results for OECD and G20 Countries; OECD Publishing: Paris, France, 2018. [Google Scholar]
  53. Turok, I.; McGranahan, G. Urbanization and economic growth: The arguments and evidence for Africa and Asia. Environ. Urban. 2013, 25, 465–482. [Google Scholar] [CrossRef]
  54. Glaeser, E.; Henderson, J.V. Urban economics for the developing World: An introduction. J. Urban Econ. 2017, 98, 1–5. [Google Scholar] [CrossRef]
  55. Frick, S.A.; Rodríguez-Pose, A. Change in urban concentration and economic growth. World Dev. 2018, 105, 156–170. [Google Scholar] [CrossRef]
  56. Brenner, N.; Theodore, N. Cities and the Geographies of “Actually Existing Neoliberalism.”. Antipode 2002, 34, 349–379. [Google Scholar] [CrossRef]
  57. Beall, J.; Guha-Khasnobis, B.; Kanbur, R. Urbanization and Development; Oxford University Press: Oxford, UK, 2010; ISBN 978-0-19-959014-8. [Google Scholar]
  58. Forstall, R.L.; Chan, K.W. Urban Places: Statistical Definitions. In International Encyclopedia of the Social & Behavioral Sciences; Elsevier: Amsterdam, The Netherlands, 2015; pp. 854–861. ISBN 978-0-08-097087-5. [Google Scholar]
  59. Buettner, T. Urban Estimates and Projections at the United Nations: The Strengths, Weaknesses, and Underpinnings of the World Urbanization Prospects. Spat. Demogr. 2015, 3, 91–108. [Google Scholar] [CrossRef]
  60. Dijkstra, L.; Florczyk, A.J.; Freire, S.; Kemper, T.; Pesaresi, M. Applying the Degree of Urbanisation to the Globe: A new harmonized definition reveals a different picture of global urbanization. In Proceedings of the 16th IAOS Conference: Better Statistics for Better Lives, Paris, France, 19–20 September 2018. [Google Scholar]
  61. Montgomery, M.R. The Urban Transformation of the Developing World. Science 2008, 319, 761–764. [Google Scholar] [CrossRef] [PubMed] [Green Version]
  62. Leyk, S.; Gaughan, A.E.; Adamo, S.B.; de Sherbinin, A.; Balk, D.; Freire, S.; Rose, A.; Stevens, F.R.; Blankespoor, B.; Frye, C.; et al. The spatial allocation of population: A review of large-scale gridded population data products and their fitness for use. Earth Syst. Sci. Data 2019, 11, 1385–1409. [Google Scholar] [CrossRef]
  63. Center for International Earth Science Information Network(CIESIN)-Columbia University. Gridded Population of the World, Version 4 (GPWv4): Population Density; SEDAC: Palisades, NY, USA, 2016. [Google Scholar]
  64. Freire, S.; Schiavina, M.; Florczyk, A.; MacManus, K.; Pesaresi, M.; Corbane, C.; Bokovska, O.; Mills, J.; Pistolesi, L.; Squires, J.; et al. Enhanced data and methods for improving open and free global population grids: Putting ‘leaving no one behind’ into practice. Int. J. Digit. Earth 2018, 11, 1–17. [Google Scholar] [CrossRef]
  65. Nicolau, R.; David, J.; Caetano, M.; Pereira, J. Ratio of Land Consumption Rate to Population Growth Rate—Analysis of Different Formulations Applied to Mainland Portugal. ISPRS Int. J. Geo Inf. 2018, 8, 10. [Google Scholar] [CrossRef]
  66. Melchiorri, M.; Pesaresi, M.; Florczyk, A.J.; Corbane, C.; Kemper, T. Principles and Applications of the Global Human Settlement Layer as Baseline for the Land Use Efficiency Indicator–SDG 11.3.1. ISPRS Int. J. Geo Inf. 2018, 8, 96. [Google Scholar] [CrossRef]
  67. Dijkstra, L.; Poelman, H. A harmonised definition of cities and rural areas: The new degree of urbanization. WP 2014, 1, 2014. [Google Scholar]
  68. Florczyk, A.; Melchiorri, M.; Corbane, C.; Schiavina, M.; Maffenini, L.; Pesaresi, M.; Politis, P.; Sabo, F.; Freire, S.; Ehrlich, D.; et al. Description of the GHS Urban Centre Database 2015; Publications Office of the European Union: Luxembourg, 2019; ISBN 978-92-79-99753-2. [Google Scholar]
  69. Nieves, J.J.; Stevens, F.R.; Gaughan, A.E.; Linard, C.; Sorichetta, A.; Hornby, G.; Patel, N.N.; Tatem, A.J. Examining the correlates and drivers of human population distributions across low- and middle-income countries. J. R. Soc. Interface 2017, 14, 20170401. [Google Scholar] [CrossRef] [Green Version]
  70. Jedwab, R.; Christiaensen, L.; Gindelsky, M. Demography, urbanization and development: Rural push, urban pull and urban push? J. Urban Econ. 2017, 98, 6–16. [Google Scholar] [CrossRef]
  71. Venables, A.J. Breaking into tradables: Urban form and urban function in a developing city. J. Urban Econ. 2017, 98, 88–97. [Google Scholar] [CrossRef] [Green Version]
  72. Cohen, B. Urbanization in developing countries: Current trends, future projections, and key challenges for sustainability. Technol. Soc. 2006, 28, 63–80. [Google Scholar] [CrossRef]
  73. Paddison, R. Handbook of Urban Studies; SAGE: London, UK, 2001; ISBN 978-0-8039-7695-5. [Google Scholar]
  74. Pileri, P. Persistente e inefficiente: Così è il consumo di suolo nel Paese. In Consumo di Suolo, Dinamiche Territoriali e Servizi Ecosistemici, Rapporto sul consumo di suolo in Italia; Istituto Superiore per la Protezione e la Ricerca Ambientale: Rome, Italy, 2017; ISBN 978-88-448-0831-0. [Google Scholar]
  75. Freire, S.; Kemper, T.; Pesaresi, M.; Floczyk, A.; Syrris, V. Combining GHSL and GPW to improve global population mapping. In Proceedings of the Geoscience and Remote Sensing Symposium (IGARSS), Milan, Italy, 26–31 July 2015. [Google Scholar]
  76. Pesaresi, M.; Freire, S. GHS Settlement grid following the REGIO model 2014 in application to GHSL Landsat and CIESIN GPW v4-multitemporal (1975-1990-2000-2015). Available online: http://data.europa.eu/89h/jrc-ghsl-ghs_smod_pop_globe_r2016a (accessed on 12 September 2019).
  77. European Commission; Joint Research Centre. Atlas of the Human Planet 2018, a World of Cities; Publications Office of the European Union: Luxembourg, 2018; ISBN 978-92-79-98185-2.
  78. Seto, K.C.; Dhakal, S.; Bigio, A.; Blanco, H.; Delgado, G.; Dewar, D.; Huang, L.; Inaba, A. Human Settlements, Infrastructure and Spatial Planning, Climate Change 2014; Cambridge University Press: Cambridge, UK, 2014. [Google Scholar]
  79. OECD. Compact City Policies, OECD Green Growth Studies; OECD Publishing: Paris, France, 2012; ISBN 978-92-64-16784-1. [Google Scholar]
  80. Corbane, C.; Politis, P.; Pesaresi, M.; Kemper, T.; Siragusa, A. Estimation of Land Use Efficiency from the Global Human Settlement Layer (GHSL). In QGIS and Applications in Territorial Planning; Baghdadi, N., Mallet, C., Zribi, M., Eds.; John Wiley & Sons, Inc.: Hoboken, NJ, USA, 2018; pp. 39–52. ISBN 978-1-119-45712-1. [Google Scholar]
  81. Kay, A. A Critique of the Use of Path Dependency in Policy Studies. Public Adm. 2005, 83, 553–571. [Google Scholar] [CrossRef]
  82. Gutman, G.; Huang, C.; Chander, G.; Noojipady, P.; Masek, J. Assessment of the NASA-USGS Global Land Survey (GLS) datasets. Remote Sens. Environ. 2013, 134, 249–265. [Google Scholar] [CrossRef]
  83. Gallego, F.J. Remote sensing and land cover area estimation. Int. J. Remote Sen. 2010, 25, 3019–3047. [Google Scholar] [CrossRef]
  84. Florczyk, A.; Ehrlich, D.; Corbane, C.; Freire, S.; Kemper, T.; Melchiorri, M.; Pesaresi, M.; Politis, P.; Schiavina, M.; Zanchetta, L. Community pre-Release of GHS Data Package (GHS CR2018) in Support to the GEO Human Planet Initiative Version 1.0 2018; Publications Office of the European Union: Luxembourg, 2018.
  85. Pesaresi, M.; Corbane, C.; Julea, A.; Florczyk, A.J.; Syrris, V.; Soille, P. Assessment of the Added-Value of Sentinel-2 for Detecting Built-up Areas. Remote Sens. 2016, 8, 299. [Google Scholar] [CrossRef]
  86. Corbane, C.; Lemoine, G.; Pesaresi, M.; Kemper, T.; Sabo, F.; Ferri, S.; Syrris, V. Enhanced automatic detection of human settlements using Sentinel-1 interferometric coherence. Int. J. Remote Sens. 2018, 39, 842–853. [Google Scholar] [CrossRef]
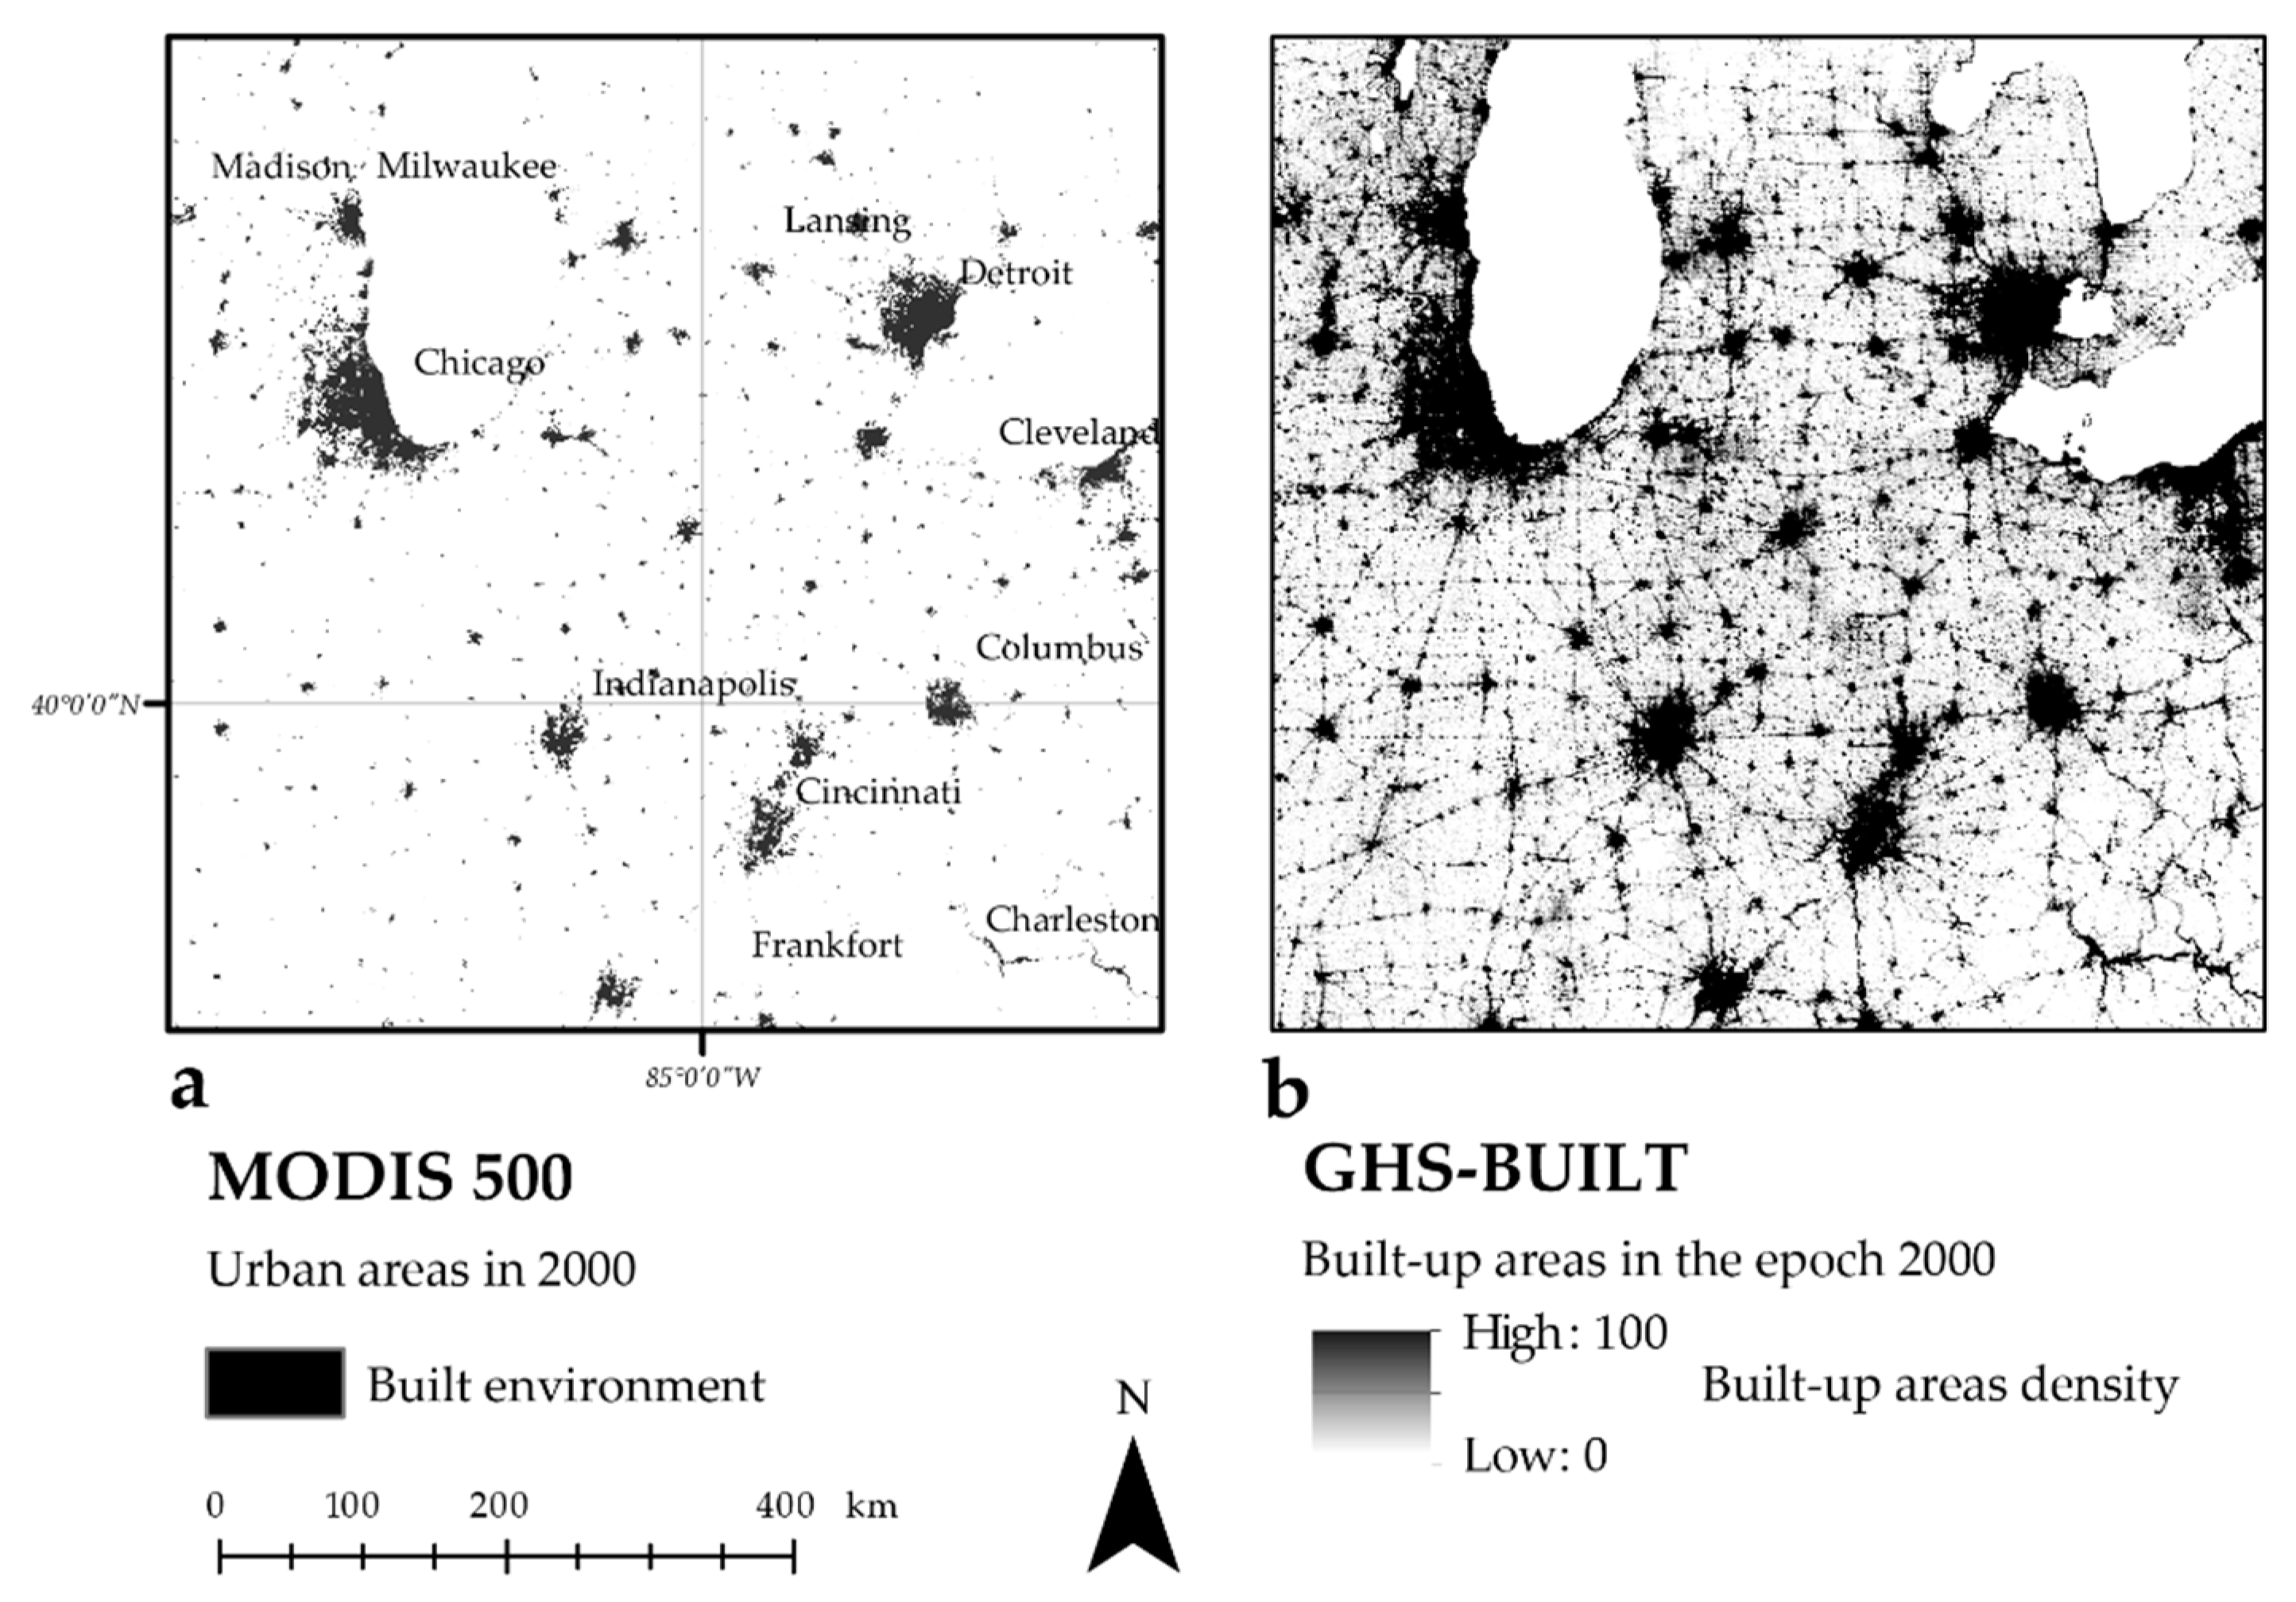
Figure 1. Comparison between human settlement maps derived from different resolution sensors in the Midwestern United States of America for the reference year ca. 2000 (a) Moderate Resolution Imaging Spectroradiometer (MODIS) 500 m; (b) Global Human Settlement Built-Up Grid (GHS-BUILT) 1 km grid (Landsat) 30 m in Mollweide projection (central meridian-85).
Sustainability 11 05674 g001
Figure 2. GHS-BUILT, GHS-POP, and GHS-SMOD in the area of Kampala (Uganda) and 1 km grid cell samples for the three GHS-SMOD settlement typologies: (a) urban centre, (b) urban cluster, and (c) rural area (imagery attribution: ESRI, DigitalGlobe, GeoEye, Earthstar Geographics, CNES/Airbus DS, USDA, USGS, AeroGRID, IGN, and the GIS User Community). Layers are displayed at the highest available spatial resolution displayed in the World Mollweide projection.
Sustainability 11 05674 g002
Figure 3. Geographical distribution of national LUE values characterizing trajectories of spatial and demographic change between 1990 and 2015, displayed in the World Mollweide projection.
Sustainability 11 05674 g003
Figure 4. Change in amount of built-up areas and population between 1990 and 2015 across the settlement typologies defined in the Global Definition of Cities and Settlements (a). Evolution of built-up areas and population between 1990 and 2015 in the three settlement typologies defined by the Global Definition of Cities and Settlements (b).
Sustainability 11 05674 g004
Figure 5. Comprehensive visualization of the LUE value in the circa 10,000 urban centres. LUE is computed based on the land consumption rate (LCR) and population growth rate (PGR) in the period 1990–2015, displayed in the World Mollweide projection.
Sustainability 11 05674 g005
Figure 6. Comparison among Average Abstract Achieved Population Density in Expansion Areas (AAPDEA) of urban centres in each region of the world for the period 1990–2015.
Sustainability 11 05674 g006
Figure 7. Comparison of AAPDEA in urban centres per selected LUE classes (1990–2015) and region of the world.
Sustainability 11 05674 g007
Figure 8. Comparison of AAPDEA (left vertical axes) and MLCNI (right vertical axes) values for the five selected urban centres that developed between 1990 and 2015 with an LUE = 1. AAPDEA and MLCNI are reciprocal ratios and are therefore inversely proportional.
Sustainability 11 05674 g008
Figure 9. a) LUE values (left vertical axes) in urban centres (2015) by population class compared with AAPDEA (right vertical axes); b) LUE values (left vertical axes) in urban centres (2015) by built-up area density compared with MLCNI (right vertical axes). Bars are coloured according to LUE values: orange, greater than 1; green, between 0 and 1.
Sustainability 11 05674 g009
Figure 10. Behaviour of LUE as a function of PGR for a given LCR >0.
Sustainability 11 05674 g010
Table 1. Synthesis and features of Global Human Settlement Layer (GHSL) data used to quantify land use efficiency (LUE).
NameSemanticMain Input DataEpochGrid Resolution
GHS-BUILTDensity of built-up area per grid cellSatellite imagery (Landsat)1975
1990
2000
2015
1 km
GHS-POPPopulation counts per grid cellCensus data (CIESIN GPW), GHS-BUILT
GHS-SMODClassification of each grid cell into one of the Settlement Model classes: urban centres, urban clusters, and rural cellsGHS-BUILT, GHS-POP
Table 2. Built-up areas and population statistics for the study periods, the corresponding LUE values and relative changes per region of the world and a global aggregate in the period 1990–2015.
Built-Up Areas
(103 km2)
Population
(106 people)
LUERelative Change
1990–2015
1990200020151990200020151990–20002000–20151990–2015Built-up areasPopulation
Africa27364263281411861.10.40.754.4%87.8%
Asia1892443033202371443931.71.31.560.7%37.2%
Europe14616919272172673820.27.811.631.8%2.4%
Latin America and the Caribbean3546544475276341.60.81.251.2%42.0%
Northern America1161481752813143582.21.21.750.6%27.5%
Oceania89102731390.90.50.625.7%45.9%
Global5226537775310612773491.61.01.248.8%38.4%
Table 3. Built-up areas and population statistics for the study epochs and corresponding LUE values and relative changes 1990–2015 in urban centres of regions of the world and global aggregate.
Built-Up Areas (103 km2)Population (106 People)LUERelative Change 1990–2015
1990–200020151990200020151990–20002000–20151990–2015Built-up areasPopulation
Africa1721242893805620.80.30.538.7%94.5%
Asia881091231506178821431.30.71.040.9%42.3%
Europe4144452752792874.71.42.511.6%4.5%
Latin America and the Caribbean2227292462913521.20.40.832.3%42.9%
Northern America5665691341511721.30.50.923.8%28.3%
Oceania4451315190.40.10.311.0%51.1%
Global2272692952463290435351.00.50.729.9%43.6%
Table 4. Comparison of average built-up areas and population growth in urban centres per LUE class (1990–2015) and region of the world (excluding Oceania).
Built-Up Area Change 1990–2015Population Change 1990–2015
Region/LUE Class0–0.250.25–0.50.5–0.750.75–10–0.250.25–0.50.5–0.750.75–1
Africa14%28%46%77%47%42%26%34%
Asia11%23%37%54%36%29%26%30%
Europe4%9%12%17%5%5%9%5%
Latin America and the Caribbean12%27%36%46%31%23%37%25%
Northern America8%17%24%32%9%17%8%13%
Table 5. Marginal Land Consumption per New Inhabitant (MLCNI) and Abstract Achieved Population Density in Expansion Areas (AAPDEA) values for selected urban centres developing between 1990 and 2015 with an LUE = 1 and corresponding relative change of built-up areas and population.
Urban CentreMLCNI
(m2 inhabitants)
AAPDEA (inhabitants per km2)Built-Up Area ChangePopulation Change
Zhuanghe [CHN]102.39.77129.2%29.1%
M’Saken [TUN]116.98.55533.8%33.8%
San Nicolas De Los Arroyos [ARG]141.67.06413.1%13.1%
Prato [ITA]164.26.09012.0%12.0%
Austin [USA]355.12.81659.4%59.6%
Table 6. Semantics, GHSL abstraction and implications for estimating LUE with GHSL products at their finest spatial resolution.
SemanticGHSL AbstractionImplications and Generalizations
AOIGHS-SMOD
1 km
I
Delineation of comparable areas of interest (cities) across the globe, at a 1 km resolution
II
People-based definition of cities overcoming administrative boundaries
LCRGHS-BUILT
30 m
III
Captures land consumption through the detection of roofed surfaces at the satellite sensor resolution of 30 m
IV
Exposed to omission and commission error in information extraction
V
Mapping based on physically observable built-up structures (hidden objects not detected; e.g., settlements under dense tree canopy)
VI
No characterization of built-up functions or volumetric information
VII
Built-up areas detected in subsequent epochs bound by the model to be constant or increasing
PGRGHS-POP
250 m
VIII
Based on GPW4 estimates
  • Geography issues (spatial data heterogeneity)
  • Attribute issues (quality and reliability of census)
  • Interpolation/extrapolation from census time points
IX
Dasymetric disaggregation informed by the density of built-up areas from GHS-BUILT
LUEGHS-BUILT, GHS-POP, GHS-SMOD informing the UNDESA metadata
X
Observable LUE cases are the ones displayed in Figure 10