1. Introduction
According to the NASA’s annual global analysis, 2016–2017 were the “record-warm” years since 1880 [
1]. The increasing trend of global warming is mainly due to human activity and to its consequent greenhouse gas (GHG) emissions, mostly CO
2 [
2]. The European Union (EU) is one of the largest sources of global GHG emissions. In 2015 the EU was responsible for about 35 Gt of CO
2 representing around 10% of global CO
2 emissions [
3]. Starting from the 1990s the EU set out important steps to combat climate change with the aim of reducing its GHG emissions [
4]. In particular, the EU established a GHG reduction target of 20% and 40% below 1990 levels for 2020 and 2030, respectively [
5]. The 2020 target has been achieved in advance with respect to what was originally planned. Indeed, GHG emissions in the EU decreased by 23% between 1990 and 2016, while GDP grew by 53% over the same period [
6].
To assess the trend of the emission targets, EU countries perform annual GHG emission inventories by following the IPCC guidelines [
7]. As such, the emission inventory at the country level represents the reference point upon which environmental policies and mitigation strategies as well as national reduction targets are based [
8]. The GHG inventories adopt a geographical/production-based accounting to take into account GHG emissions at the national level [
7]. It means that the countries where products are consumed take no responsibility for the emissions produced by exporter countries [
9], thus neglecting the emissions embodied in trade [
10]. Several authors highlighted that a portion of national production of a given country (and its associated GHG emissions) may be dislocated in other countries without the former country to be taken as responsible for the emissions released elsewhere [
11]. Hence, the emissions released for the production of imported goods are not allocated to the final consumers. Consequently, a significant amount of emissions may be shifted from one country to another, resulting in an extensive amount of emissions embodied in trade [
12,
13,
14].
In recent decades, consumption-based accounting (CBA) emerged as an alternative to the existing GHG inventory [
15,
16,
17,
18,
19,
20,
21]. CBA takes into account the emission of goods and services at the level of consumption, thus allocating the emissions to the final consumer [
22]. Some papers argue that replacing the traditional IPCC-based accounting with a consumption-based accounting would reveal a more complete picture of the effective emissions released from a country [
19,
23,
24]. Moreover, if a CBA was adopted, countries would have to reduce not only the emissions within their national boundaries but also the emissions imported from elsewhere in order to achieve their GHG targets [
25,
26]. Therefore, a greater effort would be required in many countries, including the EU countries, which are mostly net importers of GHG emissions [
27].
In 2016 the EU accounted for the second largest share of global exports and imports of goods (around 15 % of the world’s trade in goods) surpassed in 2014 only by China [
28]. In the case of the EU, the application of a consumption-based accounting (CBA) might provide important insights and affect international regulations in different ways. For instance, it might affect the EU ability to achieve its emission reduction targets as a large amount of goods consumed in the EU are currently produced elsewhere and therefore not recorded by the traditional IPCC inventory. Moreover, a CBA would probably reduce the incentive to outsource industrial activity, thus affecting also employment levels in the home and/or in the host country. In addition, the adoption of a CBA might affect the maximum amount of emission allowances that the EU can afford to allocate among its Member States and therefore the functioning of the European Emissions Trading System (EU ETS) [
29], that is the system of exchange of emission allowances to set a price for carbon emissions. Originally adopted by the EU in 2005, it is currently in its third phase (2013–2020) and the EU has recently set the rules for the next phase that will run until 2030. The EU ETS is largely considered to be the cornerstone of the European climate policy. It covers more than 11,000 installations in 31 countries (all 28 EU members states plus Norway, Iceland, and Liechtenstein) and regulates nearly 45% of total EU GHGs, accounting for three quarters of international carbon trading [
29]. Following the EU ETS, several other countries have adopted or are about to adopt similar instruments around the world (see [
30] and [
31] for an international comparison across existing ETSs).
This paper aims to estimate and compare CO2 emissions in the EU-28 by using two different emission accountings: the traditional IPCC-based accounting and the National Carbon Intensity (NCI) method, a consumption-based accounting developed by [
32], and already adopted in other analyses [
14]. The main objective of the paper is to evaluate the impact of international trade in the EU in terms of CO2 emissions, looking both at the internal trade flows within the EU-28 and at the external trade flows between the EU and the rest of the world. For this purpose, our analysis includes 181 countries (28 EU countries and 153 non-EU countries) focusing on the period 2012–2015, which covers the most recently available data in the post-Kyoto period and the start of a new phase (phase 3) in the European Emission Trading Scheme (EU ETS) [
29]. The implications of the two different approaches are discussed in terms of the current EU target and policy regulations. Given the important role that the UK plays in the EU context and the large impact that its exit could have on both trade and environmental issues, a special focus on the UK and the much-discussed Brexit decision is also presented, by providing different scenarios in which UK trade changes on the basis of different trading relationships.
The geographical location and economic size of the EU make it the UK’s natural trading partner. The UK is a relatively small economy, it requires access to both export and import markets to realize an efficient scale of production and to access many of the inputs used by UK producers [
33]. The forthcoming Brexit will most likely lead the UK to new trade agreements with countries outside the EU. The number and importance of the non-EU trading partners will depend on the features of the Brexit process. Indeed, a ‘soft Brexit’ (where the UK continues to be a member of the EU Single Market like other non-EU members of the European Economic Area) will lead to smaller increases in trade barriers between the UK and the EU whereas a ‘hard Brexit’ (where the UK trades with the EU only under the World Trade Organization) will lead to higher barriers [
34], thus creating stronger incentives to look for alternative partners outside the European boundaries. In any case, due to the Brexit, the UK’s trade flows of goods are expected to be substantially changed [
35,
36]. In this potential new context, the emissions flows from and to the UK are also expected to be altered along with its emissions responsibility as computed according to a CBA approach, which highly depends on the emissions embodied in trade [
37]. Therefore, in our view, it is particularly interesting to investigate how the Brexit may affect the existing international flows of emissions and the consumption-related emissions associated with the UK and its trading partners.
To investigate the issues described above the paper will be structured as follows.
Section 2 illustrates the NCI methodology that is adopted in this study,
Section 3 presents the results deriving from the application of the NCI accounting approach to the EU.
Section 4 focuses more specifically on the UK computing its emissions responsibility under two hypothetical post-Brexit scenarios deriving from a shift in UK imports from EU to non-EU trading partners. Finally,
Section 5 summarizes the main results of the analysis briefly discussing their implications for the emissions responsibility of the EU and the UK.
2. Methodology
As mentioned above, the CBA theoretical framework used in this article is the National Carbon Intensity (NCI) method [
32]. Although it is unable to capture the sectoral level, and is less detailed than other frameworks, such as the input–output analysis, the NCI method represents a suitable tool with remarkable merits, as it is easy to implement, and it requires few data to be applied. Data required for the analysis are promptly available at national level and for regional systems such as the EU-28, which enables to perform computations on annual basis for recent years. [
32] showed that the NCI method gives, in general, a realistic picture of the emissions embodied in international trade and consequently of emissions due to consumption with differences with respect to more advanced multi-regional input–output (MRIO) models below 5%. Finally, the proposed framework is based on the already existing accounting system (IPCC inventory), therefore it does not drastically replace the current emission accounting but integrates it including also the trade effect and allocating emissions to the final consumer.
Following [
32], the basic equation of the NCI method is described in Equation (1)
where
Ri is the ‘responsibility’ in terms of GHG emission of country
i,
DEi measures direct emissions occurring in country
i, according to a purely geographical criterion (the GHG inventory based on the IPCC accounting, [
7]),
Qi denotes emissions embodied in imports of country
i, while
Ni are emissions embodied in its exports.
Emissions embodied in exports (
Ni) are computed as total exports (
Xi), expressed in monetary terms, times the carbon intensity (
gi) of the country of origin (Equation (2)). The carbon intensity is obtained as the ratio of a country’s GHG emissions to its GDP. Similarly, emissions embodied in imports of country
i (
Qi), are computed as the sum of total imports, expressed in monetary terms, from each trading partner
k times the carbon intensity (
gk) of country
k, from which country
i purchases the goods (Equation (3))
where
gi and
Xi are respectively, the carbon intensity of exporter country
i, and its exports (in monetary terms),
gk and
Mk,I are respectively, the carbon intensity of country
k (from which country
i imports its goods), and the imports of country
i from country
k (in monetary terms).
Substituting Equations (2) and (3) into Equation (1), we get
The term represents the emissions embodied in trade of country i, that is, the amount of emissions that should be added (or subtracted if negative) from the final result obtained from the IPCC-based accounting (DEi). Notice that if such a term is positive, emissions embodied in the imports of country i are higher than those embodied in its exports. As a consequence, consumption-related emissions overtake production-related emissions for country i. If this is the case, country i would have higher emissions responsibility if the NCI method was applied instead of the current IPCC geographical method. The contrary obviously applies if the term above is negative.
The database used for import-export flows in monetary terms is UN COMTRADE [
38] which computes imports in thousand dollars. We considered the indicator merchandise trade matrix; it consists of merchandise detailed products, which are based on the three-digit level of the Standard International Trade Classification (SITC) commodity classification. Data are summarized by reporting country, trading partner, and product. Data concerning CO
2 emissions (
DEi) are provided by EDGAR Database [
3], the unit being expressed in kton (Gg) carbon dioxide. The database reports emissions of fossil fuel use and industrial process emissions (cement production, carbonate use of limestone and dolomite, non-energy use of fuels and other combustion, chemical and metal processes, solvents, agricultural liming and urea, waste, and fossil fuel fires). Data concerning the GDP are provided by The World Bank database [
39] and calculated in currents US dollars (
$).
In this paper, the NCI method is applied to 181 countries and results are presented for the period 2012–2015. Scenarios concerning Brexit (described in
Section 4) are performed assuming that a possible Brexit scenario might substantially alter the trading relationships of the UK. Therefore, the proposed scenarios are obtained by modifying UK imports in Equation 4 and thus simulating potential post-Brexit scenarios.
3. Results
Globally, our analysis shows that in 2015 about 7600 Mt CO2 were produced in one country to satisfy consumption in another country. However, we find that during the period 2012–2015 emissions embodied in trade decreased by 9.7%, which corresponds to an annual decrease of about 2.4%. We find that the EU is a net importer of emissions during the entire period analysed because emissions due to consumption exceeded emissions due to production. It implies that if a consumption-based accounting was implemented, the EU would have a higher responsibility in terms of GHG emissions with respect to the traditional IPCC-based accounting.
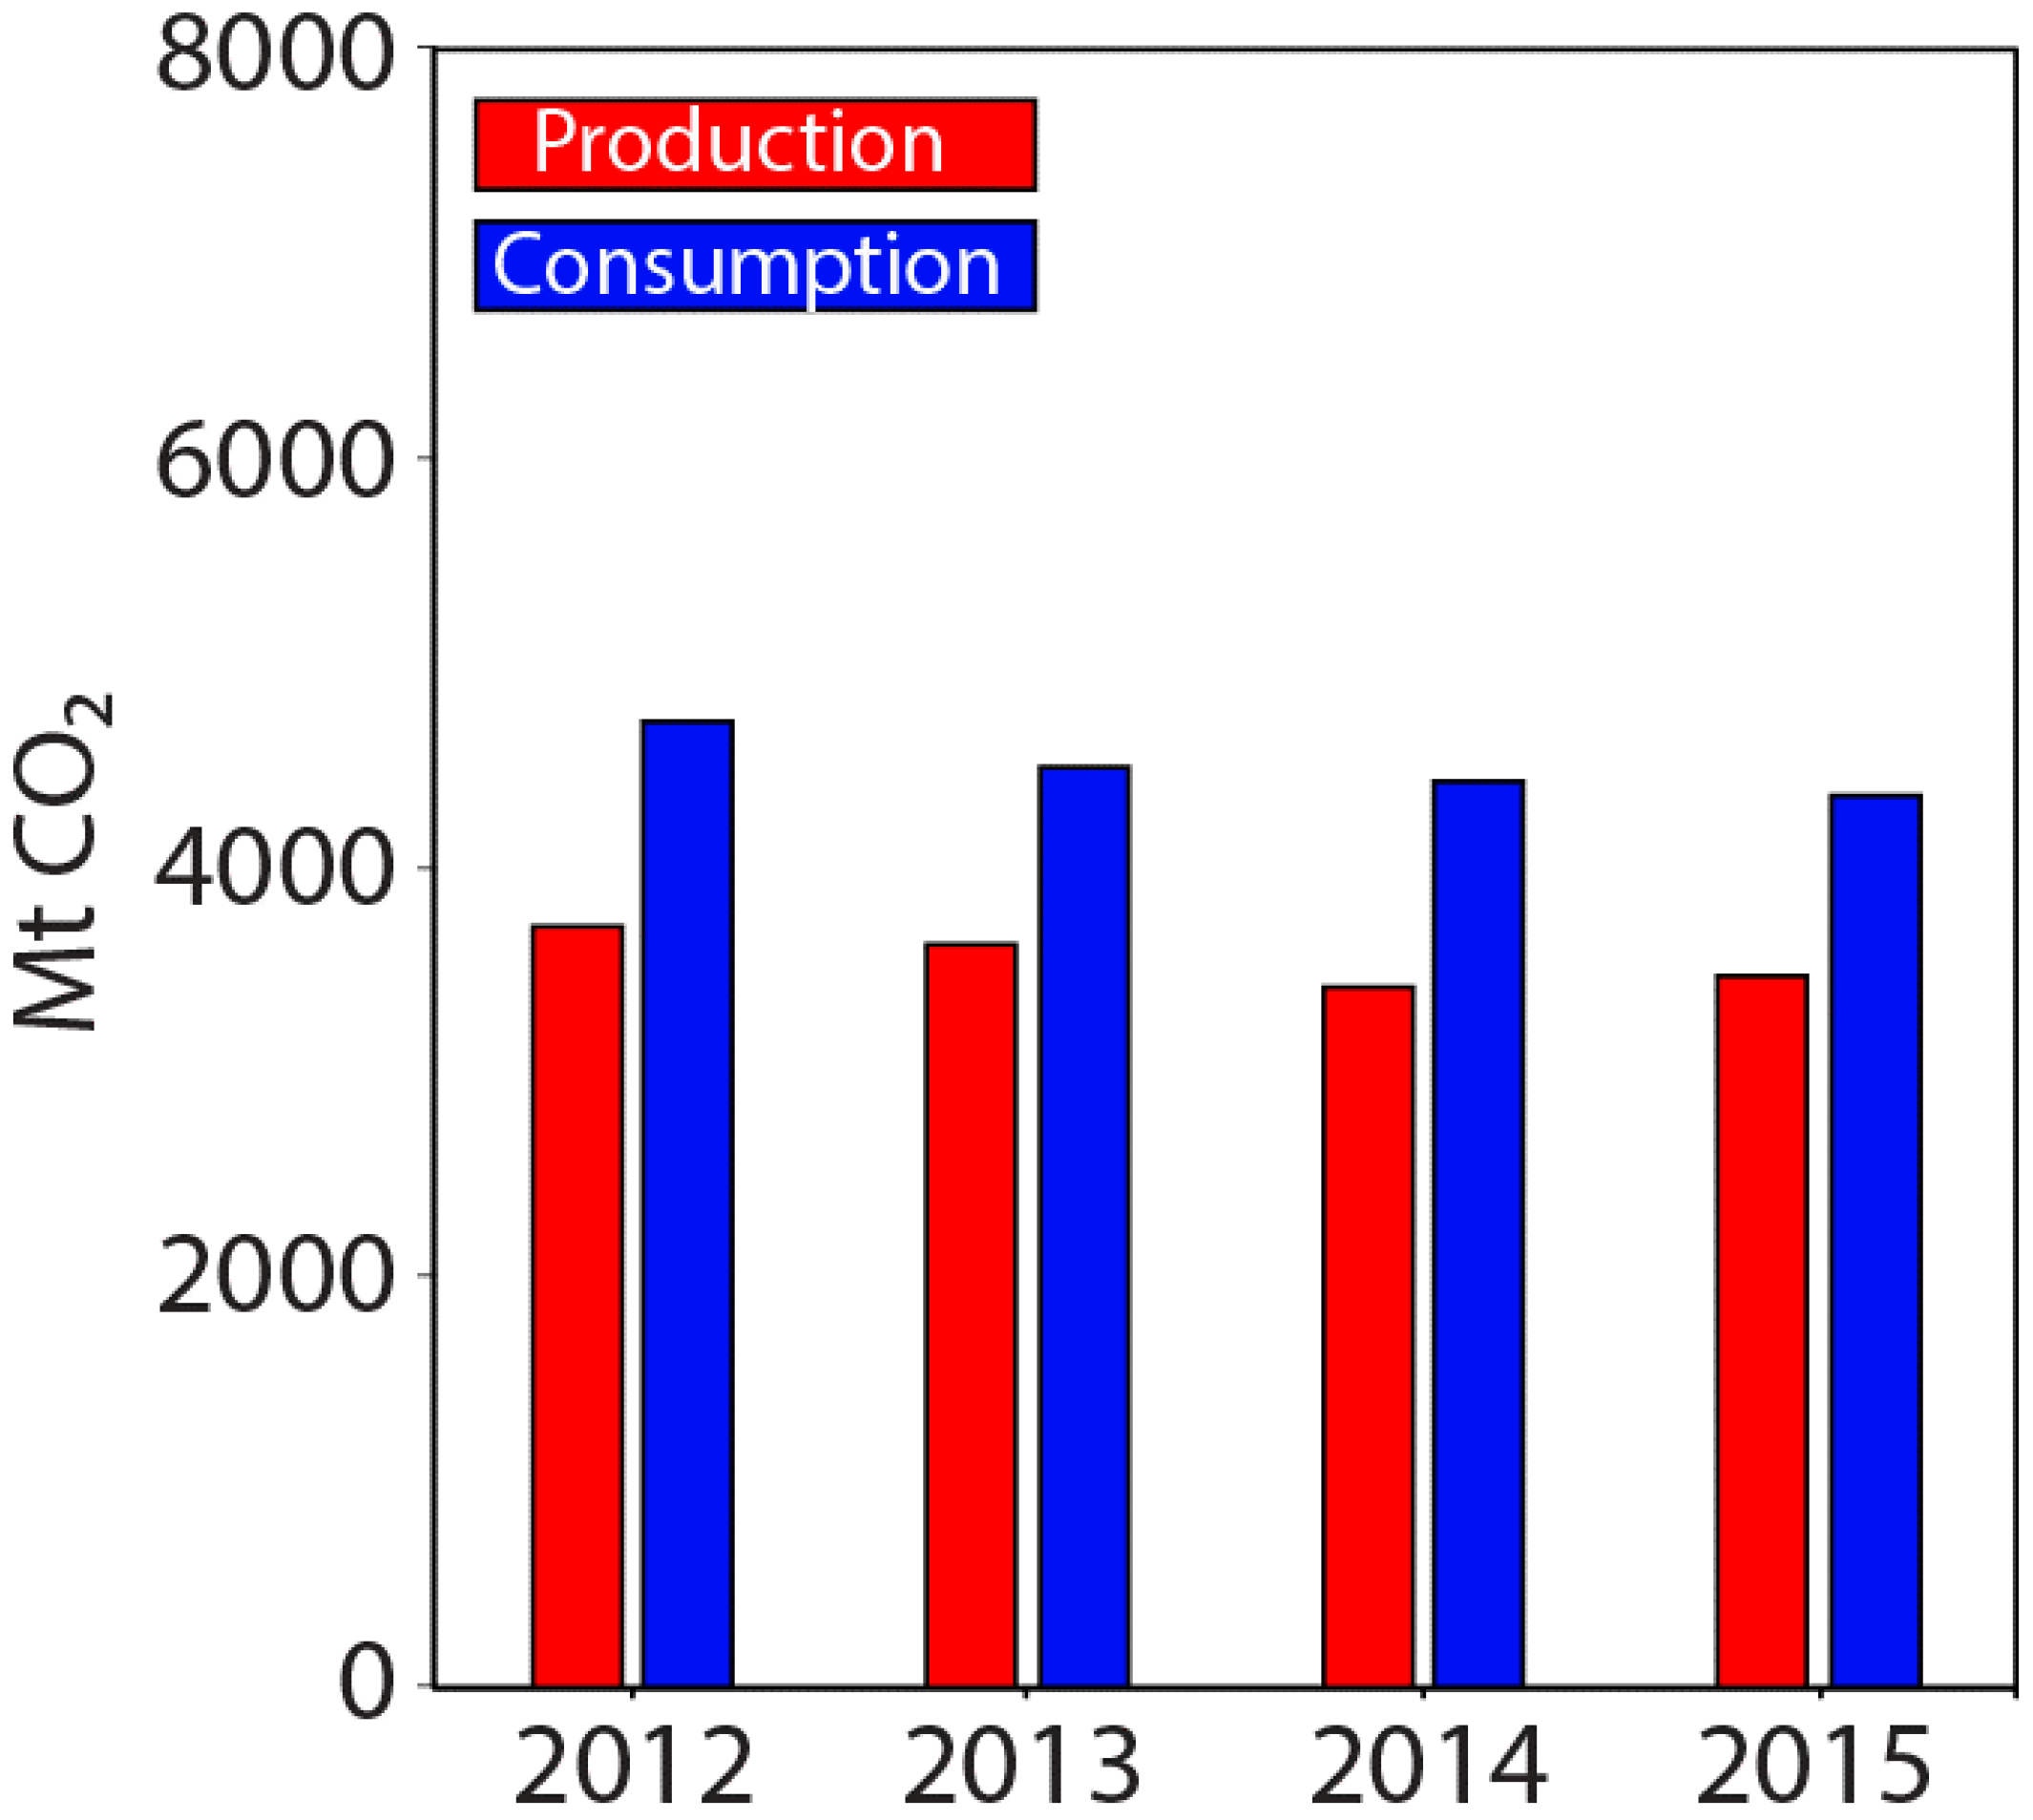
Data analysis suggests that both production- and consumption-related emissions slightly decreased in the EU over the analyzed years (−7% and −9% respectively,
Figure 1).
Indeed, in 2012, EU emissions due to production accounted for 3713 Mt CO2 while in 2015 they were 3470 Mt CO2. The EU consumption-related emissions were 4711 Mt CO2 in 2012 and 4341 Mt CO2 in 2015, respectively.
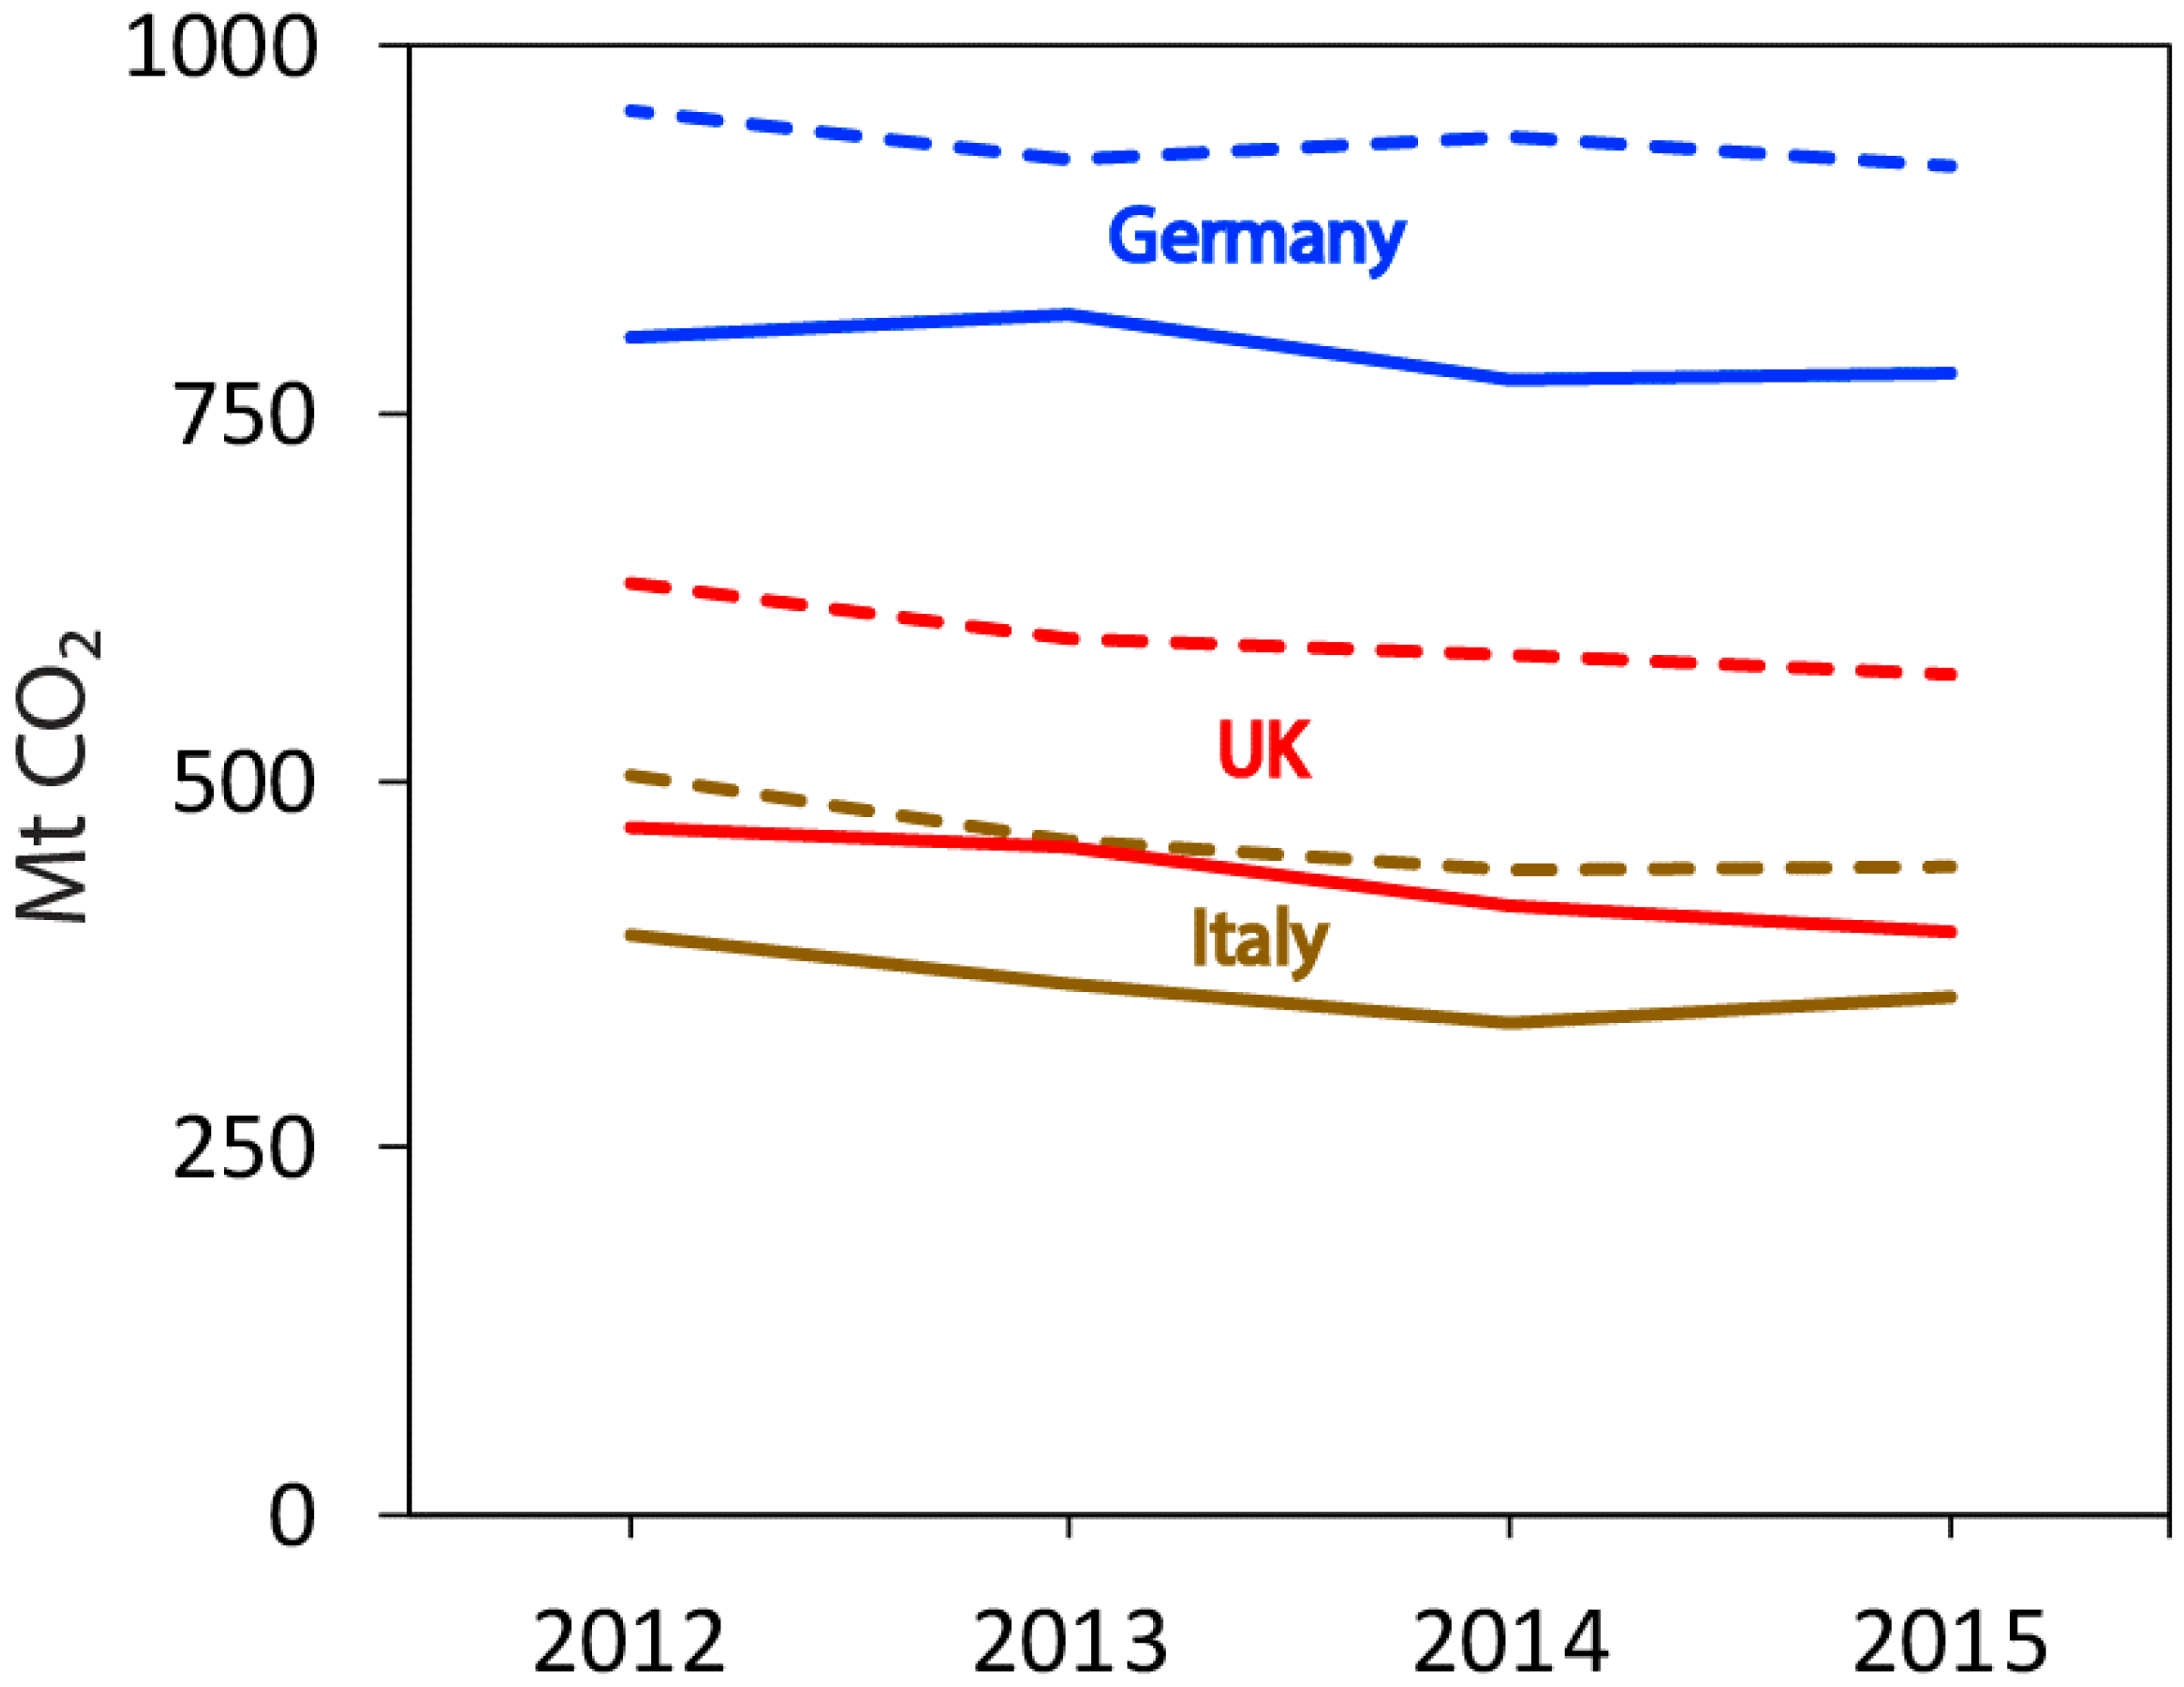
We observe that the three EU largest trading countries (i.e., Germany, UK, and Italy) were net importers of emissions (
Figure 2). Among them, in 2015, the UK had the largest value of emissions embodied in trade (175 Mt CO
2, followed by Germany with 141 Mt CO
2). The UK, however, also experienced the largest decrease in its own production-related emissions in the period 2012–2015, passing from 468 Mt CO
2 in 2012 to 399 Mt CO
2 in 2015
, with a reduction of 17%. On the contrary, Germany had the lowest decrease in its production-related emissions, (-3%, from 802 Mt CO
2 released in 2012 to 778 Mt CO
2 in 2015). When dealing with consumption-related emissions, Italy showed the highest reduction, (by 12%, from 503 Mt CO
2 in 2012, to 442 Mt CO
2 in 2015), while Germany had again the lowest reduction (4%, from 957 Mt CO
2 in 2012, to 919 Mt CO
2 in 2015). Overall, the trend of both production- and consumption-related emissions decreased for all three countries from 2012 to 2015, in line with the same trend emerging for the EU-28 as a whole. The difference between the two accountings remains remarkably high over the whole period for all the three countries taken into account. In particular, in the case of the UK (the object of the focus in the next section) consumption-related emissions exceeded production-related emissions by about 31% in 2015.
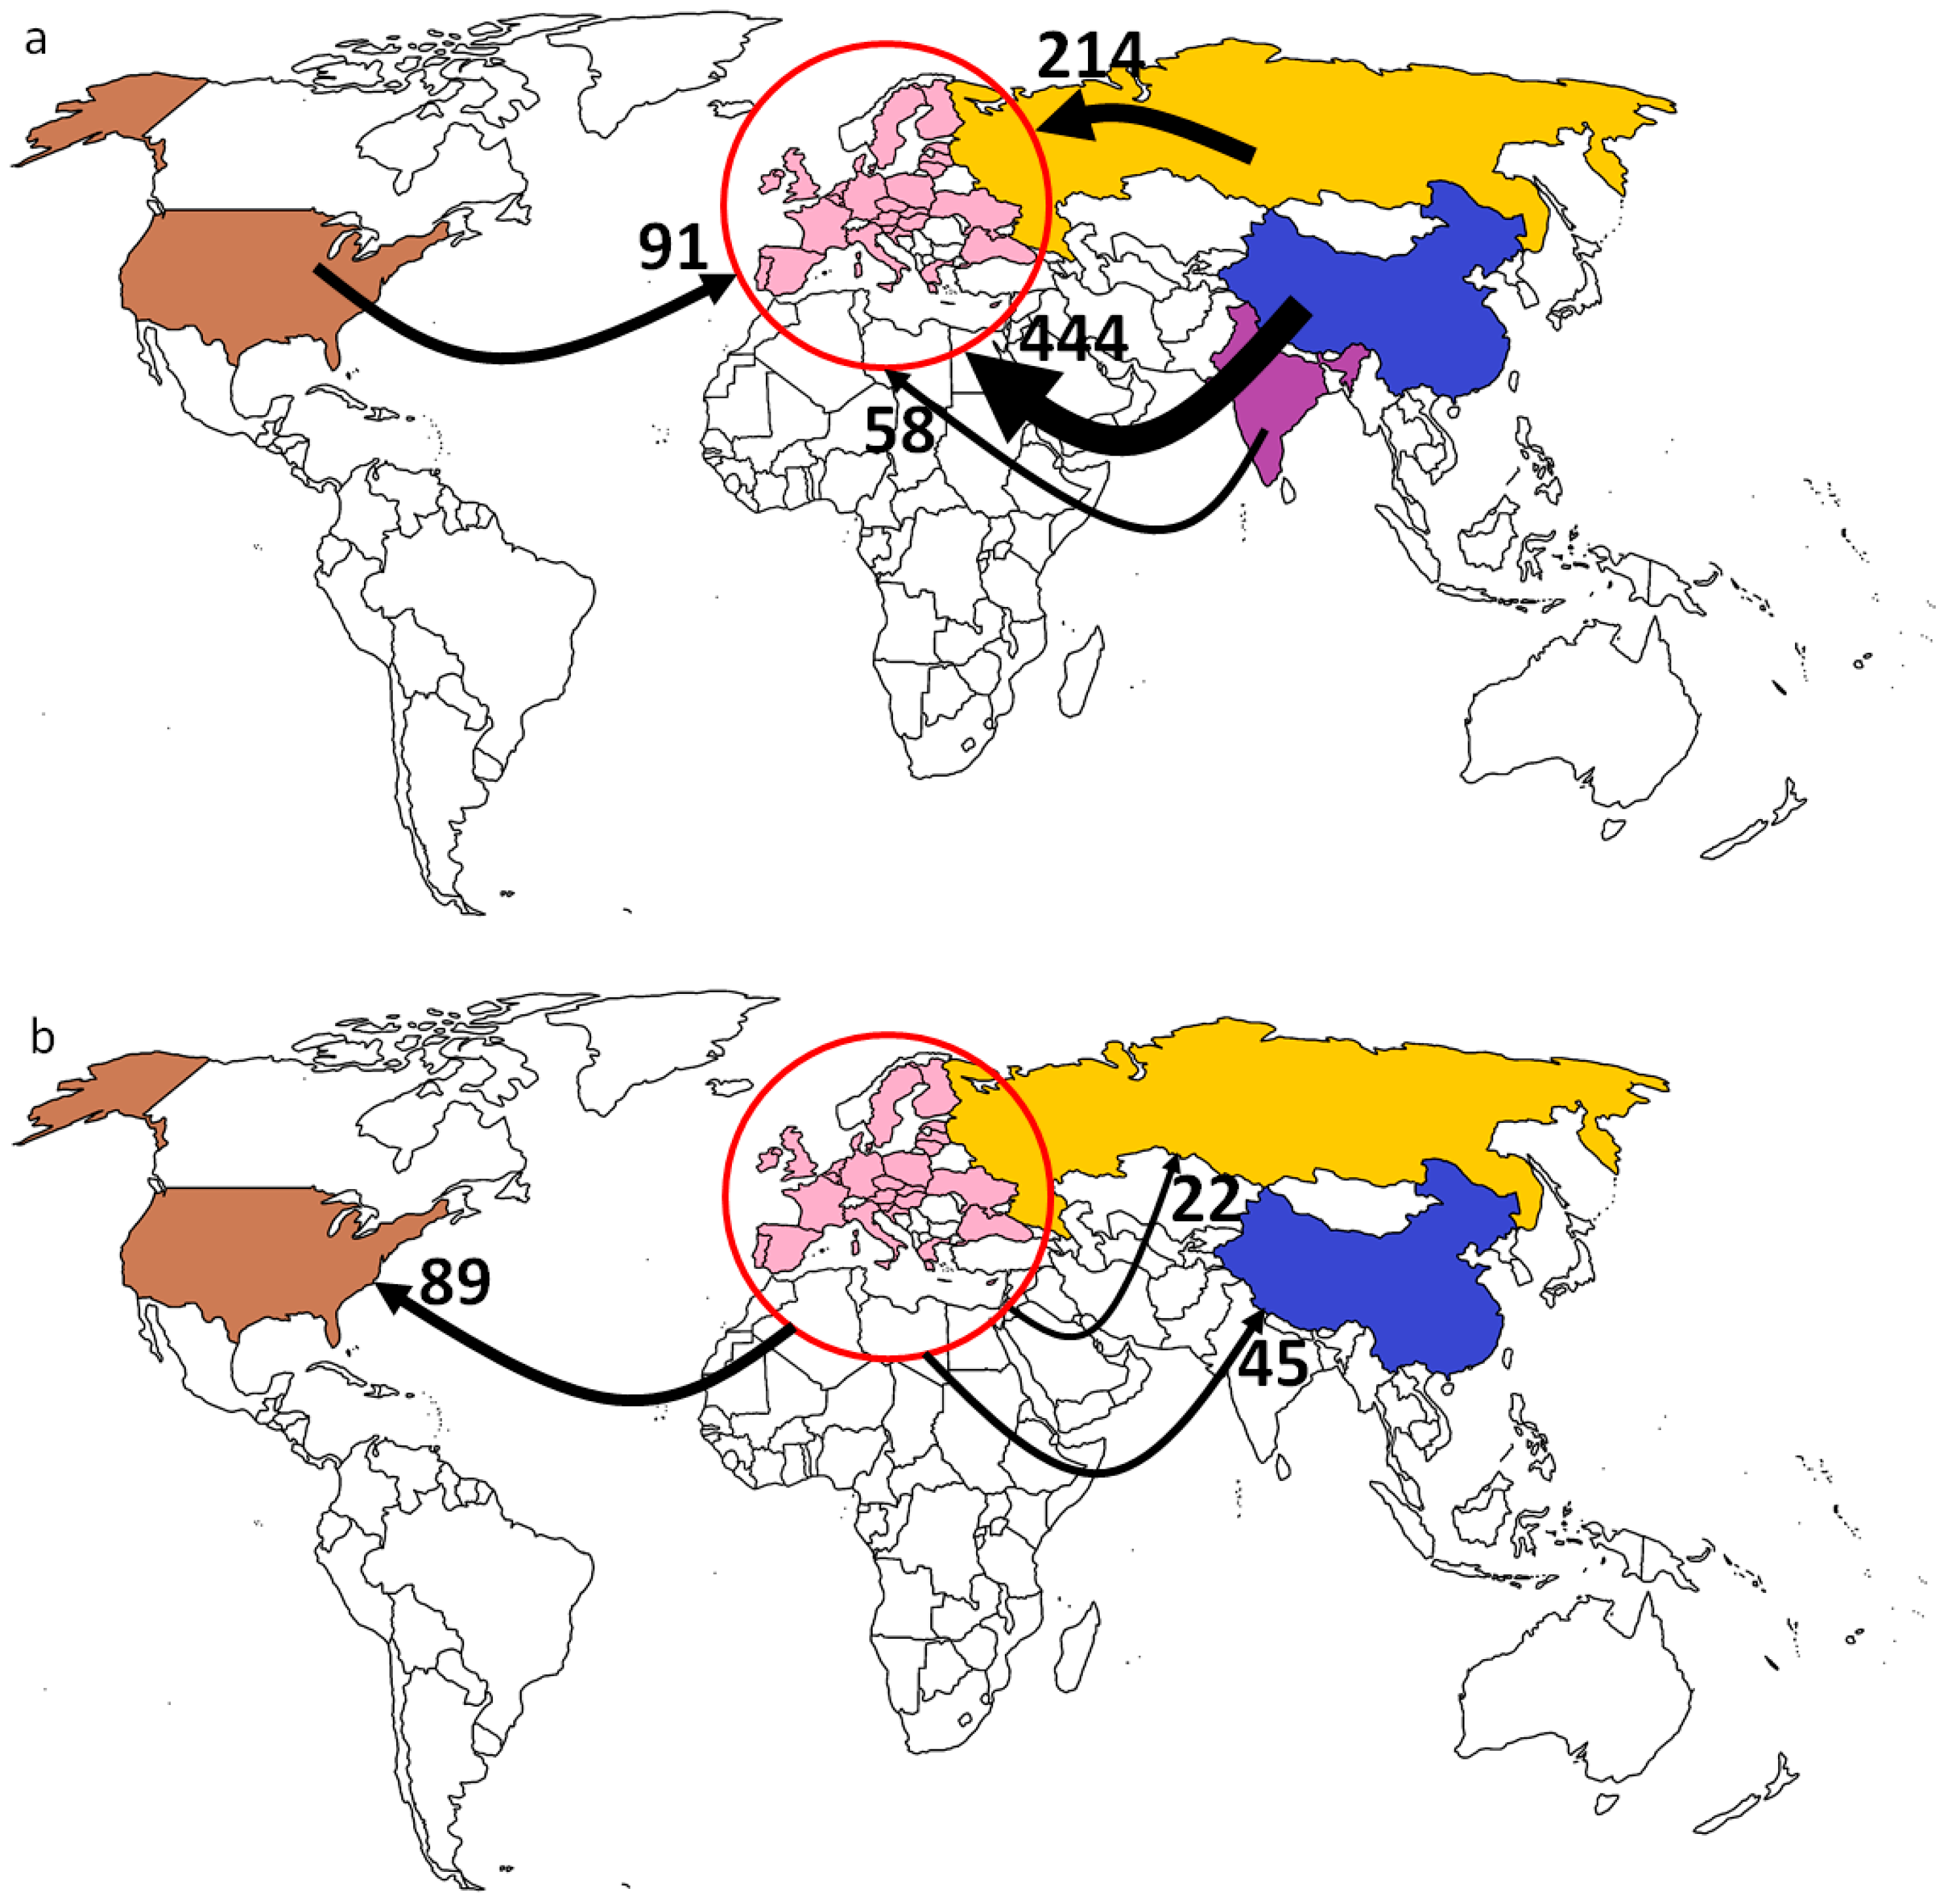
Figure 3a,b show that inward and outward EU trade-related emissions with the US almost cancel out (91 vs. 89 Mt CO
2). On the contrary, emissions imported from China and Russia turn out to be around ten times higher than the emissions exported to these countries. Indeed, in 2015, the EU imported from China 444 Mt CO
2 and exported 45 Mt CO
2 to this country. Similarly, emissions imported from Russia, in 2015, were 214 Mt CO
2 while those exported to Russia were about one-tenth (22 Mt CO
2). Overall, in 2015, the EU imported 1317 Mt CO
2 and exported 424 Mt CO
2.
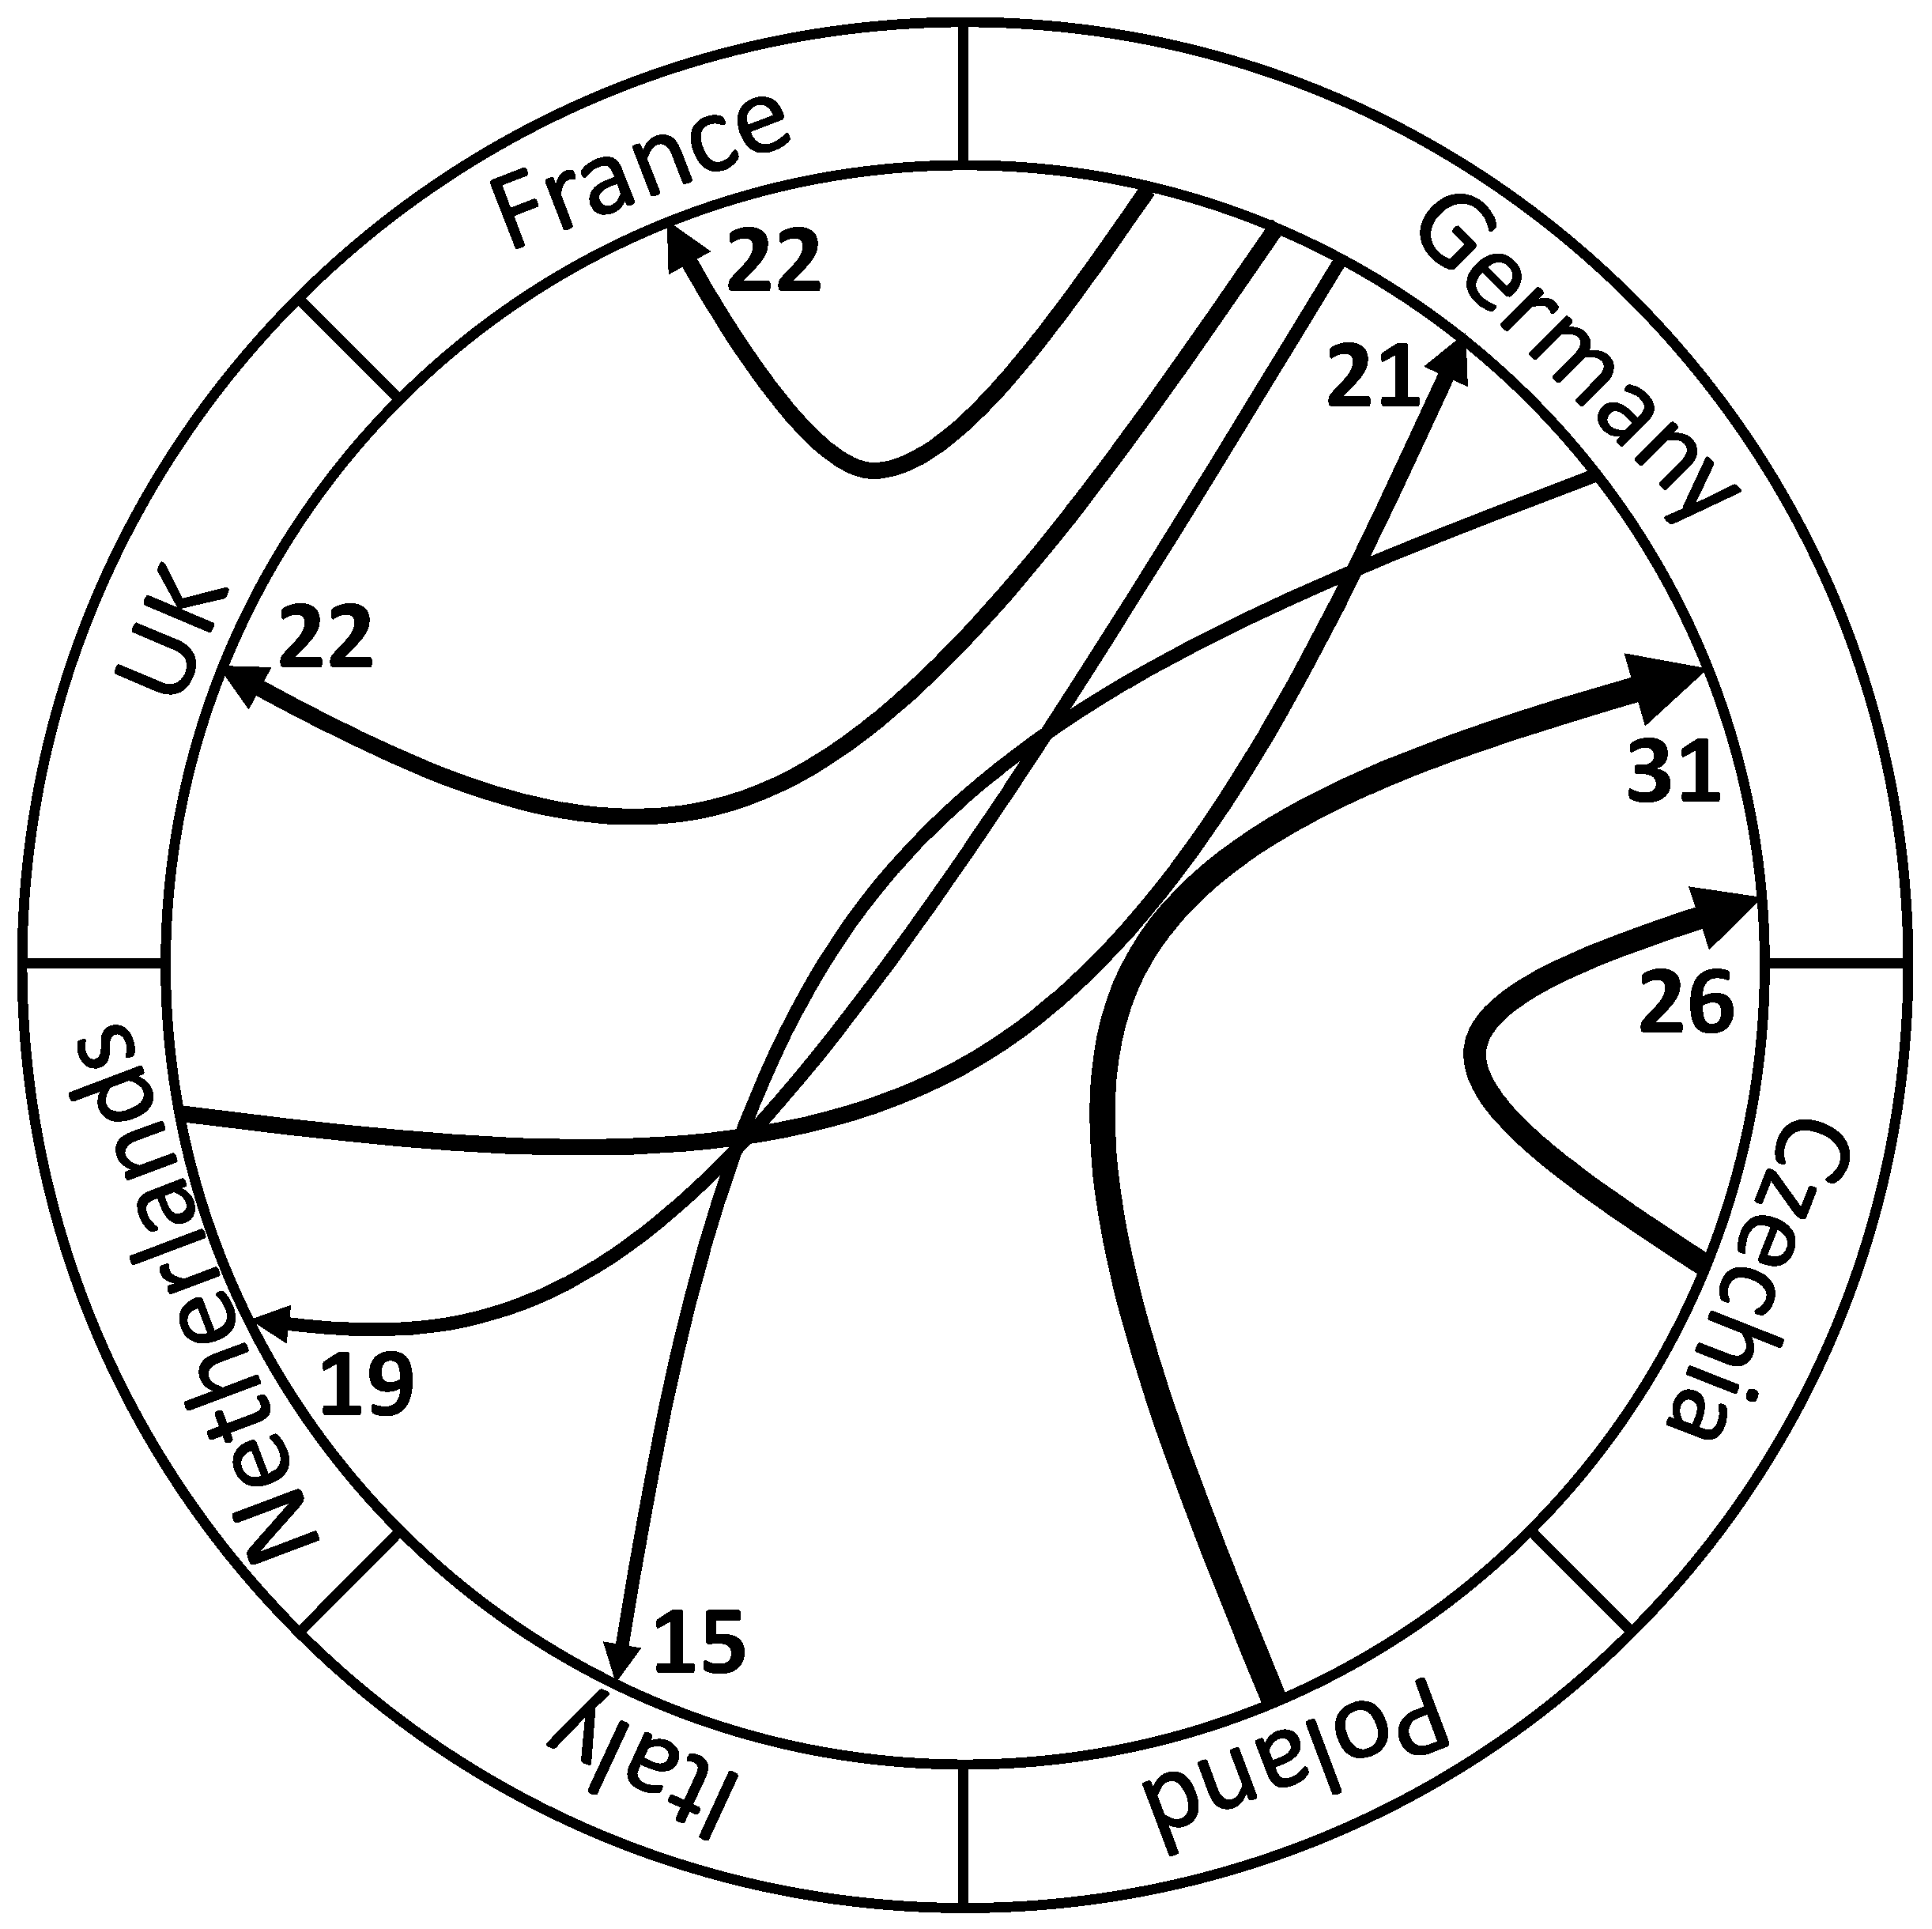
Figure 4 focuses on trade within the EU countries. The ball-like diagram of
Figure 4 emphasizes at first sight the central role played by Germany in the EU context, with all arrows (representing the largest fluxes of emissions) moving towards Germany or departing from it. In particular, the greatest flows of emissions were exported to Germany from Poland (31 Mt CO
2), Czechia (26 Mt CO
2) and the Netherlands (21 Mt CO
2). However, Germany was also responsible for a significant amount of emissions exported to EU countries. In particular,
Figure 4 reveals significant flows from Germany to France (22 Mt CO
2), UK (22 Mt CO
2), the Netherlands (19 Mt CO
2), and Italy (15 Mt CO
2). Somehow, Germany plays a key but also a balanced role in terms of emission flows within the EU, with emissions to and from Germany that tend to cancel out, while other countries shift their production and associated emissions elsewhere (importing more emissions than exporting them). Indeed, if we focus on trade within the EU, in 2015 Germany recorded about the same amount of CO
2 emissions exported and imported whereas the UK was a significant importer of emissions (79 Mt CO
2 imported emissions vs. 27 Mt CO
2 exported ones). Given the significant role played by the UK as a net importer (also within the EU), in the next section we will focus more specifically on this country and on the consequences that might derive from a change in its import paths due to the Brexit.
4. Focus on Brexit: Two Hypothetical Scenarios
After the UK referendum of 23 June 2016, concluded with 51.9% of the English electorate who voted to leave the European Union, the UK is now negotiating its withdrawal from the EU [
40]. The situation is still very uncertain at the moment of writing with several possible outcomes, including no deal between EU and UK. This raises questions on whether EU member countries will preserve their role as relevant exporters to the UK in a post-Brexit scenario and what would be the implications in terms of the UK emissions responsibility of a possible replacement of EU trade partners with some other non-EU countries. In this context, it becomes interesting, therefore, to focus on trading relationship between the EU and a post-Brexit UK. To address this issue,
Table 1 reports the UK’s main trading partners (column 1), the UK related import flows from these countries, both in monetary terms (column 2) and in terms of embodied carbon dioxide emissions (column 3), as well as the carbon intensity of the trading partners (column 4).
As the table shows (see column 2), Germany plays at the moment the lion’s part in the UK trading relationships expressed in monetary terms, followed by China and the United States. Almost all the countries that follow in the top 10 of the trading partners reported in column 2 belong to the EU, (the only exception being Turkey that is however on the edge of Europe and in a long-standing bargaining process with the EU).
If we focus on imports of CO2 embodied emissions, however, a different ranking emerges (see column 3). In 2015, China was by far the largest exporter of CO2 embodied emissions (60573 Mt) to the UK. Within the EU, the UK’s import flows came primarily from Germany (ranking second with 21820 Mt), the Netherlands (fifth with 10476 Mt), and Poland (seventh with 7682 Mt). However, many non-EU countries enter in the top 10 of the CO2 import flows beyond China: USA (third), India (fourth), South Africa (sixth), Vietnam (ninth). A possible shift from EU to non-EU trading partners deriving from the Brexit would then substantially alter the CO2 import flows for the UK in the near future. In particular, by capturing the trade effect in terms of emissions, the NCI method developed in this paper may allow to evaluate some hypothetical Brexit scenarios based on different assumptions.
These scenarios should be regarded as just speculative examples illustrating possible consequences of Brexit. However, they also reflect the ongoing debate in the emerging literature on international trade and national/regional outcomes of Brexit (see [
41] and the literature cited therein; see also [
42,
43] for a discussion of the future EU-UK relationships in terms of climate and energy policies). In fact, contrary to most scholars and existing studies (e.g., [
44]), some analysts and campaigners for Brexit ([
45]) argue that, in the post-Brexit era, the UK might easily reinforce its trade relationships with distant countries of the Commonwealth and of other non-EU world regions. This would reverse the process observed since modern globalization (see [
46]) in which groups of neighboring countries have become increasingly integrated, (what is known as “global regionalism” [
47]), leading instead to a “post-geography trading world” [
45] in which geographic proximity becomes progressively less important.
To account for this potential shift of UK imports from its traditional EU partners to geographically distant non-EU partners, in what follows we investigate two hypothetical scenarios. In the first one we assume that the UK reverts to Commonwealth countries that were traditionally important trade partners in the past and that share a common language and similar cultural background with the UK. In the second one we assume that the UK further reinforces its existing trade relationships with those non-EU countries that are currently the main exporters to the UK in terms of CO2 embodied emissions.
Scenario 1, therefore, has been performed considering the trading relationships between UK and five major Commonwealth countries (Canada, India, South Africa, Australia, and New Zealand). Scenario 1 assumes a shift of UK imports from EU partner countries to these five Commonwealth countries, equal to 10, 20, and 30%, respectively. Scenario 2 considers instead the three main non-EU exporter countries in terms of CO2 emissions flows to the UK in 2015 (i.e., China, India, and US), assuming a similar shift of 10, 20, and 30%, respectively, of UK imports from EU to China, India, and the US.
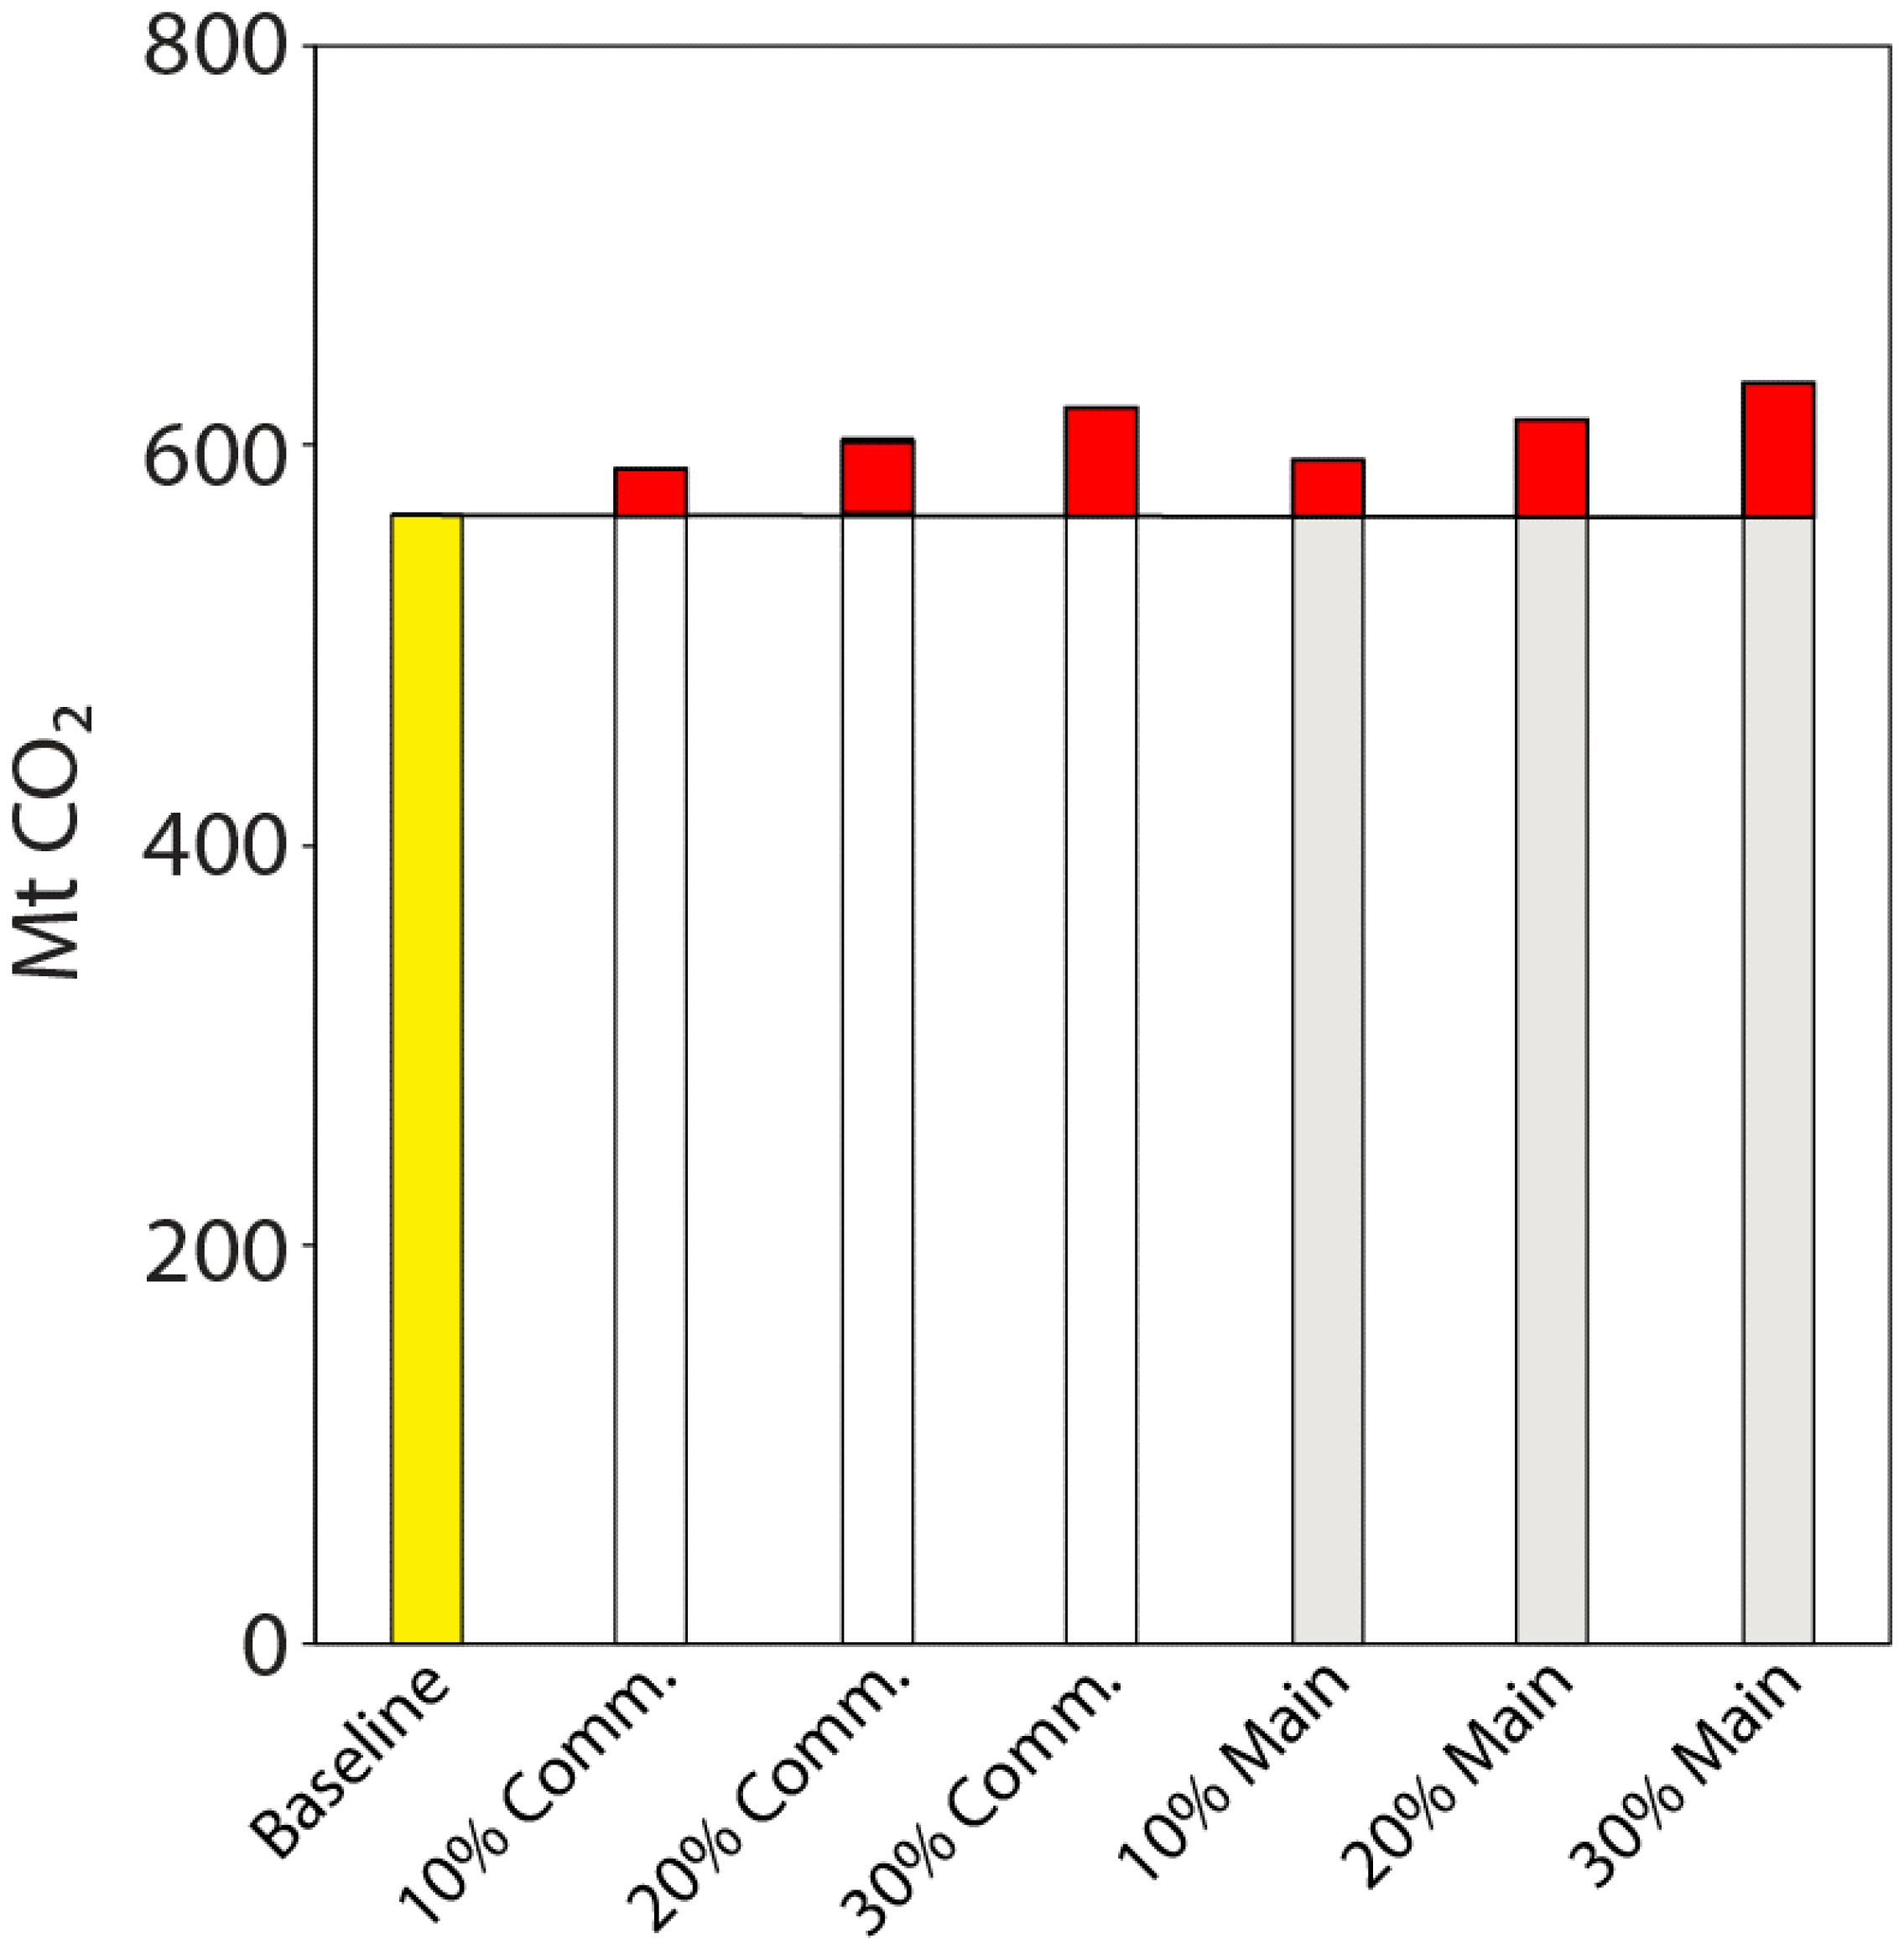
Results for Scenario 1 and Scenario 2 are presented in
Figure 5 and compared with the baseline results (UK GHG emissions computed using the NCI method). It should be noted that in both Scenarios the total amount of UK imports is the same as in the baseline scenario. In other words, we assume that Brexit induces a shift in the UK trading partners but that UK imports remain the same before and after Brexit.
Figure 5 shows GHG emissions associated with UK consumption according to the different scenarios proposed and reveals that in Scenario 1 the UK consumption-related emissions increase by 4, 6, and 9% with respect to the baseline applying a 10, 20, and 30% shift in imports, respectively. In Scenario 2 the UK consumption-related emissions increase by 5, 8, and 11% applying a similar 10, 20, and 30% shift, respectively.
The two scenarios, therefore, provide similar results, even though UK emissions responsibility would turn out to be slightly higher in Scenario 2. In particular, a shift of 30% of UK imports from EU to China, India, and the US would result in the highest increase of GHG emission responsibility for UK. This is intuitively appealing and in line with our a priori expectations. Indeed, based on the NCI method, the higher the carbon intensity of the exporter country, the higher the emissions level assigned to the importer country. Since China, India, and the US have on average higher carbon intensities compared to the EU and the Commonwealth countries (their average being 0.803 versus 0.3 for the EU countries and 0.67 for the Commonwealth countries reported in
Table 1, cf. column 4), the highest shift (30%) of UK imports from EU to China, India, and the US would result in the largest increase of GHG emission responsibility for UK (
Figure 5).
5. Discussion and Conclusions
In recent decades the EU has played a leadership role in the fight against climate change: it has created the European Emission Trading Scheme (EU ETS) that is the largest carbon market at the world level for the exchange of the emission allowances [
6]; it has progressively increased its emission reduction targets and has managed to achieve them well in advance with respect to the deadline originally proposed. Indeed, in 2008, the European Parliament and the European Council adopted the so-called “20-20-20” EU Climate and Energy Package which includes the climate targets that the EU commits to reach for the year 2020. Specifically, the EU aimed at reducing GHGs emissions by 20% with respect to 1990 levels, increasing to 20% the share of energy from renewable sources (RES), and increasing energy efficiency by 20% with respect to the same baseline year. These targets have already been achieved and actually exceeded in many cases. For instance, in 2014 GHG emissions abatement had already overcome the 20% target. Similarly, the improvement of energy efficiency involved all EU countries (though with some differences in terms of progress and targets reached), and energy intensity started to decline in the mid-2000s with a stable trend [
48].
Building on the “20-20-20” package and on the promising results obtained so far, the EU has decided to set more ambitious targets as part of a long-term strategy for the future. For this purpose, in October 2014, the EU adopted the 2030 climate and energy framework that sets three key targets for the year 2030: (i) reducing GHG emissions by at least 40% with respect to 1990 levels, (ii) increasing to at least 27% the share from renewable energy (with the target subsequently further raised to 32%); and (iii) achieving at least 27% improvement in energy efficiency (subsequently raised to 32.5%).
While the remarkable results obtained so far are certainly of primary importance to reduce the on-going global warming process, they might be partially affected by the existence of large import flows from other (non-EU) countries. In fact, such imports allow the EU to reduce its own emissions (as accounted by the current geographically-based methodology) by shifting elsewhere the production of the goods consumed in the EU. Indeed, the relocation of polluting emissions to other (often poorer) countries can conceal the actual emission responsibility of single countries.
To shed light on this aspect and get a deeper understanding on this issue, the present study has applied the NCI methodology to EU countries. Our analysis enables to reveal when trade may be environmentally beneficial or not in terms of GHG emissions. In general, when trade flows from a country with a lower carbon intensity to a country with a higher carbon intensity, the balance in terms of GHG emissions is positive as the exported product is produced in a more efficient country; vice versa, the balance is negative [
26].
Indeed, our analysis shows that for the EU as whole the emissions embodied in imports have always been higher than those embodied in exports. This implies that the EU should be regarded as more responsible for existing emissions if a consumption-based accounting like the NCI was in place. In particular, in 2015 the ratio between import- and export-embodied emissions was more than 3:1 for the EU-28 that imported 1317 Mt CO
2 from the rest of the world while exporting only 424 Mt CO
2. This ratio turns out to be particularly high in the case of some of the main EU trade partners with the emissions imported from China and Russia being around ten times higher than the emissions exported to these countries. Priority should therefore be given in the EU to mitigation efforts aimed at reducing not only the emissions released within national boundaries but also the emissions associated with consumption. As such, consumption-based accounting can be very important to evaluate current and prospective emissions situations (see [
49,
50]).
Moreover, large trade flows obviously exist not only between the EU and the rest of the world but also among EU countries. By applying the NCI methodology to trade flows within the EU, we can identify which countries import more from other EU Member States and thus tend to shift their emission responsibility to other EU countries. Among them, Germany and the UK turn out to play a key role, as one could reasonably expect given their crucial role in the EU economy. However, while Germany seems to play a balanced role in the EU context with import- and export-embodied emissions that tend to cancel out, the UK emerges as a net importer of emissions so that its emission responsibility would be largely increased if the NCI method was applied.
The recent Brexit decision might heavily affect the UK trade flows within the EU in the future, thus changing the emission responsibility of the UK and of its trading partners. To get a deeper understanding on this issue, in the second part of the paper we have advanced a few hypotheses on how trade flows could change based on the existing patterns and have recomputed the emission responsibility accordingly. Data analysis shows that a 10% shift of UK imports from EU partners to its main non-EU trading partners (India, China, and US) would enhance its emission responsibility by 5%. The increase in UK emission responsibility would more than double (+11%) in case of a 30% shift of UK imports. Similar results would apply if UK replaced its current EU partners with its main Commonwealth trading partners as a result of Brexit.
The Brexit scenarios described here should obviously be taken as a purely theoretical exercise, especially because—at the time of writing—Brexit negotiations are still ongoing and their final outcome appears rather uncertain. However, this exercise suggests that a possible shift of the future UK imports from EU to non-EU partners would substantially alter the UK emission responsibility. The latter would be likely to increase with a consumption-based perspective since non-EU partners have on average higher carbon intensity than EU partners.
We are fully aware that the application of a consumption-based accounting like the NCI method is not likely to occur in the near future since it would not be palatable for many importing countries that would see their emission responsibility increase. Moreover, given the current heated negotiations and debate among EU Member States on many different issues, a consensus in the EU would be hard to achieve at present on such a shift of perspective from a production to a consumption-based accounting. However, this does not mean that a computation of the emission responsibility through a consumption-based accounting that properly accounts for existing trade flows is not important or politically unfeasible in the future. On the contrary, in our opinion, the NCI method could provide an easy way to understand how much the EU is actually contributing to global emissions reduction and how much each country within the EU is doing so. This is particularly important if the EU wants to be a reliable leader at a global level in the fight against climate change in the future and if it wants to preserve an inner consensus on the EU climate policy in the years to come.


