Article

The Effect of HOPSCA on Residential Property Values: Exploratory Findings from Wuhan, China

1
School of Resource and Environmental Sciences, Wuhan University, 129Luoyu Road, Wuhan 430079, China
2
Department of Regional Planning and Management, School of Resources and Environmental Engineering, Wuhan University of Technology, Wuhan 430070, China
3
Key Laboratory of Geographic Information System, Ministry of Education, Wuhan University, 129Luoyu Road, Wuhan 430079, China
*
Author to whom correspondence should be addressed.
Sustainability 2019, 11(2), 471; https://doi.org/10.3390/su11020471
Submission received: 25 November 2018 / Revised: 8 January 2019 / Accepted: 11 January 2019 / Published: 17 January 2019
(This article belongs to the Section Sustainability in Geographic Science)

Abstract

:
Mixed-use development is theoretically considered to enhance the residential value of an area. However, limited empirical research has focused on European and North American cities. HOPSCA is a real estate project that integrates hotels, offices, parks, shopping malls, conference centers, and apartments. As an important mixed-use development project in Chinese cities, HOPSCA is designed to improve the quality of urban life and to enhance the residential value of an area. Few studies have explicitly examined the effect of HOPSCA on residential property values, let alone linked this question to particular types of HOPSCA. To bridge this research gap, we selected Wuhan City in China as a case study to explore the effects of HOPSCA on residential property values. Specifically, we used the potential model to quantify the effects of HOPSCA and used the geographically weighted regression (GWR) method to estimate the relationship between HOPSCA variables and residential property values. The results are as follows: (1) the effects of HOPSCA on residential property values are statistically significant with positive and negative effects. The balanced-development HOPSCA generated the greatest effects, with the highest premium of 10.76% placed on residential properties. Moderate price premiums of 3.57% and 1.83% were generated under the influence of the commerce-oriented HOPSCA and housing-oriented HOPSCA, respectively. By contrast, the business-oriented HOPSCA exerted a negative effect on residential property (−2.43%). (2) Significant spatial heterogeneity exists on the effect of HOPSCA on residential property values. The results showed that the influence of different types of HOPSCA, viz. the higher the compatibility between the HOPSCA type and the socioeconomic context of Wuhan, the higher the premium captured by residential properties within the city areas. HOPSCA benefits the improvement of the quality of urban life, which promotes urban development. For policy makers and real estate developers, our findings suggest that matching the development types and the spatial layouts of HOPSCA with the regional socioeconomic contexts is critical for enhancing the value performance of such projects.

1. Introduction

According to hedonic pricing theory, residential property value is based on the spatial mapping of the distribution of various facilities and the resources around the urban dwelling spaces [1,2]. Numerous studies on housing prices focus on living facilities [3,4], educational facilities [5,6], commercial facilities [7,8], and transport facilities [9,10] that meet the various needs of residents. With the improvement of people’ s living conditions, more research has increasingly turned to reveal the effects of specific urban resources, such as open spaces; green spaces [11,12,13,14,15]; and landscapes, such as, lake views and river views [16,17,18], on housing prices. Housing prices indicate the willingness of residents to pay for those facilities and resources when purchasing residential properties.
In recent years, a new form or project regarding real estate that integrates hotels, offices, parks, shopping malls, conventions, and apartments, known as HOPSCA, has flourished in many Chinese cities [19,20,21]. Integrating a variety of functions, including commerce, office, residential, and leisure, into a compact urban space, HOPSCA exhibits considerable advantages in creating a vibrant and efficient living space for urban residents [20,22]. With increased advantages in vitalizing urban spaces and optimizing life qualities, HOPSCA is viewed as promising and promotes the surrounding land values, which will be allow for generating appreciation in residential property values. It merits mentioning that China’s previous hedonic pricing studies have not considered this factor.
Existing studies on HOPSCA have been conducted mostly from the perspective of engineering construction, which address issues concerning the design function and site selection [19,23,24]. Although these studies aid in increasing our understanding of HOPSCA as a development mode to some extent, more research is required to reveal the effects of HOPSCA on residential property values [25]. To help close this research gap, this paper explores the relationship between HOPSCA-related variables (e.g., function type, site selection, accessibility, etc.) and residential property values. Specifically, we ask the following questions: (1) Are the effects of HOPSCA on property value statistically significant? If so, (2) what are the effects exerted by HOPSCA. (3) Does the effect reflect spatial heterogeneity? By exploring the spatial heterogeneity of HOPSCA’s impact on residential property values, we hope to provide guidance for the planning and development of HOPSCA. The salient contribution of this research is reflected mainly in our attempt to quantitatively measure the effect of HOPSCA on residential property values. Although many scholars measure factors that affect housing prices, such as parks, green spaces, transportation, and education, few studies have quantitatively measured HOPSCA, which is an emerging factor in understanding property values. This study tested the effect of HOPSCA on Wuhan City’s residential property values through the Hedonic pricing method. These findings will provide a reference point for similar studies in other Chinese cities.
Our study is organized as follows: Section 2 reviews and summarizes the related studies. Section 3 describes the methodological considerations, study area, data collection, and approaches used to quantify the relationship between the HOPSCA variables and residential property values. Section 4 presents and discusses the results. Section 5 concludes the study by summarizing the major findings.

2. Literature Review

HOPSCA is not a completely new notion. HOPSCA is the concrete practice of a mixed-use project under the guidance of mixed-use development [21,25,26,27]. In European and North American cities, both theoretical and empirical research on mixed-use development has long been carried out [28,29,30]. The central reason for the emphasis of those mixed-use developments is the creation of a diverse and dynamic urban environment [28,29,31,32]. From a public policy perspective, mixed-use projects are thought to help create a more vibrant and sustainable community [26,33]. The diverse and vibrant neighborhood created by mixed-use projects has been valued by academic research, and has even been considered as an important criterion for judging the success of such projects [32,34]. From the perspective of economic returns, the diverse functions of the mixed-use development bring more conveniences to neighboring regions, attract more creative and innovative talents, and bring financial success as an investment [35]. Successful mixed-use projects are financial rewards for developers and operators, as well as bringing amenity benefits for the community [36,37].
Although the efficacy of mixed-use development on residential properties has been increasingly recognized, few studies have sought to measure the performance of such projects [26,36]. Descriptive articles, case studies, claims by developers, and advocacy of community are dominant in the literature [36,38,39]. These articles are mainly found in professional and practitioner journals or books, while the number of discussions in real estate, economics, and urban planning research journals is limited. More than that, the existing empirical studies on the effects of mixed-use development on residential property values present disparate results. Koster and Rouwendal [40] employed semiparametric estimation techniques to study the effect of the mixed land use on housing values. The results demonstrated that a diverse community is evaluated positively by families, as households seem to be willing to pay a premium of about 2.5% for homes in mixed communities. Moos et al. [41] compared housing affordability in mixed-use areas and other parts of the city by calculating various economic indicators, such as household housing expenditures and average housing costs. The results showed that in mixed-use areas, housing prices are slightly higher than in other metropolitan areas. Nakamura, Peiser, and Tort [35] used panel regression to analyze the main financial indicators of residential properties within and outside the boundary radius of the mixed-use projects. The results showed the absence of a clear return premium for residential properties close to a mixed-use area. Kusumastuti and Nicholson [42] adopted a stated preference survey and mixed-logit models to investigate residents’ preferences for living in mixed-use neighborhoods. By comparing the weights that those residents placed on the costs of housing purchase and transport versus the neighborhood costs associated with mixed-use development, the results showed that most of those residents prefer to live in low-density single-use neighborhoods rather than in higher-density mixed-use neighborhoods. Summarizing the existing research, we found that the difficulties of measuring the effect of mixed-use development on residential property values were two-fold. Specifically, (1) the effect of mixed-use development should be embedded quantitatively into the driving factor system of residential property values. There is a need to choose unbiased indicators to explore the effects of mixed-use development on surrounding residential properties. (2) Choosing a suitable model to estimate the relationship between mixed-use development and residential property values under the framework of a hedonic pricing theory is necessary.

3. Materials and Methods

3.1. Methodological Considerations

This study seeks to measure quantitatively the effect of HOPSCA on residential property values; it involves two aspects. First, quantifying the effect exerted by HOPSCA is a key point in assessing the relationship between HOPSCA and residential property values. Accessibility plays an important role in the connection between HOPSCA and the surrounding communities [30]. Communities in proximity to HOPSCA can enjoy a pleasant living environment [38]. We selected accessibility as the proxy for the spatial interaction between HOPSCA and residential communities. Many methods were used to measure accessibility from different perspectives, such as space separation, cumulative-opportunity, and spatial interaction [43,44,45]. In most previous studies, spatial accessibility for a given type of facility was measured as the distance from the nearest facility, or the number or density of facilities within the neighborhood [46,47]. The nearest facility measurement assumes that the surrounding facilities other than the nearest one are not included in the possible destinations that the individual may choose. It is an unrealistic assumption, because developed transportation modes support the needs of people’s diverse facilities. The number of facilities within a neighborhood assumes that a facility situated just beyond the limit of a neighborhood (administrative unit or time/distance buffer) will not be accessible, and that all of the facilities within the neighborhood are equally accessible. This approach is questionable, because it does not take into account the impact of spatial barriers on facility accessibilities. Although these “classic” measurement methods are very popular because of their simplicity in understanding and calculation, their limitations are not negligible. In fact, the accessibility they provide is “one-dimensional” biased, because they ignore certain aspects of travel behavior, such as the supply side, space barriers, and so on. The gravity model-based approach is an important and useful method for measuring spatial accessibility. This approach assumes that the accessibility of the facility is a spatial interaction of origin, destination, and spatial separation. Specifically, as the spatial separation (travel distance or time) between origins and destinations increases, the spatial interaction declines and the facility accessibility decreases. Thus, with a greater demand at the points of origin, or with a higher supply capacity and/or attractiveness at the destinations, the spatial interaction increases and the facility accessibility increases [46]. The main idea of this method is to consider the impact of the demand (population) side, the supply (facilities) side, and the travel impedance on spatial accessibility [48]. Based on spatial interaction, this approach effectively combines urban activities, such as development opportunities or service facilities, and transportation systems, considering aspects such as travel distance, travel time, and other costs that can measure the potential of residents to carry out urban activities comprehensively and accurately [48].
Second, a proper model is required to measure accurately the relationship between HOPSCA and residential property values. Recent studies have shown that spatial heterogeneity is a critical problem that cannot be ignored when studying housing prices [49,50]. Housing is a unique good; on the one hand, it is a fixed location and durable, and on the other hand, its characteristics are difficult to change as the market demands change. The supply of specific housing attributes typically presents a distinct spatial pattern within the urban area. For example, compared with new urban districts, houses in the old town tend to be older. The market’s demand for certain housing attributes, such as high-quality school districts or multi-functional HOPSCA, is difficult to change in the short term. For those housing attributes that are partially scarce, a strong demand from the housing market has led to an increase in the housing attribute price. Demand preferences for housing characteristics and location attributes lead to spatial changes in housing attribute prices. Therefore, the imbalance between the local supply and demand in the housing market leads to spatial heterogeneity in the price of housing characteristics. A growing body of research has shown that controlling the location and spatial structure of housing is critical for interpreting house price differences and for obtaining accurate coefficient estimates in the hedonic house price model. However, space issues are not always fully addressed in hedonic applications [51]. The hedonic housing model typically imposes a constant price structure on the housing characteristics of the entire market area. Failure to incorporate spatial heterogeneity into the model will result in a coefficient bias and a loss of explanatory power, which may mask important developments related to the operation of the housing market. Geographically weighted regression (GWR) is a local modelling method that explicitly allows parameter estimates to vary spatially [52]. Instead of specifying a single model to characterize the entire housing market, GWR estimates a separate model for each point of sale and weights the observations based on their distance to this point, allowing for unique housing attribute price estimates at each location [53]. This approach is attractive, because it only considers the sales that are similar to the subject property and makes price adjustments based on the differences in the characteristics in that subset. GWR embraces the existence of spatial heterogeneity and has been used widely in residential price research [49,53,54]. In this study, considering that HOPSCA is not evenly distributed in urban space, communities in different places have different spatial accessibility to HOPSCA. Therefore, we wish to find out the spatial pattern of the impact of HOPSCA on residential prices.

3.2. Study Area and Data Sources

(1) Study area
Wuhan (113°41′–115°05′ E, 29°58′–31°22′ N) is the capital of Hubei Province and a typical provincial capital of the cities in central China. It covers an area of 8494 km2 and had a population of 10.77 million as of 2017 (Wuhan Statistics and Information Bureau, 2017). With an impressive economic strength, Wuhan’s gross domestic product (GDP) in 2017 reached up to 13,410.34 billion yuan ($2030.70 billion), ranking it among the top 10 out of 334 Chinese cities (Wuhan Statistical Bureau, National Bureau of Statistics, 2018). In 2016, the investment of real estate in Wuhan reached 25.17 billion yuan, occupying 35.5% of the city’s fixed-asset investment (Wuhan Statistical Bureau, 2017). Since its introduction in 2008, HOPSCA has experienced a decade of development in Wuhan. With a solid economic foundation, large population inflow, and a robust market demand, HOPSCA is now booming in Wuhan. As the core city in central China, a study on Wuhan’s HOPSCA will cast light on the construction of HOPSCA in other Chinese cities.
Recognizing that most HOPSCAs are distributed in the central areas of the city, we selected the main urban area of Wuhan as the study area; it encompasses a total area of 678 km2 (Figure 1). A residential community and an individual residential unit are the basic units of housing price research in China. The general residential community is usually a relatively closed area, enclosed by walls or fences in urban areas, with multi- or high-story apartment buildings, roads, green spaces, and ancillary facilities built inside [55]. These communities are usually built by a real estate developer with a variety of infrastructure and public services [18]. An individual housing unit is the property owned by a homebuyer in a residential community. To rule out the redundant data generated by individual differences (e.g., orientation, decoration, and balcony) of single-family homes effectively, the general residential community rather than the individual residential unit is selected as the basic study unit.
(2) Data sets
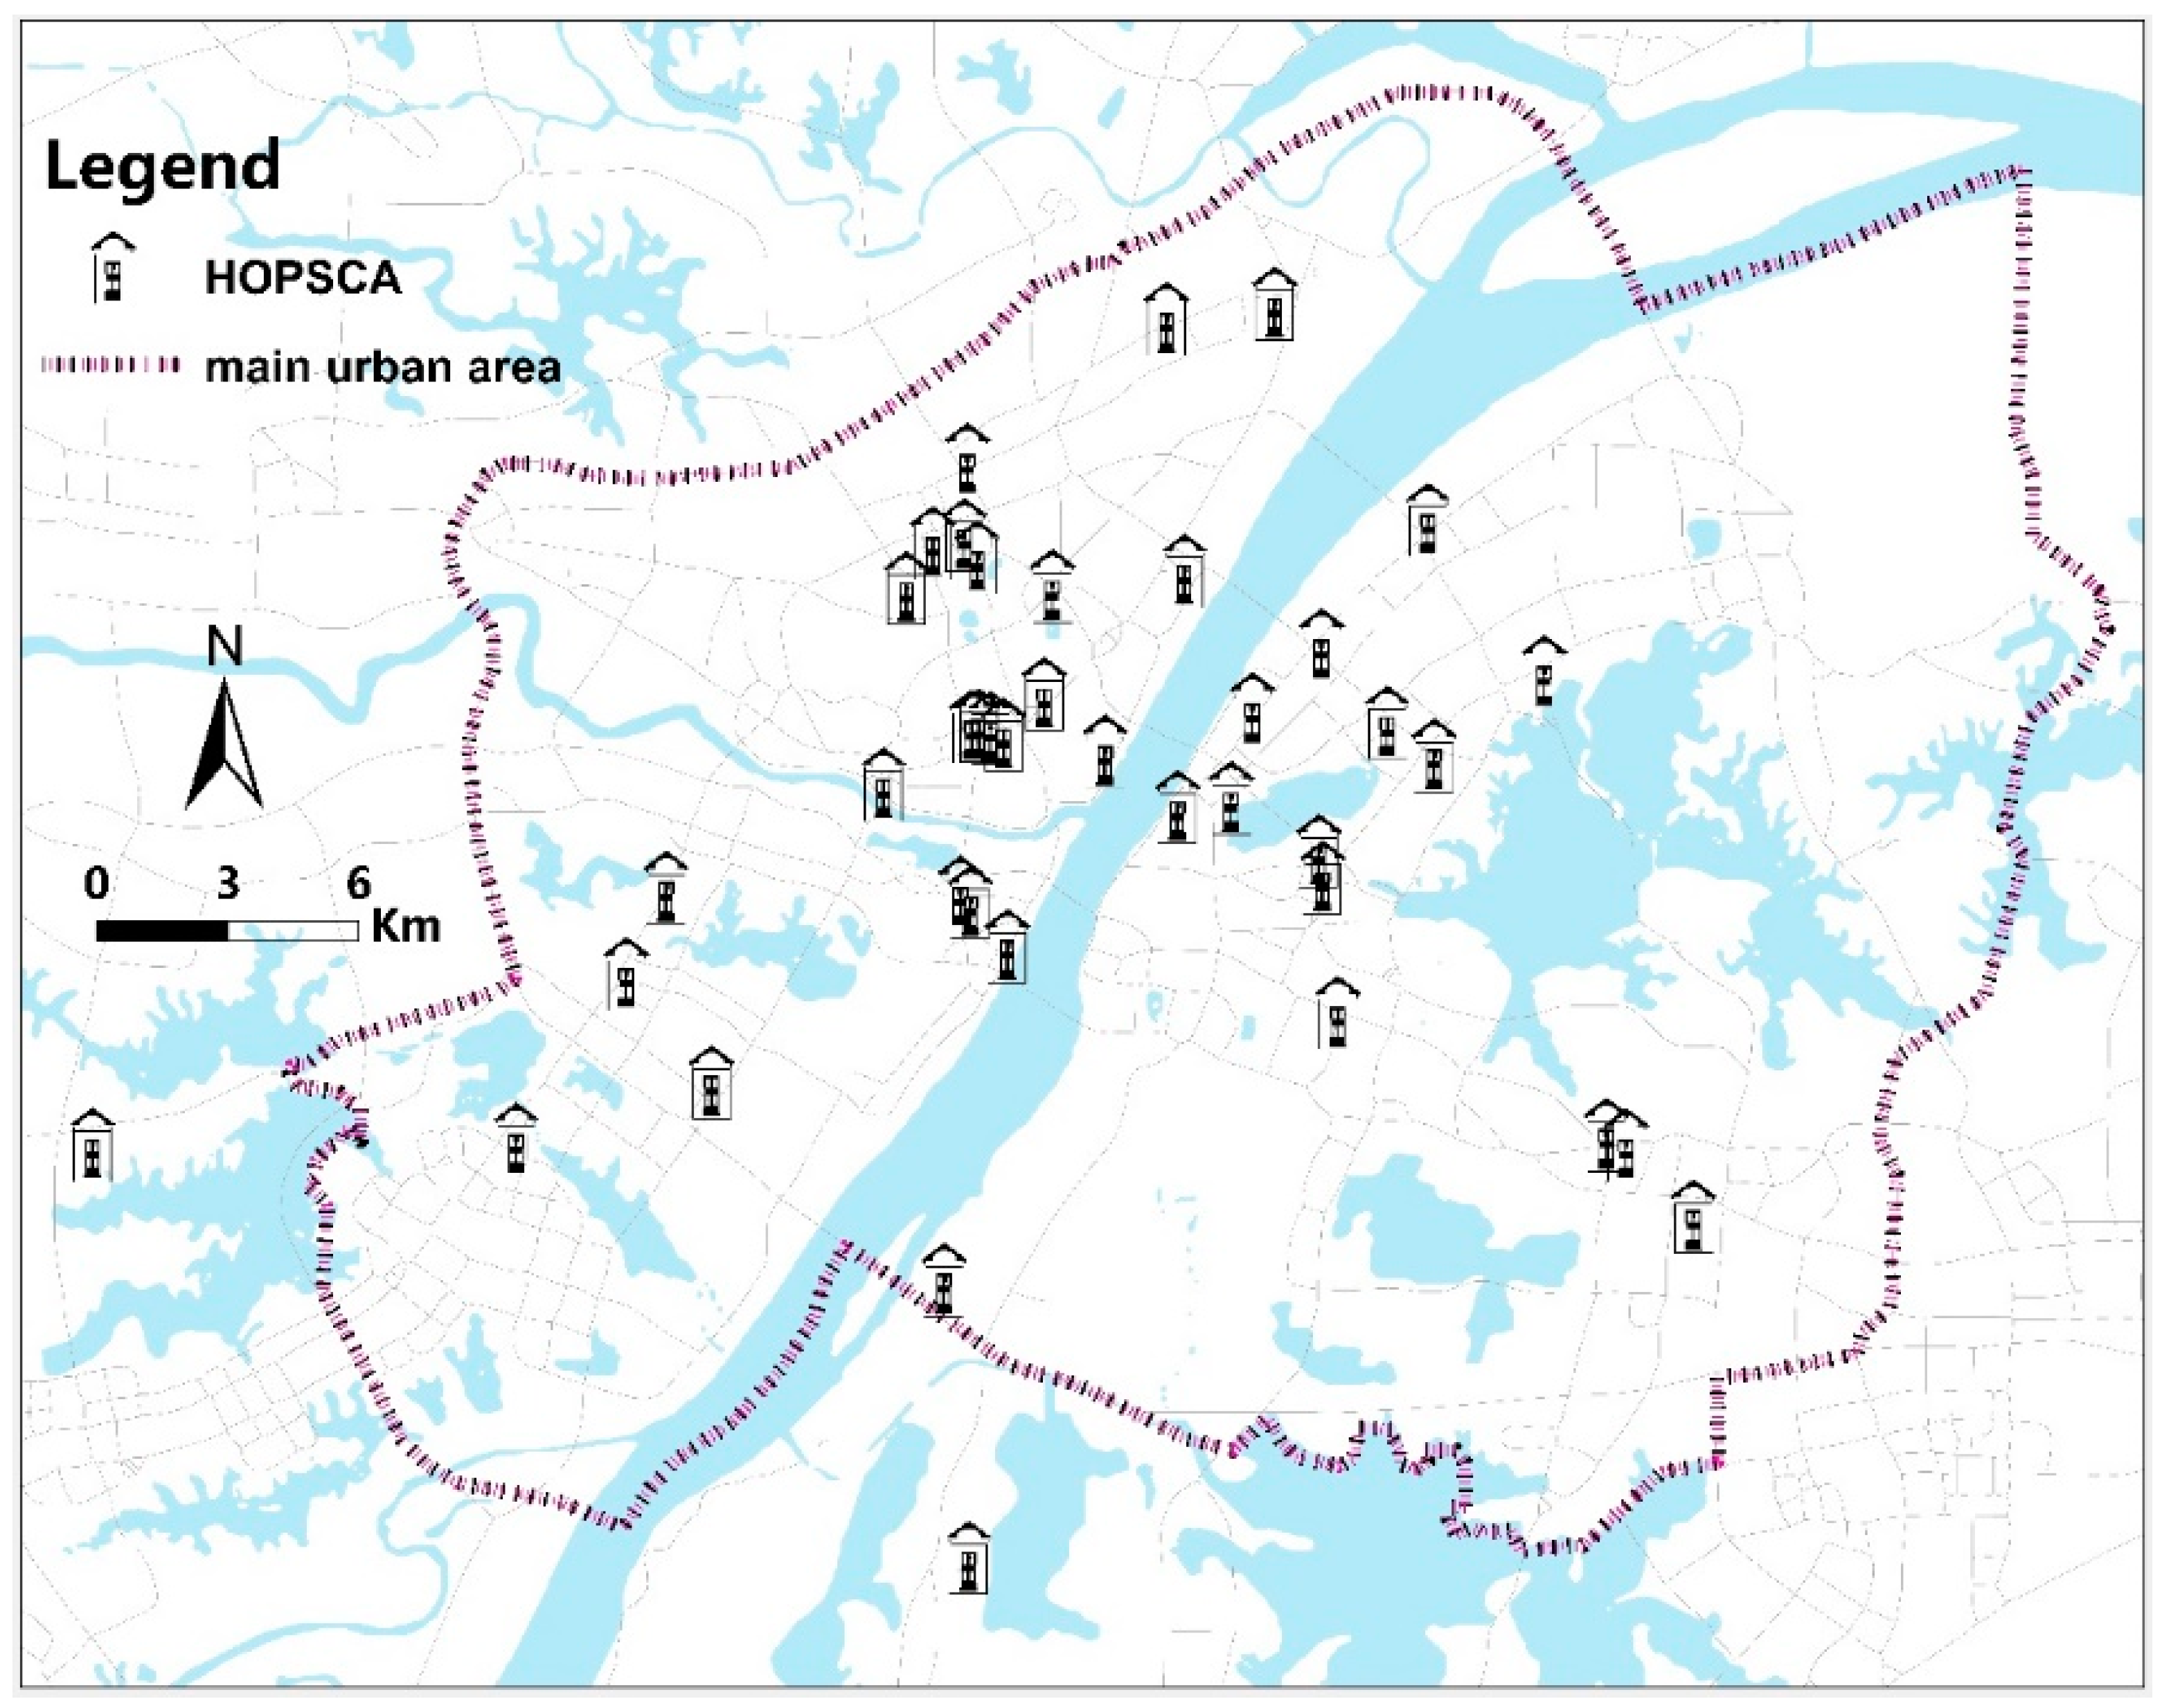
This study involves four datasets that are presented in Table 1. These data sets are as follows: (i) Transaction price data for the community and the community-related attribute data such as age of construction, plot ratio, green ratio, property management fees, and population. Transaction price data of the 1595 residential communities in June 2017 in Wuhan were collected from the website “fang.com”, which is a professional real estate online platform with the largest real estate project database in China. All of the selected price data were the market prices for residential communities in the form of the average housing prices (in Yuan/m2). We used the average trading price of the same month so as to minimize the effect of parameter instability [56]. (ii) The HOPSCA data for Wuhan. Overall, 42 HOPSCA of Wuhan with attributes of location, proportion of property, and time to market were collected from CricBigdata. We used the Gaode map to pinpoint the precise coordinate position of each HOPSCA (Figure 2). (iii) The points of interest (POI) data for Wuhan City. POI data are the core data based on location services. They usually contain information such as the name, address, longitude, dimension, category, and so on. A POI can be a school, store, tourist attraction, and bus stop. The degree of concentration of POI can reflect the level of public service facilities available in the area [57]. This data set was obtained from the Metrodatateam. The data set covers a wide range of transportation, educational, commercial, living, and leisure facilities of Wuhan City. We used this set to characterize the location and surrounding environments of the sample communities. (iv) The road network data of Wuhan. These data were obtained from the website “nature.com”, which provides detailed information on Wuhan City, including the road types and road lengths [58]. We used this data set for the subsequent analysis in discussing accessibility calculation and spatial visualization. Finally, we obtained the complete evaluation indicators of 1577 sample communities for the analysis.

3.3. HOPSCA’s Classification and Accessibility Calculation

(1) HOPSCA categorizing
Related studies show that heterogeneity exists in different types of HOPSCA because of their complex function combinations. Failure to categorize HOPSCA would create a bias in the results [26]. We classified the HOPSCA in Wuhan City into four types according to their dominant functional design, as seen in Table 2 [39]. Specifically, (i) commerce-oriented HOPSCA accounts for up to 38% of all HOPSCA. This type of HOPSCA is often composed of several super-large shopping malls or commercial streets, providing a large number of commercial facilities and a wide range of public events. These HOPSCA can generate a long-lasting flow of population and create a thriving surrounding commercial climate. (ii) Housing-oriented HOPSCA accounts for 36% of all HOPSCA. The main function of these HOPSCA is to provide an urban living space of a high-quality. This type of HOPSCA can attract urban populations to live in and improve the overall social vitality of the city. (iii) Balanced-development HOPSCA accounts for only 17% of all HOPSCA. Considering that any type of function can trigger high-intensity urban activities, this type of HOPSCA provides a balanced set of functions, covering commercial, office, and residential functions. A balanced-development HOPSCA attracts urban residents to carry out a wealth of activities, thus realizing the diversification of urban life. (iv) Business-oriented HOPSCA accounts for at least 10% of all HOPSCA. The main driving force of this type of HOPSCA is office buildings or office functions, which account for more than 50% of the total functions. Office buildings provide for a large number of enterprises, employ a large number of people, and provide the needs for other functions of the HOPSCA, such as businesses and hotels, which generate great social and economic value.
(2) Measuring accessibility to HOPSCA
This study used accessibility to measure the degree of potential that urban residents can access HOPSCA from their residential communities and urban transportation systems. The potential model is a gravity model-based approach that has been widely used to measure spatial accessibility to various public service facilities [4,59]. There are several crucial parameter settings involving this model that should be specified. (i) In order to establish a unified index to express HOPSCA attraction, we use the project scale to represent the service capability or the supply-side of HOPSCA. The huge scale is one of the major features of HOPSCA. The multifunctional design and diversified use of spaces of HOPSCA can be difficult to achieve without a large scale. The larger the scale, the greater the effect that can be exerted [38]. (ii) Unlike previous studies that included the population of a certain census tract, the demand factor in this study is calculated based on the population of the community residents, which better reflects the interaction between HOPSCA and the communities, otherwise known as the demand-side under the actual urban context. (iii) Accessibility to HOPSCA in this study is defined as the level of difficulty to access HOPSCA for the residents. GIS network analysis was employed to figure out the travel impedance between HOPSCA and communities in the form of minimum time. Because of the work by Karduni, Kermanshah, and Derrible [58], the city’s traffic network data formed by transit lines at different types and levels are well-prepared. This article adopts a widely-used and improved potential model formula, expressed as follows:
A i P = j = 1 n M j D i j β V j , V j = k = 1 m P K D k j β
where A i P denotes the spatial accessibility from community i to a certain type of HOPSCA; n is the amount of each type of HOPSCA, equivalent to 16 ,   15 ,   7 ,   or   4 ; M j represents the project scale of HOPSCA j ; D i j is the time cost between community i and HOPSCA j ; V j indicates the effect factor of the community population size; m is the amount of communities, m = 1577 ; P K is the population of the community k ; and β is the decay distance parameter. It is worth noting that the parameter setting of the travel impedance in the formula is complicated to determine. We set β to 2 in this study, based on the existing research results [4,8,60].

3.4. Hedonic Pricing Method

Residential property value is a complicated composition that is influenced by many factors [1,61,62]. Under the framework of hedonic pricing theory, housing characteristics are generally classified into the following three categories: a structure characteristic, neighborhood characteristic, and location characteristic [63,64]. In this study, based on the hedonic price theory, we considered the construction of the evaluation index system of housing prices from both comprehensive and accurate aspects. Specifically, we considered the following aspects when selecting indicators. (i) The residential property values are influenced by numerous factors, many of which are quite similar. To avoid subjective mistakes in selecting factors, we sought to contain all of the possible factors initially. (ii) Some indicators are strictly defined. For example, whether a residential community belongs to a school district does not mean geographical proximity, but rather a designation under the policy perspective. (iii) Take the actual urban socioeconomic context into consideration. Wuhan has developed into a polycentric city with the development of urbanization. Some previous evaluation indicators, such as the distance to the CBD, cannot fully depict the true location conditions [15,16]. We selected 17 explanatory variables and divided them into four groups, as shown in Table 3.
The structure characteristic group of variables describes the internal properties of a community. In this study, the age of the community (in years; the age of a community is 1, 5, or 7, built in 2016, 2012, 2010 respectively) (AGE), the plot ratio of the community (RPOLT), the greening rate of the community (RGREEN), and the property management fee (FEE) are the structural attributes of communities. AGE refers to the age of the community. RPOLT is an indicator of the intensity of use of construction land use, which relates to the comfort of living. RGREEN refers to the degree of green area covered by the community, and FEE reflects the management level of the community.
The location characteristic group of variables includes attributes associated with the quantity of service facilities. We used GIS software to set up a 1000 m buffer for the sample community and counted the number of facilities that fell into the buffer so as to characterize the surrounding environment of the community. Specifically, we used the number of bus stops and parking lots to calculate NTRANSPORT; the number of kindergartens, elementary schools, middle schools, education training organizations, and hospitals to calculate the NE&M; the number of parks, green spaces, and scenic spots within the buffer area of the residential community to calculated NLEISURE; the number of logistics networks, mobile business halls, hotels, barber shops, and shopping malls within the buffer area of the residential community to calculate NCOMMERCE; and the number of supermarkets, convenience stores, restaurants, and post offices within the buffer area of the residential community to calculate to NLIVING.
The neighborhood characteristic group of attributes reveals the socioeconomic, natural, and human–environmental conditions of the sample communities. The binary variables were used to quantify the corresponding situations, such as, whether it belongs to the designated school districts (EDUCATION; yes = 1, no = 0); whether it is located in the business circle (BUSINESS; yes = 1, no = 0); whether it covers any Metro stations, within 1000 m (METRO; yes = 1, no = 0); and whether there are scarce resources, such as famous lakes, river, parks, and so on, (LADNSCAPE; yes = 1, no = 0). Specifically, we found information on school districts, business circles, and Metro stations from the website “fang.com”. Well-recognized business circles were selected, including Guanggu, Hanzheng Street, Jianghan Road, Jiedaokou, Simengkou, Wuguang, Wangjiawang, Xudong, Zhongjiacun, and Zhongnan. The scarce landscape resources were chosen from the existing studies on Wuhan City [14,15]; they were the Yangtze River, the East Lake, the Moshui Lake, the Sha Lake, the South Lake, Jiefang Park, and Zhongshan Park.
The accessibility characteristic group of variables is the focus of this study, and is used to characterize the effects of HOPSCA on residential communities. Accessibility to four types of HOPSCA were quantified by the potential models mentioned in Section 3.3, namely, AHOUSING, ACOMMERCE, ABALANCE, and ABUSINESS.
Before the model estimation, we used SPSS software to perform data preprocessing (zero-mean normalization and collinearity diagnostics) on the 17 variables so as to remove any abnormal values and redundant data. The remaining 16 explanatory variables all passed the multicollinearity test, except for the NLIVING variable.

3.5. Estimation Model Specification

Under the framework of hedonic price theory, models such as OLS, maximum likelihood estimation of functions, semi-parametric, and non-parametric estimators are traditional estimation models to quantify the relationship between the housing prices and the effect factors [63]. The GWR model has been regarded as an explanatory tool to develop a better understanding of the relationships between housing prices and its factors by mapping local rather than global parameters [49]. A considerable number of studies have shown that GWR outperforms other related models in dealing with spatial heterogeneity issues [49,53,65]. Motivated by the necessity to address space issues, GWR is used in this study as the core analysis method. Under the framework of the GWR, the residential property value was set as the dependent variable and the four categories of variables were selected as the explanatory variables. The mathematical form of GWR can be expressed as follows:
P i ( u i , v i ) = β 0 ( u i , v i ) + k = 1 P β k ( u i , v i ) x i k + ε i , i = 1 , , n ,
where P i is the transaction price of community i ; ( u i , v i ) is the geographical location of the sample community i ; x i k ( k = 1 , , p ) is the k th explanatory variable of community i; β 0 ( u i , v i ) is the intercept term parameter of community i ; β k ( u i , v i ) ( k = 0 , 1 , , p ) is the regression parameter associated with the kth explanatory variable estimated at community i ; ε i is a random component assumed to be distributed independently and identically; and n is the number of sample communities, n = 1577.
It is worth mentioning that the distance metric selection and bandwidth size determination are key issues in the GWR model [66]. In this study, we used GIS software to run the GWR model. Under the GIS software, the kernel type and bandwidth methods are two parameters designed to solve the key issues in the GWR model. The Akaike information criterion (AIC) was used as the criterion to select the optimal result under the various parameter settings for the kernel type and bandwidth methods [67].

4. Results and Discussions

4.1. Spatial Pattern of Accessibility to HOPSCA

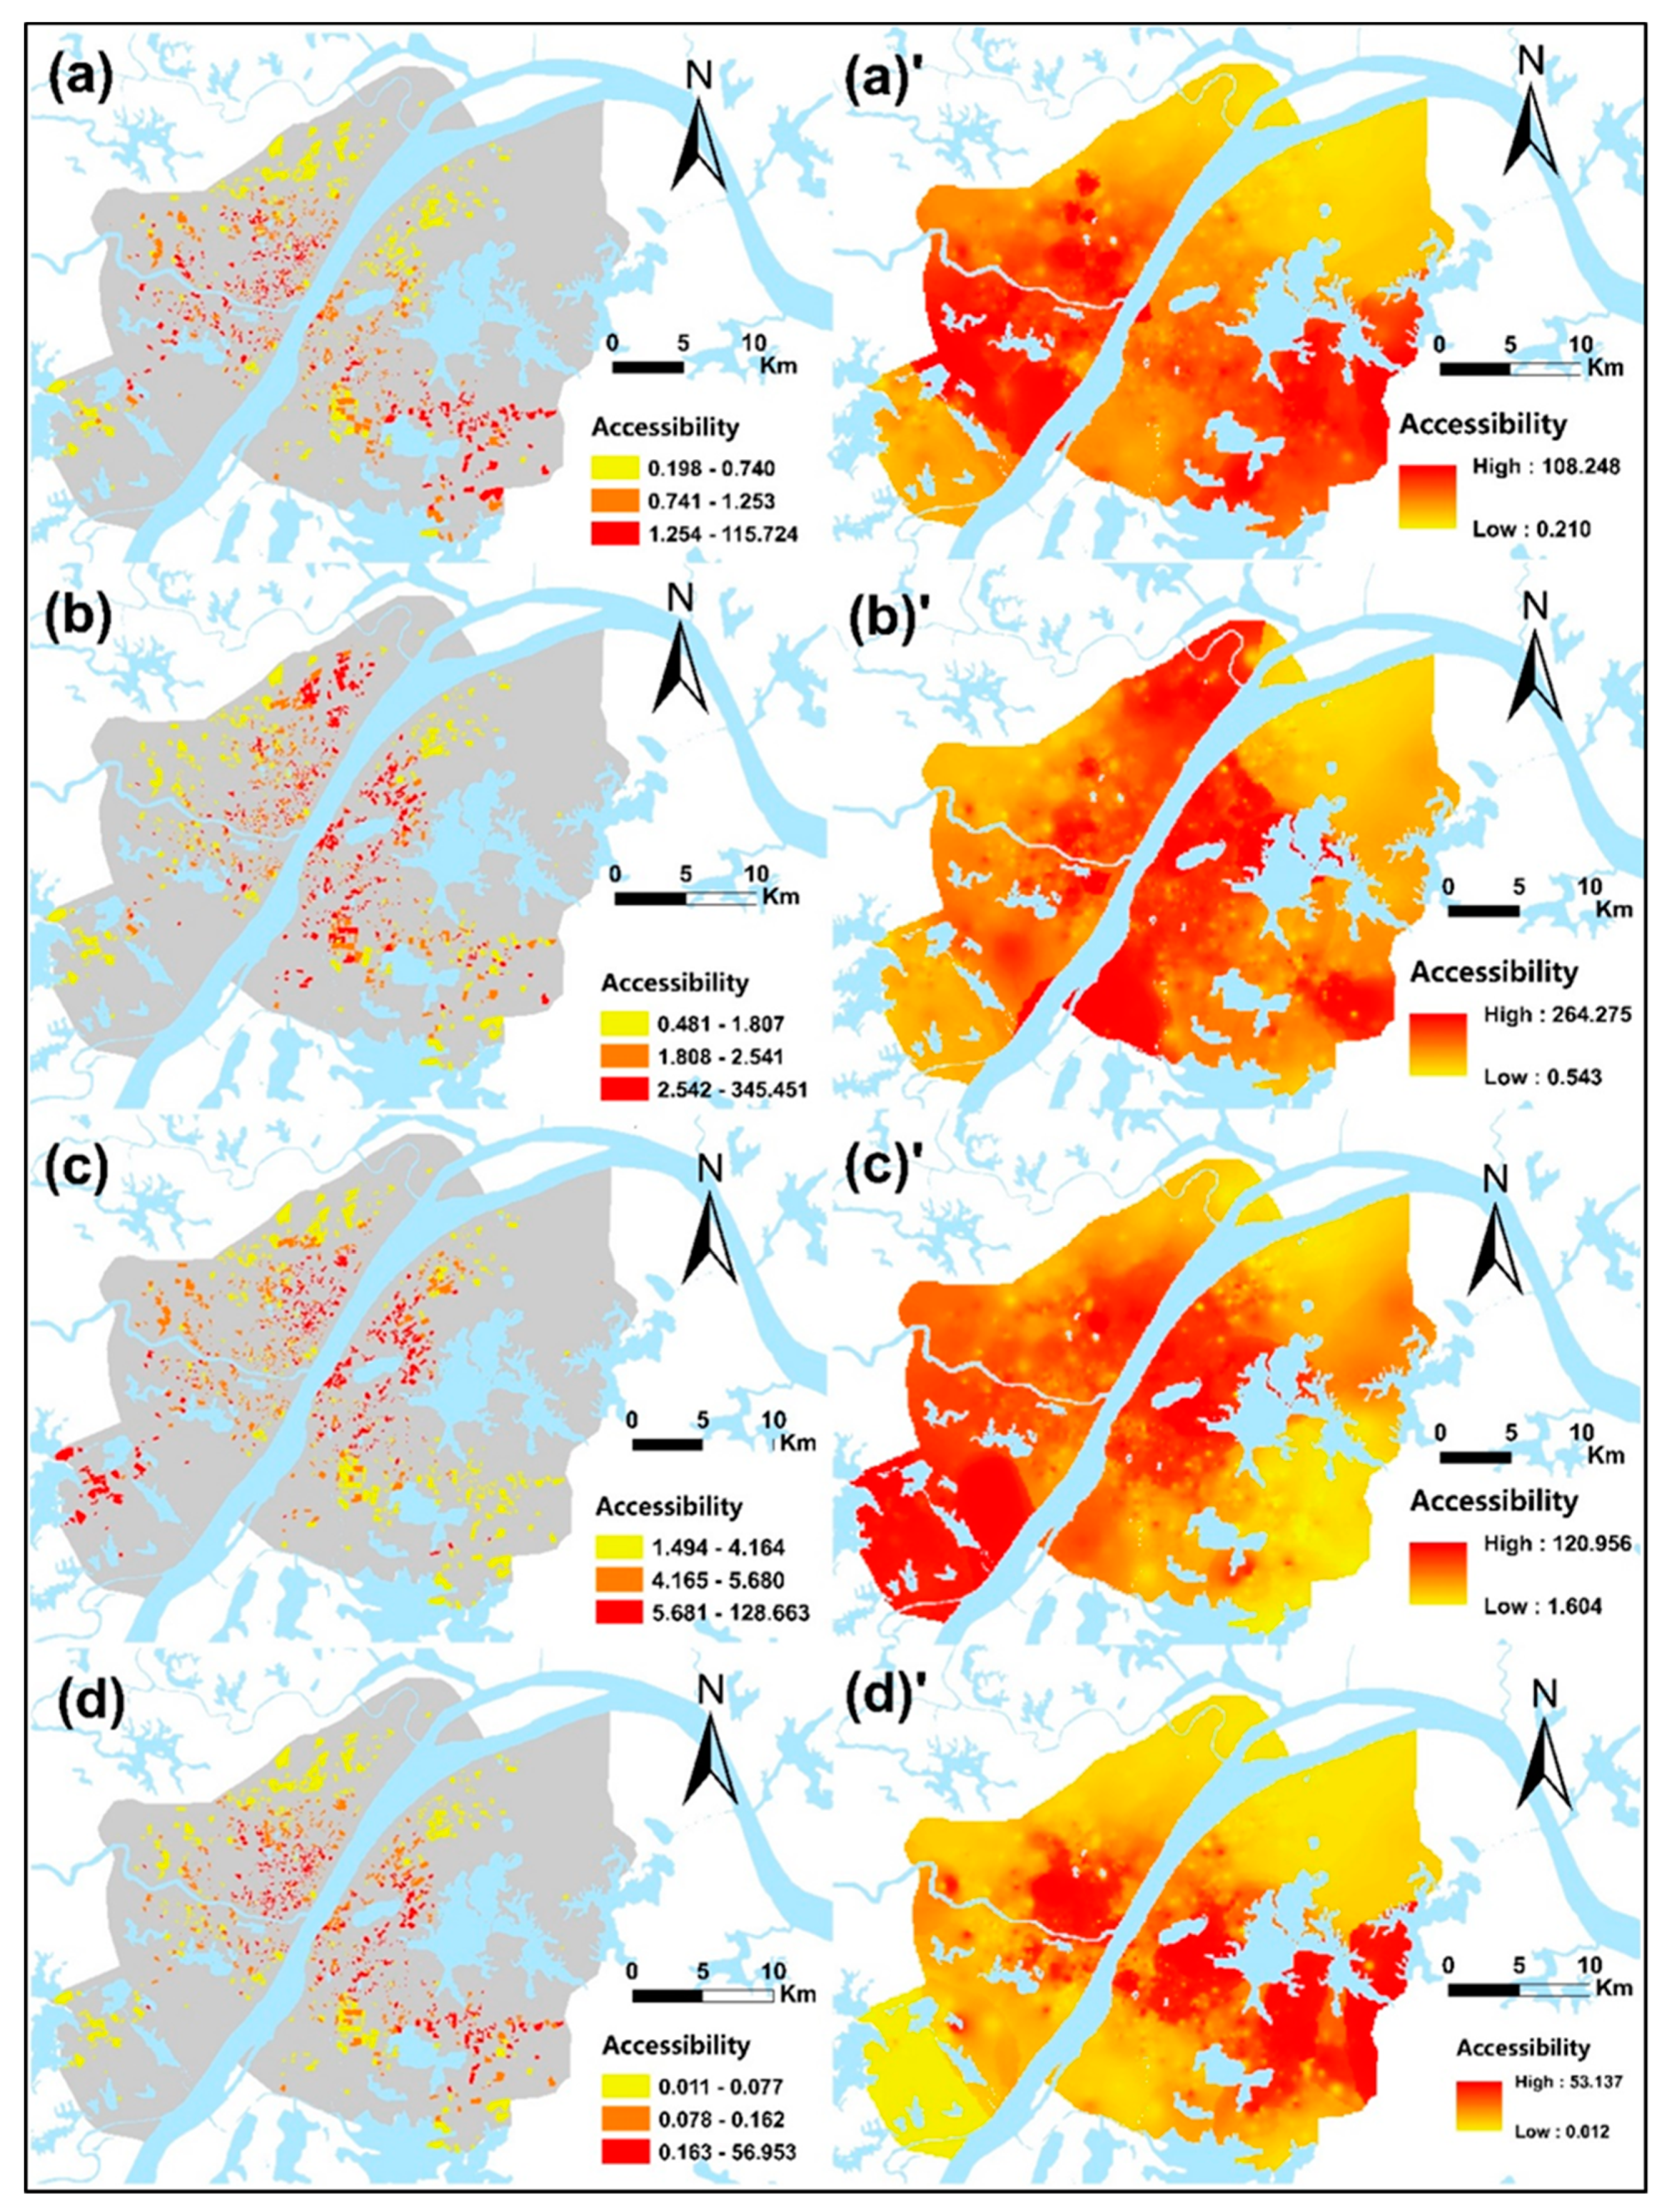
Based on the potential model, we calculated the accessibility to four types of HOPSCA, namely: ACOMMERCE, AHOUSING, ABANLANCE, and ABUSINESS. The statistical results of accessibility values under different types of HOPSCA are presented in Table 4.
The standard deviation values revealed the degree of dispersion of the HOPSCA accessibility values. The statistical results showed that the spatial accessibility values of both the housing-oriented HOPSCA and the balanced-development HOPSCA are dispersed, indicating that the accessibility values of these two types of HOPSCA have a large fluctuation range. The spatial accessibility values of commerce-oriented and business-oriented HOPSCA are small, which indicate that the distribution of accessibility values of these two types of HOPSCA is concentrated. Based on the perspective of space, four types of HOPSCA exhibit different accessibility spatial patterns in Wuhan, as seen in Figure 3.
The four types of HOPSCA exhibit the following spatial distribution patterns: (1) Communities with high accessibility to commerce-oriented HOPSCA are distributed along the northwest to southeast areas; these are perpendicular to the Yangtze River. (2) The accessibility values of housing-oriented HOPSCA decrease gradually from the two sides of the Yangtze River to the outskirts of the city. (3) The accessibility values of the balanced-development HOPSCA present a clustered pattern. High accessibility values are distributed mainly in the northeast and southwest region of the city. (4) The distribution of accessibility to business-oriented HOPSCA shows a core-periphery and compact pattern, whereas high accessibility values are concentrated in the central and the southeastern regions of Wuhan City.

4.2. The Overall Effects of HOPSCA on Residential Property Values

In this section, the GWR model was used to explore the effect factors of the Wuhan residential prices. The statistical significance of the coefficients was tested using the SPSS software. As shown in Table 5, we found a statistically significant relationship between the HOPSCA variables and housing values.
The regression coefficients of the GWR model cover both positive and negative values. From the perspective of the premium level of residential properties generated by various types of HOPSCA in Wuhan, most types of HOPSCA exert positive value effects. Among them, the balanced-development HOPSCA had the greatest potential for capitalization. However, the business-oriented HOPSCA had a negative effect on the housing prices. The premium levels resulting from four types of HOPSCA are ranked as follows: ABALANCE (10.8%) > ACOMMERCE (3.6%) > AHOUSING (1.8%) > ABUSINESS (−2.4%). The regression coefficient indicates that the value of the residential property increased by 10.8% under the influence of balanced-development HOPSCA, ceteris paribus. A premium of 3.6% was captured in the surrounding residential properties under the effect of commerce-oriented HOPSCA. Similarly, housing-oriented HOPSCA (1.8%) had a positive effect on the surrounding residential communities. However, unlike the effects of the three types of HOPSCA described above, the accessibility of the business-oriented HOPSCA (−2.4%) has a negative effect on housing prices.
In fact, the effects of HOPSCA on residential properties are not necessarily positive. Rabianski, Gibler, Tidwell, and Iii [36] pointed out that when the mixed-use project exhibits an independent and introverted character that fails to integrate into the community, its accessibility advantages and nuisance shortcomings may affect residential property values. The HOPSCA (commerce-oriented, balanced-development, and housing-oriented) provides services that are related closely to the daily needs of the residents, and therefore has strong links with the community. However, unlike the above three types of HOPSCA, the business-oriented HOPSCA serves the city’s high-end business activities, and this has little to do with community life.
The p-value level showed that the regression coefficient of HOPSCA varied significantly with the spatial position, indicating that the sample community’s premium level exhibits extremely significant spatial heterogeneity. In Section 4.3, we explored in detail the reasons behind the various levels of premiums that HOPSCA generates on residential properties in different areas.

4.3. Spatial Heterogeneity of HOPSCA Affeecting Residential Property Values

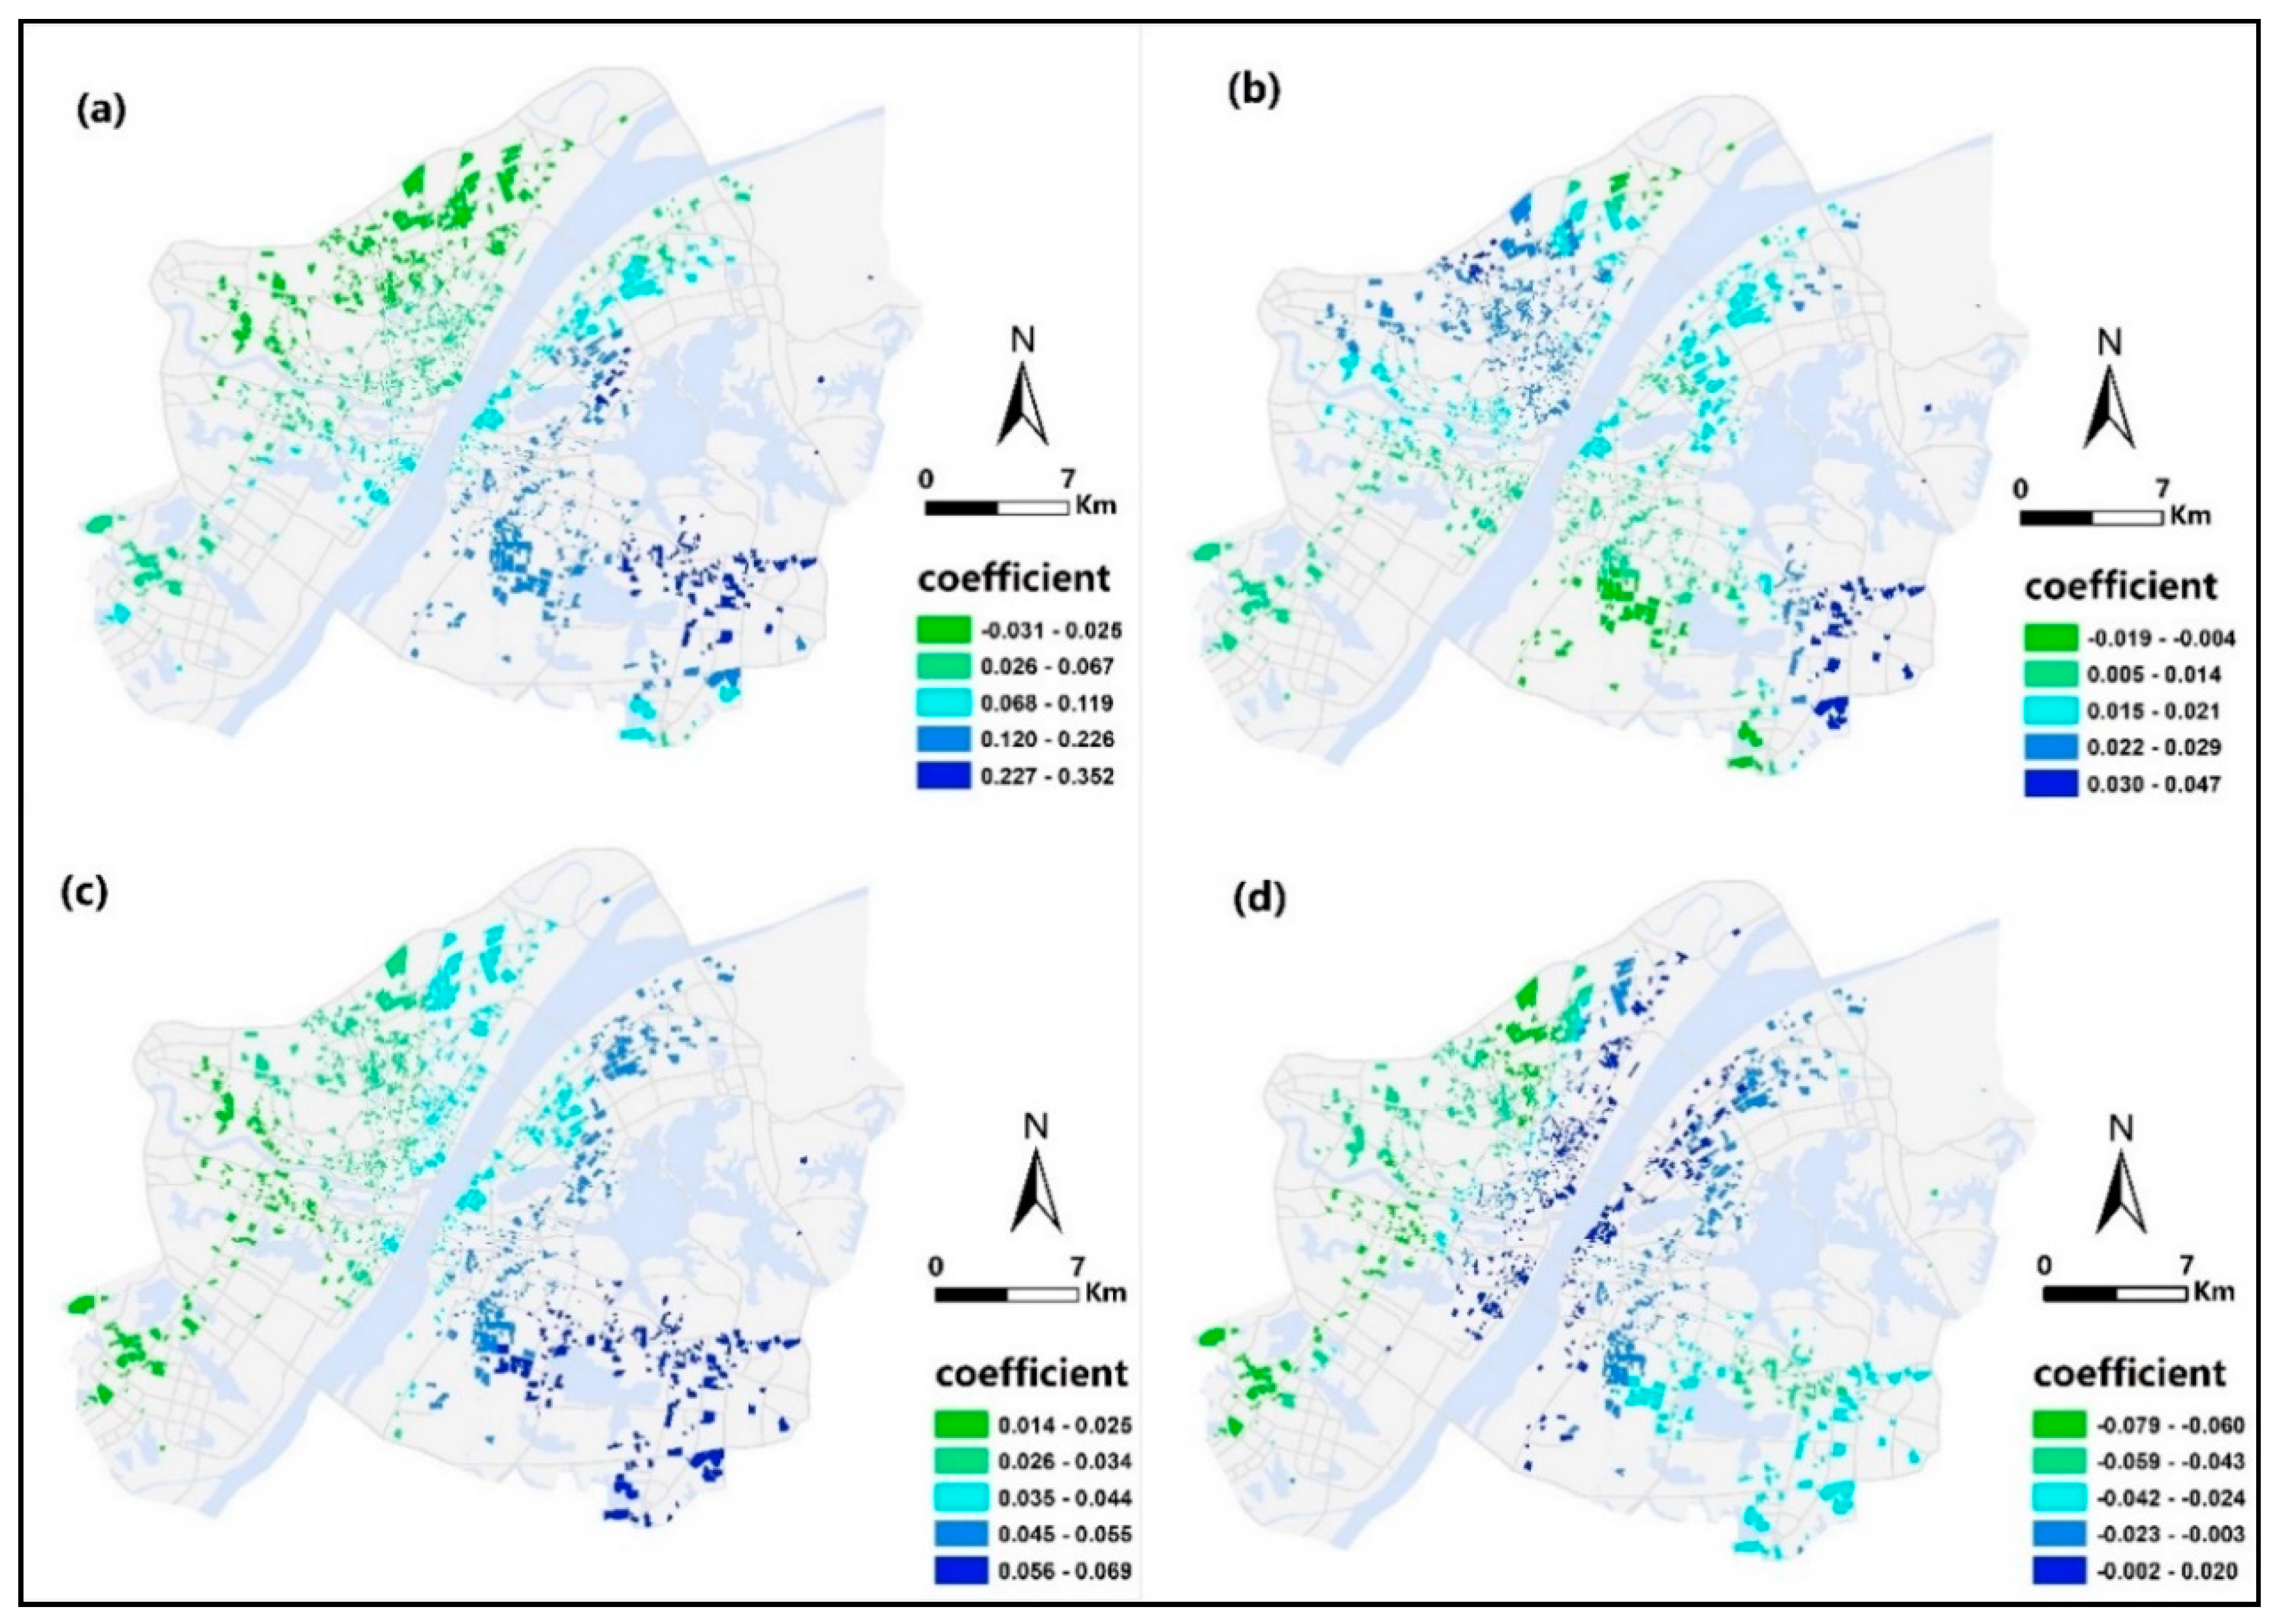
Geographically weighted regression (GWR) has powerful local parameter estimation ability [66,67], which can reveal the spatial heterogeneity of HOPSCA’s effect on residential properties. We drew the spatial distribution pattern of the sample community values under the effects of HOPSCA according to the regression coefficient of the HOPSCA variables (Figure 4). The premiums for the residential properties generated using four types of HOPSCA varied from place to place. As shown in Figure 4, different color types represent the value performance of the residential communities under the effect of HOPSCA, where blue represents a high premium for residential communities. From the spatial distribution pattern of the blue patches in the figure, under the influence of the commerce-oriented HOPSCA and the balanced-development HOPSCA, the residential community on the right bank of the Yangtze River captures a high premium; under the influence of the housing-oriented HOPSCA, there are clusters of high-value communities on both banks of the Yangtze River; under the influence of the business-oriented HOPSCA, residential communities along the banks of the Yangtze River captured high premiums.
The premiums of the communities gradually increase from the western part of the city to the eastern part, because of the effects of commerce-oriented HOPSCA. Communities with high premiums are concentrated in the southeast part of the city. These areas have a strong commercial environment with a large number of shopping centers, department stores, and large supermarkets. With the accumulation of high-tech enterprises, high-end communities, and colleges and universities, these regions also have a sufficient number of high-quality consumers, which accelerate the upgrading of regional commercial entities [38]. The construction of commerce-oriented HOPSCA caters to the functional orientation of medium-to-high-end commercial development in those regions [22].
Under the influence of housing-oriented HOPSCA, the premium levels of communities present a clustered distribution pattern. Communities that capture high residential property values are concentrated in the northwest and southeast areas of the city. These areas are located in the comprehensive development zones in Wuhan City. These integrated groups are oriented toward functional development for desired residence and urban industries. The development of housing-oriented HOPSCA fits well within the jobs–housing balance policy in these regions.
The premium levels of the communities presented a remarkable spatial heterogeneity under the influence of balanced-development HOPSCA. The high-premium communities gather in the eastern part of the city. The region develops mainly urban functions, such as science and education, culture, high technology, financial commerce, and provincial administrative center services. The development of balanced-development HOPSCA satisfies the various types of functional demands in the region.
The proportion of communities producing premiums under the influence of business-oriented HOPSCA is small. These communities are concentrated mainly along the banks of the Yangtze River. This region is the Wuhan Riverside Business District, which gathers international and regional corporate headquarters to provide international high-end business and cultural leisure functions. The region is headed by the headquarters economy and is dominated by high-end businesses. The construction of business-oriented HOPSCA benefits the development of business districts. However, the results indicated that business-oriented HOPSCA exerts negative effects on most communities. The diverse functions of HOPSCA have led to high-intensity urban activities, which may introduce negative externalities of an audiovisual nature to the surrounding residential communities [68]. To be specific, the supplies offered by HOPSCA and the demands required by the residents are somewhat conflicting, for instance, HOPSCA brings busy streets and attracts a strong flow of people and traffic for a long time, but the surrounding residents want a quiet living environment [28,31].

5. Conclusions

HOPSCA has great potential for creating attractive and vibrant neighborhoods and improving the quality of urban life. It offers a variety of functions within a compact urban space, allowing residents to carry out their daily activities more centrally without the need to seek services from other areas of the city. Assuming that home buyers are willing to pay more for residential properties that have access to HOPSCA, we explored the effects of HOPSCA on residential properties. The results indicate the following: (1) Most types of HOPSCA captured price premiums on the residential property values, including commerce-oriented (3.6%), housing-oriented (1.8%), and balanced-developmental HOPSCA (10.8%). However, not all of the projects produced the expected positive effects. The business-oriented HOPSCA had a negative effect on property values (−2.4%). (2) Significant spatial differences were observed in the effects of HOPSCA on the residential property values. We found that the strong correlation between the HOPSCA type and the regional socioeconomic development background could generate a higher premium level of residential properties within the study area. With rapid urbanization and citizens’ pursuit of better life quality in China, the development prospects of HOPSCA are promising in the near future. Based on the theoretical perspective of mixed-use development, this paper conducts an empirical study on the relationship between HOPSCA and residential property values. We constructed an effective model to measure the spatial impact of accessibility to different types of HOPSCA on residential property values. The results reveal that the value performance of HOPSCA has a significant type and spatial heterogeneity. Taking Wuhan as the case study, we hope this work will provide insights for those engaged in the actual construction of HOPSCA, such as government policy makers, urban planners and real estate developers. Our findings are limited to the typical city in central China (Wuhan), but have lessons for large Chinese cities with similar HOPSCA development models and urban socioeconomic backgrounds.
To measure the relationship between HOPSCA and residential property values, factors including the functional types, spatial layout, accessibility, and building scale were considered. Future works should focus on factors such as the post-occupancy evaluations. In using HOPSCA, the emotional experience of residents, such as satisfaction, can reflect the value performance of such projects. With the development of information technology, evaluation information based on individual experience can be verified as a new type of data from the perspective of social perception [69]. We believe the introduction of this new data source will provide a new perspective for the value measurement of HOPSCA in the future.

Author Contributions

Writing (original draft preparation), Z.Q.; supervision, Y.Y.; writing (review and editing), D.L.

Funding

This study was financially supported by the National Natural Science Foundation of China (granted No. 41771429 and No. 41871301) and the National Key R&D Program of China (No. 2018YFB0505402).

Acknowledgments

The authors are grateful to the anonymous referees for their valuable comments and suggestions, especially for their constructive comments about reorganizing the paper to improve its readability. Thanks to Jianhua He for his valuable suggestions on the framework of the paper. Thanks to Qinghua Xiao from the CRIC Research Center of E-House China Enterprise Holdings Ltd. for providing professional advice to HOPSCA. Finally, we would like to sincerely thank Stanley D. Brunn for smoothing out the wording throughout the paper to ensure it reads clearly. Any errors are entirely due to the authors.

Conflicts of Interest

The authors declare no conflict of interest.

References

  1. Hui, E.C.M.; Zhong, J.W.; Yu, K.H. Heterogeneity in Spatial Correlation and Influential Factors on Property Prices of Submarkets Categorized by Urban Dwelling Spaces. J. Urban Plan. Dev. 2016, 142. [Google Scholar] [CrossRef]
  2. Rosen, S. Hedonic Prices and Implicit Markets: Product Differentiation in Pure Competition. J. Political Econ. 1974, 82, 34–55. [Google Scholar] [CrossRef] [Green Version]
  3. Jung, E.; Choi, Y.; Yoon, H. The impact of the Gyeongui Line Park project on residential property values in Seoul, Korea. Habitat Int. 2016, 58, 108–117. [Google Scholar] [CrossRef]
  4. Wu, C.; Ye, X.Y.; Du, Q.Y.; Luo, P. Spatial effects of accessibility to parks on housing prices in Shenzhen, China. Habitat Int. 2017, 63, 45–54. [Google Scholar] [CrossRef]
  5. Wen, H.Z.; Zhang, Y.; Zhang, L. Do educational facilities affect housing price? An empirical study in Hangzhou, China. Habitat Int. 2014, 42, 155–163. [Google Scholar] [CrossRef]
  6. Wen, H.Z.; Xiao, Y.; Hui, E.C.M.; Zhang, L. Education quality, accessibility, and housing price: Does spatial heterogeneity exist in education capitalization? Habitat Int. 2018, 78, 68–82. [Google Scholar] [CrossRef]
  7. Kang, C.D. Valuing Spatial Access to Types of Retail and Effects on the Housing Price in Seoul, Korea. J. Urban Plan. Dev. 2018, 144. [Google Scholar] [CrossRef]
  8. Jang, M.; Kang, C.D. Retail accessibility and proximity effects on housing prices in Seoul, Korea: A retail type and housing submarket approach. Habitat Int. 2015, 49, 516–528. [Google Scholar] [CrossRef]
  9. Mulley, C.; Tsai, C.H.; Ma, L. Does residential property price benefit from light rail in Sydney? Res. Transp. Econ. 2018, 67, 3–10. [Google Scholar] [CrossRef]
  10. Geng, B.; Bao, H.J.; Liang, Y. A study of the effect of a high-speed rail station on spatial variations in housing price based on the hedonic model. Habitat Int. 2015, 49, 333–339. [Google Scholar] [CrossRef]
  11. Belcher, R.N.; Chisholm, R.A. Tropical Vegetation and Residential Property Value: A Hedonic Pricing Analysis in Singapore. Ecol. Econ. 2018, 149, 149–159. [Google Scholar] [CrossRef]
  12. Poudyal, N.C.; Hodges, D.G.; Tonn, B.; Cho, S.H. Valuing diversity and spatial pattern of open space plots in urban neighborhoods. For. Policy Econ. 2009, 11, 194–201. [Google Scholar] [CrossRef]
  13. Melichar, J.; Kaprova, K. Revealing preferences of Prague’s homebuyers toward greenery amenities: The empirical evidence of distance-size effect. Landsc. Urban Plan 2013, 109, 56–66. [Google Scholar] [CrossRef]
  14. Zhang, Z.; Tan, S.K.; Tang, W.W. A GIS-based spatial analysis of housing price and road density in proximity to urban lakes in Wuhan City, China. Chin. Geogr. Sci. 2015, 25, 775–790. [Google Scholar] [CrossRef]
  15. Jiao, L.M.; Liu, Y.L. Geographic Field Model based hedonic valuation of urban open spaces in Wuhan, China. Landsc. Urban Plan 2010, 98, 47–55. [Google Scholar] [CrossRef]
  16. Wen, H.Z.; Tao, Y.L. Polycentric urban structure and housing price in the transitional China: Evidence from Hangzhou. Habitat Int. 2015, 46, 138–146. [Google Scholar] [CrossRef]
  17. Waltert, F.; Schlapfer, F. Landscape amenities and local development A review of migration, regional economic and hedonic pricing studies. Ecol. Econ. 2010, 70, 141–152. [Google Scholar] [CrossRef]
  18. Wen, H.Z.; Xiao, Y.; Zhang, L. Spatial effect of river landscape on housing price: An empirical study on the Grand Canal in Hangzhou, China. Habitat Int. 2017, 63, 34–44. [Google Scholar] [CrossRef]
  19. Yu, T.; Shi, Q.; Zuo, J.; Chen, R.X. Critical factors for implementing sustainable construction practice in HOPSCA projects: A case study in China. Sustain. Cities Soc. 2018, 37, 93–103. [Google Scholar] [CrossRef]
  20. Zhang, X.L. Paradigm shift toward sustainable commercial project development in China. Habitat Int. 2014, 42, 186–192. [Google Scholar] [CrossRef]
  21. Shi, B.X.; Yang, J.Y. Scale, distribution, and pattern of mixed land use in central districts: A case study of Nanjing, China. Habitat Int. 2015, 46, 166–177. [Google Scholar] [CrossRef]
  22. Lau, S.S.Y.; Giridharan, R.; Ganesan, S. Policies for implementing multiple intensive land use in Hong Kong. J. Hous. Built Environ. 2003, 18, 365–378. [Google Scholar] [CrossRef]
  23. Wang, C.; Li, B.Y.; Li, B.Z.; Baldwin, A. Case study of “project controlling” on a large HOPSCA project in China. Eng. Constr. Archit. Manag. 2017, 24, 862–874. [Google Scholar] [CrossRef]
  24. Manganelli, B. Real Estate Investing: Market Analysis, Valuation Techniques, and Risk Management; Springer International Publishing: Cham, Switzerland, 2015. [Google Scholar]
  25. Kong, H.; Sui, D.Z.; Tong, X.; Wang, X. Paths to mixed-use development: A case study of Southern Changping in Beijing, China. Cities 2015, 44, 94–103. [Google Scholar] [CrossRef]
  26. Delisle, J.R.; Grissom, T.V. An empirical study of the efficacy of mixed-use development: The seattle experience. J. Real Estate Lit. 2013, 21, 25–57. [Google Scholar]
  27. Rowley, A. Mixed-use Development: Ambiguous concept, simplistic analysis and wishful thinking? Plan. Pract. Res. 1996, 11, 85–98. [Google Scholar] [CrossRef]
  28. Grant, J. Mixed use in theory and practice—Canadian experience with implementing a planning principle. J. Am. Plan. Assoc. 2002, 68, 71–84. [Google Scholar] [CrossRef]
  29. Hoppenbrouwer, E.; Louw, E. Mixed-use development: Theory and practice in Amsterdam’s Eastern Docklands. Eur. Plan. Stud. 2005, 13, 967–983. [Google Scholar] [CrossRef]
  30. Oregon Transportation and Growth Management Program. Commercial and Mixed-Use Development Code Handbook; Oregon Transportation and Growth Management Program: Salem, OR, USA, 2001; pp. 7–79. Available online: https://digital.osl.state.or.us/islandora/object/osl:9840 (accessed on 11 January 2019).
  31. Geoghegan, J.; Wainger, L.A.; Bockstael, N.E. Spatial landscape indices in a hedonic framework: An ecological economics analysis using GIS. Ecol. Econ. 1997, 23, 251–264. [Google Scholar] [CrossRef]
  32. Vorontsova, A.V.; Vorontsova, V.L.; Salimgareev, D.V. The development of Urban Areas and Spaces with the Mixed Functional Use. Procedia Eng. 2016, 150, 1996–2000. [Google Scholar] [CrossRef]
  33. Eizenberg, J. Here comes the neighborhood: Why urban mixed-use development works. Resid. Architect. 2003, 7, 26–28. [Google Scholar]
  34. Anders, M. Understanding and balancing mixed-use schemes: The key to creating successful communities. J. Retail Leisure Prop. 2004, 3, 353–364. [Google Scholar] [CrossRef] [Green Version]
  35. Nakamura, S.; Peiser, R.; Tort, R. Are There Investment Premiums for Mixed-Use Properties? J. Real Estate Res. 2018, 40, 1–39. [Google Scholar]
  36. Rabianski, J.S.; Gibler, K.M.; Tidwell, O.A.; Iii, J.S.C. Mixed-use development: A call for research. J. Real Estate Lit. 2009, 17, 205–230. [Google Scholar]
  37. Mehri, F. Utilizing Mixed Use Theory in Order to Obtain a Sustainable Urban Development. Life Sci. J. Acta Zhengzhou Univ. Overseas Ed. 2012, 9, 1879–1885. [Google Scholar]
  38. Rabianski, J.S.; Gibler, K.M.; Clements Iii, J.S.; Tidwell, O.A. Mixed-Use Development and Financial Feasibility: Part I—Economic and Financial Factors. Real Estate Issues 2009, 34, 11–17. [Google Scholar]
  39. Rabianski, J.S.; Clements, J.S. Mixed-Use Development: A Review of Professional Literature; National Association of Office and Industrial Parks: Washington, DC, USA, 2007. [Google Scholar]
  40. Koster, H.R.A.; Rouwendal, J. The Impact of Mixed Land Use on Residential Property Values. J. Reg. Sci. 2012, 52, 733–761. [Google Scholar] [CrossRef]
  41. Moos, M.; Vinodrai, T.; Revington, N.; Seasons, M. Planning for Mixed Use. J. Am. Plan. Assoc. 2018, 84, 7–20. [Google Scholar] [CrossRef]
  42. Kusumastuti, D.; Nicholson, A. Mixed-use development in Christchurch, New Zealand: Do you want to live there? Urban Stud. 2018, 55, 2682–2702. [Google Scholar] [CrossRef]
  43. Pooler, J.A. The use of spatial separation in the measurement of transportation accessibility. Transp. Res. Part A-Policy Pract. 1995, 29, 421–427. [Google Scholar] [CrossRef]
  44. Black, J.; Conroy, M. Accessibility measures and the social evaluation of urban structure. Environ. Plan. A 1977, 9, 1013–1031. [Google Scholar] [CrossRef]
  45. Hansen, W.G. How Accessibility Shapes Land Use. J. Am. Inst. Plan. 1959, 25, 73–76. [Google Scholar] [CrossRef]
  46. Zhang, X.; Lu, H.; Holt, J.B. Modeling spatial accessibility to parks: A national study. Int. J. Health Geogr. 2011, 10, 31. [Google Scholar] [CrossRef] [PubMed]
  47. Li, Y.; He, L.; Jiao, J.; Shen, G. Quantitative Study of Housing Price Based on Huff Model and Hedonic Method. In Building Resilient Cities in China: The Nexus between Planning and Science, Proceedings of the 7th International Association for China Planning Conference, Shanghai, China, 29 June–1 July 2013; Chen, X., Pan, Q., Eds.; Springer International Publishing: Cham, Switzerland, 2015; pp. 207–221. [Google Scholar] [CrossRef]
  48. Salze, P.; Banos, A.; Oppert, J.-M.; Charreire, H.; Casey, R.; Simon, C.; Chaix, B.; Badariotti, D.; Weber, C. Estimating spatial accessibility to facilities on the regional scale: An extended commuting-based interaction potential model. Int. J. Health Geogr. 2011, 10, 2. [Google Scholar] [CrossRef]
  49. Huang, Z.Z.; Chen, R.S.; Xu, D.; Zhou, W. Spatial and hedonic analysis of housing prices in Shanghai. Habitat Int. 2017, 67, 69–78. [Google Scholar] [CrossRef]
  50. Helbich, M.; Brunauer, W.; Vaz, E.; Nijkamp, P. Spatial Heterogeneity in Hedonic House Price Models: The Case of Austria. Urban Stud. 2014, 51, 390–411. [Google Scholar] [CrossRef]
  51. Bajat, B.; Kilibarda, M.; Pejović, M.; Petrović, M.S. Spatial Hedonic Modeling of Housing Prices Using Auxiliary Maps. In Spatial Analysis and Location Modeling in Urban and Regional Systems; Thill, J.-C., Ed.; Springer: Berlin/Heidelberg, Germany, 2018. [Google Scholar]
  52. Brunsdon, C.; Fotheringham, S.; Charlton, M. Geographically Weighted Regression-Modelling Spatial Non-Stationarity. J. R. Stat. Soc. Ser. D Stat. 1998, 47, 431–443. [Google Scholar] [CrossRef]
  53. Bitter, C.; Mulligan, G.F.; Dall’erba, S. Incorporating spatial variation in housing attribute prices: A comparison of geographically weighted regression and the spatial expansion method. J. Geogr. Syst. 2007, 9, 7–27. [Google Scholar] [CrossRef]
  54. Dziauddin, M.F.; Powe, N.; Alvanides, S. Estimating the Effects of Light Rail Transit (LRT) System on Residential Property Values Using Geographically Weighted Regression (GWR). Appl. Spat. Anal. Police 2015, 8, 1–25. [Google Scholar] [CrossRef]
  55. Liang, X.; Liu, Y.; Qiu, T.; Jing, Y.; Fang, F. The effects of locational factors on the housing prices of residential communities: The case of Ningbo, China. Habitat Int. 2018, 81, 1–11. [Google Scholar] [CrossRef]
  56. Cao, T.V.; Cory, D.C. Mixed land uses, land-use externalities, and residential property values: A reevaluation. Ann. Reg. Sci. 1982, 16, 1–24. [Google Scholar]
  57. Hochmair, H.H.; Juhász, L.; Cvetojevic, S. Data Quality of Points of Interest in Selected Mapping and Social Media Platforms; Springer: Cham, Switzerland, 2017; pp. 293–313. [Google Scholar]
  58. Karduni, A.; Kermanshah, A.; Derrible, S. A protocol to convert spatial polyline data to network formats and applications to world urban road networks. Sci. Data 2016, 3, 160046. [Google Scholar] [CrossRef] [PubMed]
  59. Xiao, Y.; Wang, Z.; Li, Z.G.; Tang, Z.L. An assessment of urban park access in Shanghai—Implications for the social equity in urban China. Landsc. Urban Plan 2017, 157, 383–393. [Google Scholar] [CrossRef]
  60. Arbia, G.; Petrarca, F. Effects of scale in spatial interaction models. J. Geogr. Syst. 2013, 15, 249–264. [Google Scholar] [CrossRef]
  61. Ferlan, N.; Bastic, M.; Psunder, I. Influential Factors on the Market Value of Residential Properties. Inzinerine Ekonomika-Eng. Econ. 2017, 28, 135–144. [Google Scholar] [CrossRef]
  62. Li, R.; Cheng, K.; Shoaib, M. Walled Buildings, Sustainability, and Housing Prices: An Artificial Neural Network Approach. Sustainability 2018, 10, 1298. [Google Scholar] [CrossRef]
  63. Taylor, L.O. Theoretical Foundations and Empirical Developments in Hedonic Modeling; Springer: New York, NY, USA, 2008; pp. 15–37. [Google Scholar]
  64. Bowen, W.M.; Mikelbank, B.A.; Prestegaard, D.M. Theoretical and empirical considerations regarding space in hedonic housing price model applications. Growth Chang. 2001, 32, 466–490. [Google Scholar] [CrossRef]
  65. Manganelli, B.; Pontrandolfi, P.; Azzato, A.; Murgante, B. Using geographically weighted regression for housing market segmentation. Int. J. Bus. Intell. Data Min. 2014, 9, 161–177. [Google Scholar] [CrossRef]
  66. Lu, B.; Yang, W.; Ge, Y.; Harris, P. Improvements to the calibration of a geographically weighted regression with parameter-specific distance metrics and bandwidths. Comput. Environ. Urban Syst. 2018, 71, 41–57. [Google Scholar] [CrossRef]
  67. Wheeler, D.C. Geographically Weighted Regression. In Handbook of Regional Science; Fischer, M.M., Nijkamp, P., Eds.; Springer: Berlin/Heidelberg, Germany, 2014. [Google Scholar]
  68. Foord, J.O. Mixed-Use Trade-Offs: How to Live and Work in a ‘Compact City’ Neighbourhood. Built Environ. 2010, 36, 47–62. [Google Scholar] [CrossRef]
  69. Liu, Y.; Liu, X.; Gao, S.; Gong, L.; Kang, C.G.; Zhi, Y.; Chi, G.H.; Shi, L. Social Sensing: A New Approach to Understanding Our Socioeconomic Environments. Ann. Assoc. Am. Geogr. 2015, 105, 512–530. [Google Scholar] [CrossRef]
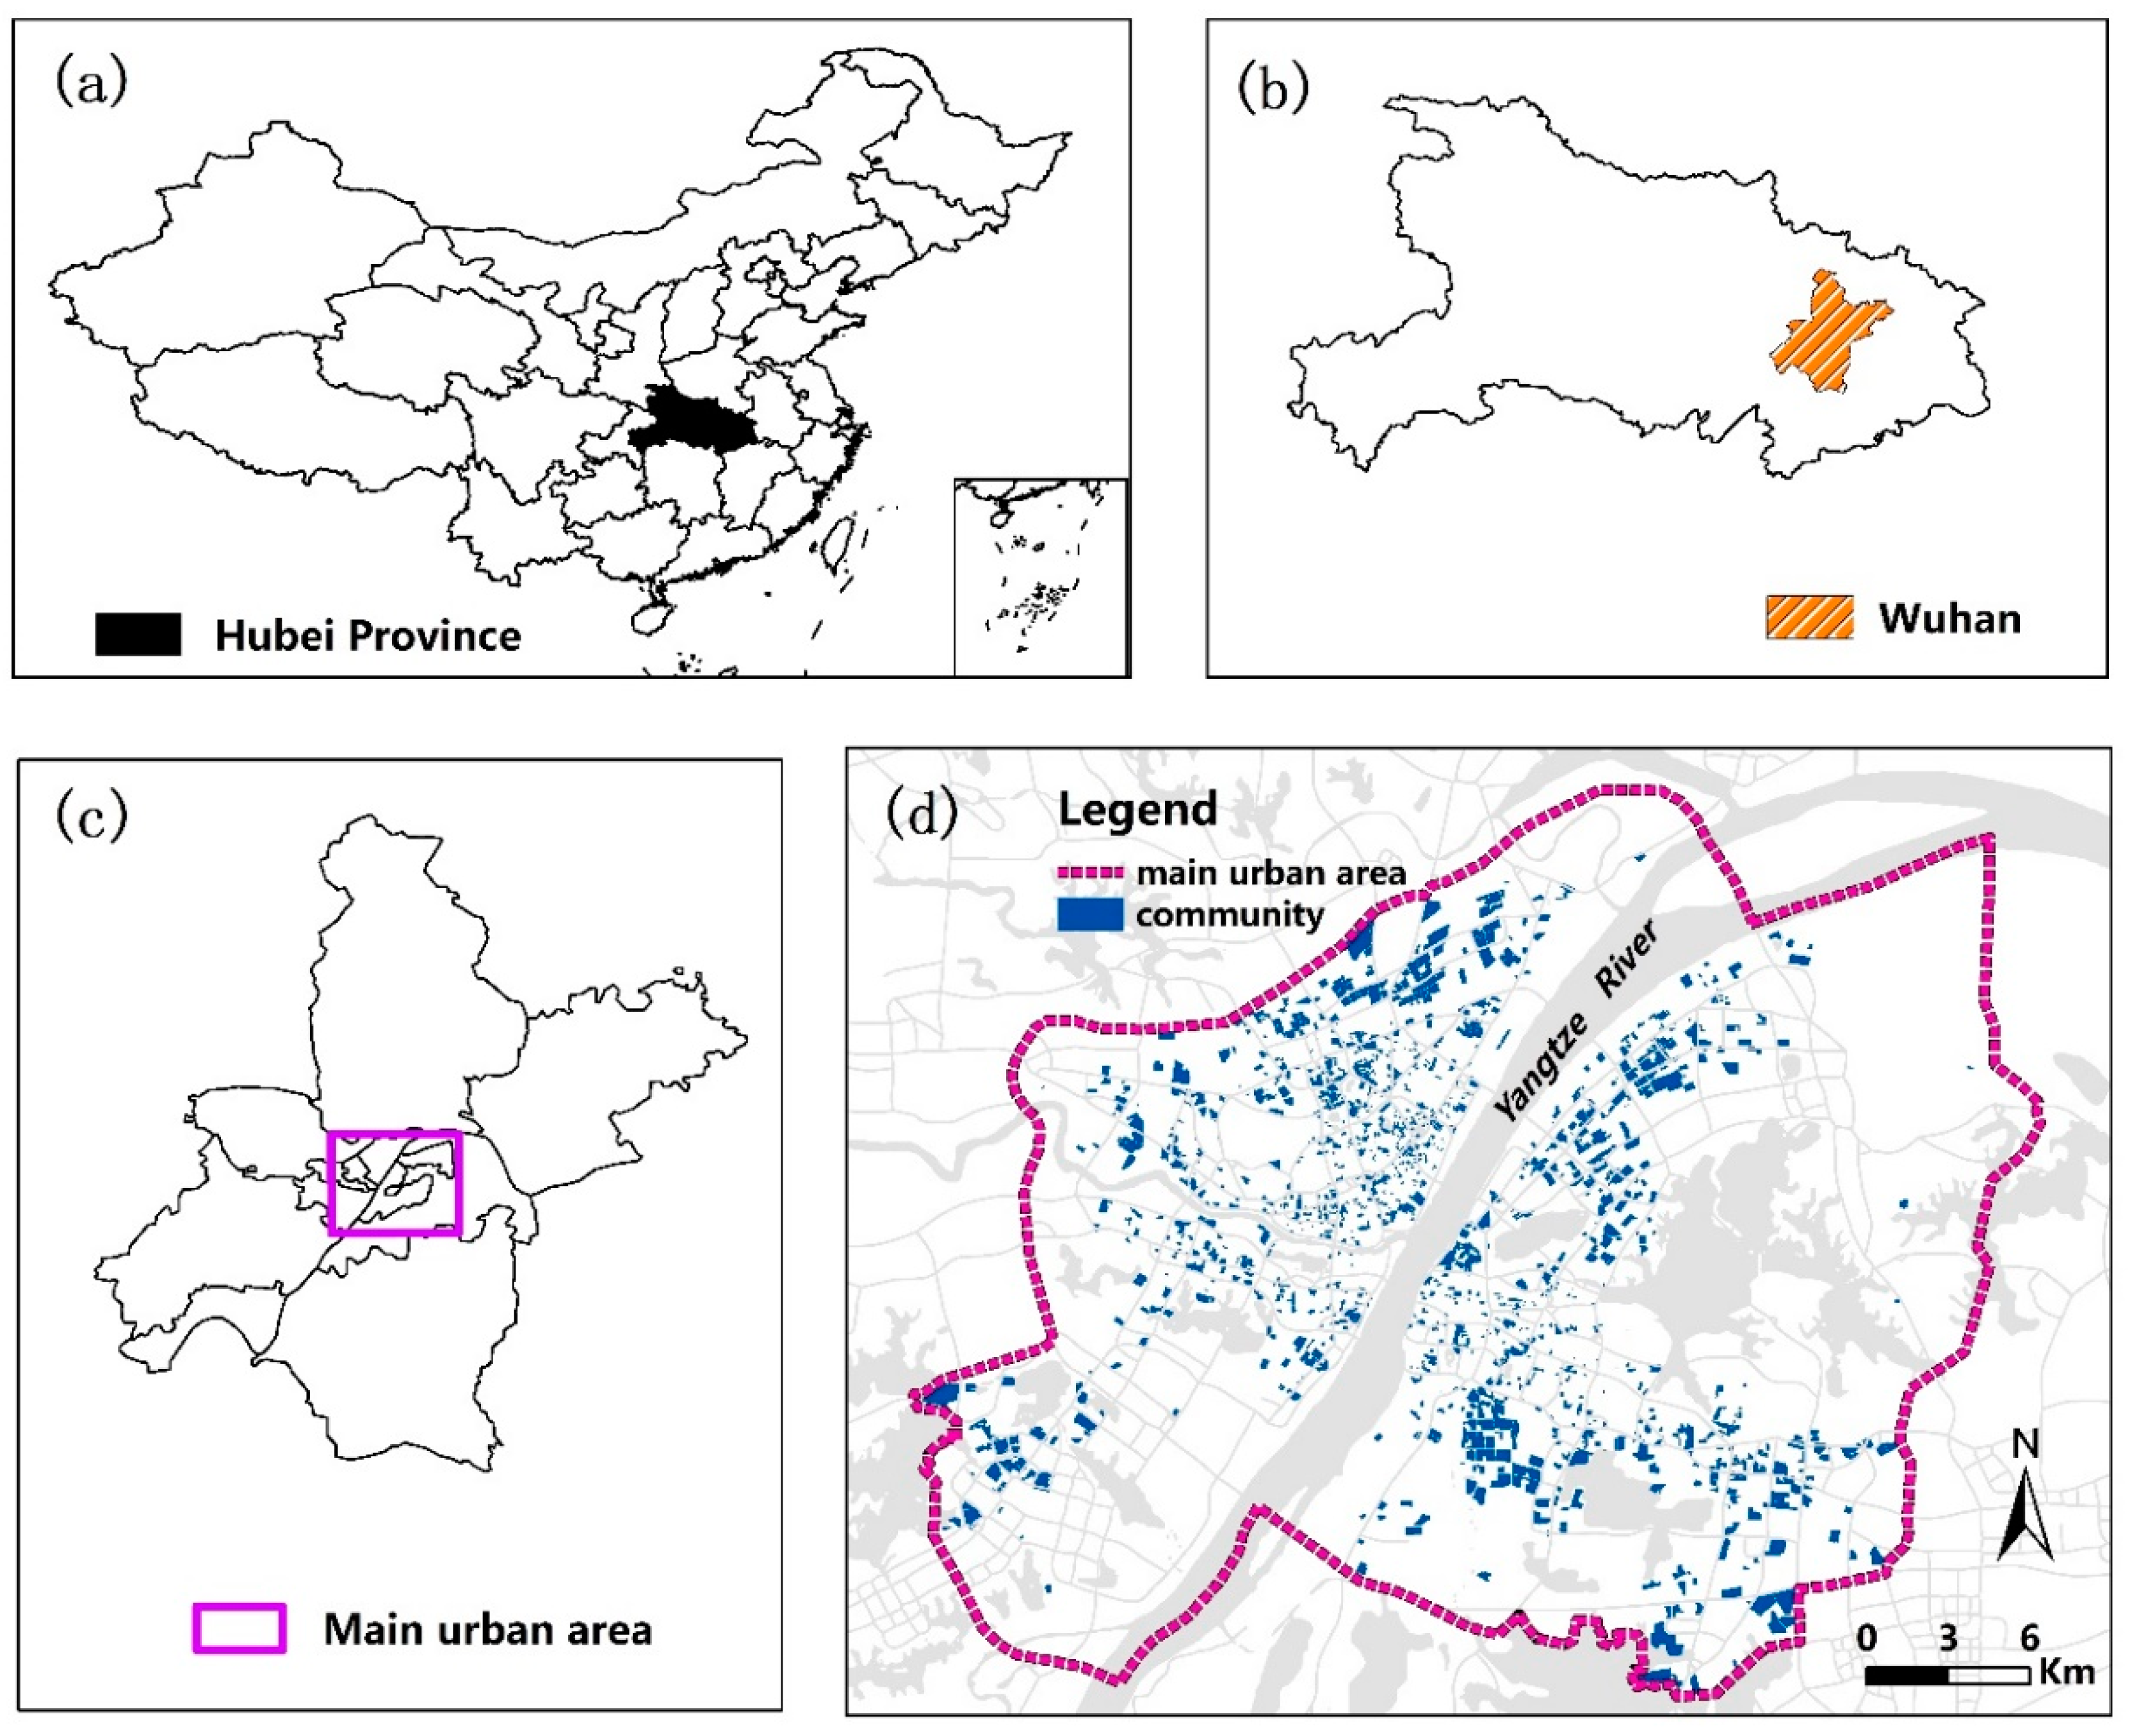
Figure 1. Location of the study area and sample residential communities. (a): Hubei Province in China; (b): Wuhan in Hubei Province; (c): main urban area in Wuhan; (d): residential communities in main urban area.
Sustainability 11 00471 g001
Figure 2. Spatial distribution of the hotels, offices, parks, shopping malls, conference centers, and apartments (HOPSCA) in Wuhan City.
Sustainability 11 00471 g002
Figure 3. Spatial accessibility to HOPSCA in the main urban area of Wuhan: (a) commerce-oriented HOPSCA, (b) housing-oriented HOPSCA, (c) balanced-development HOPSCA, and (d) business-oriented HOPSCA. Note: To improve the visualization of the spatial distribution of accessibility to HOPSCA (left), we used the interpolation technique to smooth the distribution map (right).
Sustainability 11 00471 g003
Figure 4. Spatial heterogeneity of price premiums of residential properties generated by HOPSCA: (a) commerce-oriented HOPSCA, (b) housing-oriented HOPSA, (c) balanced-development HOPSCA, and (d) business-oriented HOPSCA.
Sustainability 11 00471 g004
Table 1. Description of the dataset.
Data SetTypeDescribeSource
Community dataNumerical valueTransaction prices and attribute data of sample communitiesCaptured from the Fang.com
HOPSCA dataPointProperty composition, project scale, and other HOPSCA attribute informationObtained from CricBigdata
POI dataPointVarious facilities of Wuhan CityObtained from Metrodatateam
Road dataPolylineTypes and lengths of Wuhan urban roadsavailable at: http://www.nature.com/articles/sdata201646
Note: Point and polyline are two fundamental abstractions of identifying spatial objects in spatial databases. HOPSCA—hotels, offices, parks, shopping malls, conference centers, and apartments; POI—points of interest.
Table 2. Types and descriptions of HOPSCA.
TypesTotalProportion (%)Function Design
Commerce-oriented HOPSCA1638The main function is commerce, whose proportion is at least 50%; auxiliary functions include office building, hotels, and so on.
Housing-oriented HOPSCA1536The main function is housing, whose proportion is at least 50%; auxiliary functions include office building, commerce, and so on.
Balanced-development HOPSCA717Functions of commerce, office, hotel, and housing are equally designed; the proportion of each function is less than or equal to 50%.
Business-oriented HOPSCA410The main function is business, whose proportion is at least 50%; auxiliary functions include commerce, hotels, housing, and so on.
Total42100
Table 3. Description of explanatory variables.
CharacteristicVariableDescriptionExpected Sign
Structure
characteristic
AGEThe years between construction year to 2017 (year)-
RPOLTRatio of the community-
RGREENRatio of the green space area of the community+
FEEProperty management fees (Yuan/Mon·m2)+
Location
characteristic
NTRANSPORTQuantity of transport facilities within a 1000 m radius of the community+
NE&MQuantity of education and medical facilities within a 1000 m radius of the community+
NLEISUREQuantity of leisure facilities within a 1000 m radius of the community+
NCOMMERCEQuantity of commerce facilities within a 1000 m radius of the community+
NLIVINGQuantity of living facilities within a 1000 m radius of the community+
Neighborhood
characteristic
METROWhether the community covers any metro station within 1000 m (yes = 1, no = 0)+
EDUCATIONWhether the community belongs to the designated school districts (yes = 1, no = 0)+
LANDSCAPEWhether the community catches any famous lakes, rivers, park landscapes (yes = 1, no = 0)+
BUSINESSWhether the community within the prosperous business circle (yes = 1, no = 0)+
Accessibility
characteristic
ACOMMERCEAccessibility to commerce-oriented HOPSCA+
AHOUSINGAccessibility to housing-oriented HOPSCA+
ABALANCEAccessibility to balanced-development HOPSCA+
ABUSINESSAccessibility to business-oriented HOPSCA+
Table 4. Descriptive statistics of accessibility to HOPSCA in Wuhan.
TypeMinimumMaximumMeanStandard Deviation
Commerce-oriented HOPSCA0.198115.7241.6744.516
Housing-oriented HOPSCA0.481345.4153.29011.413
Balanced-development HOPSCA1.494128.6636.3817.159
Business-oriented HOPSCA0.01156.9530.4352.567
Table 5. Results of the geographically weighted regression (GWR) model of residential property values.
VariableCoefficientStandard Deviationp-Value
AGE−0.153 ***0.0380.000
RPLOT0.028 ***0.0290.000
RGREEN0.078 ***0.0300.000
FEE0.261 ***0.0370.000
NTRANSPORT0.419 ***0.0660.000
NE&M0.183 ***0.0610.000
NLEISURE−0.119 ***0.0520.000
NCOMMERCE−0.284 ***0.0660.000
BUSINESSCIRCLE−0.024 ***0.0290.000
LANDSCAPE0.218 ***0.0300.000
METRO0.009 ***0.0360.000
EDUCATION0.075 ***0.0280.000
ACOMMERCE0.036 ***0.0250.000
AHOUSING0.018 ***0.0250.000
ABALANCE0.108 ***0.0280.000
ABUSINESS−0.024 ***0.0310.000
AICc3544.158
R2 Adjusted0.460
Note: AICc—Akaike information criterion; *** indicates significance at the 1% level.