Abstract
In 2011, the United Nations Road Safety Collaboration (UNRSC) developed a Global Plan for the Decade of Action for Road Safety 2011–2020. Among the categories or “pillars” of activities, is the improvement of road safety for infrastructures. Furthermore, this plan is aligned by the UN Sustainable Development Goals that included even traffic safety. In this regard, this study estimates safety improvements achieved by converting a standard roundabout into an egg turbo roundabout. In particular, turbo roundabouts have become very popular in Northern Europe for both their safety and their capacity. Many studies have shown these advantages thanks to their features: preventive separation of entering flows, limited lane changing and low speeds due to curbs. Given the absence of existing turbo roundabouts in Italy, this research studied and compared a “virtual” roundabout with spiraling circular carriageways to an existing multi-lane roundabout in order to assess its significant reduction in terms of potential collisions. This study relied on traffic conflicts in micro-simulation by using VISSIM software and then Surrogate Safety Assessment Model (SSAM). The research is based on the traffic process observed at a standard roundabout in Cosenza (Italy) marked by a high level of congestion and safety problems. Speeds, critical gaps, queue lengths, and floating car data, obtained from video observations, have been used as input data for the calibration procedure of the first scenario (case study roundabout). Then, the turbo roundabout solution was built and simulated by using the previously derived parameters. Finally, the two roundabout scenarios were compared in terms of spatial distribution of the potential conflicts determined by SSAM. The results could help to measure the performance and safety impact of these two roundabout configurations.
1. Introduction
In the last two decades, roundabouts have become the most common and efficient solution for at-grade intersections [1,2,3,4,5]. However, many papers have evinced that standard multi-lane roundabouts offer lower capacity compared to estimates and a high rate of crashes [6,7]. High speeds and many potential conflicts are probably the main causes of these problems: drivers accelerate when crossing the roundabout [8,9,10,11,12]. For these reasons, a new type of multi-lane roundabout, called the turbo roundabout, was introduced in the Netherlands [6] in 1996. This scheme was characterized by a spiraling circular carriageway with lanes separated by curbs. The main benefits of these new roundabout layouts are: a limited number of potential conflict points, a slower speed along the circulatory lane, and a low risk of side impacts [13,14,15,16,17,18]. The main negative aspects are due to the presence of through conflict points in left-turning maneuvers, higher values of the critical gaps along the road, and generally lower capacity than conventional double-lane roundabouts [19,20,21]. In this study, we analyzed a virtual egg turbo roundabout as a possible alternative scheme to an existing multi-lane roundabout in Cosenza (Italy). The main goal of this conversion is to evaluate the potential improvement of performance and safety [11,22]. We used data acquired throughout the several recordings on the investigated roundabout (traffic distribution, approaching and circulating speeds, queue lengths, approaching delays, time of service, and critical gaps) as input for the calibration procedures of VISSIM [23,24]. Then, we employed the calibrated VISSIM parameters obtained from the existing roundabout (minimizing the difference between simulated and field-observed queue lengths) to estimate the spatial distribution of the potential traffic conflicts at the virtual turbo roundabout by using Surrogate Safety Assessment Model (SSAM) [25] and to compare the results of the two different roundabout solutions.
The advantage of converting traditional roundabouts into turbo roundabouts, both in terms of performance and safety, has been confirmed by several studies. Fortuijn [6] presented the first safety analysis on turbo roundabouts. The results of before-and-after studies, carried out in the Netherlands on 70 turbo roundabouts, demonstrated an 80% reduction in the risk of crashes associated with injury with respect to conventional single-lane roundabouts. As reported by Mauro and Cattani [26], turbo roundabouts can considerably reduce the accident rate with respect to standard roundabouts, because they eliminate conflicts between circulating and exiting flows. In this paper, they developed an accident rate model based on the concept of potential conflicts, and demonstrated that turbo roundabouts abate total car accidents by about 40–50% and injury crashes by 20–30%. The same authors [27] confirmed these outcomes, also underlining the usefulness of turbo roundabouts in an urban area: they used the accident rate model to compare four-leg turbo roundabouts to standard roundabouts in the presence of significant two-wheeler and pedestrian traffic. Silva et al. [19] studied, in terms both of capacity and pollutant emissions, the performance of the turbo roundabout solution, when applied in corridor, compared to a conventional double-lane roundabout. The results showed a level of performance of the turbo roundabouts corridor lower than that of standard roundabouts, with traffic conditions close to saturation; however, the turbo roundabouts ensure higher capacities when traffic levels are lower than 70% (unsaturated conditions). For the same reason, in under-saturation conditions, turbo roundabouts guarantee a potential reduction of CO, CO2 and particulate matter (PM): high percentages of right turns increase this tendency. Bulla and Castro [28] compared instead two-lane roundabouts and conventional turbo roundabouts in terms of capacity, level of service, and road safety. The authors used the VISSIM micro-simulation tool to determine the capacity of a standard roundabout, then converted it into a virtual basic turbo roundabout: they found a capacity increase of 7% between roundabout and turbo roundabout. Afterwards, a road safety audit methodology was proposed. This process demonstrated the road safety benefits of turbo roundabouts: a 22% reduction in overall risk estimation was found by the comparison of the average risk of both solutions. After adjusting the simulation parameters, Yperman and Immers [29] accurately assessed the capacity of a turbo roundabout by using Paramics microsimulation model. They found a capacity increase of between 12 and 20% by turning a three-lane classical roundabout into a two-lane turbo roundabout with traffic equally distributed among the four approaches. Moreover, Engelsman and Ukel [7] estimated a capacity increase of about 30% by using a quick-scan model developed in the Netherlands. They observed significant efficiency improvements with a turbo roundabout in comparison with single-lane roundabouts, two-lane roundabouts, traffic lights, or yield intersections, especially for approaching traffic volumes that do not exceed 3000 to 3500 veh/h. Huang et al. [30] presented a two-stage calibration process for the VISSIM simulation model considering 10 signalized intersections, in order to identify relationships between potential conflicts obtained by SSAM and recorded conflicts. The main results of this study supplied credible estimates for rear-end and total conflicts in relatively simple driving environments, as the SSAM approach does not take into account traffic conflicts deriving from unexpected drivers’ maneuvers. Additionally, Vasconcelos et al. [31] used SSAM to access the relative performance of three roundabout schemes: single-lane, two-lane, and turbo roundabout. In this research, the authors demonstrated that the safety level of a turbo roundabout is comparable to a single-lane (conflicts are more severe than those of the single-lane type), but with the benefit of higher capacity levels. In conclusion, they evaluated a good qualitative agreement between conventional accident prediction models and SSAM approach. Essa and Sayed [32] investigated instead the transferability of VISSIM calibrated parameters to evaluate safety measures at different sites. They used an automated video-based survey to obtain vehicle trajectories and to identify potential conflicts for two urban signalized intersections. Then, after a two-step calibration process of the VISSIM model, they used SSAM to compare observed and simulated rear-end traffic conflicts considering Time To Collision (TTC) measures. In the conclusions, the authors demonstrated how the calibrated model matches existing traffic conditions and how safety analysis without proper calibration should be avoided.
2. Materials and Methods
2.1. Case Study Analysis
The test site roundabout, located in a suburban area of Cosenza (Italy), is marked by traffic problems with queues and long approaching delays during rush hours. It is a standard multi-lane roundabout with four symmetrical arms and an external radius of 19.00 m. The geometric attributes are reported in Figure 1.
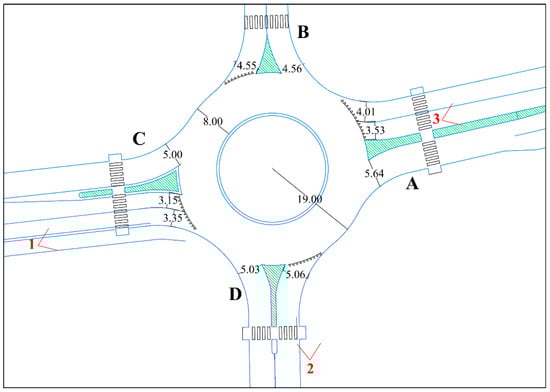
Figure 1.
Geometric characteristics of the case study roundabout and points of shot.
We performed a traffic survey on the investigated roundabout during different ordinary working days by using three video cameras (as reported in Figure 1) for a total of nine hours of investigation obtaining: time of service, critical gaps, queue lengths, approaching delays, and traffic flows. Figure 2 reports the O/D matrix recorded during the afternoon rush hour and homogenized in vehicles per hour by means of the coefficients reported in the Highway Capacity Manual 2010 [33].
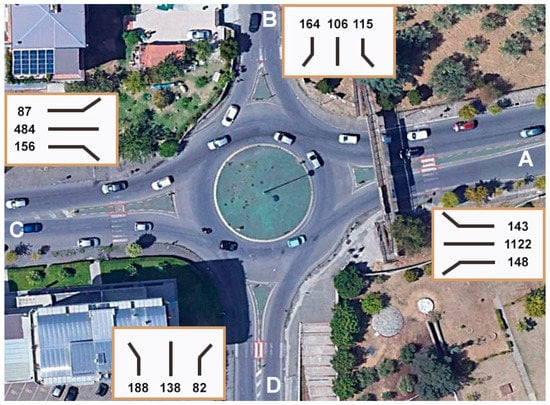
Figure 2.
Traffic volumes during the afternoon peak hour.
The directional organization and composition of the traffic streams, presented in Figure 2, shows that entrance A of the roundabout has the highest volume of all four approaches and that 80% of this traffic moves towards entrance C. These unbalanced flow patterns, especially during rush hours, cause long queues, non-uniform lane use, and a notable decrease in entry capacity.
Table 1 shows the queue lengths observed during the rush hour for each entrance approach.

Table 1.
Observed queue lengths.
2.2. Conversion of a Standard Roundabout into an Egg Turbo Roundabout
Italian legislation still does not include turbo roundabouts as a solution for at-grade intersections, however many studies have demonstrated the advantages of this solution [6,7,16]. For this reason, the first turbo roundabouts are going to be built in Northern Italy, considering their capacity to improve the performance and the level of safety of the intersection. Additionally, this kind of geometry is a sustainable transport solution because it is pedestrian and cyclist friendly. The raised curbs are not a problem for either heavy vehicles (trucks can pass over them if necessary) or for motorcyclists (as demonstrated in other countries [34]).
Therefore, we decided to convert the case study roundabout into an egg turbo roundabout: the choice of the turbo-blocks determines the geometric features of the intersection. As reported by Tollazzi et al., “Each block is generated by a formation of all the necessary radii, which must be rotated in a certain way, in order to obtain the different traffic lanes. The size of radii of a standard turbo roundabout and the width of the circulatory lane must be selected in order to guarantee a driving speed through the roundabout not exceeding 40 km/h” [34]. Figure 3 shows the geometric attributes of the investigated roundabout after its transformation into an egg turbo roundabout.
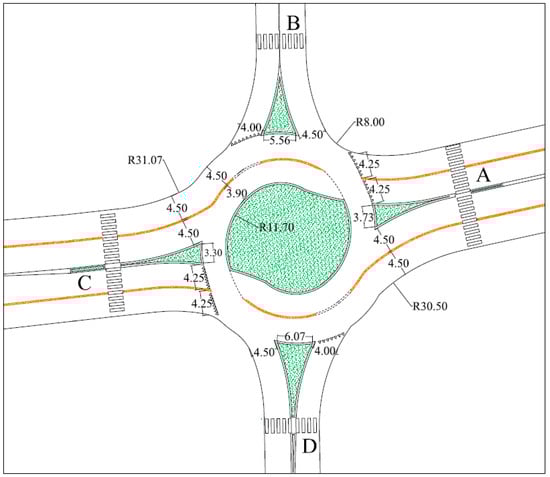
Figure 3.
Geometric features of the turbo roundabout.
2.3. Capacity Evaluation of the Two Roundabout Layouts
We used the original Bovy method to evaluate the capacity of the standard roundabout. In this model, the entry’s capacity depends on the circulating flow and the number of entry lanes.
With:
where C is the entering capacity (veh/h), QC is the circulating flow (veh/h), QU is the exiting flow (veh/h), Qg is the disturbance flow (veh/h), and α, β, and γ are parameters respectively linked to the influence of the exiting flow, the number of circulatory lanes, and the number of entry lanes.
Table 2 shows the capacity evaluation of the case study roundabout according to the Bovy model by using the traffic distribution reported in Figure 2 and the geometric features of the roundabout (Figure 1).
Table 2.
Entries’ capacity of the case study roundabout.
After the transformation of the case study roundabout into a virtual egg turbo roundabout, the authors calculated the entries’ capacity by using the Bovy modified method according to Dutch experiments [35]. Fortuijn divided the β parameter into b1 and b2 (respectively related to the inner and the outer circulatory lane), and did the same thing for the correction factor of the influence of the exiting flow, α. In this way, it is possible to separately calculate the capacity of each traffic lane, as reported in the following equations:
where C0 is equal to 1550; indices 1 and 2 are related respectively to the left and the right entering lane; QR is the circulating flow, with indices m and M related respectively to the smaller and the bigger of the two intensities of the circulating flow; and indices N and Z refer respectively to the intensity of the traffic flow on the inner and on the outer circulatory carriageway lanes.
Table 3 summarizes the results for the turbo roundabout’s capacity. In this case, equations (3) and (4) allow the capacity of each entering lane to be calculated separately: the sum of the single capacities of the entering lanes determines the overall capacity of the branch.
Table 3.
Entries’ capacity of the turbo roundabout.
The results of Table 3 evince that the level of capacity of the turbo roundabout, calculated with the modified Bovy method according to the Dutch guidelines [35], is decidedly higher than that of the existing roundabout.
Figure 4 shows the strong increase of capacity for all the roundabout’s entries after its transformation into an egg turbo roundabout. In particular, the capacity of approach B increases more than 90%, while for entries A and C the increase is more than 40%; for approach D, the increase is limited to only 11%.
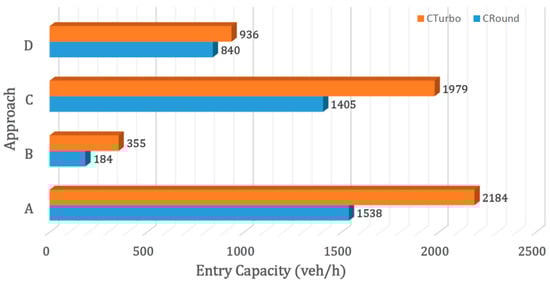
Figure 4.
Comparison of capacities between the existing roundabout and the virtual turbo roundabout.
3. Results and Discussion
3.1. Simulation of Roundabout Scenario
We used VISSIM® 9.0 to simulate the two roundabout scenarios and to support the results of the previous paragraph. Starting from data acquired throughout the several recordings on the investigated roundabout (traffic distribution, approaching and circulating speeds, queue lengths, approaching delays, time of service, and critical gaps), we implemented a two-step calibration procedure of VISSIM, taking into account what was reported by Gallelli et al. [23]. The minimization of the difference between field-measured and simulated queue lengths in the case study roundabout was the goal of the calibration process. According to Vaiana et al. [24], the authors implemented the scenarios after a preventive analysis about the most important parameters for the variance of results. A total of 1248 scenarios were carried out in order to assess the performance of the existing roundabout by combining the following parameters:
- directional distribution of the traffic flow as reported in Figure 2;
- approaching, circulating, and exiting speed distribution;
- position and length of the reduced speed area;
- headway and minimum gap for the conflict zones;
- driver behavior parameters [23] according to Wiedemann’s car-following model [36].
Table 4 shows the values of the most significant parameters after the calibration procedure: this combination is the best estimate obtained from the genetic algorithm used in [23].
Table 4.
Calibrated parameters of the best scenario.
Considering the best scenario, the percentage deviation of each entry between field-measured and simulated queue lengths ranges between −4.5% and +18.4%, as reported in Figure 5.
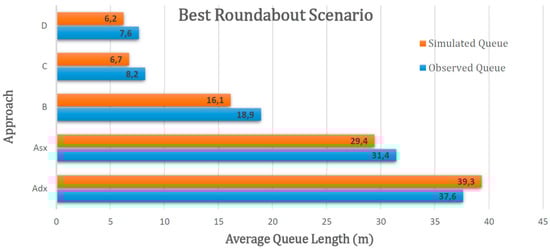
Figure 5.
Comparison between field-measured and simulated queue lengths on the existing roundabout.
After the calibration of the standard roundabout scenario, we used the same settings to define the turbo roundabout scenario: the goal was to evaluate the potential improvements of this solution in terms of performance [11].
The histograms of Figure 6 show a notable reduction of the average queue lengths after the transformation of the standard roundabout into an egg turbo roundabout. Three of the four approaches denote a percentage improvement of about 90%; approach B presents the worst performance, with a reduction in the average queue length of 64%. Therefore, the results obtained with the simulation process confirm how an egg turbo roundabout can be useful in the presence of unbalanced traffic flows.
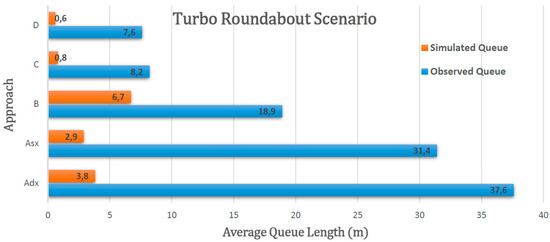
Figure 6.
Comparison between observed (existing roundabout) and simulated queue lengths in the virtual turbo roundabout.
3.2. Safety Analysis
SSAM is a tool that analyzes the trajectory files produced by microsimulation software in order to estimate the surrogate safety measures and the locations of potential conflicts corresponding to each vehicle-to-vehicle interaction. In this case, we used SSAM to evaluate the level of safety of the two roundabout configurations by using the trajectory files obtained from VISSIM [31]: this is an alternative approach in the absence of accident data [37].
Figure 7 shows the spatial distribution of the rear-end, lane-change, and crossing conflicts for the best calibrated roundabout scenario, where different colors identify the various types of conflicts.
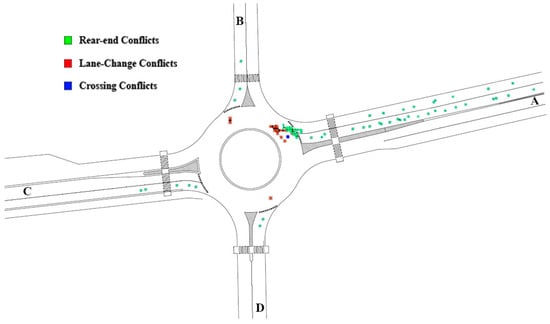
Figure 7.
Location of the potential conflicts in the best roundabout scenario.
It can be noted that the potential conflicts are almost exclusively localized to entry A in the best roundabout scenario. This may be because the case study intersection is characterized by unbalanced traffic flows: about 50% of the whole traffic flow comes from entry A. This prevailing direction generates long queues during rush hours. This is probably the cause of the dense distribution of rear-end conflicts (green squares) along approach A.
The same procedure was used for the turbo roundabout scenario. Figure 8 shows the location of all the potential conflicts for this solution. Also in this case, various colors mark different types of conflicts.
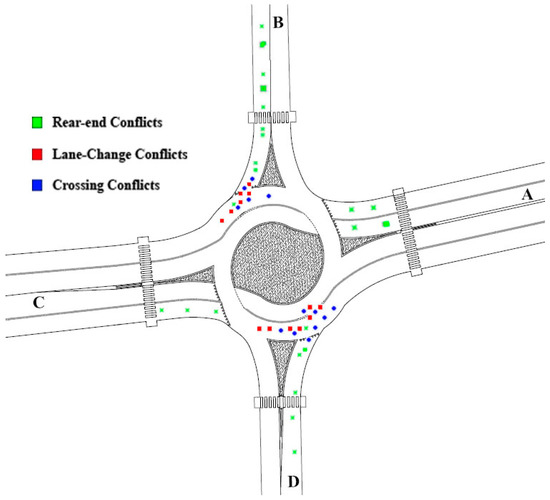
Figure 8.
Location of the potential conflicts in the turbo roundabout scenario.
A comparison between Figure 7 and Figure 8 highlights the main differences between the two configurations:
- the drastic reduction of queue length on approach A by using the turbo roundabout scheme, as reported in Figure 6, justifies the almost total disappearance of rear-end conflicts on the same branch;
- the appearance of rear-end conflicts on approach B is due to the high circulating flow in front of the same node (this approach gave the worst performance in terms of queue reduction);
- the increase of crossing and lane-change conflicts, in particular near to entry B and to entry C, is certainly due to the specific features of the spiraling circular carriageways in fact, the solid curb, which separates the two lanes of the circulatory carriageway, is exactly interrupted near to the two approaches in order to allow the use of the inner lane;
- in general, as reported in Table 5, the strong decrease in the total number of potential conflicts (85%), especially in terms of rear-end conflicts (95%), underlines the notable reduction of queue lengths on all the approaches.
Table 5. Comparison of potential conflicts between roundabout and turbo roundabout scenario.
Finally, considering the lack of crash data for the case study roundabout and the “virtual” turbo roundabout configuration, we used the potential conflict prediction model reported by Mauro et al. [27] in order to corroborate the SSAM results.
Table 6 shows that the potential conflict prediction model used to validate the SSAM analysis gave good results for the case study roundabout, while for the turbo roundabout’s configuration the difference seems to be quite notable. However, this comparison confirms a preliminary indication of the turbo roundabout’s benefits in terms of safety: the annual number of potential conflicts decreases by 85% with SSAM and by 73% considering Mauro’s model. However, other roundabouts with different geometric features must be considered in order to give more significance to this validation test.
Table 6.
Comparison of potential conflicts between the two roundabout scenarios considering Surrogate Safety Assessment Model (SSAM) and Mauro et al. [27] model results.
4. Conclusions
This study analyzed the effect of turbo roundabouts on capacity, queue lengths, and potential conflicts. After a traffic survey performed on a muti-lane roundabout, microscopic simulation software was used to estimate the consequences of the conversion of this intersection into an egg turbo roundabout. Data acquired throughout the several recordings on the investigated roundabout, (O/D matrix, average speeds, queue lengths, approaching delays, time of service, and critical gaps) were used to carry out a calibration procedure of VISSIM by minimizing the difference between field-measured and simulated queue lengths. The results showed a capacity growth that ranges from 11% to 92% according to the entry; in particular, approach A, the most loaded branch, registered a capacity rise of 42%. Afterwards, VISSIM was used to explore the effect of the virtual turbo roundabout on the queue lengths. The results indicated important reductions: higher than 90% for approaches A, C, and D, and about 64% for entry B.
After that, the two roundabout scenarios were compared in terms of the spatial distribution of the potential conflicts determined with SSAM. This analysis allowed the following considerations:
- the drastic reduction of queue length on approach A by using the turbo roundabout scheme justifies the almost total disappearance of rear-end conflicts on the same branch;
- the appearance of rear-end conflicts on approach B is due to the high circulating flow in front of the same node (this entry gave the worst performance in terms of queue reduction);
- the increase of crossing and lane-change conflicts, in particular near to entry B and entry D, is certainly due to specific features of the spiraling circular carriageways; in fact, the solid curb, which separates the two lanes of the ring, is exactly interrupted near to the two approaches in order to allow the use of the inner lane;
- in general, the strong decrease in the total number of potential conflicts (85%), especially in terms of rear-end conflicts (95%), underlines the notable reduction of queue length on all the approaches.
On the basis of these results, the proposed solution of an egg turbo roundabout increased both operational and safety performance of the multi-lane roundabout. However, these considerations are exclusively related to this particular case study: the authors only considered a comparison in terms of localization of the potential conflicts between the two roundabout configurations. More reliable indications must be obtained in terms of safety measures, for example considering other kinds of intersections and specific safety parameters (Time To Collision, Post-Encroachment Time, Deceleration Rate to Avoid the Crash, etc.).
Author Contributions
The authors contributed equally to all parts of the paper.
Funding
This research received no external funding, but it was performed as part of the employment of the authors at the Department of Civil Engineering at the University of Calabria (Italy).
Conflicts of Interest
The authors declare no conflict of interest.
References
- NCHRP Report-572. Roundabouts in the United States; National Cooperative Highway Research Program, Transportation Research Board, National Academies of Sciences: Washington, DC, USA, 2007. Available online: https://www.google.com/url?sa=t&rct=j&q=&esrc=s&source=web&cd=1&ved=2ahUKEwjBg_i2-PPfAhWNOnAKHaDTDqkQFjAAegQICRAC&url=https%3A%2F%2Fnacto.org%2Fdocs%2Fusdg%2Fnchrprpt572.pdf&usg=AOvVaw1VhuXup9SWPqALL-862bEd (accessed on 16 January 2019). [CrossRef]
- Montella, A. Identifying crash contributory factors at urban roundabouts and using association rules to explore their relationship to different crash types. Accid. Anal. Prev. 2011, 43, 1451–1463. [Google Scholar] [CrossRef] [PubMed]
- Yok, Y.H.; Gibson, H.M.; Waterson, B.J. An International Review of Roundabout Capacity Modelling. Transp. Rev. 2013, 33, 593–616. [Google Scholar] [CrossRef]
- Vaiana, R.; Gallelli, V.; Iuele, T. Methodological Approach for Evaluation of Roundabout Performances through Microsimulation. Appl. Mech. Mater. 2012, 253–255, 1956–1966. [Google Scholar] [CrossRef]
- Meneguzzer, C.; Gastaldi, M.; Arboretti Giancristofaro, R. Before-and-After Field Investigation of the Effects on Pollutant Emissions of Replacing a Signal-Controlled Road Intersection with a Roundabout. J. Adv. Transp. 2018. [Google Scholar] [CrossRef]
- Fortuijn, L.G.H. Design Principles and Safety Performance. Transp. Res. Rec. 2009, 2096, 16–24. [Google Scholar] [CrossRef]
- Engelsman, J.C.; Uken, M. Turbo roundabouts as an alternative to two lane roundabouts. In Proceedings of the 26th annual Southern African Transport Conference, Pietermaritzburg, KwaZulu-Natal, South Africa, 9–12 July 2007. [Google Scholar]
- Gallelli, V.; Vaiana, R.; Iuele, T. Comparison between simulated and experimental crossing speed profiles on roundabout with different geometric features. Procedia Soc. Behav. Sci. 2014, 111, 117–126. [Google Scholar] [CrossRef]
- Silva, A.B.; Seco, A.J.M. Trajectory deflection influence on the performance of roundabouts. In Proceedings of the European Transport Conference (ETC), Strasbourg, France, 3–5 October 2005. [Google Scholar]
- Bastos, S.A.; DA Maia, S.Á.J.; DA Silva, J.P.C. Characterization of Trajectories Adopted at Roundabout Crossings. In Proceedings of the European Transport Conference (ETC), Strasbourg, France, 18–20 September 2006. [Google Scholar]
- Praticò, F.G.; Vaiana, R.; Gallelli, V. Micro-simulation effectiveness in predicting operating speed profiles in a roundabout. Adv. Transp. Stud. 2015, 37, 5–14. [Google Scholar] [CrossRef]
- Almoarawi, M.; Dabbour, E. Predicting Operating Speeds at Urban Multilane Roundabouts in Abu Dhabi, United Arab Emirates. J. Adv. Transp. 2018, 2018, 1–10. [Google Scholar] [CrossRef]
- Brilon, W. Studies on Roundabouts in Germany: Lessons Learned. In Proceedings of the 3rd International TRB Roundabout Conference, Carmel, IN, USA, 18–20 May 2011. [Google Scholar]
- Silva, A.B.; Santos, S.; Gaspar, M. Turbo-roundabout use and design. In Proceedings of the CITTA 6th Annual Conference on Planning Research responsive transports for smart mobility, Coimbra, Portugal, 17 May 2013. [Google Scholar]
- Vasconcelos, L.; Silva, A.B.; Seco, A.M.; Fernandes, P.; Coelho, M.C. Turboroundabouts Multicriterion Assessment of Intersection Capacity, Safety, and Emissions. Transp. Res. Rec. 2014, 2402, 28–37. [Google Scholar] [CrossRef]
- Tollazzi, T.; Renčelj, M. Comparative analyse of the two new alternative types of roundabouts—Turbo and flower roundabout. Balt. J. Road Bridg. Eng. 2014, 9, 164–170. [Google Scholar] [CrossRef]
- Mauro, R.; Branco, F. Comparative analysis of compact multilane roundabouts and turbo-roundabouts. J. Transp. Eng. ASCE 2010, 136, 316–322. [Google Scholar] [CrossRef]
- Džambas, T.; Ahac, S.; Dragčević, V. Geometric design of turbo roundabouts. Tech. Gaz. 2017, 24, 309–318. [Google Scholar] [CrossRef][Green Version]
- Silva, A.B.; Mariano, P.; Silva, J.P. Performance assessment of turbo-roundabouts in corridors. Transp. Res. Procedia 2015, 10, 124–133. [Google Scholar] [CrossRef]
- Shaaban, K.; Hamad, H. Group Gap Acceptance: A New Method to Analyze Driver Behavior and Estimate the Critical Gap at Multilane Roundabouts. J. Adv. Transp. 2018, 2018, 1–9. [Google Scholar] [CrossRef]
- Lee, D.; Hwang, S.; Ka, E.; Lee, C. Evaluation of the Rain Effects on Gap Acceptance Behavior at Roundabouts by a Logit Model. J. Adv. Transp. 2018, 2018, 1–11. [Google Scholar] [CrossRef]
- Praticò, F.G.; Vaiana, R.; Gallelli, V. Transport and traffic management by micro simulation models: Operational use and performance of roundabouts. In WIT Transactions on the Built Environment; Urban Transport XVIII; Longhurst, J.W.S., Brebbia, C.A., Eds.; WIT Press: Southampton, UK, 2012; Volume 128, pp. 383–394. ISBN 978-1-84564-580-9. [Google Scholar]
- Gallelli, V.; Iuele, T.; Vaiana, R.; Vitale, A. Investigating the transferability of calibrated microsimulation parameters for operational performance analysis in roundabouts. J. Adv. Transp. 2017, 2017, 1–10. [Google Scholar] [CrossRef]
- Vaiana, R.; Gallelli, V.; Iuele, T. Sensitivity analysis in traffic microscopic simulation model for roundabouts. Balt. J. Road Bridg. Eng. 2013, 8, 174–183. [Google Scholar] [CrossRef]
- Guido, G.; Vitale, A.; Saccomanno, F.F.; Gallelli, V. Sensitivity of simulated vehicle tracking profiles for input into safety performance analysis. Adv. Transp. Stud. 2016, 2, 65–74. [Google Scholar] [CrossRef]
- Mauro, R.; Cattani, M. Potential accident rate of turbo-roundabouts. In Proceedings of the 4th International Symposium on Highway Geometric Design, Valencia, Spain, 2–5 June 2010. [Google Scholar]
- Mauro, R.; Cattani, M.; Guerrieri, M. Evaluation of the safety performance of turbo roundabouts by means of a potential accident rate model. Balt. J. ROAD Bridg. Eng. 2015, 10, 28–38. [Google Scholar] [CrossRef]
- Bulla-Cruz, L.A.; Castro, W. Analysis and comparison between two-lane roundabouts and turbo roundabouts based on a road safety audit methodology and microsimulation: a case study in urban area. In Proceedings of the 3rd International Conference on Road Safety and Simulation, Indianapolis, IN, USA, 14–16 September 2011. [Google Scholar]
- Yperman, I.; Immers, B. Capacity of a turbo-roundabout determined by micro-simulation. In Proceedings of the 10th World Congress and Exhibition on Intelligent Transport Systems and Services, Madrid, Spain, 17–20 November 2003. [Google Scholar]
- Huang, F.; Liu, P.; Yu, H.; Wang, W. Identifying if VISSIM simulation model and SSAM provide reasonable estimates for field measured traffic conflicts at signalized intersections. Accid. Anal. Prev. 2013, 50, 1014–1024. [Google Scholar] [CrossRef]
- Vasconcelos, L.; Silva, A.B.; Seco, A. Safety analysis of turbo-roundabouts using the SSAM technique. In Proceedings of the CITTA 6th Annual Conference on Planning Research responsive transports for smart mobility, Coimbra, Portugal, 17 May 2013. [Google Scholar]
- Essa, M.; Sayed, T. Transferability of calibrated microsimulation model parameters for safety assessment using simulated conflicts. Accid. Anal. Prev. 2015, 84, 41–53. [Google Scholar] [CrossRef] [PubMed]
- TRB. Highway Capacity Manual—HCM 2010; Transportation Research Board, National Research Council: Washington, DC, USA, 2010. [Google Scholar] [CrossRef]
- Tollazzi, T.; Rencelj, M.; Turnsek, S. Slovenian Experiences With Alternative Types of Roundabouts—‘Turbo’ and ‘Flower’ Roundabouts. In Proceedings of the 8th International Conference Environmental Engineering, Vilnius, Lithuania, 19–20 May 2011. [Google Scholar]
- Fortuijn, L.G.H. Turbo Roundabouts. Transp. Res. Rec. J. Transp. Res. Board 2009, 2130, 83–92. [Google Scholar] [CrossRef]
- Wiedemann, R. Simulation des Strassenverkehrsflusses; Schriftenr. des Instituts für Verkehrswes der Univ. Karlsruhe: Karlsruhe, Germany, 1975. [Google Scholar]
- Giuffrè, T.; Trubia, S.; Canale, A.; Persaud, B. Using microsimulation to evaluate safety and operational implications of newer roundabout layouts for European Road networks. Sustainability 2017, 9, 2084. [Google Scholar] [CrossRef]


© 2019 by the authors. Licensee MDPI, Basel, Switzerland. This article is an open access article distributed under the terms and conditions of the Creative Commons Attribution (CC BY) license (http://creativecommons.org/licenses/by/4.0/).