Article

Spatiotemporal Changes in Evapotranspiration from an Overexploited Water Resources Basin in Arid Northern China and Their Implications for Ecosystem Management

1
Department of Environmental Science and Engineering, Xiamen University of Technology, Xiamen 361024, Fujian, China
2
School of Civil Engineering, Sun Yat-Sen University, Guangzhou 510275, Guangdong, China
3
Guangdong Engineering Technology Research Center of Water Security Regulation and Control for Southern China, Sun Yat-sen University, Guangzhou 510275, Guangdong, China
4
School of Civil Engineering and Architecture, Jishou University, Zhangjiajie 427000, Hunan, China
5
School of Geography and Planning, Sun Yat-Sen University, Guangzhou 510275, Guangdong, China
*
Author to whom correspondence should be addressed.
Sustainability 2019, 11(2), 445; https://doi.org/10.3390/su11020445
Submission received: 14 November 2018 / Revised: 11 January 2019 / Accepted: 13 January 2019 / Published: 16 January 2019
(This article belongs to the Special Issue Rural Sustainable Environmental Management)

Abstract

:
Evapotranspiration (ET), including evaporation from soil and water surfaces and transpiration from vegetation, influences water distribution in the soil-plant-atmosphere continuum, especially in arid areas where water is a key limiting factor. Therefore, understanding the spatiotemporal dynamics of ET, including its two components of soil evaporation (Es) and vegetation transpiration (Ec), can be useful for water resource management and ecological restoration in arid regions. Based on ET data from 2002 to 2012, the spatiotemporal variations in ET were evaluated in the Shiyang River Basin in arid Northwest China. The results showed the following: (1) spatially, ET decreased from upstream of the Qilian Mountains to the middle and downstream, with a mean annual value of 316 mm; (2) temporally, ET showed a single peak curve throughout the year, with the highest value occurring in summer; (3) ET showed a downward trend (from 350 to 265 mm) before 2009 and thereafter increased (from 265 to 345 mm); and (4) water use efficiency, indicated by the ratio of Ec to ET, was low in the cropland, with a mean value of 50.9%. Further analysis indicates that decreases in ET are mainly caused by vegetation decreases; in contrast, ecological restriction measures and strict water resource management policies in the middle reaches of the basin led to ET increases. It is concluded that understanding ET and its two components can elucidate the connections between water and human society.

1. Introduction

The goal of sustainable development is to balance the human-nature equilibrium. However, it is challenging to achieve this goal because the human-nature system comprises complex interactions among hydrologic systems and climatic, ecological, biophysical, biochemical and socioeconomic systems [1,2]. Among these systems, the hydrologic system, including the processes of evapotranspiration (ET), condensation, precipitation, infiltration, streamflow, and groundwater flow, is dynamic in nature. In addition, the hydrologic process is intimately linked with energy exchanges between the atmosphere, ocean, and land, and the hydrologic system determines the spatiotemporal distribution of water resources [3,4], which are necessary for sustaining life on Earth. Under such conditions, quantifying the key hydrologic variables in space is required to provide a deep understanding and a detailed analysis of land surface processes; in turn, this knowledge provides crucial information for water resource management and informs policy decisions to enhance sustainable development [5,6].
Arid regions, accounting for one-third of the Earth’s terrestrial area [7], are particularly short of water. Water is a major limiting factor for the growth and development of vegetation in arid regions [2,8]. As such, sustainable development in arid regions unquestionably requires sustainable water resource management [2,5,8,9,10]. Precipitation and ET, the two vertical water fluxes, dominate arid hydrologic systems; the former is relatively low, whereas the latter, including evaporation from soil and water surfaces and transpiration from vegetation, is potentially high. Studies have revealed that land surface ET typically consumes approximately 60–90% of precipitation [11,12,13]. Therefore, an accurate assessment of the characteristics of the spatiotemporal distribution of ET can provide fundamental information for studying the feedback mechanism between vegetation and water [5,8,14].
The Shiyang River Basin, a typical inland river catchment located in the transitional zone of the Loess Plateau, Tibetan Plateau and Mengxin Plateau in arid Northwest China, has suffered a serious loss of natural vegetation and gradual soil salinization and desertification due to its limited water resources and inappropriate water-related human activities [15,16]. For example, artificial oases, including irrigation lands, have developed and expanded rapidly in recent decades, leading to water resource overexploitation [17]. The annual runoff of the Shiyang River at a hydrological station in the middle reaches was 0.57 billion m3 in the 1950s, but it decreased to 0.15 billion m3 in the 1990s because the runoff was consumed in the upper areas [17]. As such, groundwater resources were overexploited, with a value of 0.15 m3 billion in the 1950s, and this increased to 1.2 billion m3 in the 1990s [18]. The basin is relatively underdeveloped in China and agriculture is crucial to the local economy; therefore, agricultural irrigation consumes most of the water resources (approximately 86%) [19]. The groundwater level at the Minqin Oasis downstream of the basin was reported to be 22.4 m in 2009 [20]. However, the Minqin Oasis, located between the Tengger Desert and the Badain Jaran Desert, forms an important natural boundary against the encroachment of these two large deserts. Therefore, overexploitation and intensive human activities caused land desertification at such a rapid rate that the serious aftereffects drew the attention of both scientists and the Chinese government [21,22]. Beginning in 2001, Jiabao Wen, the former Prime Minister, repeatedly asserted the need to prevent, by any means, the Minqin Oasis from becoming the second Lop Nor, i.e., a desert that used to be an Oasis.
After years of effort, by implementing measures such as improving agronomic management, saving water, and transferring water from other basins, groundwater overexploitation and land desertification have been suppressed in the Shiyang River Basin [23,24]. As an indicator of the entire water loss from land, accurate measurements of ET and its spatiotemporal distribution would facilitate the surveillance of vegetation recovery and ecosystem restoration [5,6]. Specifically, Es and Ec, the soil and vegetation components of ET, are critical for evaluating and improving water use efficiency. Therefore, the objectives of this study are to assess the spatiotemporal characteristics of ET in the overexploited water resources of the Shiyang River Basin in arid northern China using long-term ET datasets and to analyze the possible reasons for the variations, as well as water use efficiency in the cropland, to facilitate sustainable water use and ecosystem management in the rural arid regions.

2. Materials and Methods

2.1. Study Area

The Shiyang River Basin is located approximately between 37°–39°27′ N and 101°41′−104°16′ E, and has an area of approximately 4.06 × 10⁴ km2 (see Figure 1). The river originates from the Qilian Mountains and flows into the downstream Minqin Oasis. The entire basin can be divided into the Qilian Mountain area in the upper south, with an elevation of 2000–5500 m, a plain area in the middle and a hilly and desert area in the lower north, with flat terrain and an elevation of 1300–2000 m. The climate in the basin varies distinctly from south to north: the upstream Qilian Mountain area has a mean annual precipitation of 300–600 mm and a potential ET of 700–1200 mm; the Hexi Corridor in the midstream is arid cold and has a mean annual precipitation of 150–300 mm and a potential ET of 1200–2000 mm; and in the lower reaches, precipitation is less than 150 mm, while the amount of potential ET exceeds 2000 mm.

2.2. Data and Analysis Method

The datasets used for this study include data on remotely sensed ET and its components data, remotely sensed land use and vegetation index data, meteorological observations, geospatial data, and social statistics.
The long-term ET data (MOD16, version 5) from 2002 to 2012 [25], with a spatial resolution of 1 km, was provided by the National Aeronautics and Space Administration (NASA) and used for the spatiotemporal analysis. The MOD16 was estimated using the Penman-Monteith (PM) method (Equation (1)), global reanalysis meteorological data, and MODIS (the Moderate Resolution Imaging Spectroradiometer)-based remotely sensed data (version 5), including the vegetation index and land use maps [25,26]. A detailed description and parameterization of the model can be found in Mu et al. [25,26]. The 8-day MOD16A2 data were retrieved and averaged for the Shiyang River Basin and used to perform the spatial and temporal statistics, based on which the variation in ET was assessed and analyzed.
λ E = s × ( R n G ) + ρ a i r C p ( e s e a ) / r a s + γ ( 1 + r s / r a ) ,
where λE is latent heat flux (λ is latent heat of vaporization and E is evapotranspiration) in W m−2; Rn and G are the net radiation and soil heat flux in W m−2, respectively; s is the slope of the saturation vapor pressure curve; ρair is the air density; Cp is the specific heat of air at constant pressure; es and ea are the saturation vapor pressure and actual vapor pressure in kPa, respectively; γ is the dry and wet bulb constant; ra is the aerodynamic resistance; and rs is the surface resistance in s m−1.
Another ET dataset (MOD3T), including its two components of Es and Ec from 2008 to 2011 [27], with the same spatiotemporal resolution as MOD16A2 was used to compensate for the shortcomings of MOD16. Specifically, MOD16 assumed that ET was zero in sparsely vegetated and barren regions and did not provide ET components, i.e., Es and Ec [25,26]. The MOD3T was estimated based on a three-temperature (3T) model (Equation (2)) and MODIS products (version 5), such as land surface albedo and temperature, vegetation indices and the fraction of absorbed photosynthetically active radiation (FPAR) [27,28]. A detailed description of the 3T model can be found in Xiong et al. [28]. The MOD3T datasets were used to perform the spatiotemporal analysis of ET in sparsely vegetated areas and to assess water use efficiency (WUE), represented by Ec/ET, for farmland.
λ E s = R n , s G s ( R n , s r G s r ) T 0 s T a T 0 s r T a s o i l λ E c = R n , c R n , c r T 0 c T a T 0 c r T a v e g e t a t i o n λ ( E T ) = λ E s + λ E c m i x t u r e   o f   s o i l   a n d   v e g e t a t i o n ,
where Es and Ec are the soil and vegetation components of ET, respectively, in mm s−1; Ta is the air temperature in K; and T0c and T0s are the temperatures (K) of the soil and vegetation components, respectively. The subscripts, “s” and “c” represent the soil and canopy components, respectively, whereas “sr” and “cr” represent the reference dry soil and reference dry canopy, respectively.
Daily meteorological data, including net radiation, rainfall, and air temperature, observed mainly at four national meteorological stations, namely, Wushaoling, Yongchang, Wuwei and Minqin, inside the basin from the China Meteorological Administration were averaged to represent the values of the entire basin.
Social data sets such as population and water related indices, including irrigation area, pumped groundwater, well numbers, and groundwater level were used to reflect the water consumption in the study basin in recent decades. Then, variations in these datasets were used to analyze the possible impact of human activities on the local water resources, vegetation, and ET.

3. Results

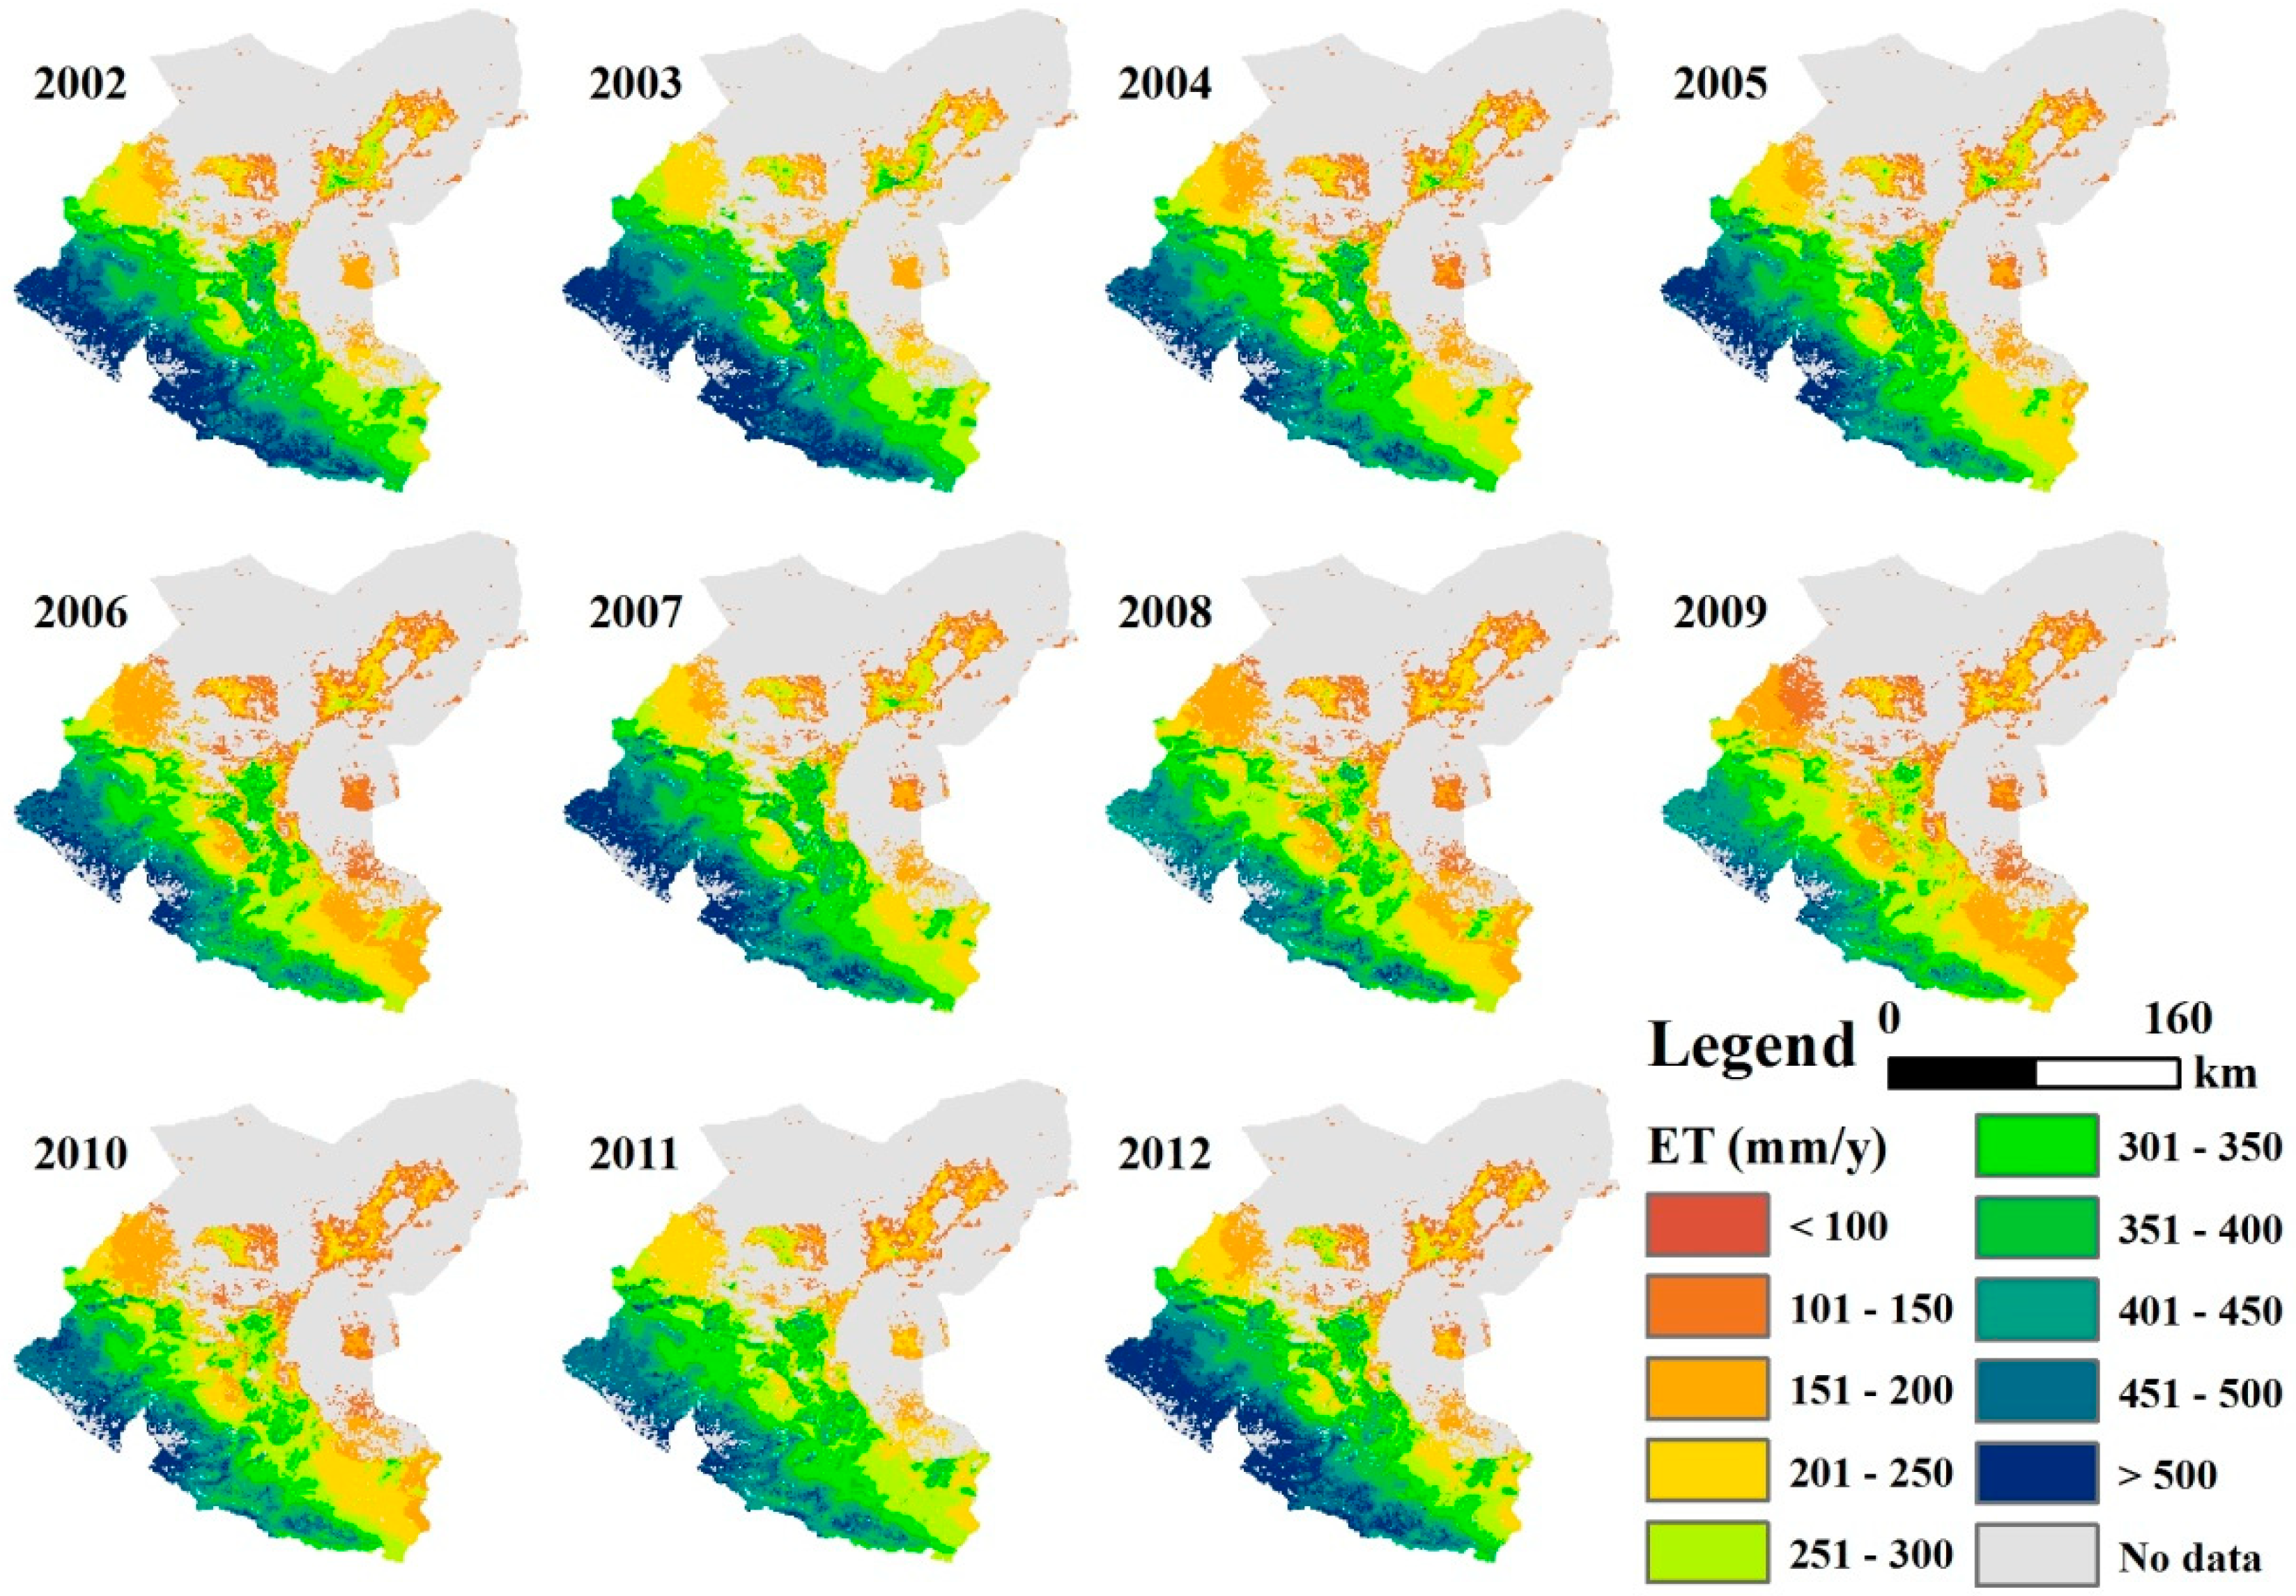
3.1. Spatial Distribution of ET

Figure 2 shows the spatial distribution of the annual ET for the study basin between 2002 and 2012. The MOD16 datasets assumed that ET was zero in the sparsely vegetated and barren areas [25,26], which is why the lower basin is shown in gray in Figure 2. As such, the following statistical results are based on the vegetated areas in the basin. The results show that the ET values were generally high in the southern areas (Qilian Mountains) and in the oasis, where vegetation coverage was high. The annual ET gradually declined from southwest to northeast, with the highest values in the upper Qilian Mountain area in the south (>450 mm y−1), followed by the middle plain area (250-400 mm y−1) and the lower reaches (<250 mm y−1). The characteristics of the ET distribution were consistent with the variation in climate and vegetation in the study region.

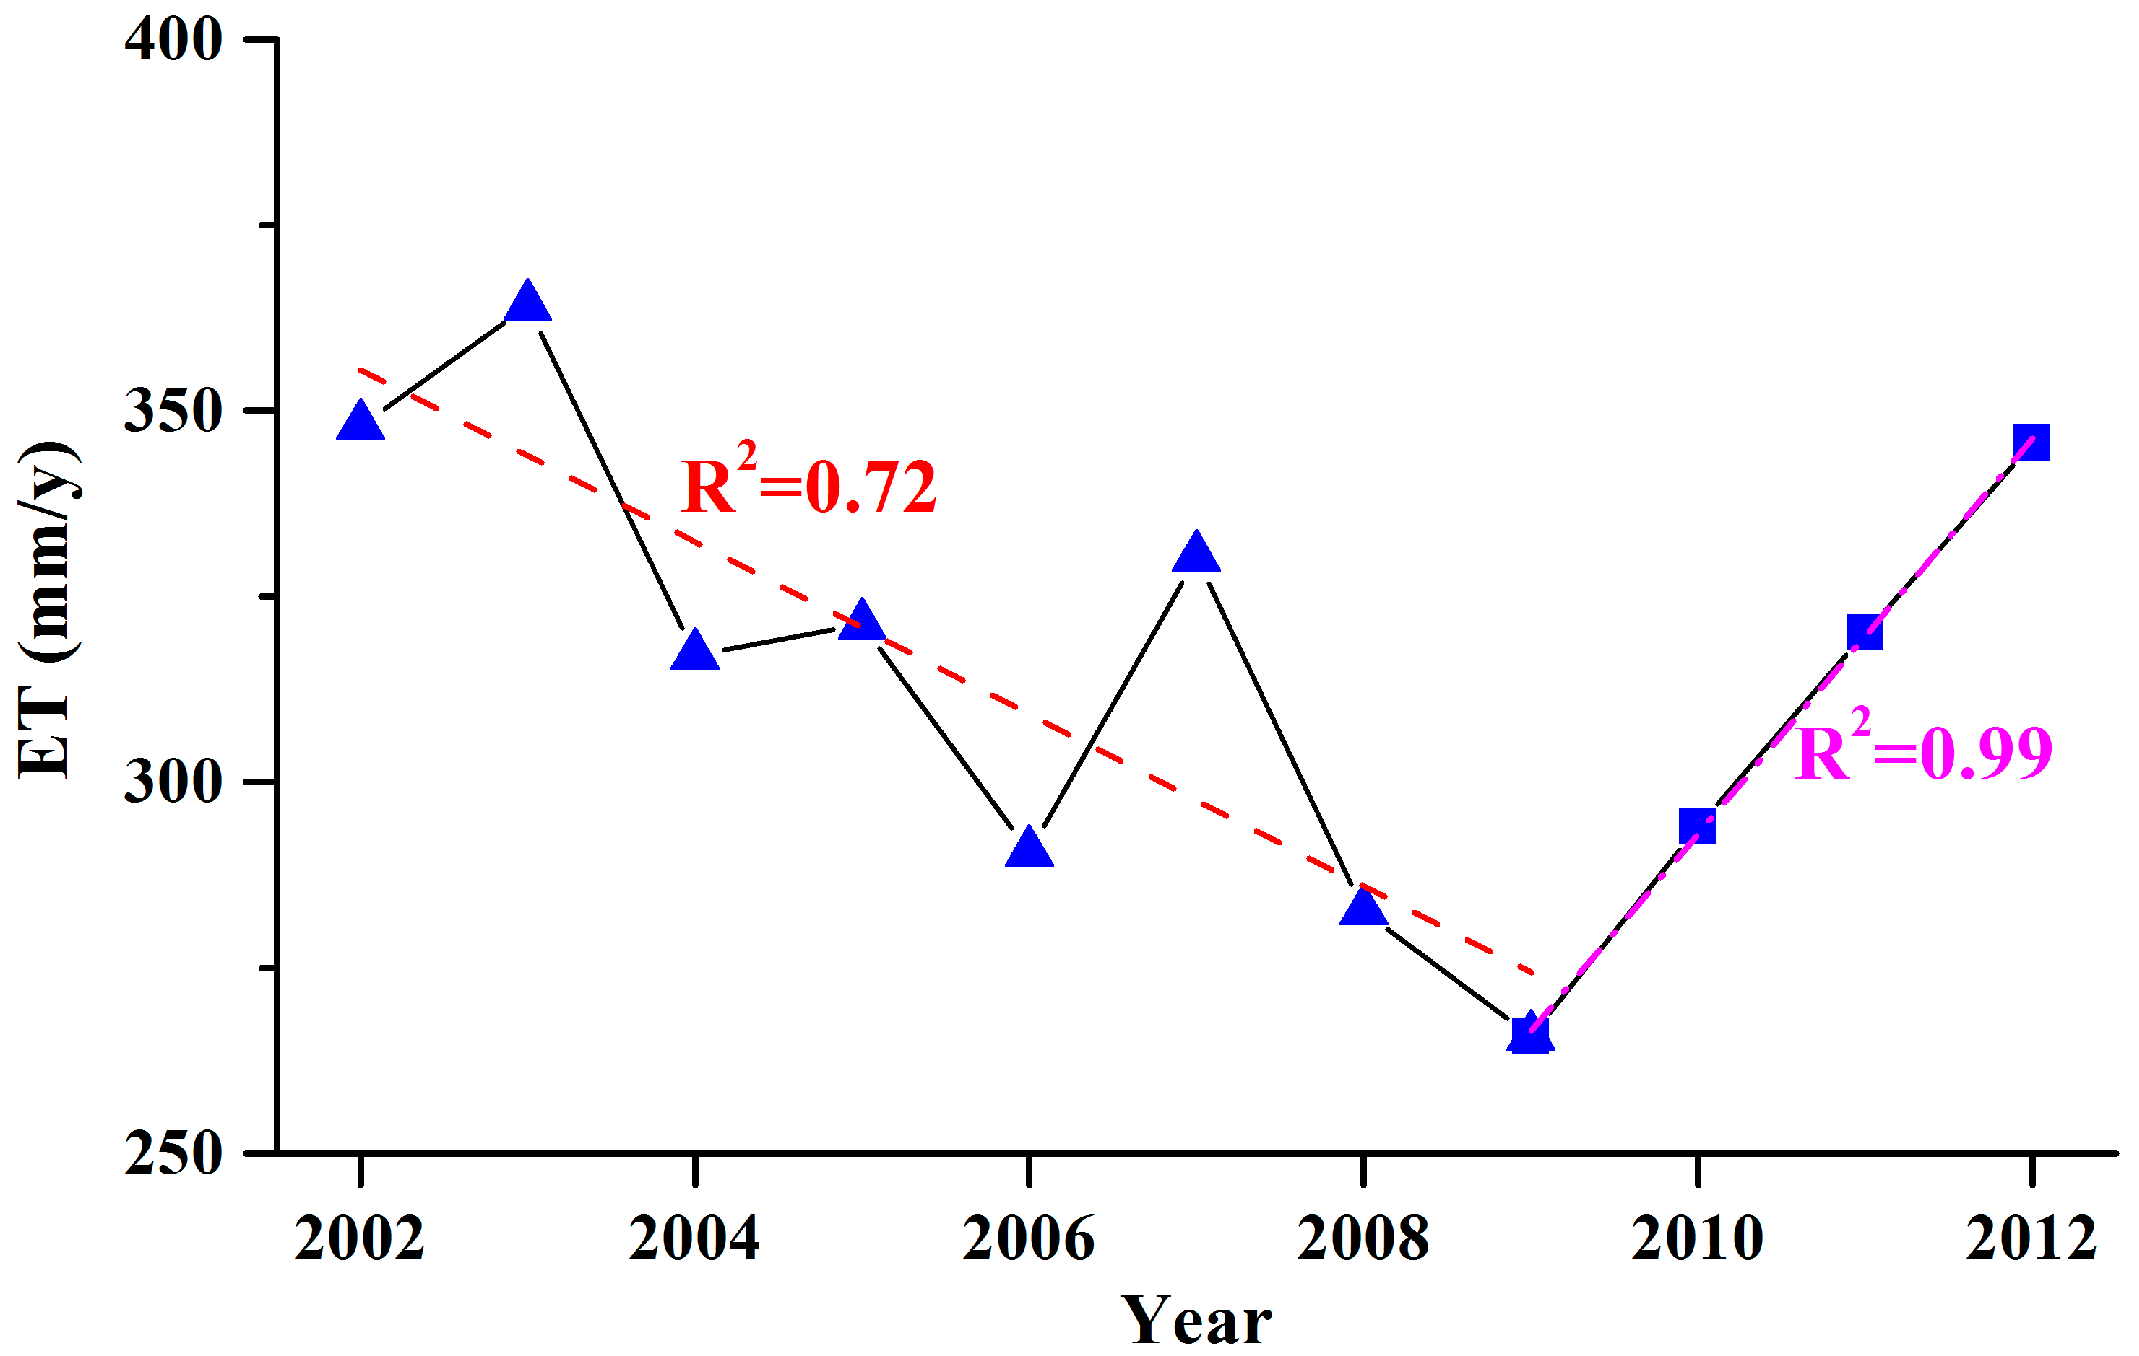
3.2. Temporal Variation in ET

Figure 3 shows the interannual change in ET. There were obvious fluctuations during the study period, with mean, maximum, and minimum values of 316 mm, 265 mm, and 364 mm, respectively. The annual ET declined before 2009 (R2 = 0.72), whereas it has increased since 2009, with an average rate of 27 mm a−1 (R2 = 0.99).
Figure 4 shows the intra-annual change in the multiyear average ET. Generally, the ET showed a sinusoidal variation for the multiyear period. Specifically, the ET values were lowest during winter and were high during spring because the temperature was low and the vegetation was dormant in winter, and the temperatures gradually increased and vegetation began to grow in spring. The maximum ET values occurred during summer as a result of increased temperatures and improved water conditions, i.e., approximately 80% of the annual precipitation was in summer. The ET values decreased as the temperatures dropped, and the vegetation growth slowed and ultimately stopped during autumn. The temporal ET variations were correlated with the climate of the basin.

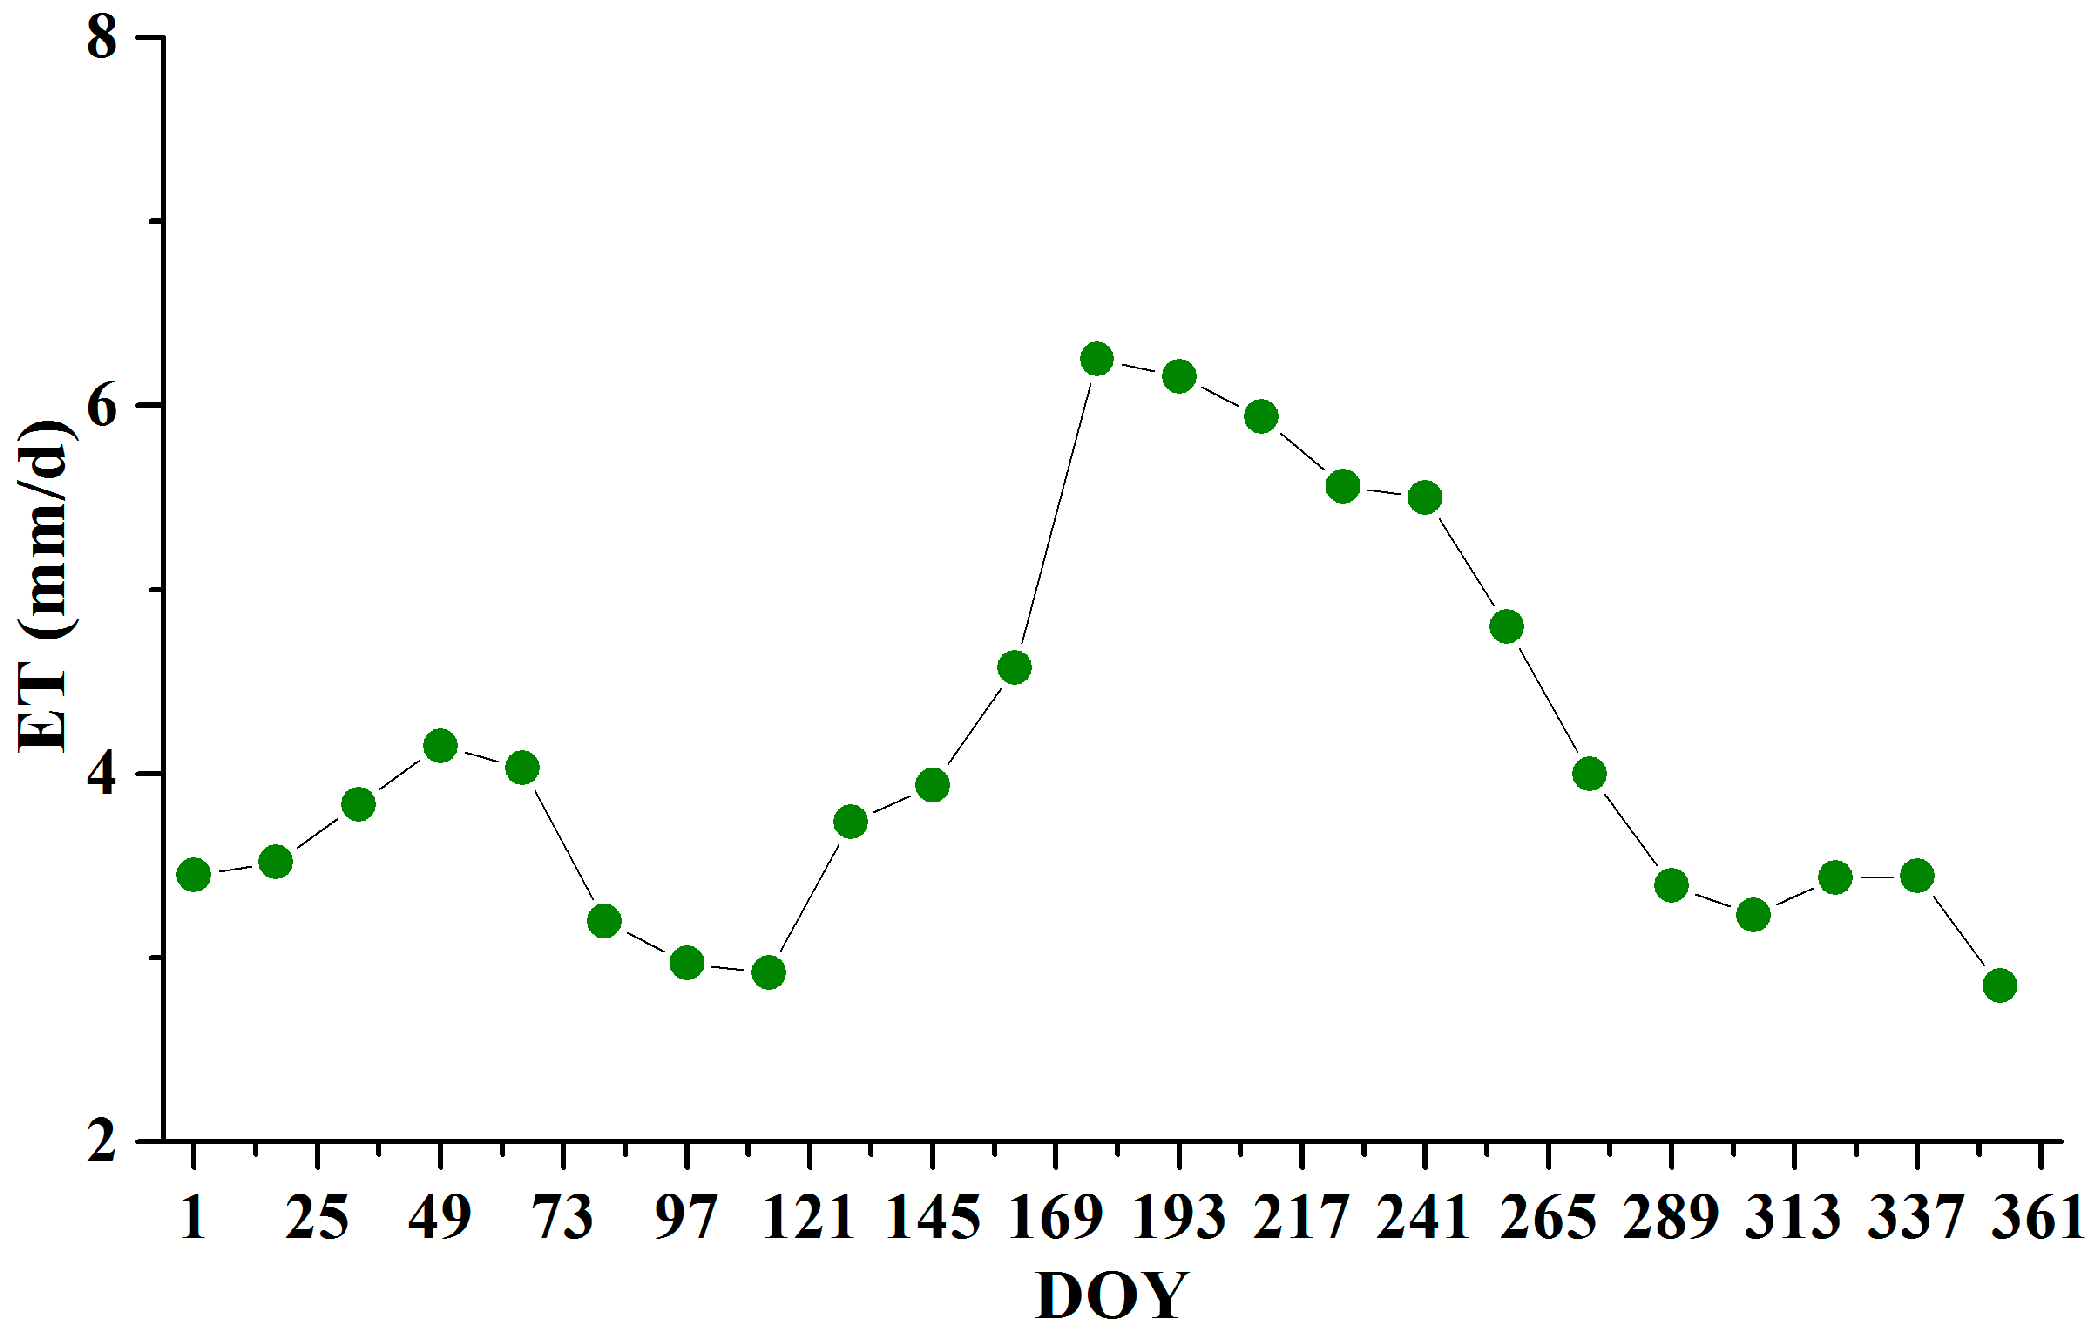
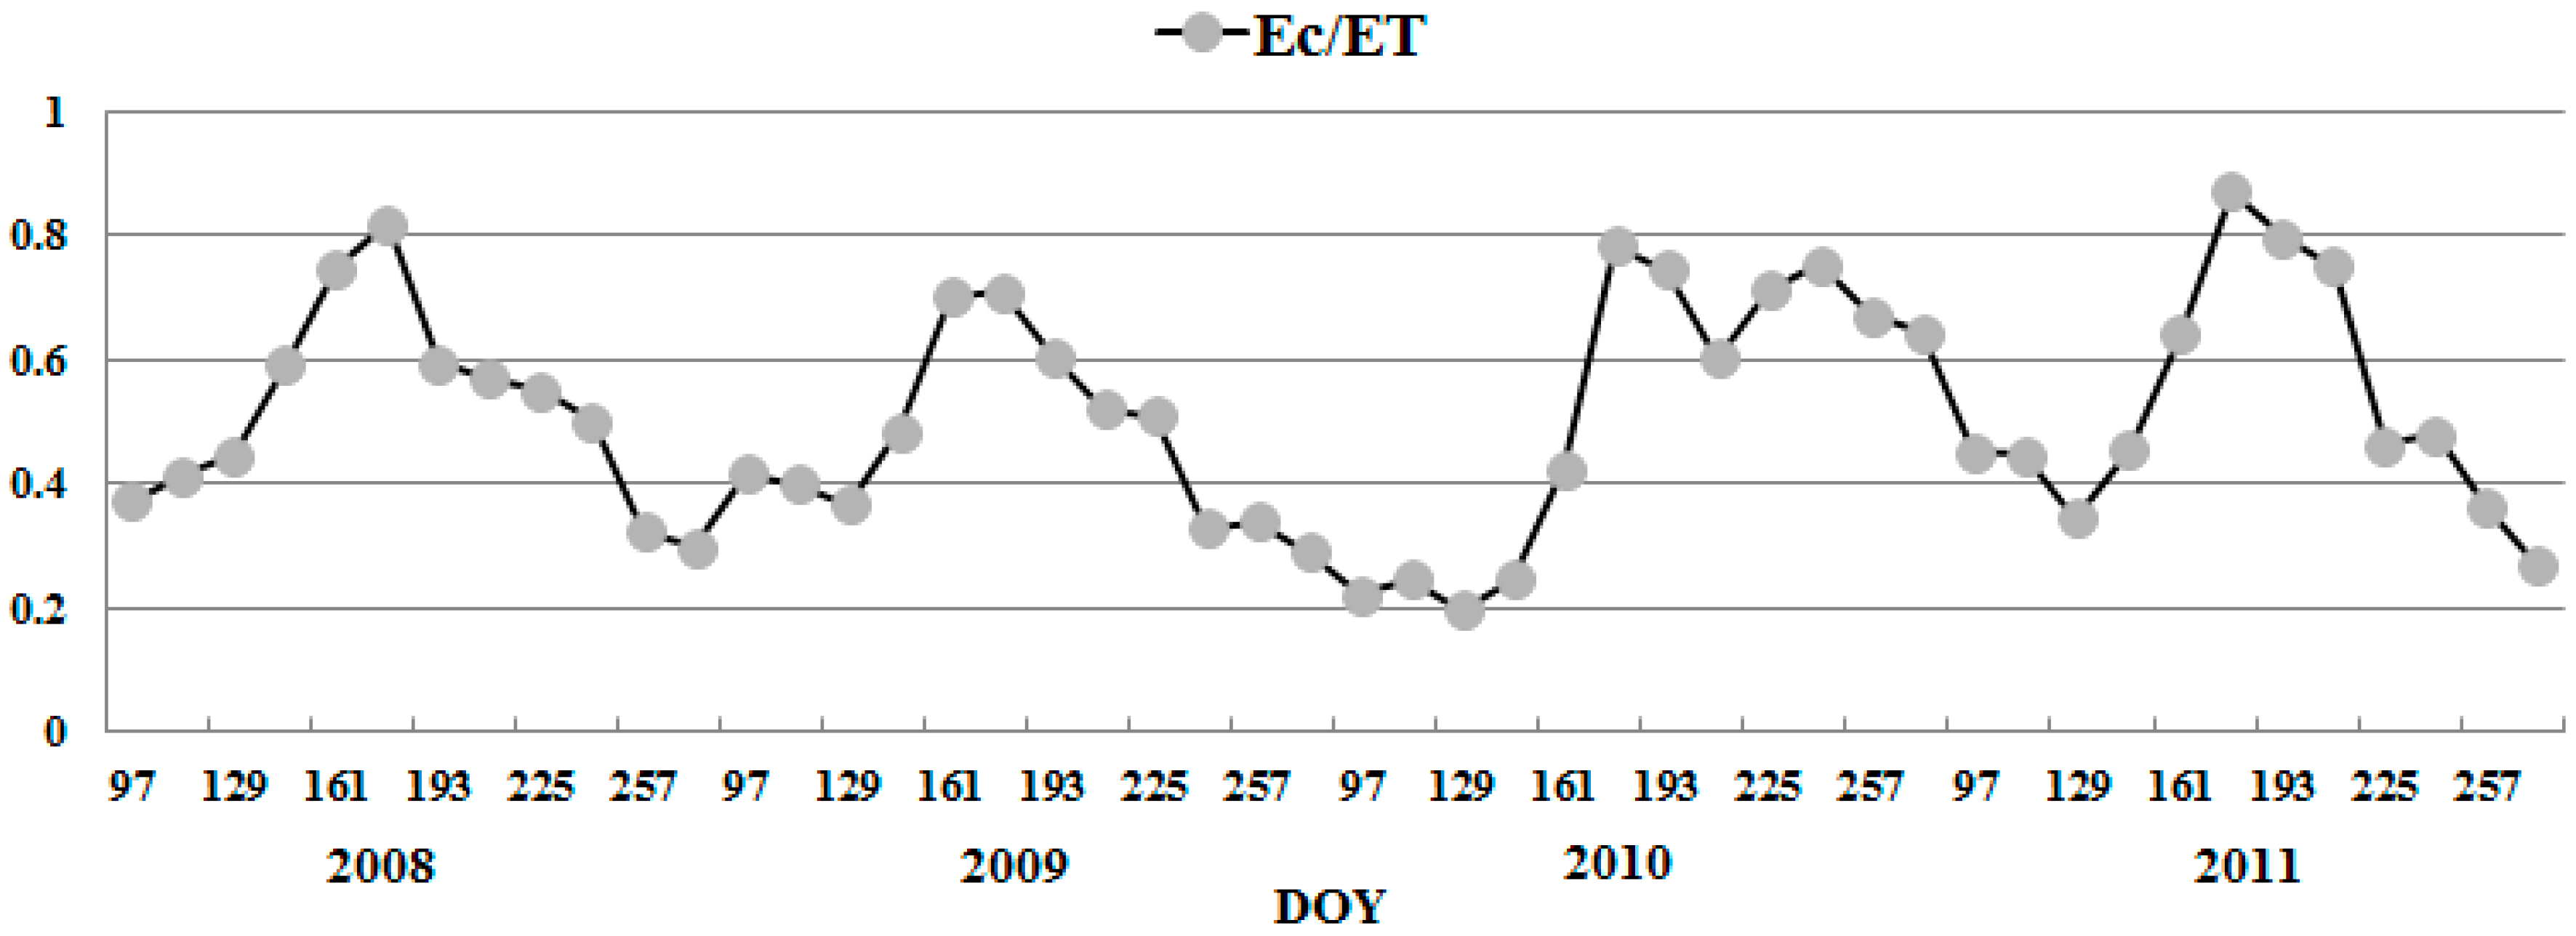
3.3. Characteristics of ET-Based Water Consumption in Farmland

Figure 5 evaluates the Es and Ec, the ET components of cropland during the growing season in the study basin based on the MOD3T data. Statistical results showed that the ratio of the Ec to ET (Ec/ET) ranged from 19.6 to 87.1% over the four-year period (2008-2011), with a mean value of 50.9%. In other words, approximately 49.1% of the water returned to the atmosphere in the form of soil evaporation. Although the value of Ec/ET showed some differences year to year, the change trend in each year was nearly the same, i.e., Ec/ET increased gradually before DOY 193, and thereafter, decreased gradually. Therefore, this finding indicates that certain volumes of irrigation water were lost in the form of soil evaporation.

4. Discussion

4.1. Bias in ET Estimation

Remotely estimating ET and its components is challenging and ET estimates contain certain bias [4,29]. Nonetheless, remote sensing is the only suitable method for mapping ET across a wide spatiotemporal scale [24,29]. The adopted MOD3T data sets were previously evaluated through a Bowen ratio flux observation of a sparsely vegetated community, with a mean absolute error (mean absolute percent error) of 0.16 mm d−1 (23%) [27].
In this study and as shown in Figure 6, the ET data sets, including MOD16 and MOD3T were further assessed on a yearly scale using water balance ET, which was derived based on the water balance equation for the study basin (i.e., ET = precipitation + transferred water + irrigation water). Precipitation was observed and averaged from the meteorological stations shown in Figure 1, whereas the statistics for irrigation water and water transferred into the study basin were based on the Water Resources Bulletin of Gansu Province. Figure 6 illustrates that the two ET data sets were close to the water balance ET. For MOD16, the mean absolute error (MAE) between the estimated and observed ET values was 26.4 mm y−1 and the mean absolute percent error (MAPE) was 9.1%, whereas the MAE (MAPE) was 34.4 mm y−1 (11.9%) for the MOD3T. The results suggest that the ET datasets with limited error can be used to perform a reasonable analysis.

4.2. Factors Possibly Affecting ET

ET can be affected by many factors. In the study basin, ET is mainly limited by water instead of energy (e.g., [29]). The observed net radiation at the Minqin station exhibited a nonsignificant increase, with a slope of 0.14 and R2 = 0.14 (Figure 7a). In addition, rainfall increased slightly, but the tendency was not significant (R2 = 0.11) (Figure 7b). As such, ET might be impacted by factors other than water. Considering the data availability, we mainly discuss the effects of temperature and vegetation on ET.
Theoretically, an increase in temperature is likely to cause much more water loss from evaporation and transpiration if other meteorological variables, such as precipitation, are stable. In this study, a slight increase in rainfall was observed, and both the mean annual and minimum air temperatures exhibited an increasing trend, with R2 values of 0.51 and 0.66, respectively (Figure 7b). However, ET showed a declining trend from 2002 to 2009. Under such conditions, the reduced ET may be caused by a decrease in vegetation transpiration due to the removal of vegetation and land desertification. Figure 8 supports the hypothesis that the change trend of the vegetation index was similar to that of ET. Specifically, the normalized vegetation index (NDVI) for the entire basin decreased between 2002 and 2008 (R2 = 0.25) and rose significantly thereafter (R2 = 0.90).
Human activities, including intensive agricultural practices, have had many impacts on water resources and vegetation in the study basin in recent decades [15,21,22,23,24]. Figure 9 shows changes in typical factors indicating social development. Population increased during the past 60 years, and the maximum value was almost 2.6 times that of 1949 [15,30]. Although the relative change of ET is poorly related to the change in population, farmland increased as the population increased and consumed additional water resources, especially in the 20th century. The amount of irrigated farmland increased 2.3 times that of 1949 levels, whereas the consumed amount of groundwater was 2.3 times that in 1972. This increased groundwater consumption led to an increased number of groundwater wells and overexploitation in the study basin. It was reported that 0.45 billion m3 groundwater was overexploited and that the water resource utilization intensity was relatively high, with a value of 164% [23,31]. Because most of the water in the study basin was consumed by agriculture, ET showed a positive relation with the water consumption indices (e.g., amount of pumped groundwater and well numbers in the lower basin) during 2002-2009 (Figure 9). These intensive activities led to land desertification and degradation, and the increased agricultural water consumption left marginal water for the ecosystem. The area of the Minqin Oasis in the lower basin has decreased approximately 300 km2 since the 1950s.
However, ET and vegetation cover showed an increasing tendency in the late 2000s (Figure 3 and Figure 8). The Chinese government has paid attention to overexploitation and related serious land desertification in the study basin. In addition to the Grain for Green Program (GGP), a nationwide environmental conservation project initiated in 1999 by the Chinese government to prevent vegetation loss [32], the local government has taken different measures to address overexploitation and ecosystem degradation. The Bureau of the Shiyang River Basin administration was founded in 2001 and is responsible for water-related problems in the basin. A special program has been launched by the bureau since 2006, including water resource allocation and protection, the prohibition of groundwater exploitation, water-saving programs, and ecosystem restoration. Noticeable evidence of vegetation recovery and ecological restoration has been observed, especially in the lower Minqin Oasis [22,24,33]. The statistics in Figure 8 suggest that the NDVI has increased since 2009, and the amount of pumped groundwater and related wells decreased in the late 2000s (Figure 9). Because irrigation water consumption was strictly limited, the remaining water resources may be available and consumed by vegetation in the ecosystem, leading to ET increases. The results indicate that vegetation has increased since the late 2000s, and these results agree with the results of other studies (e.g., [24,34,35]).

4.3. ET Dynamics and Their Implications for Ecosystem Management

The spatiotemporal dynamic changes of ET may be adopted as indicators of vegetation variation and water consumption. For example, in arid and semiarid regions where water resources are scarce, it is important to improve WUE by reducing soil evaporation (Es) and increasing crop transpiration (Ec) [16,22,36,37,38,39]. Oases in the Shiyang River Basin, such as the Minqin Oasis, are the most productive agricultural areas in the Hexi Corridor. However, irrigation has consumed most of the water resources. As shown in Section 3.3, nearly half of the irrigated water was lost to the atmosphere without resulting in any productivity. From this perspective, these water resources were wasted, and it is essential to save irrigation water and improve cropland WUE in the study area. Therefore, these findings indicated that assessing the ET components, i.e., Es and Ec, might help improve WUE by reducing soil evaporation.
In addition, annual variations in ET respond quickly to soil water availability in sparsely vegetated regions [40]. Especially in the lower study basin, where the vegetation is rain fed and the ecosystem is highly vulnerable, ET provided by the MOD3T can be useful for indicating soil water and assessing vegetation conditions in the ecosystem. An example is shown in Figure 10. MOD3T can provide ET values for sparsely vegetated areas, and intra-annual variations in ET for a given region can be retrieved (Figure 10d). Intra-annual variations in precipitation observed at the Minqin station indicate that the estimated changes in the ET are reasonable.
Currently, several remotely sensed global ET datasets are available, such as GLEAM (Global Land Evaporation Amsterdam Model) [41] and a global land ET [42]. If the dataset could provide ET or its components values with a spatiotemporal resolution suitable for application, it can be adopted to perform an analysis or assessment similar to that of the present study. However, due to challenges in accurately estimating remotely sensed ET [3,4,25,29], a precise and accurate ET estimation that is particularly useful for ecosystem management; such as shown in this study, the MOD3T could provide useful ET values for sparsely vegetated areas.

5. Conclusions

The spatiotemporal dynamics of ET were assessed in the Shiyang River Basin in arid Northwest China from 2002 to 2012. The results showed that ET decreased from upstream of the Qilian Mountains to the middle and downstream, and that temporally, ET showed a downward trend before 2009 and thereafter it increased. Further analysis indicates that vegetation loss led to a decrease in ET; in contrast, ecological restriction measures and strict water resource management policies in the middle reaches of the basin led to an increase in ET. It is concluded that the dynamic spatiotemporal changes in ET and its two components may be adopted as an indicator of vegetation variation and water consumption.

Author Contributions

Y.X. conceived and designed the study; Methodology, Y.X.; Formal Analysis, J.L., Y.X., J.T. and Z.T.; Data Preparation, Z.T.; Writing—Original Draft Preparation, Z.T. and J.T.; Writing—Review & Editing, J.L. and Y.X.

Funding

This research was funded by the National Natural Science Foundation of China, grant number 41671416.

Acknowledgments

We thank the China Meteorological Administration for providing meteorological data. The MODIS data products were obtained from the online Data Pool, courtesy of the NASA Land Processes Distributed Active Archive Center (LP DAAC), USGS/Earth Resources Observation and Science (EROS) Center, Sioux Falls, South Dakota, https://lpdaac.usgs.gov/data_access/data_pool. We are grateful to the reviewers and editors for their insightful and constructive comments.

Conflicts of Interest

The authors declare no conflict of interest.

References

  1. Liu, J.G.; Mooney, H.; Hull, V.; Davis, S.J.; Gaskell, J.; Hertel, T.; Lubchenco, J.; Seto, K.C.; Gleick, P.; Kremen, C.; et al. Systems integration for global sustainability. Science 2015, 347, 1–9. [Google Scholar] [CrossRef]
  2. Li, X.; Yang, K.; Zhou, Y.Z. Progress in the study of oasis-desert interactions. Agric. For. Meteorol. 2016, 230–231, 1–7. [Google Scholar] [CrossRef]
  3. Anderson, M.C.; Norman, J.M.; Kustas, W.P.; Houborg, R.; Starks, P.J.; Agam, N. A thermal-based remote sensing technique for routine mapping of land-surface carbon, water and energy fluxes from field to regional scales. Remote Sens. Environ. 2008, 112, 4227–4241. [Google Scholar] [CrossRef]
  4. Yang, Y.T.; Long, D.; Guan, H.D.; Liang, W.; Simmons, C.T.; Batelaan, O. Comparison of three dual-source remote sensing evapotranspiration models during the MUSOEXE-12 campaign: Revisit of model physics. Water Resour. Res. 2015, 51, 3145–3165. [Google Scholar] [CrossRef] [Green Version]
  5. Li, X.; Cheng, G.D.; Ge, Y.C.; Li, H.Y.; Han, F.; Hu, X.L.; Tian, W.; Tian, Y.; Pan, X.D.; Nian, Y.Y.; et al. Hydrological cycle in the Heihe River Basin and its implication for water resource management in endorheic basins. J. Geophys. Res. Atmos. 2018, 123, 890–914. [Google Scholar] [CrossRef]
  6. Zhou, Y.Z.; Li, X.; Yang, K.; Zhou, J. Assessing the impacts of an ecological water diversion project on water consumption through high-resolution estimations of actual evapotranspiration in the downstream regions of the Heihe River Basin, China. Agric. For. Meteorol. 2018, 249, 210–227. [Google Scholar] [CrossRef]
  7. FAO. Arid Zone Forestry: A Guide for Field Technicians. Available online: http://www.fao.org/docrep/t0122e/t0122e03.htm#1.%20meaning%20of%20aridity (accessed on 20 October 2018).
  8. Cheng, G.D.; Li, X.; Zhao, W.Z.; Xu, Z.M.; Feng, Q.; Xiao, S.C.; Xiao, H.L. Integrated study of the water–ecosystem–economy in the Heihe River Basin. Natl. Sci. Rev. 2014, 3, 413–428. [Google Scholar] [CrossRef]
  9. Li, Y.P.; Nie, S.; Huang, C.Z.; McBean, E.A.; Fan, Y.R.; Huang, G.H. An integrated risk analysis method for planning water resource systems to support sustainable development of an arid aegion. J. Environ. Inf. 2017, 29, 1–15. [Google Scholar]
  10. Zheng, M.S.; Ma, L.K.; Li, T.H.; Huang, R. Rapid assessment method for wco-water deficit in catchments. J. Environ. Inf. 2017, 30, 149–160. [Google Scholar]
  11. Shen, Y.; Chen, Y. Global perspective on hydrology, water balance, and water resources management in arid basins. Hydrol. Process. 2010, 24, 129–135. [Google Scholar] [CrossRef]
  12. Zhao, L.W.; Zhao, W.Z. Water balance and migration for summer maize in an oasis farmland of northwest China. China Sci. Bull. 2014, 59, 4829–4837. [Google Scholar] [CrossRef]
  13. Qiu, G.Y.; Li, C.; Yan, C.H. Characteristics of soil evaporation, plant transpiration and water budget of Nitraria dune in the arid Northwest China. Agric. For. Meteorol. 2015, 203, 107–117. [Google Scholar] [CrossRef]
  14. Papadavid, G.; Hadjimitsis, D.G.; Toulios, L.; Michaelides, S. A modified SEBAL modeling approach for estimating crop evapotranspiration insemi-arid conditions. Water Resour. Manag. 2013, 27, 3493–3506. [Google Scholar] [CrossRef]
  15. Ma, Z.M.; Kang, S.Z.; Zhang, L.; Tong, L.; Su, X.L. Analysis of impacts of climate variability and human activity on streamflow for a river basin in arid region of northwest China. J. Hydrol. 2008, 352, 239–249. [Google Scholar] [CrossRef]
  16. Zhang, Y.L.; Ma, J.H.; Chang, X.L.; Wonderen, J.V.; Yan, L.L.; Han, J.H. Water resources assessment in the Minqin Basin: An arid inland river basin under intensive irrigation in northwest China. Environ. Earth Sci. 2012, 65, 1831–1839. [Google Scholar] [CrossRef]
  17. Ma, J.Z.; Wang, X.S.; Edmunds, W.M. The characteristics of ground-water resources and their changes under the impacts of human activity in the arid Northwest China—A case study of the Shiyang River Basin. J. Arid Environ. 2005, 61, 277–295. [Google Scholar] [CrossRef]
  18. Kang, S.Z.; Su, X.L.; Tong, L.; Shi, P.Z.; Yang, X.Y.; Abe, Y.K.; Du, T.S.; Shen, Q.L.; Zhang, J.H. The impacts of human activities on the water–land environment of the Shiyang River basin, an arid region in northwest China. Hydrol. Sci. J. 2004, 49, 413–427. [Google Scholar] [CrossRef]
  19. Geng, G.; Wardlaw, R. Application of Multi-Criterion Decision Making Analysis to Integrated Water Resources Management. Water Resour. Manag. 2013, 27, 3191–3207. [Google Scholar] [CrossRef]
  20. Li, C.; Wang, Y.; Qiu, G.Y. Water and energy consumption by agriculture in the Minqin Oasis Region. J. Integr. Agric. 2013, 12, 1330–1340. [Google Scholar] [CrossRef]
  21. Sun, Y.; Kang, S.Z.; Li, F.S.; Zhang, L. Comparison of interpolation methods for depth to groundwater and its temporal and spatial variations in the Minqin oasis of northwest China. Environ. Model. Softw. 2009, 24, 1163–1170. [Google Scholar] [CrossRef]
  22. Hao, Y.Y.; Xie, Y.W.; Ma, J.H.; Zhang, W.P. The critical role of local policy effects in arid watershed groundwater resources sustainability: A case study in the Minqin oasis, China. Sci. Total Environ. 2017, 602, 1084–1096. [Google Scholar] [CrossRef]
  23. Aarnoudse, E.; Bluemling, B.; Wester, P.; Qu, W. The role of collective groundwater institutions in the implementation of direct groundwater regulation measures in Minqin County, China. Hydrogeol. J. 2012, 20, 1213–1221. [Google Scholar] [CrossRef]
  24. Sun, D.F. Detection of dryland degradation using Landsat spectral unmixing remote sensing with syndrome concept in Minqin County, China. Int. J. Appl. Earth Observ. Geoinf. 2015, 41, 34–45. [Google Scholar] [CrossRef]
  25. Mu, Q.Z.; Zhao, M.S.; Running, S.W. Improvements to a MODIS Global Terrestrial Evapotranspiration Algorithm. Remote Sens. Environ. 2011, 115, 1781–1800. [Google Scholar] [CrossRef]
  26. Mu, Q.Z.; Heinsch, F.A.; Zhao, M.S. Development of a global evapotranspiration algorithm based on MODIS and global meteorology data. Remote Sens. Environ. 2007, 111, 519–536. [Google Scholar] [CrossRef]
  27. Xiong, Y.; Zhao, S.; Yin, J.; Li, C.; Qiu, G. Effects of Evapotranspiration on Regional Land Surface Temperature in an Arid Oasis Based on Thermal Remote Sensing. IEEE Geosci. Remote Sens. Lett. 2016, 13, 1885–1889. [Google Scholar] [CrossRef]
  28. Xiong, Y.J.; Zhao, S.H.; Tian, F.; Qiu, G.Y. An evapotranspiration product for arid regions based on the three-temperature model and thermal remote sensing. J. Hydrol. 2015, 530, 392–404. [Google Scholar] [CrossRef] [Green Version]
  29. Zhang, K.; Kimball, J.S.; Running, S.W. A review of remote sensing based actual evapotranspiration estimation. Wiley Interdiscip. Rev. Water 2016, 3, 834–853. [Google Scholar] [CrossRef]
  30. WRBGP. Water Resources Bulletin of Gansu Province. 2012. Available online: http://www.gssl.gov.cn/xxgk/gkml/nbgb/szygb/ (accessed on 20 October 2018).
  31. Si, S.H.; Zhu, G.F.; Su, Y.H. The characteristics of water cycle and its ecological functions for inland river basin in northwestern China. J. Arid Land Resour. Environ. 2010, 24, 37–44. [Google Scholar]
  32. Xu, Z.G.; Bennett, M.T.; Tao, R.; Xu, J.T. China’s Sloping Land Conversion Programme four years on: Current situation, pending issues. Int. For. Rev. 2004, 6, 317–326. [Google Scholar]
  33. Dong, Z.L.; Xu, X.Y.; Jin, H.X.; Liu, S.J.; Zhang, J.H.; Tang, W.D.; Chai, C.W.; Zhao, P.; Wang, X.H. The impact of eco-water transportation to the vegetation in tail lake of Shiyang River. J. Arid Land Resour. Environ. 2015, 29, 101–106. [Google Scholar]
  34. Zhu, Q.; Li, Y. Environmental Restoration in the Shiyang River Basin, China: Conservation, Reallocation and More Efficient Use of Water. Aquat. Procedia 2014, 2, 24–34. [Google Scholar] [CrossRef]
  35. Tang, Z.G.; Ma, J.H.; Peng, H.H.; Wang, S.H.; Wei, J.F. Spatiotemporal changes of vegetation and their responses to temperature and precipitation in upper Shiyang river basin. Adv. Space Res. 2017, 60, 969–979. [Google Scholar] [CrossRef]
  36. Howell, T.A. Enhancing water use efficiency in irrigated agriculture. Agron. J. 2001, 93, 281–289. [Google Scholar] [CrossRef]
  37. Zhang, Y.Q.; Kendy, E.; Qiang, Y.; Liu, C.M.; Shen, Y.J.; Sun, H.Y. Effect of soil water deficit on evapotranspiration, crop yield, and water use efficiency in the North China Plain. Agric. Water Manag. 2004, 64, 107–122. [Google Scholar] [CrossRef]
  38. Pradeep, W.; Prasanna, H.G.; Xiao, X.M.; Anup, K.C. Parameterizing ecosystem light use efficiency and water use efficiency to estimate maize gross primary production and evapotranspiration using MODIS EVI. Agric. For. Meteorol. 2016, 222, 87–97. [Google Scholar] [Green Version]
  39. Pastori, M.; Udias, A.; Bouraoui, F.; Bidoglio, G. A multi-objective approach to evaluate the economic and environmental impacts of alternative water and nutrient management strategies in Africa. J. Environ. Inf. 2017, 29, 16–28. [Google Scholar] [CrossRef]
  40. Joiner, J.; Yoshida, Y.; Anderson, M.; Holmes, T.; Hain, C.; Reichle, R.; Koster, R.; Middleton, E.; Zeng, F. Global relationships among traditional reflectance vegetation indices (NDVI and NDII), evapotranspiration (ET), and soil moisture variability on weekly timescales. Remote Sens. Environ. 2018, 219, 339–352. [Google Scholar] [CrossRef]
  41. Martens, B.; Miralles, D.G.; Lievens, H.; van der Schalie, R.; de Jeu, R.A.M.; Fernández-Prieto, D.; Beck, H.E.; Dorigo, W.A.; Verhoest, N.E.C. GLEAM v3: Satellite-based land evaporation and root-zone soil moisture. Geosci. Model Dev. 2017, 10, 1903–1925. [Google Scholar] [CrossRef]
  42. Jung, M.; Reichstein, M.; Ciais, P.; Seneviratne, S.I.; Sheffield, J.; Goulden, M.L.; Bonan, G.; Cescatti, A.; Chen, J.; de Jeu, R.; et al. A recent slowdown in global land evapotranspiration due to limited moisture supply. Nature 2010, 467, 951–954. [Google Scholar] [CrossRef]
Figure 1. Location of the Shiyang River Basin in Gansu Province and the vegetation cover map based on MODIS land use product (MCD12Q1 in 2008, version 5).
Sustainability 11 00445 g001
Figure 2. Annual evapotranspiration (ET) maps of the Shiyang River Basin based on MOD16A2 (version 5).
Sustainability 11 00445 g002
Figure 3. Change trend of annual ET values of the Shiyang River Basin between 2002 and 2012.
Sustainability 11 00445 g003
Figure 4. Intra-annual change trend of mean ET values from 2002 to 2012.
Sustainability 11 00445 g004
Figure 5. The ratio of vegetation transpiration (Ec) to ET (Ec/ET) of cropland based on the MOD3T data in the growing season (between DOY 97 and 257) in the Shiyang River Basin (note: cropland data comes from the MODIS land use data shown in Figure 1).
Sustainability 11 00445 g005
Figure 6. Comparison of the MOD16, MOD3T, and observed ET from the water balance equation. Note: observed ET values were calculated through water balance equation based on statistics from the Water Resources Bulletin of Gansu Province.
Sustainability 11 00445 g006
Figure 7. Climatic changes during recent decades in the study basin: (a) net radiation; (b) precipitation and air temperature.
Sustainability 11 00445 g007
Figure 8. Change trend of annual MODIS NDVI values of the Shiyang River Basin between 2002 and 2012.
Sustainability 11 00445 g008
Figure 9. Relative changes of ET, population, and water consumption indices during the recent decades in the study basin.
Sustainability 11 00445 g009
Figure 10. An example showing intra annual variations in the MOD3T from sparsely vegetated regions in 2011: (a) MOD16 provides no values for sparsely vegetated areas; (b) MOD3T; (c) precipitation (P) observed at Minqin station; and (d) MOD3T for sparsely vegetated areas (averaged from black rectangle in (b)).
Sustainability 11 00445 g010

