Article

Regional Tourism Clustering Based on the Three Ps of the Sustainability Services Marketing Matrix: An Example of Central and Eastern European Countries

1
Department of Economic Theories, Faculty of Economics, Technical University of Košice, Letná 9, 04200 Košice, Slovakia
2
Department of Applied Mathematics and Business Informatics, Faculty of Economics, Technical University of Košice, Letná 9, 04200 Košice, Slovakia
3
Department of Geo and Mining Tourism, Faculty of Mining, Ecology, Process Control and Geotechnologies, Technical University of Košice, Letná 9, 04200 Košice, Slovakia
4
Institute of Earth Resources, Faculty of Mining, Ecology, Process Control and Geotechnologies, Technical University of Košice, Letná 9, 04200 Košice, Slovakia
*
Author to whom correspondence should be addressed.
Sustainability 2019, 11(2), 400; https://doi.org/10.3390/su11020400
Submission received: 2 November 2018 / Revised: 7 January 2019 / Accepted: 9 January 2019 / Published: 14 January 2019
(This article belongs to the Special Issue Sustainable Directions in Tourism)

Abstract

:
The impact of tourism on quality of life standards in regions is significant in terms of people, planet, and profit. This paper examines the subnational NUTS 2 level regions, (in line with Eurostat) by applying several interlinked and connected indicators. Adopting the three Ps (people, planet, profit) of the Sustainability Services Marketing Mix, this article discusses the fusion of 54 regions of Central and Eastern Europe (Czech Republic, Slovakia, Hungary, Poland, Estonia, Lithuania, Latvia, Slovenia, Romania, and Bulgaria) into clusters according to the selected accommodation tourism indicators used by the European Statistical Agency (Eurostat) to evaluate tourism. Since many variables of the Prague region significantly exceed the values of the remaining regions, this region has been considered as an individual cluster, excluded from the cluster analysis. The cluster analysis resulted in the definition of six clusters consisting of regions with similar indicators’ statistics characteristics. The presented approach changes the traditional approach to clusters in tourism and provokes thinking about new criteria of clustering and solutions in the field of tourism, especially when considering future cooperation, competitiveness, and sustainable development.

1. Introduction

The demand for quality services and competitive business environments have led to the definition of several quality measurement methods. As summarized by Charles and Kumar [1], abundant research has been carried out to measure the quality of services in various sectors (e.g., banking services, medical services, travel and tourism, mobile communications, etc.). Most of the people, who travel, like to have information concerning a journey, accommodation, food, and even beyond these few necessities on the supply side. On the other hand, the people who prepare the journey, accommodation, food, and other services also need to acquire information on the demand side of market (preferences). The asymmetry of information may cause market failures. The production function in the tourism industry is the starting point for this quite complex analysis, for instance, the production function described by Smith [2].
The general statistics of demand and supply (e.g., overnights or bed places) are mostly known in a country that tries to open-up for tourists. Such statistics are presented in this paper with the help of the cluster analysis. This cluster analysis and its results should serve further research in the tourism industry. The main aim of the paper is to present an “alternative” approach to study and research in the field of clusters in tourism that are based on Porter’s cluster theory [3,4].
The tourism sector combines a diversity of subsectors (transportation, food, culture entertainment, etc.). Also, in terms of tourism outputs, there may be a diversity of positive and negative effects. A prevalence of positive effects is desired in peoples’ experiences and companies’ profits. A counterbalance of these positives are negatives on the side of the planet (e.g., environmental load). Three “P”: Planet, People, and Profit are taken into consideration as a triple line approach [5]. In Reference [5], authors discuss the Sustainability Services Marketing Matrix (SSMM) in detail. Based on this approach, the cluster analysis in the present study focuses on the following conjunctions: (1) Place vs. people (urban and rural tourism in variables used later), (2) product vs. people (nights—in variables used later—suggest the product of city breaks [6,7], weekend stays only, etc.), (3) participants vs. people (bed places in variables used later for cluster analysis that can lack a bit of detail [8,9]). The triple line approach (planet, people, and profit) is complex and rich and may lead to a variety of assessments. The understanding of tourism is of a regional character for most of the communities, this is why clusters formed of regions can be useful here. Furthermore, the proximity of Visegrad countries can use the advantage of a common marketing strategy and thus an SSMM. Such a manifold scale of research is not feasible for this paper. In this case, the hindrance is represented by the variables that need to be gathered and linked to the right position.
Xiao and Smith [10] have pointed out that one of the major limitations of research in tourism is caused by the fact that the research is, in most cases, concerned with a single case, location, nationality, etc. (e.g., [11,12]). The authors in Reference [10] prove this fact to be acceptable, however, they emphasize that a methodological implementation is beneficial to overall tourism research. One such complex methodology is comprehended by the Swedish Destination Management Information System (DMIS) [13], which is complex and relatively easy to implement thanks to information and communication technologies. Another example is the Destination Business Information System (DBIS) currently developed in Slovakia [14,15,16]. This shows that Online Analytical Processing (OLAP) presents results of data mining that can include these tools: Artificial neural networks, decision analysis, rule induction, K-nearest neighbor techniques, clustering, as well as association rules [17].

2. Literature Review and Theoretical Considerations

Clusters in tourism have become a relatively large subject of interest in the last two decades. As summarized by Ferreira and Estevao [18], the interest in cluster issues lies in the impact of the performance, regional development, and countries competitiveness [19]. In various regions or countries, clusters have played a significant role in tourism [20]. Moreover, Jackson and Murphy [20] argue that, applying the cluster theory in the tourism sector, the satisfaction of tourists does not only depend on the primary attraction of the place, but also on the quality and efficiency of related businesses (hotels, restaurants, etc.) [18].
Various authors have introduced a definition of the tourism cluster, specific approach of use, or an application of clustering in tourism. A classical approach to the clusters in tourism is primarily based on Porter’s cluster theory (Figure 1) [3,4]. According to Porter [4], clusters are “geographic concentrations of interconnected companies, specialized suppliers, service providers, firms in related industries, and associated institutions (universities, standards agencies, and trade associations) in particular fields that compete but also cooperate”.
Jackson and Murphy [20] note that clusters have become significant forces in tourism development, particularly in cases where they have transformed or developed into active organizations or destination associations. As summarized by da Cunha and da Cunha [21], Monfort’s tourism cluster concept [22] is based on characteristics and components. They define a cluster as "a complex group of different elements, including services carried out by tourism companies or business (lodging, restoration, travel agencies, aquatic and theme parks, etc.); richness provided by tourist holiday experiences; multidimensional gathering of interrelated companies and industries; communication and transportation infrastructures; complementary activities (commercial allotment, holiday traditions, etc.); supporting services (formation and information, etc.); and natural resources and institutional policies". Beni’s approach [23] to the tourism cluster focuses on the cohesion between agents and cooperation, based on the following definition: "Tourism cluster is a group of highlighted tourism attractions within a limited geographic space provided with high quality equipment and services, social and political cohesion, linkage between productive chain and associative culture, and excellent management in company nets that bring about comparative and competitive strategic advantages." The European Commission [24] defines a cluster as “a progressive form of business network, which has strong business objectives focusing on improving sales and profits. It makes the exchange of information and technology possible, encouraging different ways of co-ordination and collaboration within them”. According to Kachniewska [25], there is no one recommended cluster model that would be appropriate in every condition. She assumes that the formulation of attributes of the tourism cluster should refer to different cluster classifications, based on the following criteria:
  • the economy sector,
  • modernity of the industry,
  • foundation motives,
  • governance system,
  • form of cooperational type,
  • level of awareness,
  • scope,
  • life cycle stage,
  • the structure of the cluster [25,26].
According to the characteristics of the tourism cluster, local development programs should consider it as a local strategy for combating regional disparities and social inequality [27].
Based on the regional competitiveness model of cluster introduced by Fereira and Estevao [18], if the interconnection links between tourism product and tourist destination are effective, the tourism cluster will work in a productive way [28].
Despite the general acceptance, popularity, and application of the Porter’s Diamond Model, Davies and Ellis [29] criticize the model because “sustained prosperity may be achieved without a nation becoming ‘innovation-driven’, strong ‘diamonds’ are not in place in the home bases of many internationally successful industries and inward foreign direct investment does not indicate a lack of ‘competitiveness’ or low national productivity” [29].
In general, Porter’s cluster theory [3,4] is an approach that focuses on companies and results in finding competitive strengths. However, on a large scale, there are also other tools that can be used, e.g., input-output analyses, when studying the industry that comprises small and medium-sized enterprises (SMEs) and transnational corporations [30,31,32]. Another option can be data envelopment analysis for a truly microeconomic approach of only one part of a service, e.g., accommodation [33] This is the way for profit seeking companies that watch the signposts for efficiency. However, efficiency in tourism is sustainable if the product itself is sustainable [34].
Similar to companies, consumers are also willing to achieve a reasonable ratio that compares price and performance. In this regard, consumers in tourism may have various motivations for his/her willingness to undertake tourism experience. The reasons may range from discovering history and culture, through adventure, adrenaline, fun and health seeking, to the environmentally based cases [35,36].
From a historical perspective, religious and/or health pilgrimage reasons (e.g., to Santiago de Compostela) can be considered the forerunners of European tourism. Already in the Middle Ages, the religious or health travelers were supported by simple accommodations and food facilities established on the way towards the destination. The development of facilities was notable especially in places where the healing effects of spring water, mud, ocean, or mountain air proved themselves as a cure. As “side effects”, health travelers often noticed the landscapes and/or cultural events during their visits to different regions. This turned the attention of locals (one of the first stakeholders) towards enriching and diversifying facilities and services (e.g., for pleasure, gambling, etc.). In Europe, Thomas Cook introduced the first organized tourist trips among first tourists’ products in 1842 [36]. Development in the tourism sector was driven by the increasing number of outbound travelers that led to the global tourism market (even Antarctica is on the map of tourism). Therefore, creating or defining geographical regions at different scales (e.g., for tourism development purposes, or competitiveness increase) represented by clusters or networks is reasonable.
Recent tourism development strategies are closely connected to various sustainability issues [37,38,39,40,41]. On the customer side, one of the most crucial points is tourist satisfaction. In this regard, the most complex approach has been introduced by Pomering, Noble and Johnson [5], recently updated by Pomering and Johnson [41]—the Sustainability Services Marketing Matrix. In this matrix, eight services marketing mix elements cross-reference the three pillars of the triple line to provide a sustainability-relevant services marketing framework for operationalizing sustainability (Table 1) [41].
The SSMM approach may significantly help solve various sustainability issues via decision-making captured within the elements of the services marketing mix [41]. The cluster product may well encompass the triple line and SSMM. A cluster product that helps to conserve nature and history needs good management based on well-timed information [42].
Understanding first two points regarding (1) companies and their profit, and (2) consumers and their utility, there is a third to the conundrum, and that is the planet. While profit and utility increase, the planet often suffers, e.g., residents living in cities crowded by tourists [43,44]. The number of visitors has been included in the cluster analysis presented in this paper.
Clustering can point out the existing trend of “tourist accumulation” that can be then influenced by motivating tour operators to spread the number of tourists over the near-by areas of the cluster in preparation of a “one cluster product”. In such a cluster product, the aims of sustainability can be managed better. For management, data, both qualitative and quantitative, are of crucial importance (Figure 2). In the cluster analysis presented in this paper, only quantitative data were used. This could be well accompanied with a further, in-depth literature review [45] of the results of a country classification according to their level of tourism growth during the period 2007–2016 [34]. This investigation showed that Visegrad countries were among the LTG cluster (low tourism growth) based on factor analysis. Such results seem to coincide with the better management or regulation of the tourism flows [46].

3. Empirical Aims and Methodology: Disparities Among Regions of Middle and Eastern Europe in the Field of Tourism

There are many different approaches that are applied in the definition of regional disparity. However, in any case, disparity is considered a multi-dimensional problem [47].
In the frame of European Union cohesion, according to the horizontal classification, we distinguish three basic types of disparities: Economic, social and territorial. As territorial indicators, we consider the indicators from the area of environment, transport, health care, science, information society, and tourism.
Some adequate indicators of tourism of regional disparities can be identified in the Eurostat publication Methodological Manual for Tourism Statistics [48]. According to the characteristics of the tourism cluster, local development programs consider it to be a local strategy for combating regional disparities and social inequality. Porter [3] emphasizes that tourism does not depend only on the appeal of the main attraction (beaches or historical sites), but also on the comfort and service of hotels, restaurants, souvenir shops, airports, other modes of transport and so on.
In this paper, 54 NUTS 2 regions have been analyzed in order to find the regional disparities from the perspective of selected accommodation tourism indicators. The following countries were included in the study: Czech Republic (8 regions), Slovak Republic (4 regions), Hungary (7 regions), Poland (16 regions), Estonia (1 region), Lithuania (1 region), Latvia (1 region), Slovenia (2 regions), Romania (8 regions) and Bulgaria (6 regions).

3.1. Data: Indicators of Regional Tourism (by Eurostat)

The input data for this analysis are indicators obtained from the Eurostat database. This database provides sixteen main categories of data on regional statistics by NUTS classification, but we consider only regional tourism statistics. This category is characterized by a more detailed set of indicators in a given time series. For the purpose of the study, data from the year 2014 were chosen.
The method, how the indicators of tourism statistics are constructed, can be found in the Eurostat publication [48] mentioned above. The main focus of this manual is on explanatory notes on the variables of tourism statistics and their breakdowns.
Considering the position of accommodation statistics within the system of tourism statistics, accommodation (rented or non-rented) is a core tourism subsector even if it is relevant for one part of visitors only (i.e., tourists = overnight visitors). The economic importance of this sector can be seen from the results of some countries where accommodation services accounted for between 15 to 20% of total internal tourism expenditure. Accommodation statistics is a key part of the system of tourism statistics in the EU and has a long history of data collection.
The scope of observation (or the target population) in accommodation statistics includes all tourist accommodation establishments providing, as a paid service (although the price might be partially or fully subsidized), short-term or short-stay accommodation services.
Tourism capacity/occupancy data is collected by the member states by means of the business survey (in some cases capacity data is available directly from tourism registers).
The indicators of tourism at regional level measured by Eurostat are divided into two main categories: Variables for capacity (including number of (1) establishments, (2) bed places, and (3) bedrooms) and variables for occupancy (including number of (1) nights spent, (2) arrivals of residents and non-residents, (3) occupancy rate of bedrooms, and (4) occupancy rate of bed places).
The indicators mentioned above are further divided by the degree of urbanization, by area (coastal and non-coastal), by type of tourist (resident or non-resident) and by unit (number, the percentage of the total, percentage change over previous period). Some indicators are reported per thousand inhabitants or km². Therefore, due to our selected regions at the NUTS 2 level, the analysis started with 50 relevant indicators (Table 2). Data were processed using SPSS 19 software.

3.2. Methods of Regional Disparities Measurement, Grouping the Regions

The methods of regional disparities measurement are based on an inter-regional comparison, or they are mathematical and statistical methods [49,50], that also include the multivariate statistical methods (method of main components, factor analysis, cluster or discrimination analysis).
To group regions with similar levels of tourism (measured by accommodation statistics), we decided to use one of the multivariate statistical methods—cluster analysis.
The cluster analysis is a statistical method used for the task of grouping a set of objects according to certain, logically selected variables. It is based on the idea of grouping, in some sense, similar objects into the groups, which differ from each other. The object in a specific cluster share many characteristics but are very dissimilar to objects not belonging to the cluster.
The aim of cluster analysis is to minimize the variability within clusters and maximize the variability between clusters. Unlike other reduction methods, there is no prior knowledge about which element belongs to which cluster [51,52,53,54]. The particular steps of the analysis follow:
  • Correlation matrix—testing of the correlation between variables.
  • The variables have been standardized due to the avoidance of the influence of various units.
  • To create hierarchical agglomeration clustering, the Ward method has been applied.
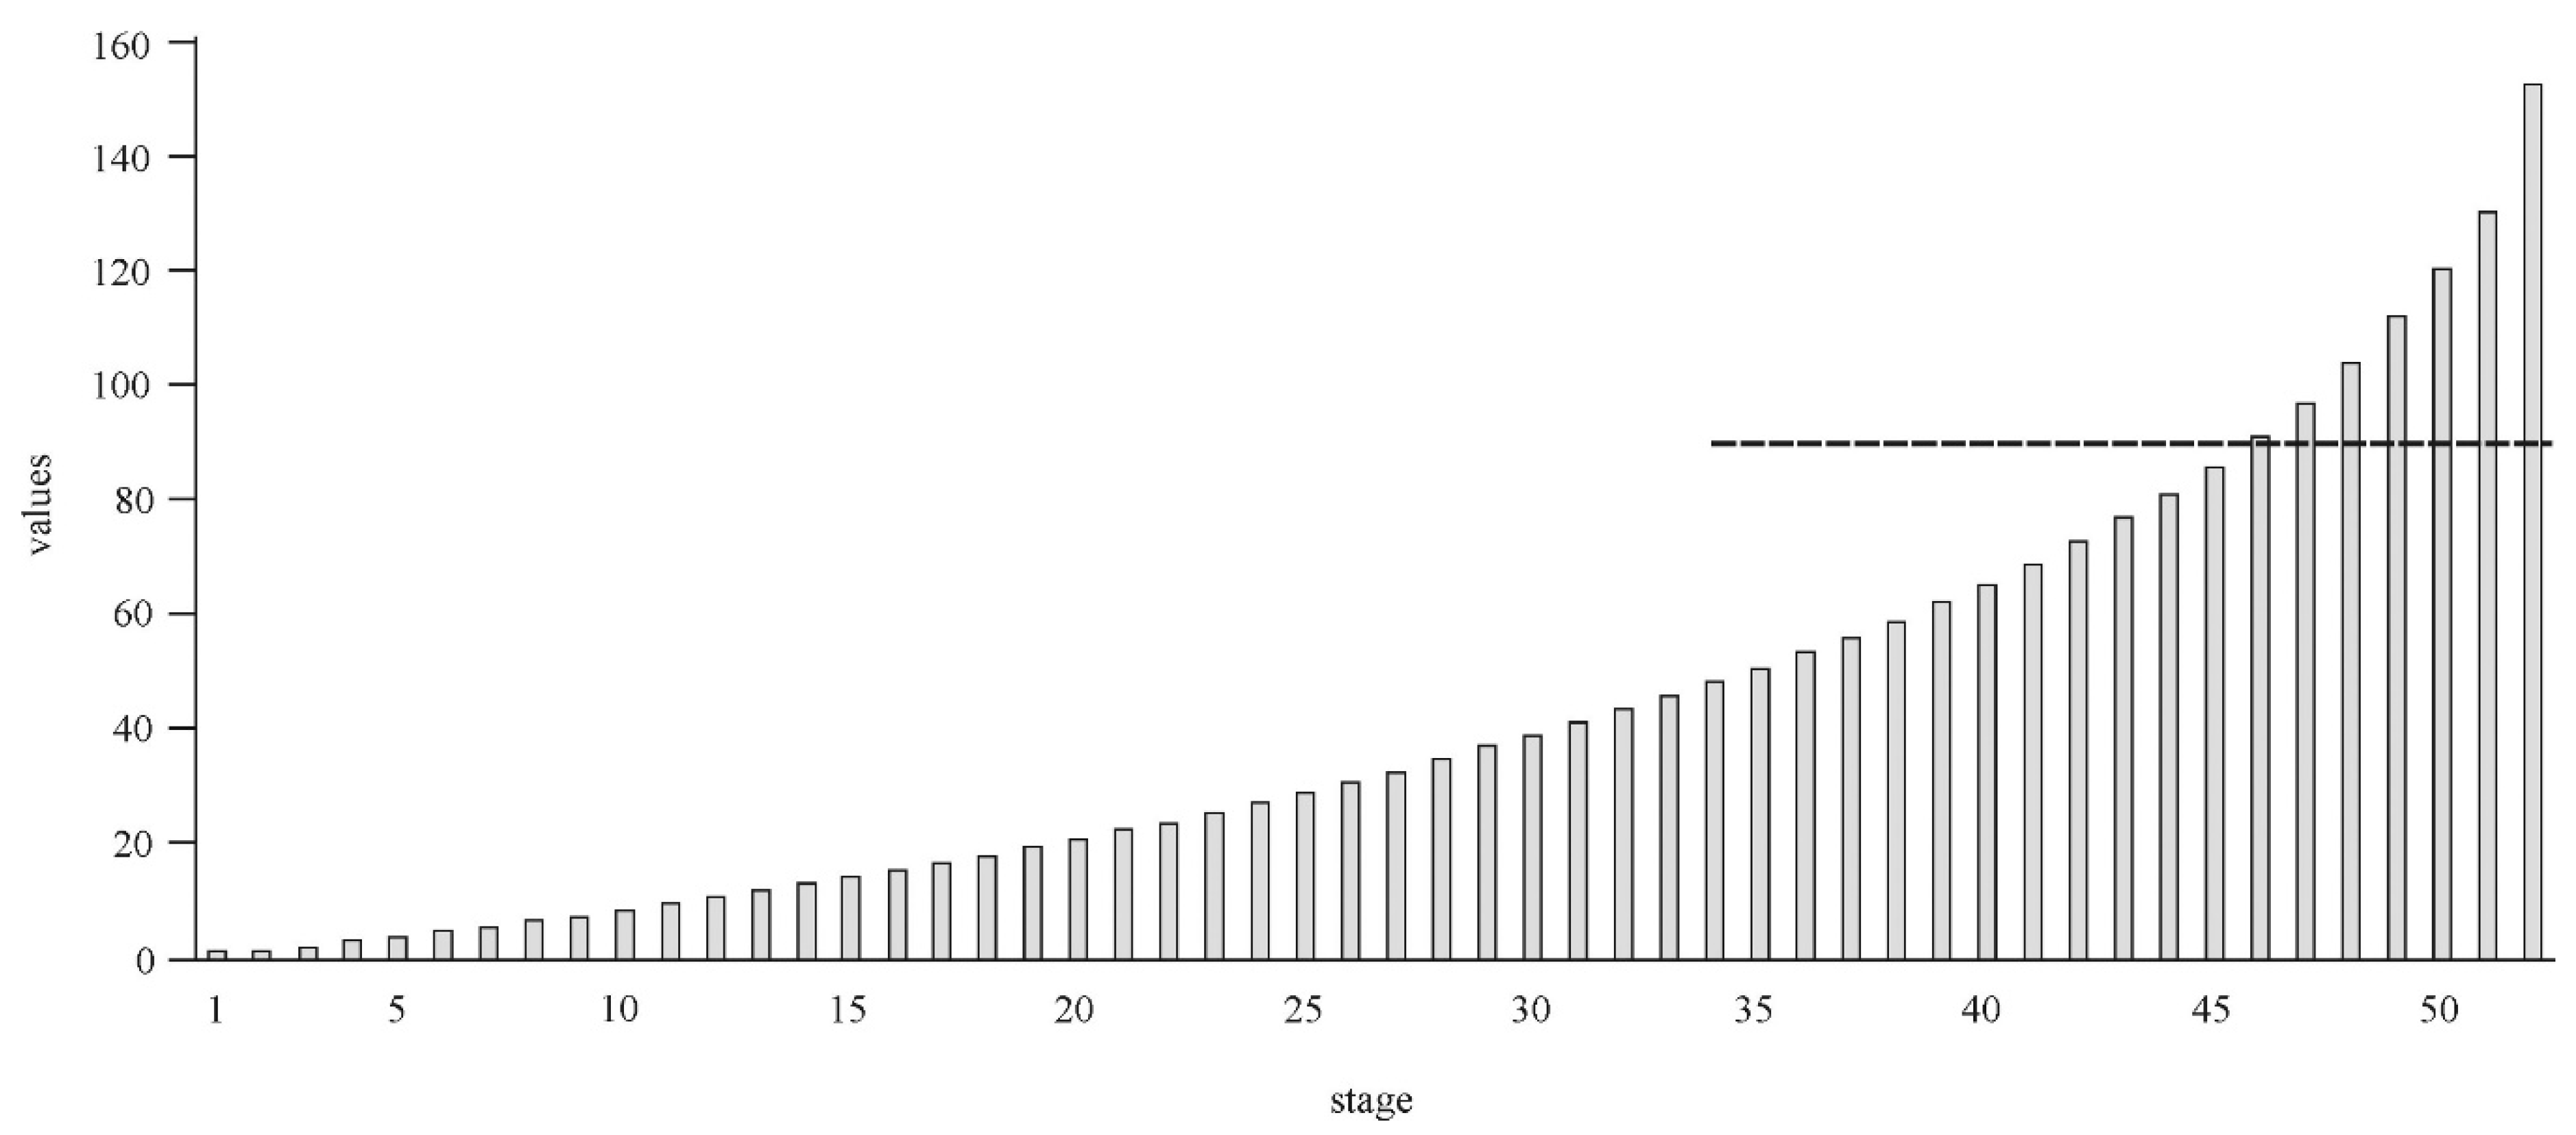
  • The determination of the best fitting number of the created clusters.
  • The regions were matched to the appropriate number of clusters.
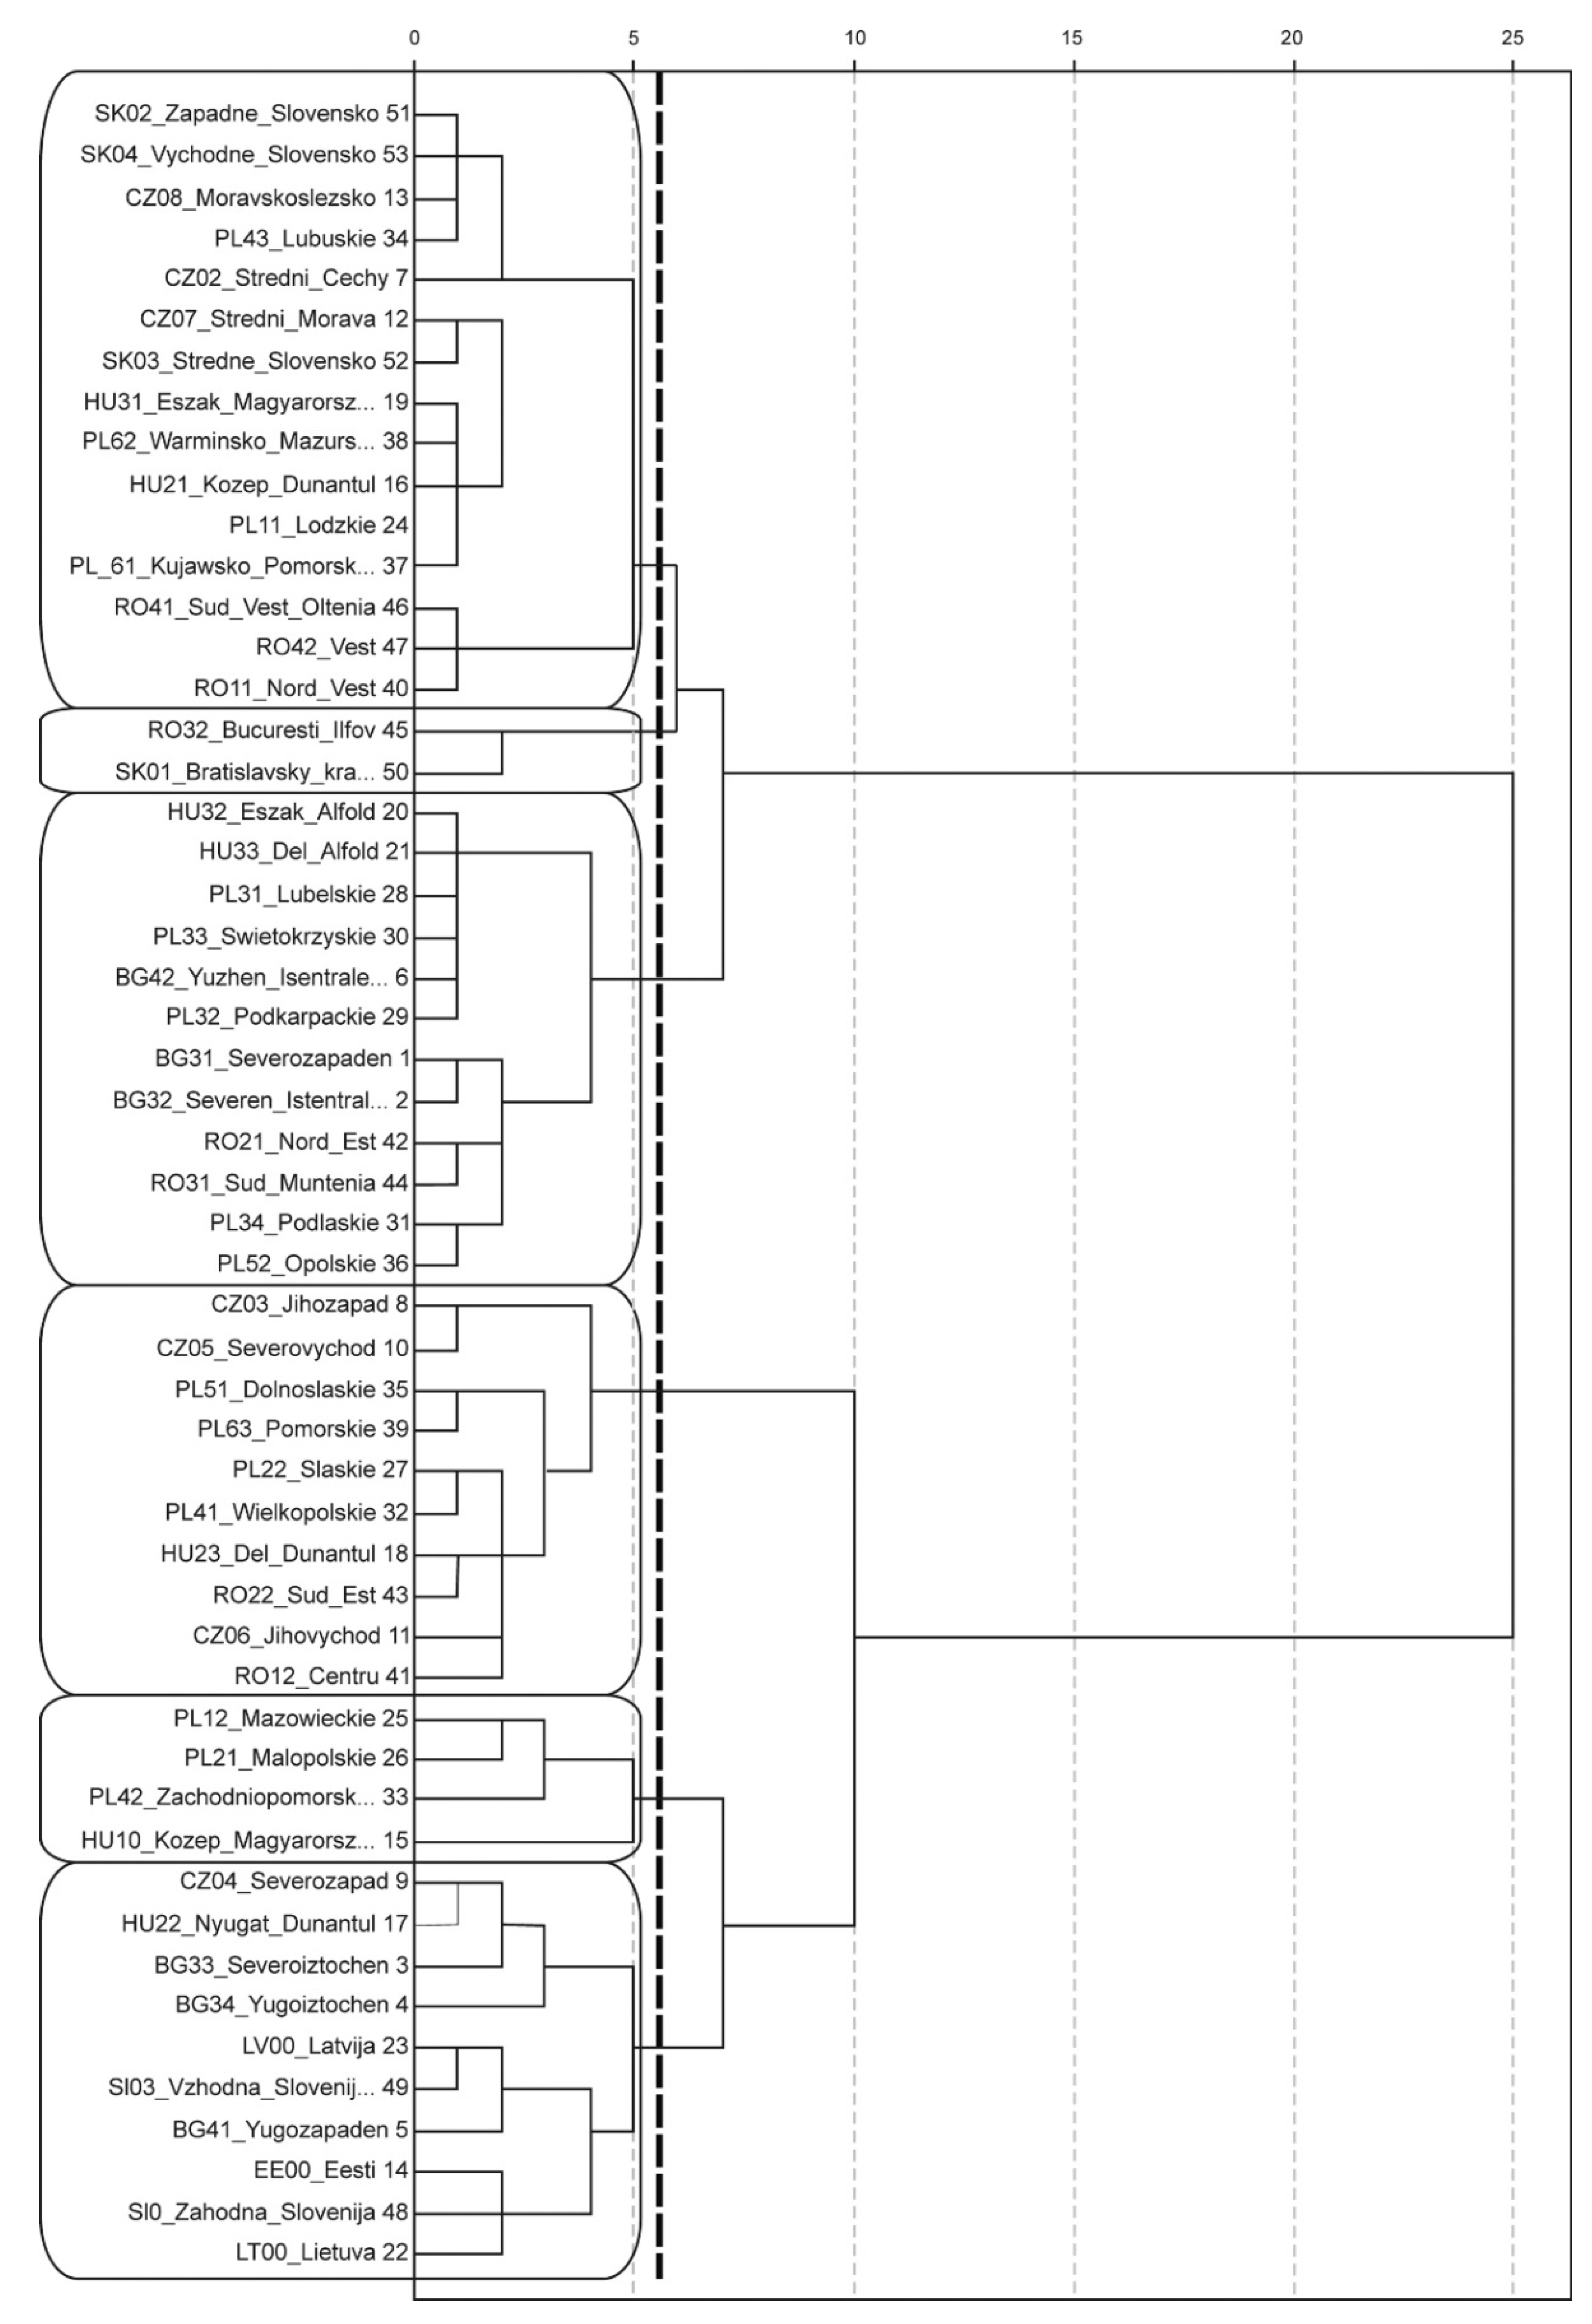
  • The clustering presentation using dendrogram.
For each cluster defined, the calculations of variables’ average values were performed.
At first, the correlation of all possible pairs of variables was calculated (using the Pearson Correlation Coefficient). The results showed that there were many pairs of variables with a strong correlation. However, one of the required conditions for the proper analysis is the absence of multi-correlation between variables. To meet the condition of mutually uncorrelated variables, there is an option of providing Principal Component Analysis (PCA) at the beginning. An important condition in PCA is that the number of observations should be at least five times greater than a number of variables [55]. In the beginning, we had 50 variables and only 54 observations (regions). Hence, it was impossible to run PCA. Therefore, we decided to continue the analysis with removing less important variables from the pairs with stronger Pearson correlation. This removal assured that the variables would not be mutually correlated. After that, only 13 variables of tourism (Table 2) remained and were used as input variables for clustering.
The standardization of variables was carried out before the cluster analysis because we opted to remove the influence of the tremendous differences in the variance values that was partly due to various measurement units. The standardized variables were provided in line with the formula of calculation of z-score:
Z i j = x i j   x j ¯ s j
where:
  • i = 1, 2, ..., n (n is the number of observations),
  • j = 1, 2, ..., p (p is the number of variables),
  • sj is a standard deviation of particular variable,
  • x j ¯ is an average value of the particular variable.
The squared Euclidean distance that forms the basis of Ward´s clustering method was applied to gauge the distance between observations. The calculation formula for distance is as follows:
d i j   2 = k = 1 p ( X i k X j k ) 2
where:
  • Xik denotes the value of the kth variable for the ith observation,
  • Xjk denotes the value of the kth variable for the jth observation.
To determine the optimum solution of clustering, the hierarchical cluster analysis, specifically Ward´s method was used. Referring to this method, it does not rest upon the optimization of distances between clusters, as it is the case in other methods (e.g., nearest neighbor, furthest neighbor, median method, centroid method). Instead of that, it uses that analysis of the variance approach to evaluate the distances between clusters and emphasizes the minimization of the heterogeneity of the clusters. Cluster membership is assessed by calculating the total sum of squared deviations from the mean of a cluster. The criterion for fusion ∆C1 is that it should be the smallest possible increase in the error sum of squares:
Δ C 1 = n h n h n h + n h j = 1 p ( X h j X ¯ h j ) 2
where:
  • nh is the cardinality of cluster h,
  • Xhj is a vector of the variable´s values of the jth object in the cluster h,
  • X ¯ h j is the cluster´s average.
The advantage of the method is the appearance of the clusters that are less massive (smaller) and relatively alike in terms of frequencies. The method can also be characterized by the tendency of removing the clusters with the least number of observations, which is not the appreciated characteristic of the method.

4. Results of the Cluster Analysis

After researching the variables’ values for the Prague region, it was found that many variables of this one single region significantly exceed the values of the remaining regions. Because extreme values are not desired in this cluster analysis, this region was excluded from the analysis. After the accomplishment of the analysis, the region of Prague was added to the remaining clusters as a separate cluster consisting of a single region.
The first output from clustering is presented by the proximity matrix. It includes the distances between each pair of regions. The highest distance (this means the highest rate of dissimilarity) was recorded between Polish region PL42_Zachodniopomorskie and two Bulgarian regions: BG32_Severen Tsentralen and BG31_Severozapaden (distance: 13,5 resp. 13,3). The lowest distance (and the highest rate of similarity) was between two Polish regions PL33_Lubelskie and PL31_Swietokrzyskie (distance = 0.85).
The results of each step in the hierarchical clustering process are depicted in Figure 3, where the values of the agglomerative coefficient are shown. These values represent the value of the distance statistics which is the means for forming the clusters. These coefficients helped us to make the decision concerning the number of clusters to choose. The number of clusters stopped with the number satisfying the condition: “Between two agglomerative coefficients are larger distances” (note: In Figure 3, they are shown by the black line). In this analysis, it was estimated at six clusters.
In the graphical presentation of the clusters analysis’ results, we observe the joining of particular regions using a dendrogram. The dendrogram is a visual representation of the steps in a hierarchical clustering solution that shows the clusters being combined and the values of the distance coefficients at each step. Connected vertical lines designate joined cases. The dendrogram rescales the actual distances to numbers between 0 and 25, preserving the ratio of the distances between steps. The dendrogram of our clustering (Figure 4) implies (shown by black dotted line) the rising of six clusters. The arisen clusters are shown in the rectangle.
It is necessary to evaluate the outcome of the cluster analysis regarding the quality of the spread of the individual regions into clusters. At the same time, an appropriate number of the arisen clusters should be assessed. Both matters have already been done in the paragraph above.
The outcome itself does not have a endogenous meaning to the analyst unless it is confronted with the goals of the cluster analysis and with the known facts. The correct quantitative interpretation of the individual clusters by means of the variables’ values is, therefore, important. As is the qualitative interpretation with respect to the logical explanations of the particular clusters [48,50]. Therefore, to compare among the clusters regarding individual indices their average values were used (Table 3). To the six clusters created in the analysis, the Prague region—a separate cluster—was added for the sake of the comparison.
Specific numbers in characteristics of the clusters (minimum value, maximum value, the coefficient of variation as the measure of relative variability) are presented in Table 4 and Table 5.
Cluster 1 contains 12 regions (3 BG, 2 HU, 5 PL, 2 RO). This is the cluster of regions with the lowest average values of the indicators apart from the highest value of a number of total bed-places (percentage change over previous period) which indicates an increase of 3,8%.
Cluster 2 contains ten regions—the region with the capital city of Bulgaria and two Bulgarian coastal regions, one Czech region situated between Prague and Germany, three Baltic states and both regions of Slovenia. This cluster has the highest mean value of nights spent by residents and non-residents per thousand inhabitants (3927) and the second highest value of total nights spent by non-residents. In this cluster, the rest of the variables reaches rather higher values.
Cluster 3 is the largest cluster and contains 15 regions (3 CZ, 2 HU, 4 PL, 3 RO, 3 SK). This cluster is characterized by the low values of the variables. Among all six arisen clusters, this the only one that shows a decrease in the number of bed-places (percentage change over previous period) which indicates a decline of 2,2%. As for Cluster 3, it is a relatively homogenous group of regions.
Cluster 4 contains ten regions (3 CZ, 1 HU, 4 PL, 2 RO). This cluster features the highest mean values of the number of establishment (1270) and the number of bed places (91786), which is higher than the value in Prague (91613). This cluster is also characterized by the second highest value of arrivals of residents and the total nights spent by residents. The regions in this cluster create a homogenous group because every coefficient of variation is lower than 50%.
Cluster 5 contains one Hungarian region and three Polish regions. In this cluster, the average values of variables are the highest, i.e., second highest within the six arisen clusters. This is because this cluster contains the capital of Hungary (Budapest), the capital of Poland (Warsaw), the region with the Tatra Mountain Range in Poland and one Polish coastal region, which borders with Germany.
Cluster 6 contains two regions—the capital city of Slovakia (Bratislava) and the capital city of Romania (Bucharest). This cluster ranks the best only in the scope of one variable: Nights spent by residents and non-residents—per km2 (1222).
Cluster 7—Prague—is a region on its own (Table 3).

5. Discussion and Concluding Remarks

The cluster analysis is linked to the factor analysis as characterized previously, in the part on the methodological considerations. Clustering can be ignored in two ways: Disaggregation and aggregation [55]. In that respect, one needs to understand the consequences of such ignoring. It may lead to different results in CFA, such as inflated chi-square statistics or decreased standard errors. Therefore, it is recommended to follow the methodology of multilevel CFA (MCFA).
Even more detailed analysis is then achieved by employing some modeling approaches for analyzing the partially nested data [56]. Similarly, the modeling and visualization of the data may differ using and combining various tools, such as the business intelligence system together with the geographical information system, cartography contours, etc.
This article points out the fusion of regions of Central and Eastern Europe into clusters according to the selected indicators of tourism which Eurostat uses to evaluate tourism. In this regard, for such clusters, as presented in this paper, the definition of the South East England Development Agency (SEEDA) [57] states that "a cluster is a progressive form of business network, which has strong business objectives focusing on improving sales and profits", is more applicable. Data on such clusters, as presented in this paper, can be used in the effective planning and decision-making for the destination management [58] to support the sustainable development of tourism in a specific region. The data can also be used as a relevant base for potential future cooperation between various regions from one cluster to support tourism competitiveness and sustainable development [59,60,61].
However, the destination management strongly relies on actual data analyzed and composed of several indices in the demand or supply side of the tourism market. The demand (variables for occupancy) and supply (variables for capacity) side were presented in both the theoretical and practical point of view applied to the tourism industry. Demand and supply data reflect some of the actual requirements of the destination business, and the related destination business intelligence system (DBIS) [14,15,16,62]. These data represent inputs to the system. The output of the system is, besides others, clustering as presented in this paper. Within the DBIS, the data used for clustering may also be visualized via a geographical information system tool in order to provide recommendations in the field of decision-making and future planning for both destination managers and stakeholders in a specific destination and thus contribute to the sustainable development of the region.
The link between clustering, as presented in this paper on the example of the East and Central European countries’ tourism industry at the NUTS 2 level, and tourism sustainability can be explained via serendipity [63,64,65]. According to Hom Cary [66] “serendipity in tourism is the effect by which one accidentally stumbles upon something fortunate, especially while looking for something entirely unrelated”. However, serendipity [67] or a pilgrimage-like experience in traveling can happen only when potential tourists start to move from place to place, from region to region (e.g., Visegrad–V4 countries), from one cultural space to another. According to the Inglehart map [68], Poland is closer to India, the Czech Republic is closer to Germany and Slovakia to Taiwan and Hungry to Macedonia [68,69]. This supports the idea of clustering based on criteria of importance (e.g., sustainability criteria, number of nights spent or number of tourists, specific indicators given by international companies and/or agencies, e.g., Eurostat, UNWTO, etc.). It changes the traditional view on clusters in tourism [4,18,25,29,59,60,61,70] and allows one to see new solutions for a specific sector of the economy that tourism undoubtedly is. Bearing in mind that “in most economic activities, it is the product that reaches the consumer, but when it comes to tourism, it is the opposite in that the consumer seeks for tourism services. Because of this characteristic, tourism has a heavy impact on local development” [21]. In this paper, the clusters were identified based on following points
  • Place vs. people (variable: numbers of establishments—cities, urban areas, where people look for their touristic utilities), this suggests where the impact on sustainability can be stronger.
  • Product vs. people (number of nights spent by non-residents as variable set in the regions), this suggests the strength(cardinality) of the impact on sustainability.
  • Participants vs. people (number of bed places) can lead to some estimations of overuse, e.g., of laundry.
However, some limitations of the study should be acknowledged:
1. Results of the study presented in this paper reflect one specific type of territorial unit for statistics as a region within Europe. Recommendations towards specific clusters defined within the study may differ at lower territorial units (NUTS 3). Hence, further study of this issue in different countries or regions all around the world is required to achieve more representative and applicable results.
2. Use of more Eurostat tourism indicators in the cluster analysis may result in more accurate outputs. Potentially, in some cases, it may lead to changes within clusters and/or the number of clusters.
Nevertheless, the presented approach represents a pilot study in this field for mathematical modeling. Further investigation of the possibilities of including complementary data, e.g., on environmental indicators published under the European Union’s INSPIRE initiative [71] and European Union’s Earth Observation Programme Copernicus [72] is necessary to develop this method at both a theoretical and practical level, as the results may be applicable within the tourism sustainable development European Union wide; and elaborate the use of the European Union’s toolkit for sustainable destinations [73].

Author Contributions

Each author (G.K, E.L., L.S., B.K., C.S., M.C., S.K., M.B.) has equally contributed to this publication.

Funding

This work was supported by the Slovak Research and Development Agency under contract no. APVV-14-0797 and the project of the Scientific Grant Agency of the Ministry of Education, Science, Research and Sport of the Slovak Republic and the Slovak Academy of Sciences No. VEGA 1/0515/18.

Acknowledgments

Authors would like to thank anonymous reviewers for their helpful and constructive comments and suggestions that greatly contributed to improving the final version of this paper.

Conflicts of Interest

The authors declare no conflict of interest. The funders had no role in the design of the study; in the collection, analyses, or interpretation of data; in the writing of the manuscript, or in the decision to publish the results.

References

  1. Charles, V.; Mukesh, K. Satisficing data envelopment analysis: An application to SERVQUAL efficiency. Measurement 2014, 51, 71–80. [Google Scholar] [CrossRef]
  2. Smith, L.J. Tourism Analysis: A Handbook, 2nd ed.; Routledge: London, UK, 1995; 336p, ISBN 978-0582251601. [Google Scholar]
  3. Porter, M.E. The Competitive Advantage of Nations; Free Press: New York, NY, USA, 1990; 875p, ISBN 0029253616. [Google Scholar]
  4. Porter, M.A. On Competition; Harward Business Review Press: Boston, MA, USA, 1998; 485p, ISBN 978-0875847955. [Google Scholar]
  5. Pomering, A.; Noble, G.; Johnson, L.W. Conceptualising a contemporary marketing mix for sustainable tourism. J. Sustain. Tour. 2011, 19, 953–969. [Google Scholar] [CrossRef]
  6. Jesus, C.; Franco, M. Cooperation networks in tourism: A study of hotels and rural tourism establishments in an inland region of Portugal. J. Hosp. Tour. Manag. 2016, 29, 165–175. [Google Scholar] [CrossRef]
  7. Toca Torres, C.E.; Carrillo Rodriguez, J. Ecological Analysis of a Tourism Business Network. Rbgn-Revista Brasileira De Gestao De Negocios 2015, 17, 1044–1063. [Google Scholar] [CrossRef]
  8. Dobson, K.; Boone, S.; Andries, P.; Daou, A. Successfully creating and scaling a sustainable social enterprise model under uncertainty: The case of ViaVia Travellers Cafés. J. Clean. Prod. 2018, 172, 4555–4564. [Google Scholar] [CrossRef]
  9. Asmelash, A.G.; Kumar, S. Assessing progress of tourism sustainability: Developing and validating sustainability indicators. Tour. Manag. 2019, 71, 67–83. [Google Scholar] [CrossRef]
  10. Xiao, H.; Smith, S.L.J. Case studies in tourism research: A state-of-the-art analysis. Tour. Manag. 2006, 27, 738–749. [Google Scholar] [CrossRef]
  11. Hosany, S.; Prayag, G.; Deesilatham, S.; Causevic, S.; Odeh, K. Measuring Tourists’ Emotional Experiences: Further Validation of the Destination Emotion Scale. J. Travel Res. 2015, 54, 482–495. [Google Scholar] [CrossRef]
  12. Tong, D.Y.K. International Tourists Interest in Street Vendors Souvenirs: A Descriptive Study. In Proceedings of the 4th International Conference on Tourism Research (4ICTR), Kola Kinabalu, Malaysia, 9–11 December 2014; Othuman Mydin, M.A., Marzuki, A., Eds.; [Google Scholar] [CrossRef]
  13. Fuchs, M.; Abadzhiev, A.; Svensson, B.; Hopken, W.; Lexhagen, M. A knowledge destination framework for tourism sustainability: A business intelligence application from Sweden. Tourism 2013, 61, 121–148. [Google Scholar]
  14. Sidor, C.; Kršák, B.; Štrba, Ľ. The role of open data on the road to destination business intelligence: Notes on SK NACE I55. In Hotelnictví, Turismus a vzdělávání; Vysoká škola hotelová v Praze: Praha, Czech Republic, 2017; pp. 165–172. ISBN 978-80-87411-99-5. [Google Scholar]
  15. Sidor, C.; Kršák, B.; Štrba, Ľ. Building up basic tourism geo content for destination business intelligence via open street map file dumps. In The Image and Sustainability of Tourism Destinations. Proceedings of 9th International Tourism Congress; Polytechnic Institute of Leiria: Peniche, Portugal, 2017. [Google Scholar]
  16. Štrba, Ľ.; Kršák, B.; Sidor, C.; Blišťan, P. Destinations business information systems for smart destinations: The case study of Kosice County. Int. J. Bus. Manag. Stud. 2016, 5, 177–180. [Google Scholar]
  17. Fridgen, J.D. Dimensions of Tourism; AH&MA Education Institute: East Lansing, MI, USA, 1991; 361p, ISBN 978-0866121040. [Google Scholar]
  18. Ferreira, J.; Estevao, C. Regional competitiveness of a tourism cluster: A conceptual model proposal. Rev. Encontros Científicos Tour. Manag. Stud. 2009, 5, 37–51. [Google Scholar]
  19. Rocha, H. Entrepreneurship and Development: The Role of Clusters. Small Bus. Econ. 2004, 23, 363–400. [Google Scholar] [CrossRef]
  20. Jackson, J.; Murphy, P. Clusters in regional tourism: An Australian case. Ann. Tour. Res. 2006, 33, 1018–1035. [Google Scholar] [CrossRef]
  21. da Cunha, S.K.; da Cunha, J.C. Tourism cluster competitiveness and sustainability: Proposal for a systemic model to measure the impact of tourism on local development. Bar Braz. Adm. Rev. 2005, 2, 47–62. [Google Scholar] [CrossRef]
  22. Monfort, M.V.M. Competitividad y factores de éxito en la “hotelería de litoral”: Experiencia de los destinos turistícos Benidorm y Peniscola. Ph.D. Thesis, Universidad de Valencia, Valencia, Spain, 2000. [Google Scholar]
  23. Beni, M.C. Globalizacao do Turizmo: Megatendencias do Setor e a Realidade Brasileira; Aleph: Sao Paulo, Brazil, 2003; 208p, ISBN 978-8576571087. [Google Scholar]
  24. Final Report on the Expert Group in Enterprise Clusters and Networks. Available online: http://ibr.hi.is/sites/ibr.hi.is/files/FINAL_REPORT_OF_THE_EXPERT_GROUP_ON_ENTERPRISE_CLUSTERS_AND_NETWORKS.pdf (accessed on 3 January 2019).
  25. Kachniewska, M. Towards the Definition of a Tourism Cluster. J. Enterp. Manag. Innov. 2014, 9, 33–56. [Google Scholar] [CrossRef]
  26. Gorynia, M.; Jankowska, B. Koncepcja klastrów jako sposób regulacji zachowań podmiotów gospodarczych. Ekonomista 2007, 3, 311–340. [Google Scholar]
  27. Melisidou, S.; Papageorgiou, A.; Papayiannis, D.; Varvaressos, S. Tourism clusters as a potentially effective tool for local development and sustainability. Rev. Tour. Sci. 2014, 9, 218–232. [Google Scholar]
  28. Fundeanu, D.D. Innovative Regional Cluster, Model of Tourism Development. Procedia Econ. Financ. 2015, 23, 744–749. [Google Scholar] [CrossRef] [Green Version]
  29. Davies, E.; Ellis, P. Porter’s competitive advantage of nations: Time for the final judgement? J. Manag. Stud. 2000, 37, 1188–1213. [Google Scholar] [CrossRef]
  30. Koľveková, G.; Raisová, M. Value-added close-up of Slovak industries regarding the search of sustainability. In CEFE2017 Conference Proceedings; Technical University of Kosice: Kosice, Slovakia, 2017; pp. 403–410. [Google Scholar]
  31. González-Benito, J.; Suárez-González, I. A Study of the Role Played by Manufacturing Strategic Objectives and Capabilities in Understanding the Relationship between Porter’s Generic Strategies and Business Performance. Br. J. Manag. 2010, 21, 1027–1043. [Google Scholar] [CrossRef]
  32. Romero, I.; Tejada, P. A multi-level approach to the study of production chains in the tourism sector. Tour. Manag. 2011, 32, 297–306. [Google Scholar] [CrossRef]
  33. Kršák, B.; Koľveková, G.; Liptáková, E.; Štrba, Ľ.; Mesároš, P.; Sidor, C.; Mitterpák, M. Meranie efektívnosti v podnikoch ubytovacích služieb. Podn. Rev. 2016, 15, 38–47. [Google Scholar]
  34. Pulido-Fernández, J.I.; Cárdenas-Gacía, P.J.; Espinosa-Pulido, J.A. Does environmental sustainability contribute to tourism growth? An analysis at the country level. J. Clean. Prod. 2019, 213, 309–319. [Google Scholar] [CrossRef]
  35. Dickmann, F. Effectiveness and efficiency of tourism maps in the World Wide Web and their potential for mobile map services. In Map-Based Mobile Services; Springer: Berlin, Germany, 2005; pp. 43–53. [Google Scholar]
  36. Horner, S.; Swarbrooke, J. Consumer Behaviour in Tourism; Routledge: London, UK, 2016; 464p, ISBN 978-1138013391. [Google Scholar]
  37. Schianetz, K.; Kavanagh, L. Sustainability Indicators for Tourism Destinations: A Complex Adaptive Systems Approach Using Systemic Indicator Systems. J. Sustain. Tour. 2008, 16, 601–628. [Google Scholar] [CrossRef]
  38. Roberts, S.; Tribe, J. Sustainability Indicators for Small Tourism Enterprises—An Exploratory Perspective. J. Sustain. Tour. 2008, 16, 575–594. [Google Scholar] [CrossRef]
  39. Manuel-Navarrete, D. Tourism and Sustainability. In Sustainability Science; Heinrichs, H., Martens, P., Michelsen, G., Wiek, A., Eds.; Springer: Dordrecht, The Netherlands, 2016; pp. 283–291. [Google Scholar]
  40. Feranández, J.I.P.; Rivero, M.S. Measuring Tourism Sustainability: Proposal for a Composite Index. Tour. Econ. 2009, 15, 277–296. [Google Scholar] [CrossRef]
  41. Pomering, A.; Johnosn, L.W. Building Sustainability into Services Marketing: Expanding Decision-Making from a Mix to a Matrix. Sustainability 2018, 10, 2992. [Google Scholar] [CrossRef]
  42. Sahebalzamani, S.; Bertella, G. Business Models and Sustainability in Nature Tourism: A Systematic Review of the Literature. Sustainability 2018, 10, 3226. [Google Scholar] [CrossRef]
  43. Higgins-Desbiolles, F. Sustainable tourism: Sustaining tourism or something more? Tour. Manag. Perspect. 2018, 25, 157–160. [Google Scholar] [CrossRef]
  44. Kapera, I. Sustainable tourism development efforts by local governments in Poland. Sustain. Cities Soc. 2018, 40, 581–588. [Google Scholar] [CrossRef]
  45. Morioka, S.N.; Bolis, I.; de Carvalho, M.M. From an ideal dream towards reality analysis: Proposing Sustainable Value Exchange Matrix (SVEM) from systematic literature review on sustainable business models and face validation. J. Clean. Prod. 2018, 178, 76–88. [Google Scholar] [CrossRef]
  46. Koľveková, G.; Liptáková, E.; Sidor, C.; Kršák, B. Tourism information flows in destination management. In New Trends in Process Control and Production Management; CRC Press: Leiden, The Netherlands, 2017; pp. 269–274. ISBN 9781138058859. [Google Scholar]
  47. Kutscherauer, A.; Fachinelli, H.; Sucháček, J.; Skokan, K.; Hučka, M.; Tuleja, P.; Tománek, P. Regionální Disparity—Disparity v Regionálním Rozvoji Země, Jejich Pojetí, Identifikace a Hodnocení. Series on Advanced Economic Issues; VŠB-TU Ostrava: Ostrava, Czech Republic, 2010; 250p, ISBN 978-80-248-2335-5. [Google Scholar]
  48. Methodological Manual for Tourism Statistics. Available online: http://ec.europa.eu/eurostat/documents/3859598/6454997/KS-GQ-14-013-EN-N.pdf (accessed on 10 November 2017).
  49. Loomes, G.; Sugden, R. Regret theory: An alternative theory of rationalchoice under uncertainty. Econ. J. 1982, 92, 805–824. [Google Scholar] [CrossRef]
  50. Pomfret, G. Mountaineering adventure tourists: A conceptual framework for research. Tour. Manag. 2006, 27, 113–123. [Google Scholar] [CrossRef]
  51. Meloun, M.; Militký, J. Statistické Zpracování Experimentálních Dat; East Publishing Praha: Prague, Czech Republic, 1998; 839p, ISBN 978-8072190034. [Google Scholar]
  52. Meloun, M.; Militký, J.; Hill, M. Statistická Analýza Vícerozměrných dat v Příkladech; Academia: Prague, Czech Republic, 2012; 756p, ISBN 978-8020020710. [Google Scholar]
  53. Řezanková, H.; Húsek, D.; Snášel, V. Shluková Analýza Dat; Professional Publishing: Prague, Czech Republic, 2007; 196p, ISBN 978-80-86946-26-9. [Google Scholar]
  54. Stankovičová, I.; Vojtková, M. Viacrozmerné štatistické Metódy s Aplikáciami; Iura Edition: Bratislava, Slovakia, 2007; 261p, ISBN 978-8080781521. [Google Scholar]
  55. Pornprasertmanit, S.; Lee, J.; Preacher, K.J. Ignoring Clustering in Confirmatory Factor Analysis: Some Consequences for Model Fit and Standardized Parameter Estimates. Multivar. Behav. Res. 2014, 49, 518–543. [Google Scholar] [CrossRef] [PubMed]
  56. Sterba, S.K.; Preacher, K.J.; Forehand, R.; Hardcastle, E.J.; Cole, D.A.; Compas, B.E. Structural Equation Modeling Approaches for Analyzing Partially Nested Data. Multivar. Behav. Res. 2014, 49, 93–118. [Google Scholar] [CrossRef] [PubMed]
  57. South East England Development Agency (SEEDA). SEEDA Cluster Fund—Building your Business for a Better Future. Cluster Fund Brochure & Call for Proposal; SEEDA: Guilford, UK, 2003.
  58. Bhatia, A.K. International Tourism Management; Sterling Publishers Pvt. Ltd.: New Delhi, India, 2001; 539p, ISBN 978-8120724129. [Google Scholar]
  59. Bramwell, B.; Lane, B. Tourism Collaboration and Partnerships: Politics, Practice and Sustainability; Channel View Publications: Clevedon, UK, 2000; 351p, ISBN 9781845413989. [Google Scholar]
  60. Gursoy, D.; Saayman, M.; Sotiriadis, M. (Eds.) Collaboration in Toursim Businesses and Destinations: A Handbook; Emerald Group Publishing Ltd.: Bingley, UK, 2015; 368p, ISBN 9781783508112. [Google Scholar]
  61. Capone, F. Tourist desinations, clusters, and competetiveness: An introduction. In Tourist Clusters, Destinations and Competitiveness: Theoretical Issues and Empirical Evidences; Capone, F., Ed.; Routledge: Abingdon, UK, 2016; pp. 1–12. ISBN 9781317486237. [Google Scholar]
  62. Liptáková, E.; Koľveková, G.; Štrba, Ľ.; Kršák, B.; Sidor, C. Statistical indicators of tourism and their use within the Destination Business Intelligence System. In Hotelnictví, Turismus a vzdělávání; Vysoká škola hotelová v Praze: Praha, Czech Republic, 2017; pp. 110–117. ISBN 978-80-87411-99-5. [Google Scholar]
  63. Mody, M.A.; Suess, C.; Letho, X. The accommodation experiencescape: A comparative assessment of hotels and Airbnb. Int. J. Contemp. Hosp. Manag. 2017, 29, 2377–2404. [Google Scholar] [CrossRef]
  64. Blasco, D.; Guia, J.; Prats, L. Emergence of governance in cross-border destinations. Ann. Tour. Res. 2014, 49, 159–173. [Google Scholar] [CrossRef]
  65. Lavadinho, S. Nearness dynamics in the city: Ideas for urban change. Ciudades-Revista Del Instituto Universitatio De Urbanistica De La Universidad De Valladolid 2014, 17, 21–39. [Google Scholar]
  66. Hom Cary, S. The Tourist Moment. Ann. Tour. Res. 2004, 31, 61–67. [Google Scholar] [CrossRef]
  67. Merton, R.K.; Barber, E. The Travels and Adventures of Serendipity: A Study in Sociological Semantics and the Sociology of Science; Princeton University Press: Princeton, NJ, USA, 2011; 352p, ISBN 9781400841523. [Google Scholar]
  68. The WVS Cultural Map of the World. Available online: http://pagines.uab.cat/seangolden/sites/pagines.uab.cat.seangolden/files/World%20Values%20Surveys%20maps%2020110606.pdf (accessed on 11 November 2017).
  69. Inglehart, R.; Welzel, C. Changing mass priorities: The link between modernization and democracy. Perspect. Politics 2010, 8, 551–567. [Google Scholar] [CrossRef]
  70. Novelli, M.; Schmitz, B.; Spencer, T. Newtorks, clusters and innovation in tourism, A UK Experience. Tour. Manag. 2006, 27, 1141–1152. [Google Scholar] [CrossRef]
  71. About INSPIRE. Available online: http://inspire.ec.europa.eu/about-inspire/563 (accessed on 16 December 2018).
  72. About Copernicus. Available online: https://www.copernicus.eu/en/about-copernicus (accessed on 16 December 2018).
  73. The European Commission. The European Tourism Indicator System—Toolkit for Sustainable Destinations; Publications Office of the European Union: Luxembourg, 2013; 60p, ISBN 978-92-79-29339-9. [Google Scholar]
Figure 1. Porter’s Diamond Model [3].
Sustainability 11 00400 g001
Figure 2. Scheme of general concept towards the “one cluster product” and its criteria for evaluations, for instance in cluster analysis (P: provider of services, S: consumer view).
Sustainability 11 00400 g002
Figure 3. Cluster analysis—agglomeration schedule.
Sustainability 11 00400 g003
Figure 4. Dendrogram of clustering.
Sustainability 11 00400 g004
Table 1. The Sustainability Services Marketing Matrix [41].
ProductPricePromotionPlaceParticipantsProcessPhysical EvidencePartnerships
PlanetService product impact on PlanetPricing impact on PlanetPromotion impact on PlanetPlace impact on PlanetParticipants impact on PlanetProcess impact on PlanetPE impact on PlanetPartnership impact on Planet
PeopleService product impact on peoplePricing impact on PeoplePromotion impact on PeoplePlace impact on PeopleParticipants impact on PeopleProcess impact on PeoplePE impact on PeoplePartnership impact on People
ProfitService product impact on long-term ProfitabilityPricing impact on long-term ProfitabilityPromotion impact on long-term ProfitabilityPlace impact on long-term ProfitabilityParticipants impact on long-term ProfitabilityProcess impact on long-term ProfitabilityPE impact on long-term ProfitabilityPartnership impact on long-term Profitability
Table 2. Indicators of regional tourism (indicators in italics were used in cluster analysis).
Label
Capacity of collective tourist accommodationNumber of establishments—total
Number of establishments - total—PcPP
Number of establishments—cities
Number of establishments - cities—PcPP
Number of establishments—towns
Number of establishments - towns—PcPP
Number of establishments - rural areas
Number of establishments - rural areas—PcPP
Number of bed-places—total
Number of bed-places—total—PcPP
Number of bed-places—cities
Number of bed-places—cities—PcPP
Number of bed-places—towns
Number of bed-places—towns—PcPP
Number of bed-places—rural
Number of bed-places—rural—PcPP
Occupancy in collective tourist accommodationNet occupancy rate of bed places
Net occupancy rate of bedrooms
Arrivals of residents
Arrival of residents—PcPP
Arrivals of non-residents
Arrivals of non-residents—PcPP
Arrivals total
Arrivals total—PcPP
Total nights spent by residents—total
Total nights spent by residents—total—PcPP
Total nights spent by residents—cities
Total nights spent by residents—cities—PcPP
Total nights spent by residents—towns
Total nights spent by residents—towns—PcPP
Total nights spent by residents—rural
Total nights spent by residents—rural—PcPP
Total nights spent by non-residents—total
Total nights spent by non-residents—total—PcPP
Total nights spent by non-residents—cities
Total nights spent by non-residents—cities—PcPP
Total nights spent by non-residents—towns
Total nights spent by non-residents—towns—PcPP
Total nights spent by non-residents—rural
Total nights spent by non-residents—rural—PcPP
Nights spent by residents and non-residents—total
Nights spent by residents and non-residents—total—PcPP
Nights spent by residents and non-residents—cities
Nights spent by residents and non-residents—cities—PcPP
Nights spent by residents and non-residents—towns
Nights spent by residents and non-residents—towns—PcPP
Nights spent by residents and non-residents—rural
Nights spent by residents and non-residents—rural—PcPP
Nights spent by residents and non-residents—per thousand inhabitant
Nights spent by residents and non-residents—per km2
Note: PcPP—percentage change over previous period.
Table 3. Characteristics of the clusters—the mean values of the variables.
Ward Method
Cluster 1Cluster 2Cluster 3Cluster 4Cluster 5Cluster 6Prague
MeanMeanMeanMeanMeanMean
NE total4091 0686051 270939197757
NBP total23 00866 53940 23291 78681 70024 49891 613
NBP total (PcPP)3,81,6−2,21,33,11,6−4,4
NOR-BP26402829443154
NOR-BR33504035554365
AR-R526 670748 218711 3721 455 3881 964 992528 630780 961
AR-NR101 0751 097 086180 356370 6121 514 119762 8835 315 054
AR total627 7451 845 305891 7281 826 0003 479 1111 291 5136 096 015
TN-R total1 245 2431 954 1901 953 2643 931 0065 666 5701 042 4661 368 554
TN-NR total224 9253 525 509478 193864 6343 807 2631 297 78713 381 733
NS-R-NR total1 470 1675 479 6992 431 4574 795 6409 473 8332 340 25314 750 287
NS-R-NR (pTHAB)9393 9271 6372 4593 6172 21611 865
NS-R-NR (pkm2)762801732726771 22229 727
Explanations: NE total: number of establishments—total, NBP total: number of bed-places—total, NBP total (PcPP): number of bed-places—total (percentage change over previous period), NOR-BP: net occupancy rate of bed places, NOR-BR: net occupancy rate of bedrooms, AR-R: arrivals of residents, AR-NR: arrivals of non-residents, AR total: arrivals total, TN-R total: total nights spent by residents—total, TN-NR total: total nights spent by non-residents—total, NS-R-NR total: nights spent by residents and non-residents—total, NS-R-NR (pTHAB): nights spent by residents and non-residents—per thousand inhabitants, NS-R-NR (pkm2): Nights spent by residents and non-residents—per km2.
Table 4. Cluster descriptive characteristics of total number of establishments, total number of bed-places, total number of bed-places (percentage change over previous period), net occupancy rate of bed places, net occupancy rate of bedrooms, arrivals of residents, and arrivals of non-residents.
Indicators
NE TotalN-BP TotalN-BP Total (PcPP)NOR-BPNOR-BRAR-RAR-NR
Ward methodCluster 1Mean40923 0083,82633526 670101 075
Max70951 201103140768 159172 631
Min1427 913−1,21723231 81326 608
CV47%56%X16%16%36%52%
Cluster 2Mean1 06866 5391,64050748 2181 097 086
Max2 062128 2177,750681 316 6961 983 315
Min59639 074−6,62936461 048617 558
CV52%41%X14%17%38%45%
Cluster 3Mean60540 232−2,22840711 372180 356
Max1 06460 9822,232691 022 980303 587
Min28318 211−9,82330426 46140 719
CV35%39%X9%29%27%38%
Cluster 4Mean1 27091 7861,329351 455 388370 612
Max2 235153 2355,637431 906 310580 736
Min63642 597−4,92426883 50886 717
CV43%43%X14%14%22%44%
Cluster 5Mean93981 7003,144551 964 9921 514 119
Max1 418121 6175,446602 702 4223 157 529
Min47647 9211,44250895 617543 009
CV53%38%X4%8%43%75%
Cluster 6Mean19724 4981,63143528 630762 883
Max22028 0132,13653709 131921 131
Min17320 9831,12633348 128604 635
CV17%20%X22%33%48%29%
For explanations, please see Table 3.
Table 5. Cluster descriptive characteristics of total arrivals, total nights spent by residents, total nights spent by non-residents, total nights spent by residents and non-residents, nights spent by residents and non-residents (per thousand inhabitants), nights spent by residents and non-residents (per km2).
Indicators
AR TotalTN-R TotalTN-NR TotalNS-R-NR TotalNS-R-NR (pTHAB)NS-R-NR (pkm2)
Ward methodCluster 1Mean627 7451 245 243224 9251 470 16793976
Max924 2462 319 053597 8482 493 5521 454140
Min260 184445 92156 308502 22952126
CV36%45%73%44%36%47%
Cluster 2Mean1 845 3051 954 1903 525 5095 479 6993 927280
Max3 087 0703 431 1786 579 8408 560 7538 048658
Min1 208 5531 282 4841 799 6963 435 0081 61464
CV35%33%43%27%57%70%
Cluster 3Mean891 7281 953 264478 1932 431 4571 637173
Max1 192 9313 100 5511 004 2973 449 3432 821374
Min483 483952 85185 3071 201 90775553
CV23%30%59%28%41%58%
Cluster 4Mean1 826 0003 931 006864 6344 795 6402 459272
Max2 416 3826 023 5501 382 1277 093 1314 200509
Min1 052 7132 385 487324 5712 979 240911105
CV23%30%40%29%46%49%
Cluster 5Mean3 479 1115 666 5703 807 2639 473 8333 617677
Max4 053 1469 093 7637 445 57111 919 4047 0471 335
Min2 247 6621 784 3432 115 2026 579 8541 243185
CV24%57%64%24%68%71%
Cluster 6Mean1 291 5131 042 4661 297 7872 340 2532 2161 222
Max1 630 2621 123 4591 537 4432 660 9023 2661 461
Min952 763961 4731 058 1312 019 6041 166984
CV37%11%26%19%67%28%
For explanations, please see Table 3.

