1. Introduction
Scholarly and popular interest in the phenomenon of shrinking cities has blossomed in the last decade [
1]. The case of Springfield, Ohio, underscores this interest. A recent headline read, “A Shrinking City Faces A Tough Economic Future” [
2]. Springfield was once an iconic, suburban-like community situated between the metropolitan areas of Dayton and Columbus, which Newsweek [
3] highlighted as the quintessential “American Dream.” Since 1980, Springfield’s population declined by 16%, losing some 12,000 residents. By the beginning of the twenty-first century, the economic future of cities and suburbs like Springfield remained uncertain in the face of globalization and deindustrialization.
As urbanized areas around the world contemplate the implementation of sustainable development goals, such as the United Nations’
New Urban Agenda, scholars and practitioners have recently called for expanding the scope of our inquiry to focus more on the suburbs [
4]. In 2016, at the most recent UN Conferences on Housing (named: “Habitat III”), the signatories of the United Nations agreed to reinforce a global commitment to sustainable urbanization. By identifying “the need to address social, economic and material inequalities in cities and urban areas,” the
New Urban Agenda articulated the goal of making safer, resilient, and sustainable cities [
5]. Specifically, one of the mechanisms of the agenda is to promote national urban policies that integrate systems of cities and human settlements for the furtherance of sustainable, integrated urban development. The need to confront the uneven nature of population growth and decline of human settlements is paramount to achieving these goals. Indeed, the sustainable development of metropolitan areas depends on an equitable model of growth in which cities and suburbs can benefit together in a metropolitan system.
Hollander [
6] puts forth a research agenda on shrinking cities that urges scholars to examine regional perspectives on demographic differentiation in urban, suburban, and rural landscapes. The extensive suburbanization of the United States has resulted in new spatial patterns of the metropolis [
7]. One of these new patterns is a shift from the predominant suburban growth narrative to the nexus of decline [
8]. Some suburbs have been entirely bypassed by the nation’s growth and prosperity, struggling to maintain their viability while other suburbs boom. These suburbs face many of the same challenges as shrinking cities, including depopulation, rising poverty, fiscal distress, and disinvestment. These same suburbs also often have fewer resources to respond to this decline, given the historic underdevelopment of governance institutions and capacity in suburbs as opposed to central cities. Such limited capacity has been associated, in part, with the political fragmentation of local governments [
9]. Thus, suburban decline has been termed “the next urban crisis” as compared to “the old urban crisis, characterized by the decline of central cities” [
10] (p. 55).
This study aims to investigates the location and prevalence of shrinking suburbs within the American context. Such work is necessary as a precursor to further investigation of the causes and consequences of shrinking suburbs. Any effective local policy, planning, or design efforts to stem the tide of shrinking populations in American suburbs and improve their sustainability and resilience must begin with an understanding of the phenomenon in place, and how it relates to broader trends within the nation. In this paper, the phenomenon of shrinking suburbs within the United States is examined, which begins with a review of the evolution of shrinking cities and suburbs. Then, patterns of regional population change are explored during the three decades of study from 1980 to 2010. By focusing on the regional scale, spatial trends are characterized according to population growth, stability, and decline in cities and suburbs. The results demonstrate that the experience of shrinking suburbs varies remarkably throughout the nation among and within metropolitan areas. A kaleidoscope of contributing factors suggests a complex set of potential policy and planning interventions that may be needed to address the phenomenon of shrinking suburbs in order to promote the sustainable development of metropolitan areas.
2. Literature Review
Although a burgeoning body of literature on nature and causes of shrinking cities now exists, few scholars have examined the phenomenon of shrinking suburbs in an empirical manner. Scholarly attention has focused on large, shrinking cities [
11,
12], trajectories of population change in cities [
13,
14], determinants of shrinking cities [
15], and planning responses to shrinking cities [
16]. Drawing on De Vidovich’s [
17] literature review on suburbanization, the section is organized according to the evolution of the field. A focus on definitions and models of the development frames the understanding about the growth and decline of cities and suburbs. In this section, the state of knowledge is synthesized and a rationale for examining this phenomenon in the suburban context is then provided.
First, it is necessary to consider the evolution of research on shrinking cities and suburbs. The term “shrinking city” was originally used to describe cities in Eastern Europe that struggled to adjust to the new global economy at the end of the Cold War era [
18]. This era began in the wake of World War II and ended with the fall of the Soviet Union in 1991 [
19]. In subsequent decades, the transition to capitalism in Eastern Europe brought many challenges to the markets of these places as they tried to connect to the globalized economy. Cities such as Leipzig, Germany experienced both population loss and a lack of new economic investment.
By comparison, in the United States, Detroit is often considered the quintessential American shrinking city [
20,
21]. Detroit experienced population loss of nearly half a million residents from the central city alone between 1980 and 2010, representing more than 40% of its population. Such depopulation occurs for many reasons depending on the local context [
22]. Factors may include natural disasters [
23], deindustrialization [
24], suburbanization [
25], and the economic cycle of globalization [
26]. In simple terms, a shrinking city is a place that is “facing population declines” or depopulation [
22] (p. 133).
The understanding of shrinking cities often makes clear that a shrinking city faces more than depopulation. Such places also endure problems of their political economies that portend distress or even crisis [
27]. In this sense, depopulation is the symptom of underlying demographic and economic shifts [
12]. In relation to the city’s demographic structure, population loss may result from out-migration or declining fertility [
28]. In relation to the city’s economic structure, population loss may result from a complex set of global and local pressures on labor, housing, capital, and land markets driving location decisions of both residents and firms. In turn, shrinking results in changes to the built environment, which refers to the human-made environment of public infrastructure like the transportation system, the housing stock, and the design of neighborhoods [
29]. As a result, changes to the quality of the built environment may exacerbate cycles of population or economic decline, and may have substantial carry-on effects for a city’s sustainability trajectory [
30].
The precise indicators used to identify shrinking cities have varied due to the scope, study area, and rationale of the research. The Shrinking Cities International Research Network (SCIRN) was formed, in part, to unify the studies of shrinking cities through the creation of a collaborative network of scholars. Founded in 2004 at the Institute of Urban and Regional Development at the University of California, Berkeley, SCIRN is “a worldwide research consortium of scholars and experts from various institutions pursuing research on shrinking cities in a global context … [whose] mission is to advance international understanding and promote scholarship about population decrease in urban regions and urban decline, causes, manifestations, spatial variations, and effectiveness of policies and planning interventions to stave off decline” [
31].
Blanco et al. [
32] (p. 224) explains that one of the benefits of SCIRN is the agreement on a definition of a shrinking city, which is: “A densely populated urban area with a minimum population of 10,000 residents that has faced population losses in large parts for more than two years and is undergoing economic transformations with some symptoms of a structural crisis.” Such a crisis may emerge when government institutions and markets fail to respond to the decline of these places [
33]. Since then, scholars conducting comparative research on shrinking cities on a global scale focus on depopulating places with more than 100,000 residents [
34]. Many scholars also apply an average pace of decline criterion to the term “shrinking,” such as more than 0.2% loss per year or greater than 25% loss over four decades [
35].
Given variation in the causes of depopulation, scholars have conceptualized how shrinking cities shrink. For example, Weyman and Martinez-Fernandez [
36] identified a shrinking cities typology based on the state of: “continuous shrinking” (consistent population loss since 1960), “stabilized cities” (population loss and followed by no loss, no growth), and “shrinking cities” (short-term since the 2000s, or medium-to-long-term from 1980 to 2008). Similarly, Wolff and Wiechmann [
14] found that 20% of European cities experienced shrinkage since 1990 along three trajectories of change, including continuously, episodically, or temporarily shrinking cities.
Still, other scholars use multiple indicators to characterize shrinking. For example, Wiechmann and Pallagst [
37] articulated a population dimension and an economic dimension to characterize the growth and decline of a city. They identify “downgrading areas” that are depopulating and facing economic decline, and “transition areas” that are depopulating but experiencing economic growth. Hartt [
12] expanded on these dimensions to categorize various trajectories of both population and economic change among large U.S. cities. Even when analyzing population change exclusively, Olsen [
28] questioned whether population change occurs as a result of migration or fertility patterns, which imply different policy responses and necessitate further differentiation of place in the investigation of the shrinking phenomena.
As cities are nested within larger metropolitan geographies, one could distinguish shrinking cities within shrinking regions from shrinking cities within growing regions. Much attention has been paid to the ‘donut hole’ phenomenon, where central cities were declining but suburbs were prospering. The policy implications are clear: focus on the downtown areas. However, recent analysis suggests that in some places the inner-ring suburbs now experience the most decline within the metropolitan region, resulting in ‘the new donut’ metropolitan geography [
38,
39]. In these places, central cities and the outer-ring suburbs are stable or growing while the oldest and closest-in suburbs now face classic urban ills from depopulation, aging buildings and infrastructure, and a declining tax base. Weaver et al. [
35] confirm these changes occurring in the St. Louis metropolitan area in which the inner-ring suburbs of the city witnessed the greatest socioeconomic decline since 1970. It is therefore no longer suitable to focus exclusively on the shrinking city as the relevant study unit. Suburbs now face similar socioeconomic and physical decline challenges as central cities and deserve further analysis.
Given the SCIRN’s focus on larger places, many scholars have yet to examine the phenomenon of suburban shrinkage. Part of the challenge is related to measurement techniques, and more fundamentally, a lack of consensus on the operational definition of a suburb [
40]. The U.S. Census Bureau considers a suburb as the difference between the metropolitan area and the central city. Some public documents specifically refer to the “suburban” population, but more often “suburban” is described as the population “outside of central cities.” This definition takes a classic approach: a suburb is sub-urban, or a secondary unit to the urban. As McNeur [
41] (p. 155) point out, “the term ‘suburb’ in the mid-nineteenth century referred to any kind of exurban community, planned or unplanned,” including the “extralegal shantytowns on the edge of the city” that served the immediate housing needs of the city’s poor. Beginning in 1950, the U.S. Census Bureau defined “urban” as incorporated and unincorporated places (including “census designated places” or CDPs, starting 1980) with populations of at least 2500 residents. By this definition, the “suburban” population includes urban places that are not designated as the central city(s) in the metropolitan area, as well as “rural” space (which is defined as any place not classified as “urban”). Such designations of suburban populations have been used by scholars to examine the dynamics of growth and decline in metropolitan areas [
42].
Puentes and Warren [
43] (p. 1) studied “first suburbs … generally defined as those places that developed first after their center city, before or during the rapid suburban expansion right after World War II, and before the newly developing suburbs of today.” They utilized the county as the spatial unit of analysis and identified ‘first suburbs’ as those with more than 120,000 residents and that were proximate to central cities in the 1950 metropolitan statistical areas. When appropriate, the population of central cities was extracted from the county populations, to generate the suburban portion. Thus, the suburban population of these areas represented the aggregate population of many individual suburbs, such as Berwyn, Evanston, Park Ridge, and Schaumburg, in Cook County, IL. They found 10 suburbs with declining populations from 1980 to 2000, all located in the Northeast and Midwest regions.
Few scholars have studied shrinking suburbs in a comparative sense, where the unit of analysis is the individual suburb rather than an aggregation of suburbs in the region. Lucy and Phillips [
44] examined 554 suburbs within 24 metropolitan areas, using census data from 1960 to 1990, with a focus on income change rather than depopulation. They operationalized suburban decline as “incomes of residents of some suburbs are declining relative to the median of regional incomes, and sometimes declining faster than the incomes of central city residents” [
44] (p. 164). They found 405 suburbs with some relative income decline, 112 suburbs with relative incomes that were declining faster than their central cities, and 94 suburbs with relative incomes that declined more than 30% from 1960 to 1990. They found some evidence that inner-ring suburbs were declining faster than outer-ring suburbs, although some suburbs were prospering while others in the same region were not (i.e., Arlington, VA and Prince George’s County, MD, in metropolitan Washington, DC). Thus, they concluded there was evidence to support both concentric ring and sector models of urban change in metropolitan areas [
45,
46].
In another related study, Juday [
39] also found some support for the concentric ring model when examining desirability of location within a metropolitan area. This study confirmed that many downtowns successfully attracted educated and high-income residents from 1990 to 2012, while poverty and lower property values extended outward into the inner-ring suburbs and beyond. A few cities throughout the country resisted transforming into ‘the new donut’ patterns, maintaining either ‘the old donut’ pattern, such as Las Vegas and Hartford, or maintaining strong ‘magnetic’ central cities and inner-ring suburbs, such as Boston and Seattle. Like many other scholars, Juday did not analyze individual suburbs. Instead, Juday used block group level census data (the smallest geographic scale at which U.S. Census data are compiled) to examine change with distance from the urban core.
Still other scholars employ a qualitative, contextual approach with a single or several cases, where local knowledge of the region can reveal distinct suburbs appropriate for analysis. For example, Audirac et al. [
47] examined suburban decline in four global cities: Paris, Glasgow, São Paulo, and Guadalajara, finding evidence to support widespread patterns of growth and decline of the population, economy, and built environment of the suburbs across these regions. Thus, there is evidence of complex patterns of perforation among the suburbs of regions globally.
Although depopulation can be viewed as a symptom of underlying demographic and structural economic shifts, such as globalization, it confers challenges on places and regions, especially when sustained over a long-term period. Some of these challenges include vacancy and physical decline of residential, commercial, and industrial areas, fiscal distress, and a shifting political economy. Scholars of shrinking cities, and more broadly of urban decline, often note the presence of a vicious cycle. The cycle of decline consists of a feedback loop in which population decline triggers private disinvestment, which triggers fiscal distress, which triggers public disinvestment in services and infrastructure, which triggers more population decline [
48]. Finally, the phenomenon of shrinking suburbs also results in shifts in the political economy within metropolitan areas. While American suburbs in aggregate have been gaining population and political power since World War II relative to their cities, declining suburbs exhibit increasing poverty and widening inequality [
49].
It is clear that cities—and now suburbs—across the United States have been impacted by the phenomenon of shrinking places. Next, the methodological approach is presented to contextualize the comprehensive study of the definition, differentiation, and classification of shrinking suburbs in the United States.
3. Methodological Approach
In this paper, the phenomenon of shrinking suburbs in the United States is investigated during the period of 1980 to 2010. Three research questions motivate this study: (1) What is the population change in suburban neighborhoods and places from 1980 to 2010? (2) Where are shrinking suburbs located? (3) What are the trajectories of change of shrinking suburbs? In this section, the data collection techniques and the analytical approach to study shrinking suburbs are described.
The analysis began by identifying the geography of metropolitan regions using the standard metropolitan statistical area (SMSA) as defined by the Office of Management and Budget (OMB) for the 1980 Census of Population and Housing [
50]. It was necessary to define metropolitan regions in and outside of New England. Outside of the New England region, SMSA geographies were compiled based on collections of counties with at least one principal city of 50,000 residents in 1980, and they included adjacent and outlying counties with a functional relationship to the central counties (i.e., a predominance of commuting to the census-defined “urbanized area” that includes the principal city). The question of the definition of a “city” has been the topic of scholarly discussion that was popularized by the Chicago School of Sociology in the 1920s [
46]. Contemporary definitions of the geography of metropolitan areas can be found in the Geographic Areas Reference Manual [
51]. Because New England states did not utilize county geographies, the SMSA geographies in New England were constructed from sub-county components, such as county subdivisions and incorporated places. In sum, 318 SMSAs were defined for the 1980 Census in the 50 states, and in the District of Columbia. The SMSAs of U.S. territories were excluded, since their development patterns and history differ substantially from those in the rest of the country. The geography covered by the 318 SMSAs in 1980 served as the universe of the analysis.
A commercial database by GeoLytics, Inc. was utilized to collect data. Specifically, a dataset of U.S. Census demographic and socioeconomic variables from 1980 to 2010 was compiled using consistent geographic boundaries by normalizing them to 2010 U.S. Census tracts [
52]. Using the Geolytics database, 55,051 census tracts located within the 318 SMSAs were extracted. These tracts represent 75% of the tracts but only 16% of the land area of the United States. A major concern for longitudinal analysis is that the boundaries of census-designated geographies change over time, confounding results using the unstable geographies and known as the “modifiable areal unit problem” [
53]. Therefore, the utilization of spatially normalized data to a specific geography overcomes this problem.
Next, it was necessary to determine an approach to identify cities and suburbs located within the SMSAs. The spatial definitions of suburbs vary widely, given the fact that the U.S. Census Bureau does not define suburban geographies [
54]. Scholars have identified a multitude of criteria to identify suburbs, such as location in the metropolitan area, proximity to central city, temporal criteria, such as age of development and built environmental characteristics [
55,
56,
57,
58]. The Census’s place geography was utilized to identify census tracts within these SMSAs. The Geolytics database includes an indicator for the census place (defined for the 2010 census) within which the tract is located, if any. Census places include incorporated cities and other unincorporated, census-defined place (CDP) geographies. Most places have more than 2500 residents, although a “rural place” contains fewer than 2500 persons and is located outside of urbanized areas [
51]. This approach facilitated the aggregation of Geolytics’ standardized census tract data to the designated place geography. (Note that by aggregating the data from the normalized census tracts to places, our resulting data may vary from the published reports for census-designated places in each Census year preceding 2010, due to Geolytics’ normalizing algorithm. In some circumstances, the tract-based population is larger than the published place population). Additional tracts were located within the SMSA boundaries but not in designated places. These places were coded as “outside of places” to ensure complete coverage of the SMSA geographies. All tracts within places were designated as “central cities” if located within the principal cities named by the OMB when defining the 1980 SMSAs. In the majority of cases, these named central cities had populations greater than 50,000 in 1980. All tracts within places not named by the OMB in the 1980 SMSA titles were designated as “suburban places.” Some suburban places were recoded as “rural places” if (1) their population was less than 2500 in each year from 1980 to 2010; and (2) their average population densities in 1980 and 2010 were both less than 1000 persons per square mile (a typical criterion for inclusion in the census-defined “urbanized area”).
The year 1980 was selected as the beginning period for this analysis, in part, for pragmatic reasons, because census tracts were defined for the majority of the regions of the United States by 1980. This year is also a relevant starting point for conceptual reasons, as it is the point for which scholars suggest a new “era of suburban decline” began [
44] (p. 163). Indeed, Beauregard [
59] identified the period from 1948 to 1975 as the final era of urbanization in the United States. Subsequent urbanization had a substantially different character that reflected the growth of the suburbs outside of major urban centers. The selection of 1980 reflects the change in these patterns of development in metropolitan areas.
The principal variables used in this analysis were extracted from the Geolytics’ database at the census tract level and then were aggregated to the place within the SMSA. These variables included population characteristics (i.e., total count and density); housing characteristics (i.e., total units and occupancy status); race; and poverty status. Additional variables were added to those extracted from the Geolytics’ database for the Census Region and Division. In summary, the final sample utilized in this analysis included 54,831 census tracts in 9246 places of 312 SMSAs, with data that spanned across four time-periods: 1980, 1990, 2000, and 2010. (Six SMSAs were not completely assigned tracts in 1980, and therefore, they were excluded from the analysis, including Athens, GA; Bangor, ME; Burlington, VT; Charlottesville, VA; Cumberland, MD-WV; and Hickory, NC).
4. Results
In this analysis, two primary findings emerged: (1) divergent spatial patterns of population change between 1980 and 2010; and (2) diverse trajectories of suburban growth and decline. These findings are reviewed in turn.
4.1. Population Change in Metropolitan America, 1980–2010
The United States experienced strong population growth during the previous three decades, increasing by nearly 70 percent from 181 million in 1980 to 309 million in 2010. Approximately half of this growth occurred in metropolitan areas, and the majority of metropolitan growth occurred in suburbs.
Table 1 charts the pattern of population change in metropolitan America for the sample of SMSAs from 1980 to 2010. The median decline among declining places was 10.6%. Of these depopulating places, nearly one-third (
n = 132 places) of central cities shrunk and 22% of suburban places shrunk during the period of analysis. Although there were many more suburbs than central cities, shrinking suburbs housed approximately the same overall population as shrinking central cities in 2010. Furthermore, shrinking suburbs experienced similar absolute decline during the period as shrinking central cities.
Overall, the results of this analysis showed that the population decline among shrinking suburbs stands out in contrast to the overall population growth the suburbs. Among the shrinking suburbs (n = 1891), the population was 19.8 million in 1980. By 2010, the population declined by 2.5 million, or by 13%. In contrast, among all suburbs, the population was 83.1 million in 1980. By 2010, the population grew by 45.7 million, or 55%. These stark differences in the patterns of population growth and decline in suburbs merit further analysis.
The aggregate population of central cities grew by 21%, adding some 15 million residents from 1980 to 2010. Overall, shrinking central cities declined by 16%, losing some 3.3 million residents during the same period. The central cities that experienced the largest percentages of population decline (more than 35% from 1980 to 2010) were primarily located in the nation’s deindustrialized areas in the Midwest and the Northeastern, commonly known as the Rustbelt [
60]. These “legacy cities,” such as Gary, IN; Youngstown, WV; Detroit, MI; and Flint, MI, suffered from population losses due to extensive suburbanization and deindustrialization, among other influences [
61]. Two central cities along the Gulf Coast (New Orleans, LA and Anniston, AL) also suffered substantial decline during this study period. Certainly, the decline of both cities was exacerbated by Hurricane Katrina in 2005. However, these cities were previously declining, suggesting that the factors driving their decline extended beyond natural disasters.
By comparison, the aggregate population of suburban places grew by 55%, adding some 45 million residents from 1980 to 2010. The shrinking suburbs overall declined by 13%, losing some 2.4 million residents. The suburban places experiencing the largest percentage population decline (more than 70% from 1980 to 2010) were primarily military bases, illustrating the population impacts of base realignment and closures (i.e., Andrews, Edwards, and Scott Air Force Bases, and the Homestead Air Reserve Base). (Some notable shifts in suburban population have occurred at current or former military bases from 1980 to 2010, warranting separate mention. For instance, 30 military places have lost between 10% (Fort Hunt, VA) and 87% (Homestead Base, FL) of their population during this period. Specifically, we classified these 30 places as either: continuous-loss (
n = 13), loss-then-rebound (
n = 6), long-term-loss (
n = 3), and growth-then-decline (
n = 8) suburbs. For a discussion of the socioeconomic impacts on military bases and planning, see Cowan [
62]). Four suburban places with at least 50,000 residents remaining in 2010 experienced more than 20% population declines from 1980 to 2010, which Mallach and Brachman [
63] used as a criterion to identify shrinking places among “older industrial cities.” These four larger shrinking suburbs, including Niagara Falls and Tonawanda in the Buffalo SMSA, and Pontiac and St. Clair Shores in the Detroit SMSA, share many characteristics as their central cities: depopulation and deindustrialization.
The rural places experiencing the largest population declines included places located outside of the regions of Baltimore, Chicago, Erie, Philadelphia, Pittsburgh, Shreveport, and Syracuse. Given the small aggregate size of rural places, and the relatively small-percentage changes in population, rural places were excluded from the analysis of shrinking suburbs. Thus, the universe of “shrinking suburbs” in this study includes depopulating suburban places within metropolitan areas defined as of 1980, located outside named central cities, excluding rural places, and with the population not located in city centers.
4.2. Divergent Spatial Patterns of Population Change
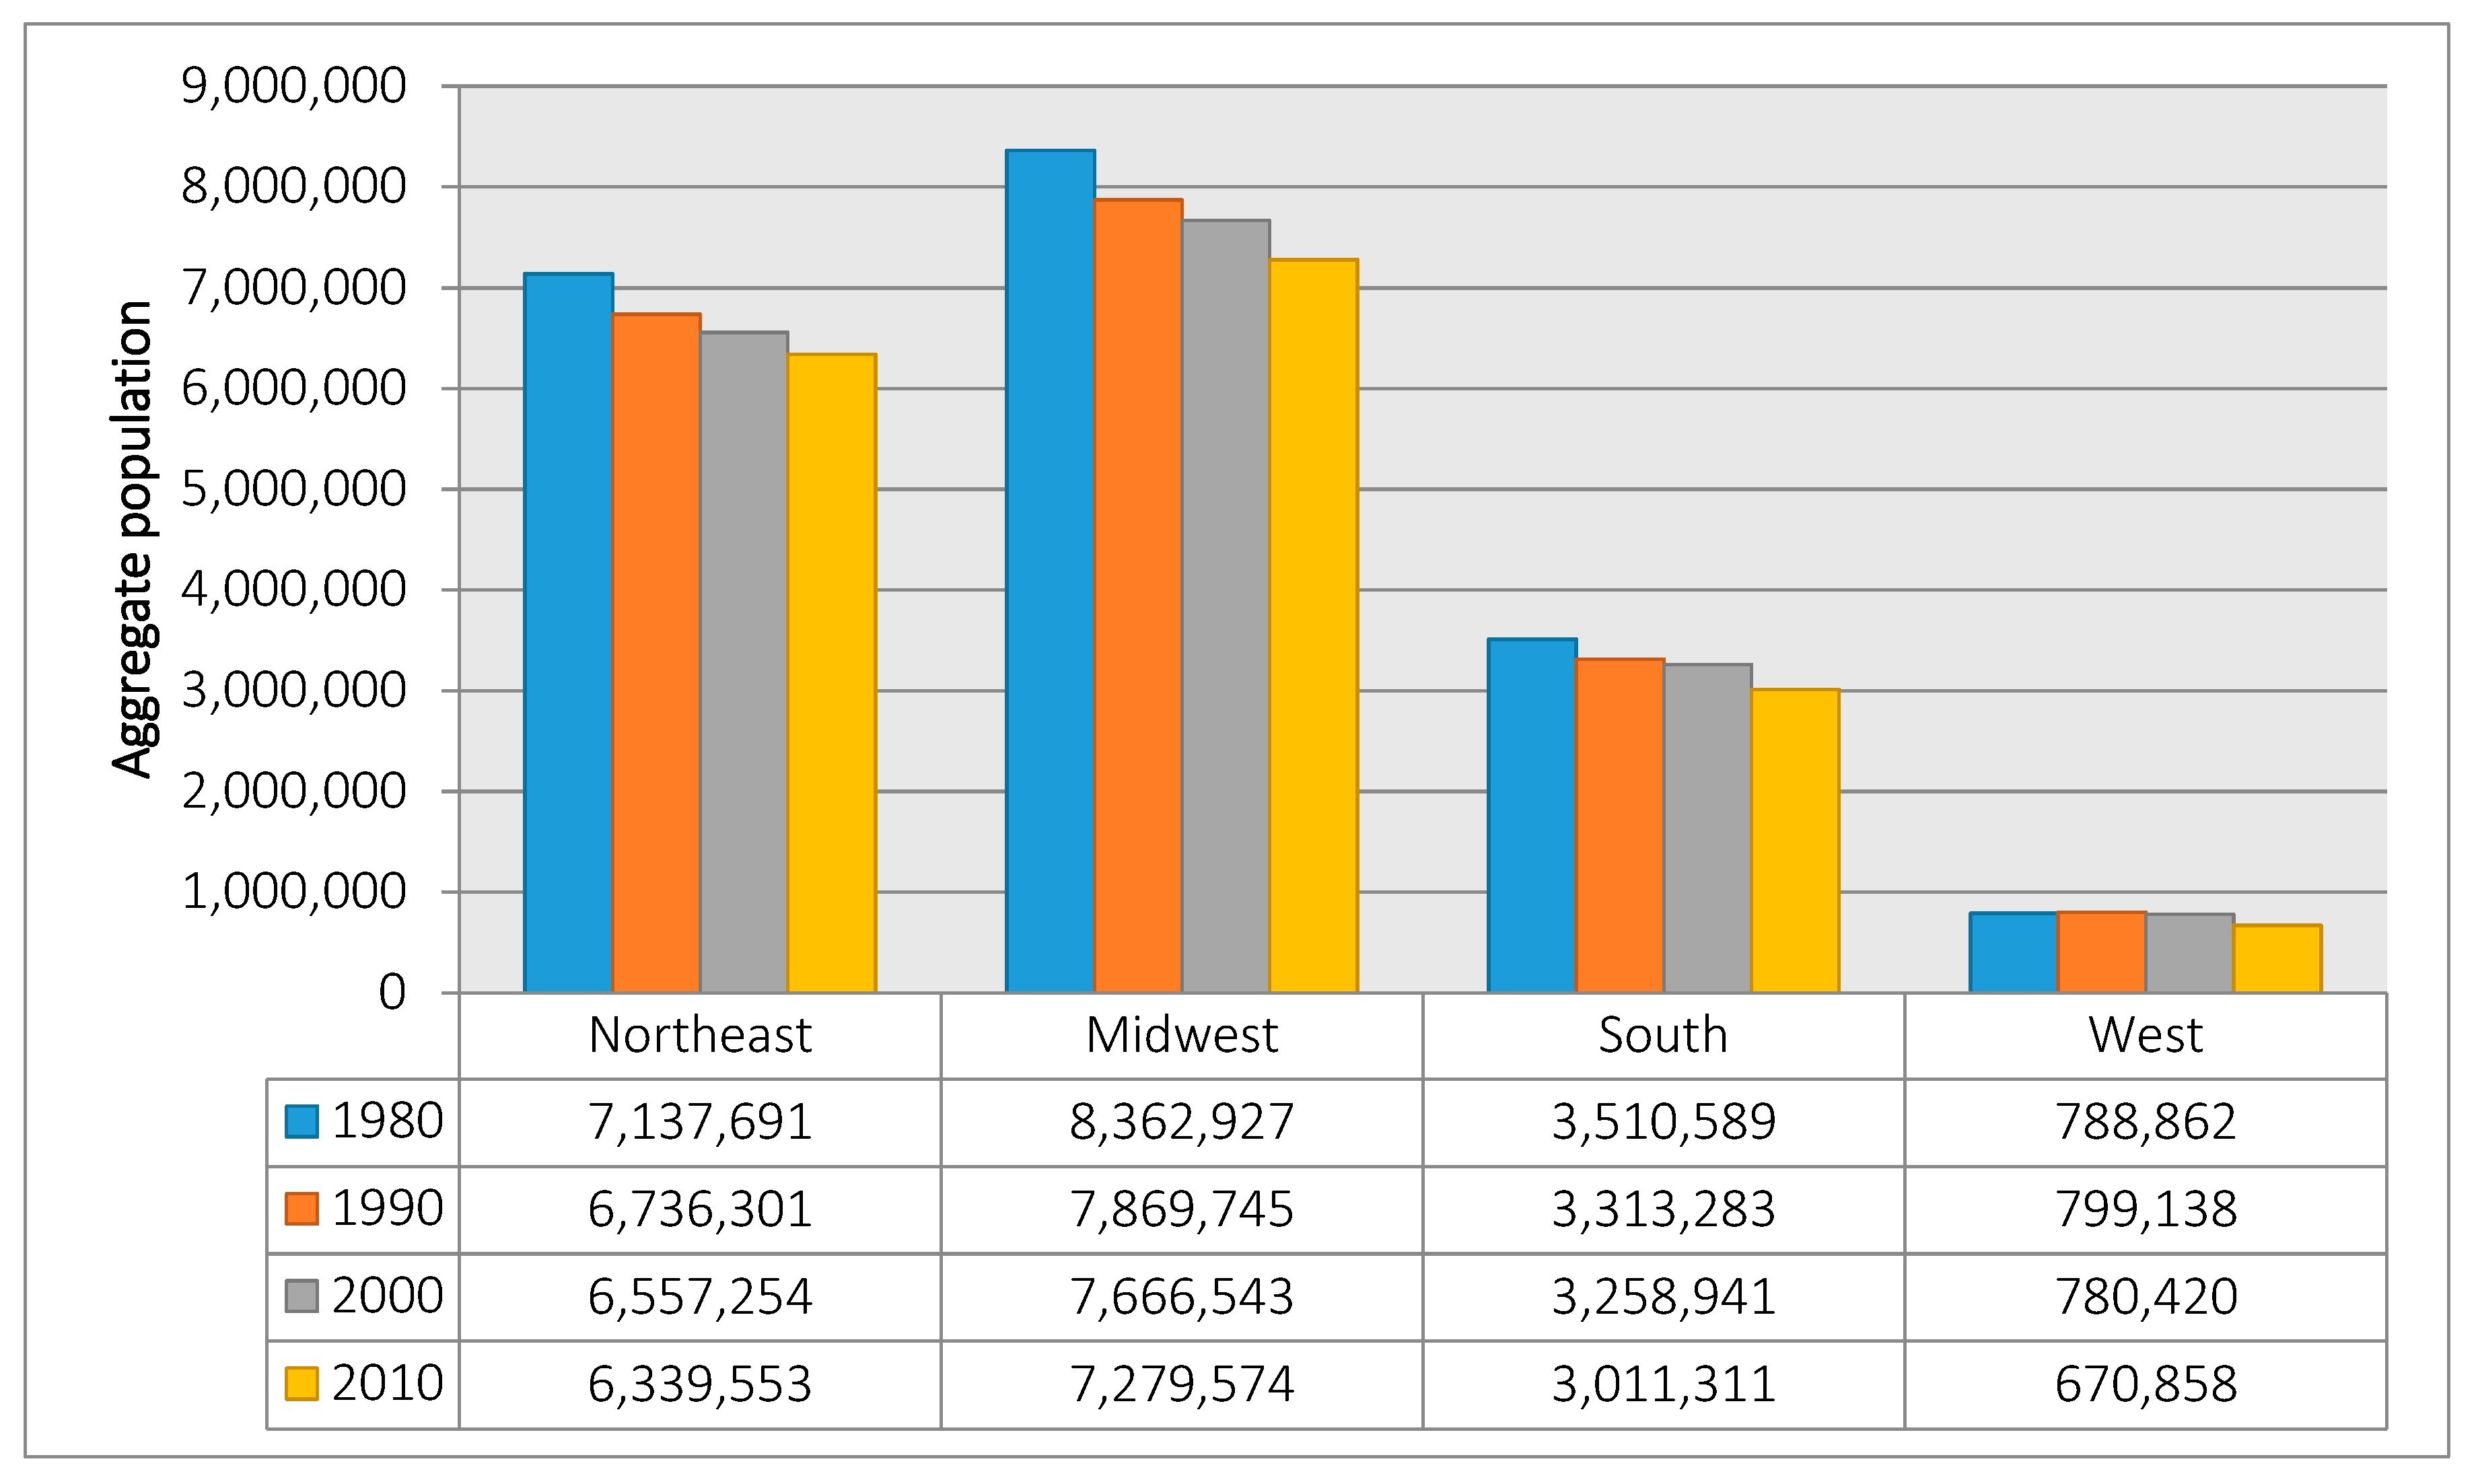
Figure 1 illustrates that shrinking suburbs were located predominantly within the Northeast and Midwest census regions. Specifically, more than two-thirds of shrinking suburbs, by total number of places and by their corresponding population, were located in these two regions. The largest aggregate declines were found in shrinking suburbs of the metropolitan Midwest, which declined by 13% and lost approximately one million residents. Similarly, in the metropolitan Northeast, nearly 800,000 residents left these suburbs, which was a decline of 11%. Within the Northeast and Midwest regions, the predominance of population loss among shrinking suburbs was found in the Middle Atlantic and East North Central census divisions. Thus, this analysis confirms that suburban shrinkage during the study period was concentrated within the Rustbelt region and near the nation’s older industrial cities. Nevertheless, shrinking suburbs were found in all 312 SMASs in the study’s sample.
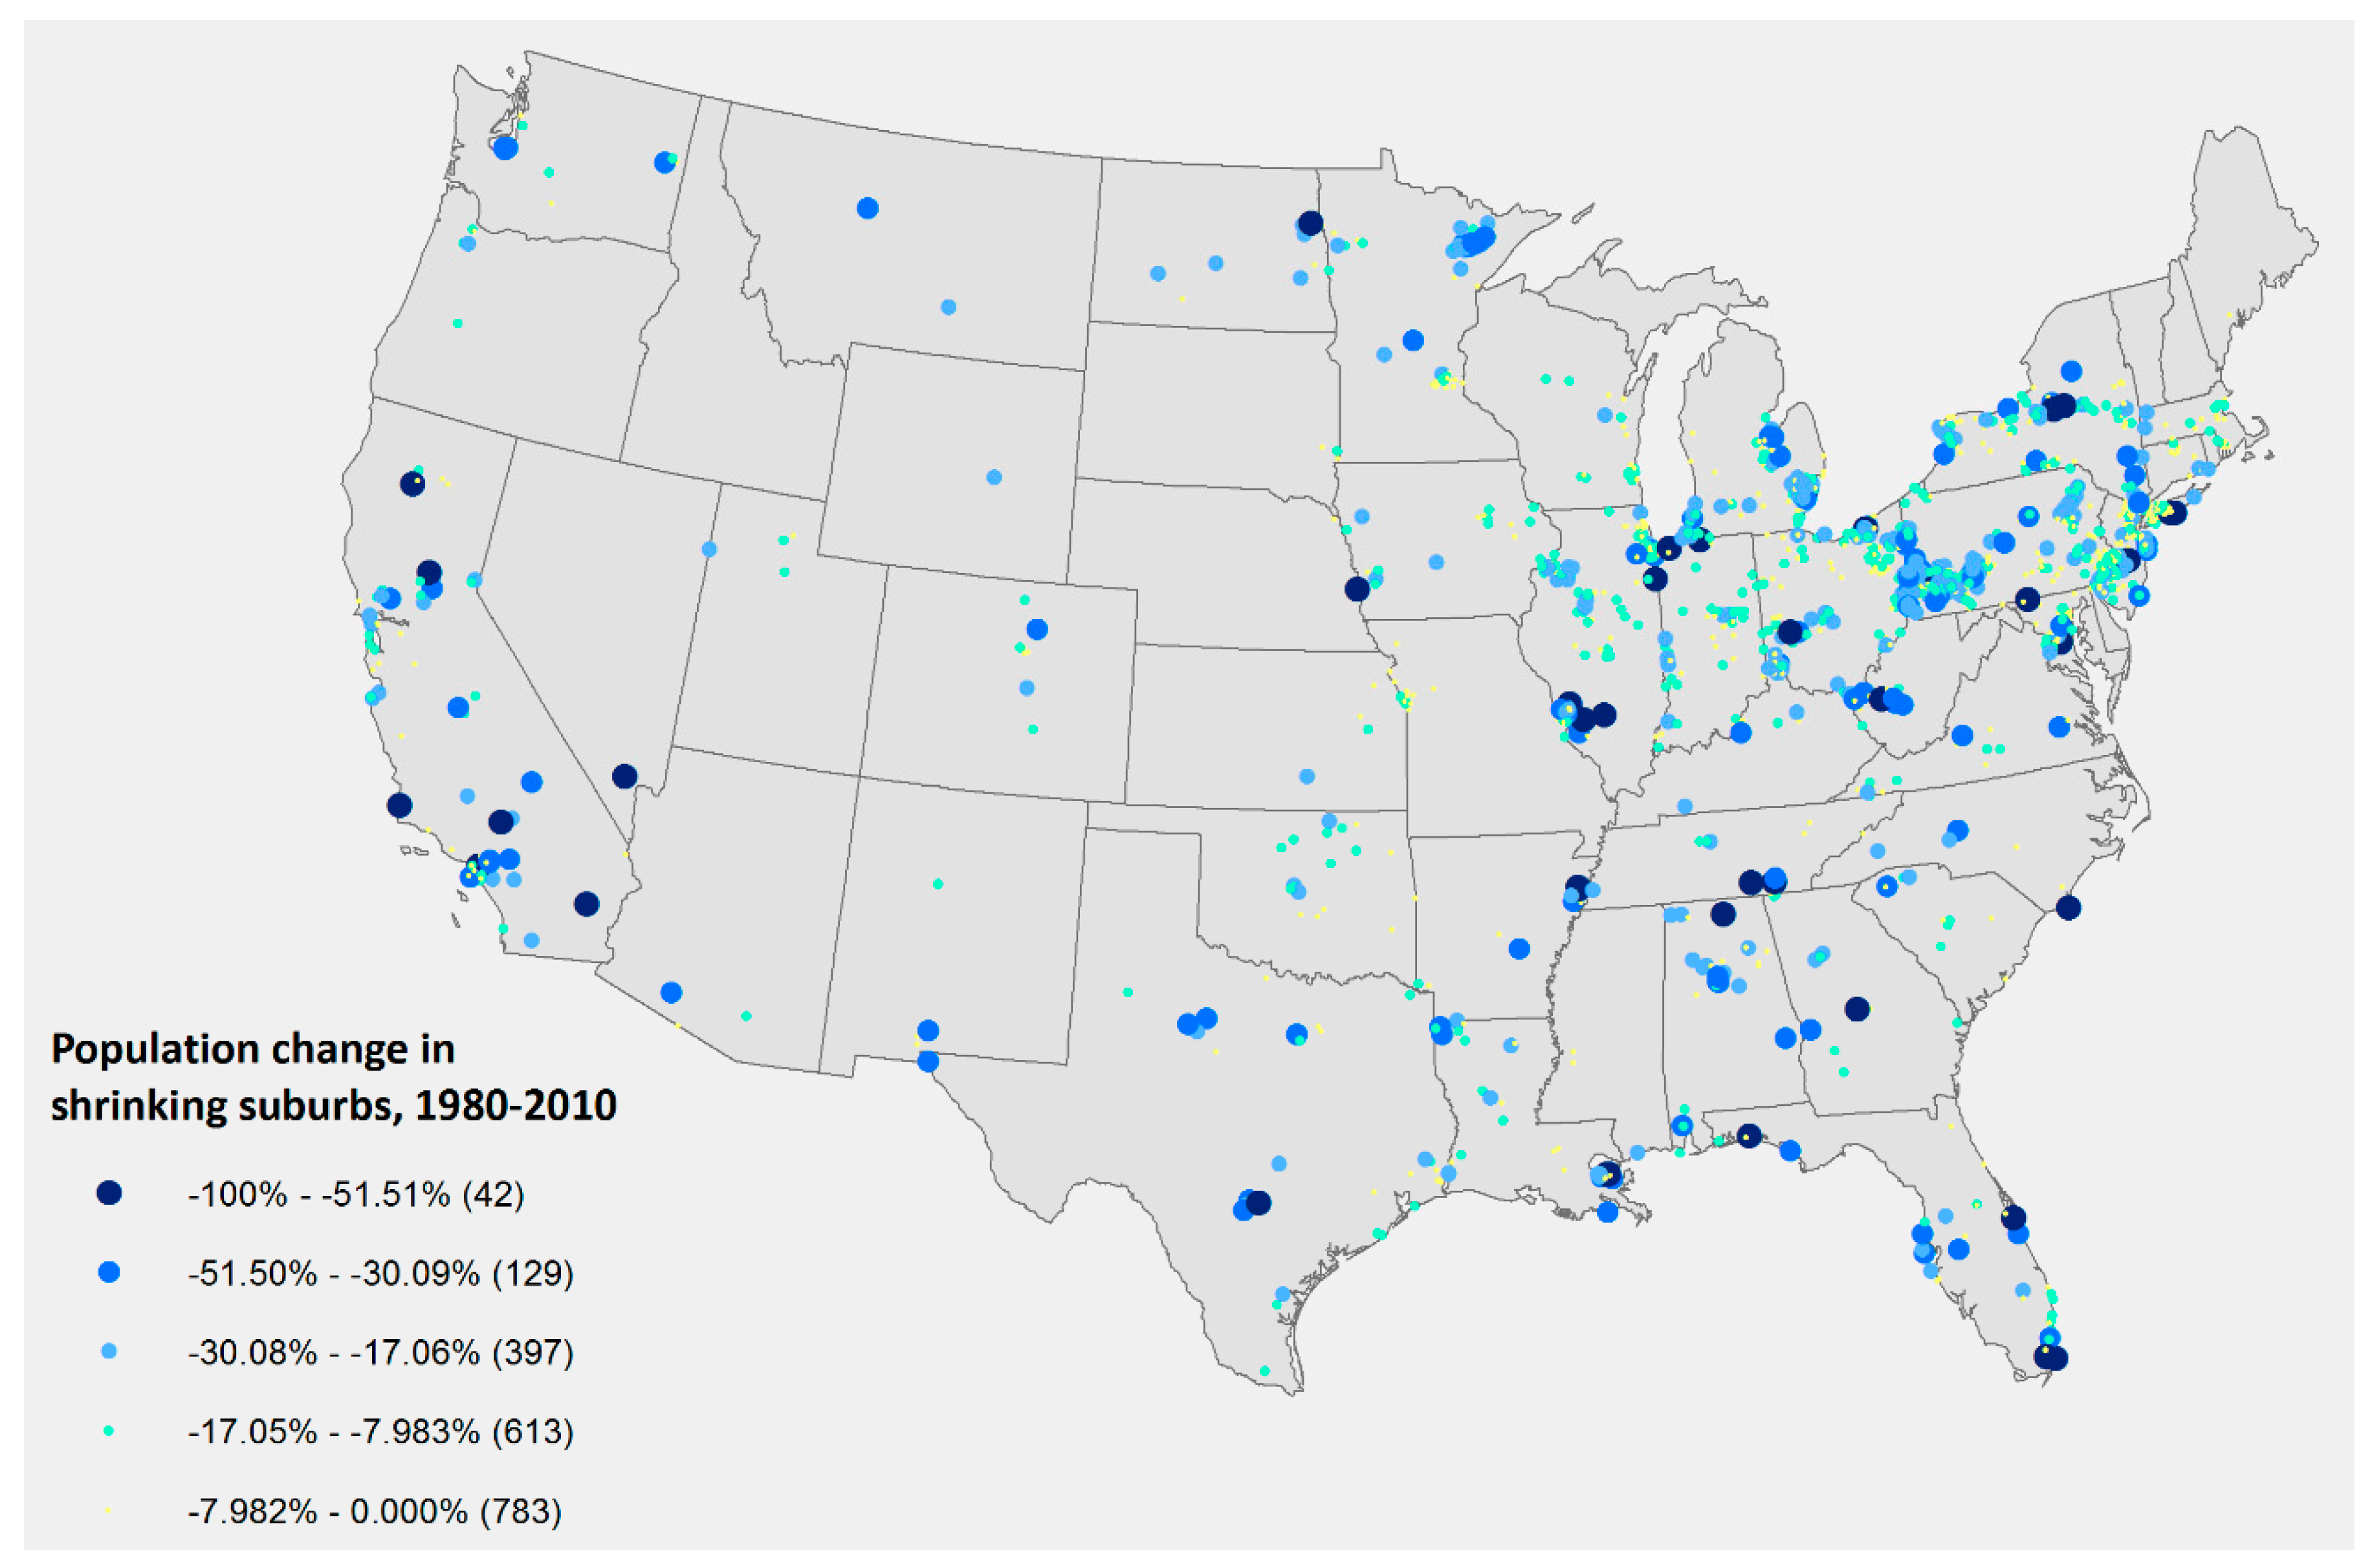
Figure 2 illustrates that the location of shrinking suburbs clustered near the major regional population centers across the United States.
Additionally, shrinking suburbs were located in both growing and shrinking metropolitan areas. In some cases, they exhibited population trends that diverged greatly from their own metropolitan area.
Table 2 displays the distribution of shrinking suburbs by relative growth and decline of their central city and metropolitan area. Of the 1891 shrinking suburbs identified in this study, 65% of them were located in growing metropolitan areas, and 35% were located in shrinking metropolitan areas. Similarly, 67% were located in regions with shrinking central cities, while 33% were located in regions with growing central cities.
In the aggregate, the 648 shrinking suburbs located in shrinking regions with shrinking central cities may very well share the socioeconomic fate of the central cities and metropolitan areas, providing evidence for the argument that the “ties that bind” cities to the suburbs are highly interdependent [
64]. But even then, some shrinking suburbs fared better than their metropolitan areas as a whole. For example, of the declining suburbs with more than 10,000 residents in 2010, Bethel Park, Whitehall, Lower Burrell, Monroeville, Glenshaw, and Greensburg, all lost a smaller share of residents than the Pittsburgh SMSA. Similar patterns were also observed in the suburbs of New Orleans SMSA. Still other declining suburbs that fared relatively better than their central cities, such as Southgate, Livonia, and Birmingham in the Detroit SMSA. These suburbs lost fewer than 8% of their populations from 1980 to 2010 as compared to the 41% loss in the central city of Detroit.
Notably, 1234 shrinking suburbs, or 65% of all shrinking suburbs, were located in growing metropolitan areas. The case of metropolitan Atlanta and Miami provide representative examples of this trend. In the Atlanta SMSA, the suburbs of College Park, Candler-McAfee, and Belvedere Park experienced population declines of at least 20% (28%, 22%, and 20%, respectively) from 1980 to 2010. In contrast, metropolitan Atlanta grew by nearly 230% in the same period. Similarly, in the Miami SMSA, the suburb Gladeview declined by nearly 40%, while the metropolitan area grew by nearly 150%. These divergent experiences demonstrate that regions may still grow despite pockets of decline. Moreover, such divergent experiences indicate that it is inappropriate to ascribe a common metropolitan context to the American “shrinking suburb.”
4.3. Diverse Trajectories of Suburban Growth and Decline
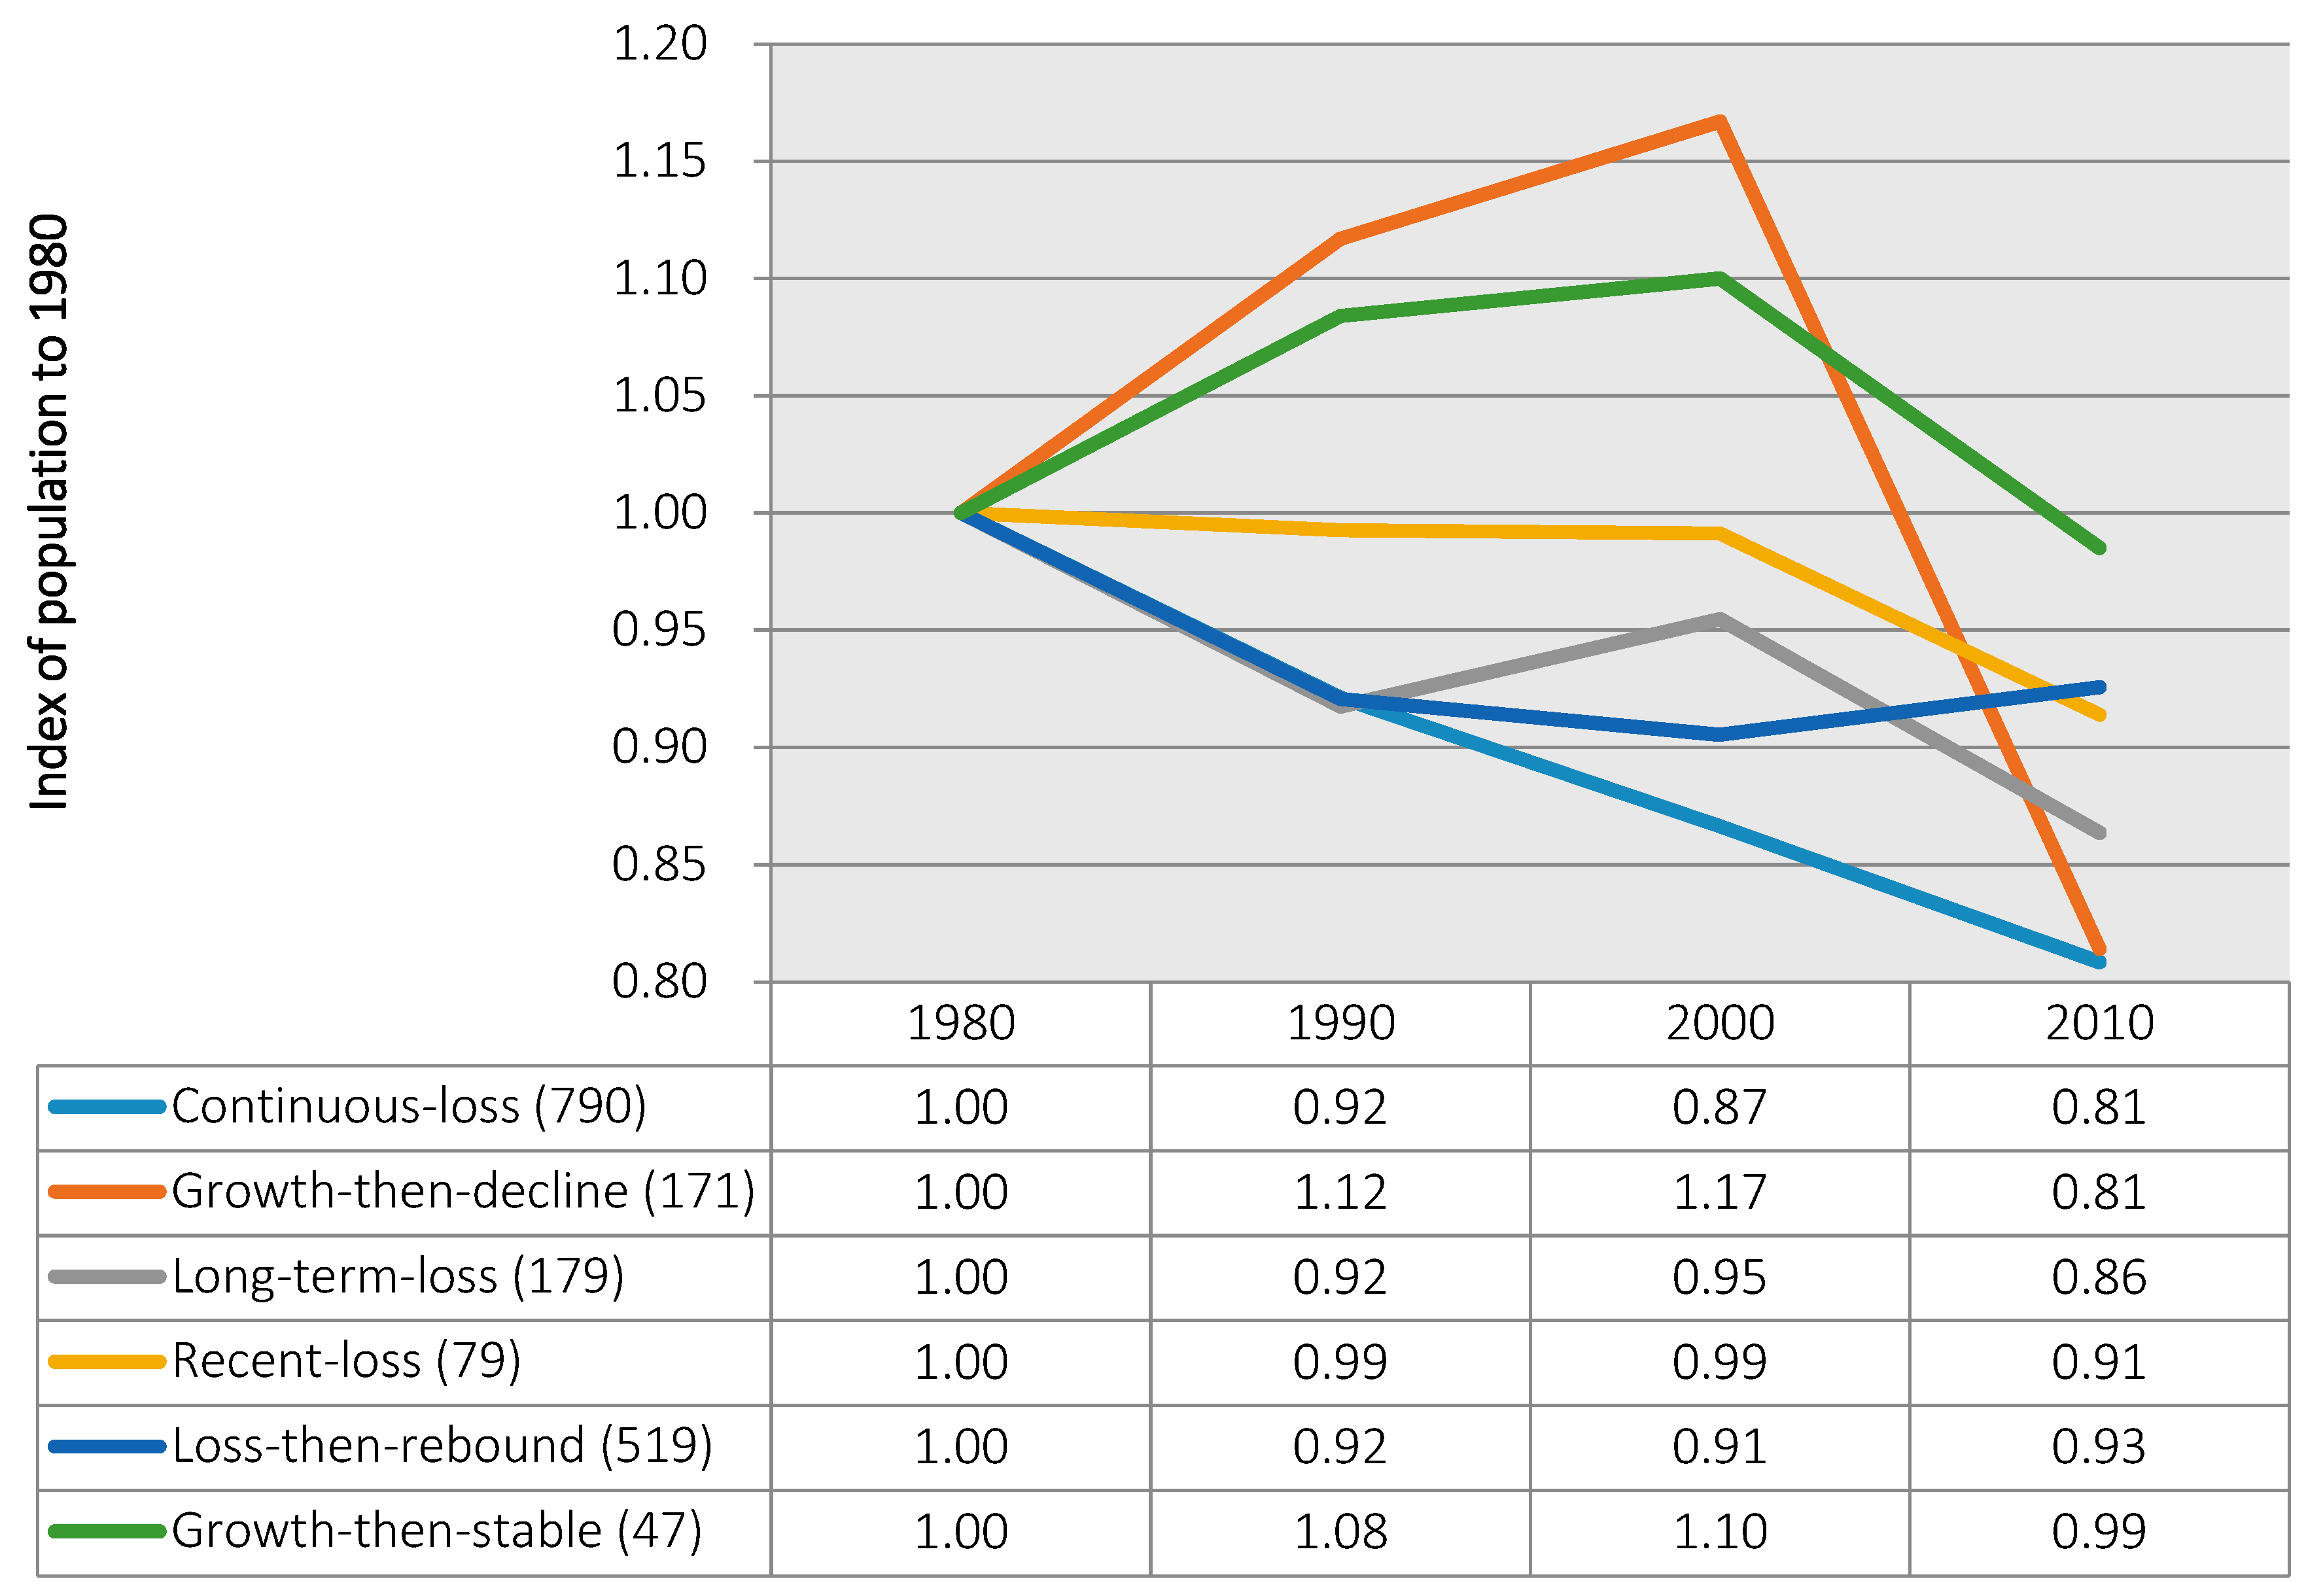
Next, the trajectories of growth and decline for a sample of shrinking suburbs were examined (see
Figure 3). Drawing on previous studies on central cities [
65], the population trends among places were classified using indices of population for 1990, 2000, and 2010 relative to their 1980 values (I
80, I
90, I
00, I
10). Thus, an index value of 0.80 in 2010 (I
10) indicates that the place lost 20% of its 1980 population by 2010. In some cases, it was observed that shrinking suburbs had actually shrunk very little during each decade, or overall, in places such as Ridgefield Park in the New York SMSA (−0.07%) and Brentwood in the St. Louis SMSA (−0.05%). Therefore, suburban areas with growth or decline within three percent (index values between −0.97 and 1.03) were considered to be “stable.” This designation of stability aligns to similar previous studies used by Weyman and Martinez-Fernandez [
36] in their designation of “stabilized shrinkage.”
The examination of these index values revealed seven trajectories of shrinking suburbs from 1980–2010:
Continuous-loss (790 suburbs, 42%): experienced loss in each period (I80 > I90 > I00 > I10);
Loss-then-rebound (519 suburbs, 27%): experienced continuous loss of more than three percentage points from 1980 to 2000 (I80 > I90 > I00) but then some recovery from 2000–2010 (I00 < I10);
Long-term-loss (179 suburbs, 9%): experienced an overall decline from 1980 to 2010 (I80 > I90 > I10) but may have had some growth from 1990 to 2000 (I90 < I00);
Growth-then-decline (171 suburbs, 9%): experienced growth of more than three percentage points from 1980 to 2000 (I80 < I90 < I00) but then decline of more than three percentage points from the 1980 value by 2010 (I00 > I10);
Recent-loss (79 suburbs, 4%): experienced stable population from 1980 to 2000 (I80~I90~I00) but then decline from 2000 to 2010 (I00 > I10);
Growth-then-stable (47 suburbs, 2%): experienced growth of more than three percentage points from 1980 to 2000 (I80 < I90 < I00) but then returned to within three percentage points of 1980 value by 2010 (I80~I10);
Stable (106 suburbs, 6%): experienced overall population decline from 1980–2010 but within three percentage points of the 1980 value each decade (I80~I90~I00~I10).
The findings reported in this study were verified with one-way analysis of variance tests with Scheffe adjustments for unequal variance for continuous variables by trajectory type and chi-square tests for categorical variables by trajectory type; p < 0.05. The preferred statistical test for this dataset is the non-parametric Kruskal–Wallis test, which tests for equality of populations across categorical groups when the independent variable is not assumed to be normally distributed. All non-parametric tests confirmed significant differences in mean ranks across categorical groups. The Kruskal–Wallis test cannot reveal differences among individual categories, thus the ANOVA results are presented.
The presence of these diverse trajectories suggests that the dynamics affecting the populations of shrinking suburbs are complex, both at specific points in time and within specific places.
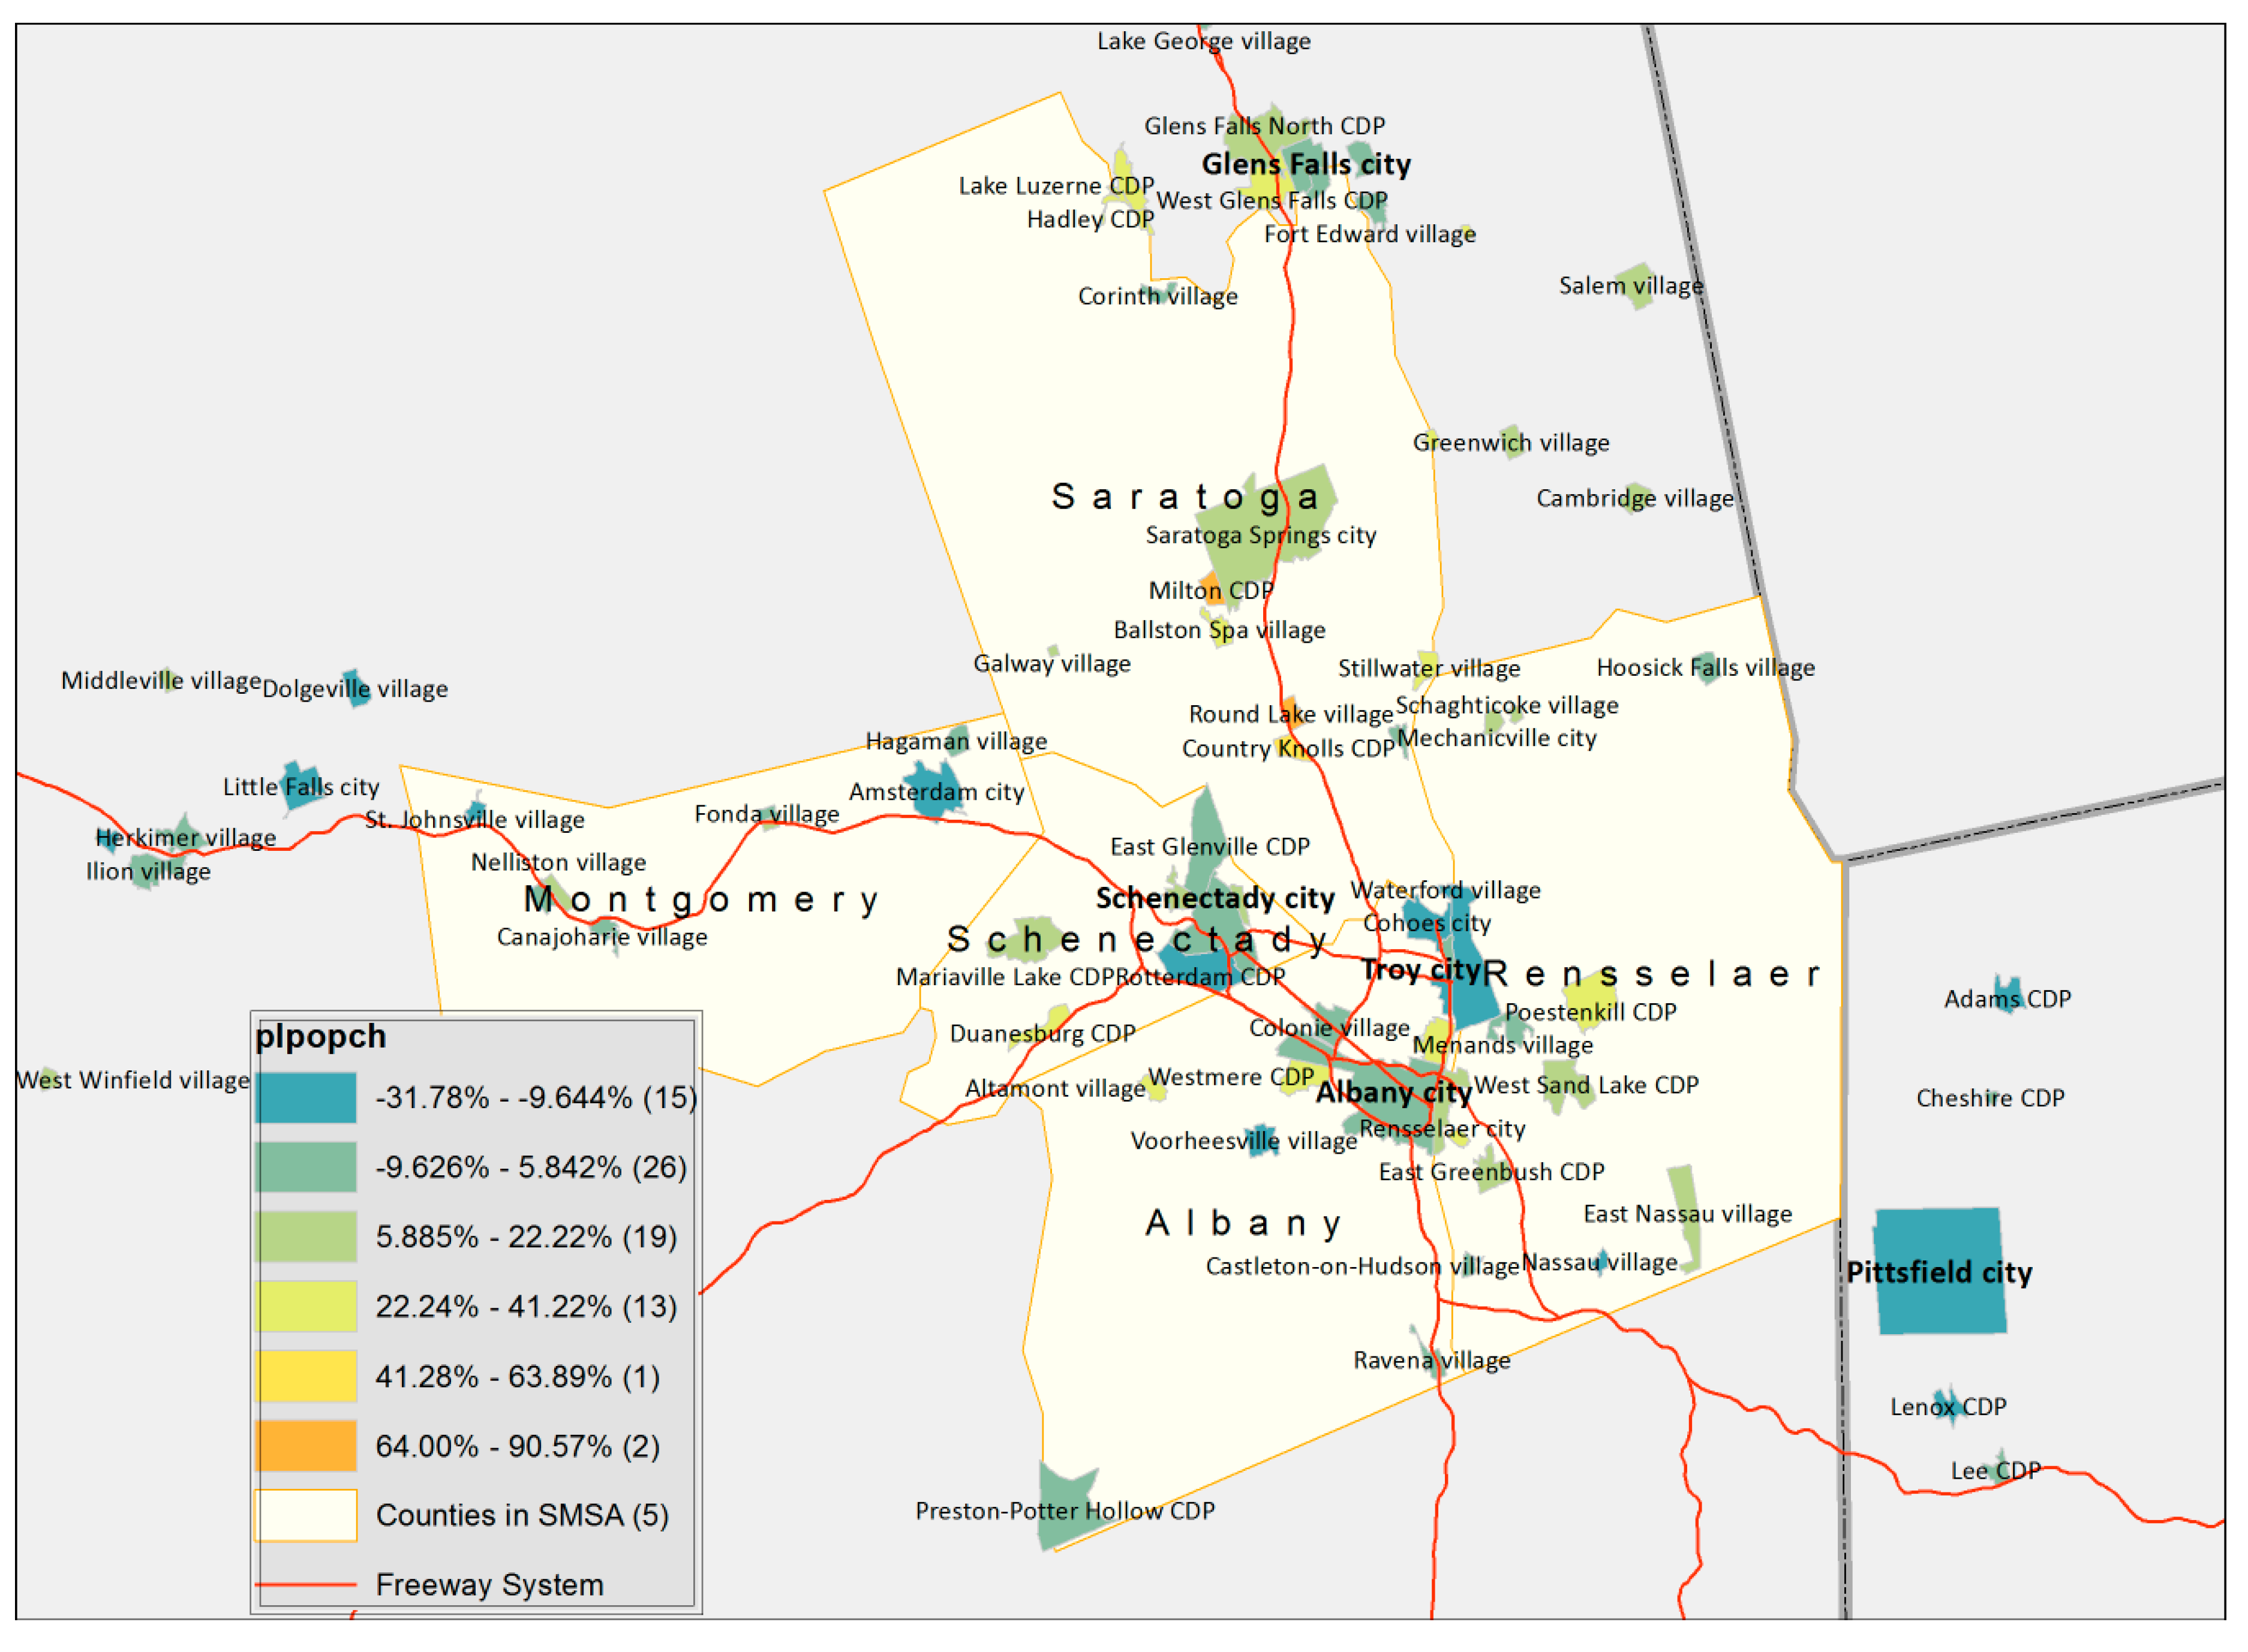
Figure 4 illustrates a map of trajectories in metropolitan Albany, NY as a representative example of the diversity of the uneven nature of population growth and decline. Even though metropolitan Albany grew by 12% overall, its cities and suburbs experienced a diversity of population changes. The central city declined by 6%, and the suburbs grew by 8%. However, 19 of Albany’s 46 suburbs declined since 1980. Albany’s growth and decline trajectories show that the different types of shrinking cities and suburbs vary among jurisdictions within a metropolitan area.
It is clear that the continuous-loss suburbs (Trajectory 1) experienced more severe population decline on average than the other shrinking suburbs, at a nearly 20% population loss. These suburbs also experienced greater levels of poverty than other suburbs, on average, reaching 13% in 2010. Continuous-loss suburbs also experienced economic distress, including high poverty levels and high population decline. The suburbs of Washington Park, IL in metropolitan St. Louis and Highland Park, MI in metropolitan Detroit exemplified these patterns. The continuous-loss suburbs were found in both growing and shrinking regions, although they were more frequently found in declining regions than would be expected. Continuous-loss suburbs were also observed more frequently in the Midwest and less frequently in the West than expected, based on the distribution of all shrinking suburbs.
Appendix A articulates a profile of illustrative socioeconomic characteristics of the shrinking suburbs according to their respective trajectories.
Growth-then-stable suburbs (Trajectory 6) and stable suburbs (Trajectory 7) totaled 153 places, making these places the two least common types of shrinking suburbs. Together, these suburbs experienced the least severe impact of population decline. The stable shrinking suburbs (with less than 3% decline overall) were larger, on average, in total population size than the other types. They experienced the least population decline among all trajectories, on average, declining 1.26%. Similarly, growth-then-stable suburbs declined, on average, 1.50%. Some examples of stable shrinking suburbs include Westland, MI and Port Huron, MI in the Detroit SMSA, Somerville, MA in the Boston SMSA, and West Hollywood, CA in the Los Angeles SMSA.
The growth-then-decline (Trajectory 4) and the growth-then-stable suburbs (Trajectory 6) were less likely to be located in the Northeast and more likely to be located in the South and West than expected, given the overall distribution of shrinking suburbs throughout the country. These results conform to the overall trend of growth occurring throughout the Sunbelt since World War II. The growth-then-decline suburbs also had substantially higher housing vacancy rates by 2010 than the other suburbs, on average, as did the shrinking suburbs located in the South and West compared to shrinking suburbs in the North and Midwest. Some of these areas were impacted by real estate speculation and have since faced serious market adjustments, such as Bal Harbour, FL in the Miami SMSA. In addition, the growth-then-decline suburbs had notably lower housing unit densities in 2010 than the continuous-loss, loss-then-rebound suburbs, and stable suburbs, such as Desert Center and Needles, CA in the Riverside SMSA or Old Forge, NY in the Utica-Rome SMSA. High vacancy rates may foreshadow physical decline [
22,
66].
Shrinking suburbs located in growing metropolitan regions were more likely to have grown or been stable at some point from 1980 to 2010 (Trajectories 4, 6, and 7) than shrinking suburbs in shrinking metropolitan regions. This observation suggests that many suburbs generally conformed to the population trajectories of their metropolitan areas. Nevertheless, the divergence of experiences suggests that trajectories of population change vary dramatically within and among metropolitan areas.
In summary, the results of this study demonstrated three noteworthy findings. First, the population changes in metropolitan America from 1980 to 2010 showed various distinct patterns. Metropolitan areas, and their central cities and suburbs, witnessed significant growth in the aggregate. Nevertheless, among the suburbs, nearly one-quarter of places were identified to be shrinking. Second, shrinking suburbs displayed divergent spatial patterns of population change. Even though the majority of shrinking suburbs were located in the Northeast and Midwest, they were located in all metropolitan areas of the country. Furthermore, the spatial distribution of shrinking suburbs depended, in part but not entirely, on the relative population change of their respective central cities and metropolitan areas. Third, diverse trajectories of population change among shrinking suburbs were evident. With various trajectories of growth and decline of the suburbs, the phenomenon warrants further investigation into the causes and consequences of such patterns.


