Article

Urban Ecological Efficiency and Its Influencing Factors—A Case Study in Henan Province, China

1
School of Finance and Economics, Henan Polytechnic University, Jiaozuo 454000, China
2
School of Emergency Management, Henan Polytechnic University, Jiaozuo 454000, China
3
School of Economics and Management, Southwest Petroleum University, Chengdu 610500, China
4
Chinese Studies Center, Sichuan University, Chengdu 610065, China
*
Author to whom correspondence should be addressed.
Sustainability 2019, 11(18), 5048; https://doi.org/10.3390/su11185048
Submission received: 19 July 2019 / Revised: 2 September 2019 / Accepted: 11 September 2019 / Published: 16 September 2019
(This article belongs to the Collection Sustainable Smart Cities and Villages)

Abstract

:
The urban ecological civilization construction relates to welfare of the people and the national future. It is an important field of the high-quality economic development to improve the urban ecological efficiency level. The purpose of this research is to provide a new perspective and method for the quantitative study of the urban sustainable development, and also to provide some decision-making references for the improvement of the urban ecological efficiency in Henan province. This paper uses the slacks-based measure-data envelopment analysis (SBM-DEA) model containing the undesirable output and the Malmquist index model to fully evaluate the urban ecological efficiency level in Henan province during the period of 2005–2016, via both the static and dynamic analysis. Based on this, the bootstrap regression model is applied in analyzing the influencing factors of the urban ecological efficiency. The research shows three findings. First, according to the static efficiency analysis, the urban ecological efficiency in Henan province is low as a whole and has a big promotion space. Moreover, there is a significant difference in the urban ecological efficiency level among the five regions because of the different geographical locations and social and economic development situations of the cities. Second, according to the dynamic efficiency analysis, in the last 12 years, the urban ecological efficiency in Henan province has shown an overall growth trend, and the technological progress has played a major role in promoting the urban ecological efficiency in Henan province. Third, according to the influencing factor analysis, the governmental financial support hinders the improvement of the urban ecological efficiency in Henan province, while the level of opening to the outside world, the urban population density, and the urban greening level promote it.

1. Introduction

China’s economy has been maintaining a long period of high-speed development since the reform and opening up in 1978. However, the economic development mode of high energy consumption, high pollution, and high emission still exists under the influence of many factors, such as ideology, the technical level and the management system. According to the expectation of the high-speed economic development, the resource and environment pressure in China will inevitably further increase under the present development mode. This will lead to a great challenge of how China’s economy will coordinate the economic development speed and the ecological environment quality in the future. Especially, the haze weather has frequently appeared in many cities of China in recent years, and the ecological civilization index of China ranks the bottom third in the world [1]. This reality has even sounded an alarm bell to the urban ecological environment control. The improvement of urban ecological efficiency in China is facing an extraordinary important task. Therefore, the 18th national congress of the Communist Party of China, for the first time, fully integrated the idea of the ecological civilization into the economic and social development and made it a national strategy. The 19th national congress of the Communist Party of China continued emphasizing the importance of the ecological civilization construction and put forward the idea that clear water and green mountains are as good as mountains of gold and silver, as well as the development goal of building a beautiful China.
Henan province is located in the central plains. Its geographical position is superior, and its natural resources are rich. It has the innate conditions of constructing a good ecological environment. But, in the last 30 years, the extensive development mode, whose price is consuming a great quantity of energy and resources, has brought a series of problems to Henan province, such as the environmental pollution and the uncoordinated regional development. The low urban ecological efficiency has become the short-board and bottleneck of the ecological civilization construction in Henan province. So, it is of great significance to solve the difficult problems between the economic development and the resource and environment constraints in Henan province, to improve the ecological efficiency, and to realize the symbiotic development of economy and environment.
The core of the ecological efficiency is to realize the maximum economic and social benefits with the least consumption of resources and environments, so as to improve the quality of human life and finally realize the sustainable economic development. German scholars Schaltegger and Sturm first put forward the concept of “ecological efficiency” in 1990 [2]. This concept was further expanded and popularized by the world business council for sustainable development (WBCSD) [3] and the organization for economic co-operation and development (OECD) [4]. The effective ecological efficiency evaluation is helpful to reveal the regional ecological situation and input–output level so as to provide the theoretical basis for the ecological environment control. With regard to the research on measuring the ecological efficiency, the academic circle has done a lot of productive work. Most of the early studies on the ecological efficiency focused on the microcosmic enterprise [5] and industrial [6] level. However, Hur et al. [7] and Seppäläa et al. [8] believed that the introduction of the ecological efficiency into the evaluation of the regional and urban development was also of great significance and value for its future development. In recent years, with the deterioration of the urban ecological environment, the research on the urban ecological efficiency has become the attention focus of scholars all over the world. Their research covers a variety of different levels of research objects and uses a lot of useful measurement methods. As far as the research objects are concerned, the current evaluation of the urban ecological efficiency involves many levels, including the international level, the nation level, the urban agglomeration level, as well as the province and city level. Wursthorn et al. tried to establish an urban ecological efficiency evaluation system suitable for the whole of Europe [9]. Taking the ecological cities, Kitakyushu and Tianjin, as an example, Lin et al. made a comparative study on the urban ecological efficiency level in Japan and China [10]. Zheng et al. measured the ecological efficiency of China Mainland from 2000 to 2015 and characterized and predicted its spatial distribution pattern [11]. Ren et al. compared and evaluated the economic efficiency and ecological efficiency of the four major urban agglomerations in the eastern coastal areas and analyzed the temporal and spatial evolution characteristics of the ecological efficiency of urban agglomerations [12]. Yang et al. constructed an urban ecological efficiency evaluation system based on the factor analysis method, used the super efficiency data envelopment analysis (SE-DEA) model to evaluate the ecological efficiency of 21 cities in Guangdong province from 2005 to 2014, and chose the fixed effect model to explore those factors affecting the urban ecological efficiency [13].
As far as the research methods are concerned, several methods, such as the comprehensive evaluation and the data envelopment analysis (DEA), are mainly used to measure the urban ecological efficiency. The comprehensive evaluation method has the following advantages: it is simple and easy to use; the factors considered in the bid evaluation are more all-round; it can quantify and compare those elements which are difficult to be quantified; and so on. Because of its above advantages, the comprehensive evaluation method has attracted the attention of a vast number of scholars. Giordano et al. used the fuzzy comprehensive evaluation method to measure the efficiency of the urban ecological subsystem, and finally, progressively added each subsystem to get the ecological efficiency of the whole urban system [14]. For the calculation of the multi-index input and multi-index output efficiency of different types of decision-making units, the DEA model has currently become a more widely used relative efficiency calculation model by the academic circle because it has advantages such as ensuring the integrity of the original information to the greatest extent, not needing to make the functional assumptions for variables in the comprehensive evaluation of the decision-making units with the common characteristics, and so on. Fu et al. used the super efficiency data envelopment analysis (SE-DEA) method to measure the ecological efficiency of each city from 2005 to 2010 [15]. Han et al. utilized the SBM-DEA model based on the undesirable output to calculate the ecological efficiency of 44 cities around the Bohai Sea areas from 2005 to 2015 and used the panel threshold regression model to analyze its influencing factors [16]. Hou et al. used the super-efficiency SBM-DEA model to measure and calculate the urban ecological efficiency in China; on the basis of the temporal comparative analysis and the spatial correlation analysis, they compared and analyzed the temporal and spatial evolution pattern of the urban ecological efficiency, and discussed the temporal and spatial dynamic evolution characteristics of the urban ecological efficiency [17]. Ma et al. calculated the urban ecological efficiency of 30 regions in China, used the Malmquist index model to study the dynamic change trend of the urban ecological efficiency, and applied the Tobit regression method and the principal component analysis method to analyze the main factors affecting the urban ecological efficiency [18]. Lo Storto combined the entropy evaluation method with the game cross-efficiency model of the data envelopment analysis (DEA) to measure the urban ecological efficiency of 116 Italian provincial capitals in 2011 [19].
Above all, the research findings of the domestic and foreign scholars on the measurement and influencing factors of the urban ecological efficiency are fruitful. This provides a theoretical reference for the study of this paper. However, the present research findings also have the following shortcomings. First, in the aspect of the research method, the traditional DEA model is mostly used. It is not in accordance with the actual production process and also violates the energy conservation law to measure pollutants directly as an input factor. Second, in the aspect of the research object, most of the current urban ecological efficiency measurements are concentrated in countries and the urban agglomeration, neglect the heterogeneity of the regional development, and seldom focus on each prefecture-level city in the same province, so as to make the calculation results biased. Moreover, the dynamic change characteristics and the external influencing factors of the urban ecological efficiency are less explored. The Tobit regression model was used in some literature, studying the influencing factors, but this model has been proved to be prone to the biased results. Accordingly, this paper brings the pollutants in the production process into the evaluation index system such as the undesirable output, uses the SBM-DEA model containing the undesirable output and the Malmquist index model to measure the urban ecological efficiency of 18 prefecture-level cities in Henan province from the dynamic and static aspects, and utilizes the bootstrap regression model that can ensure the unbiased results to find out the key influencing factors, so as to provide a certain theoretical support for the improvement of the urban ecological efficiency in Henan province in the future.

2. Evaluation Framework of Urban Ecological Efficiency in Henan Province

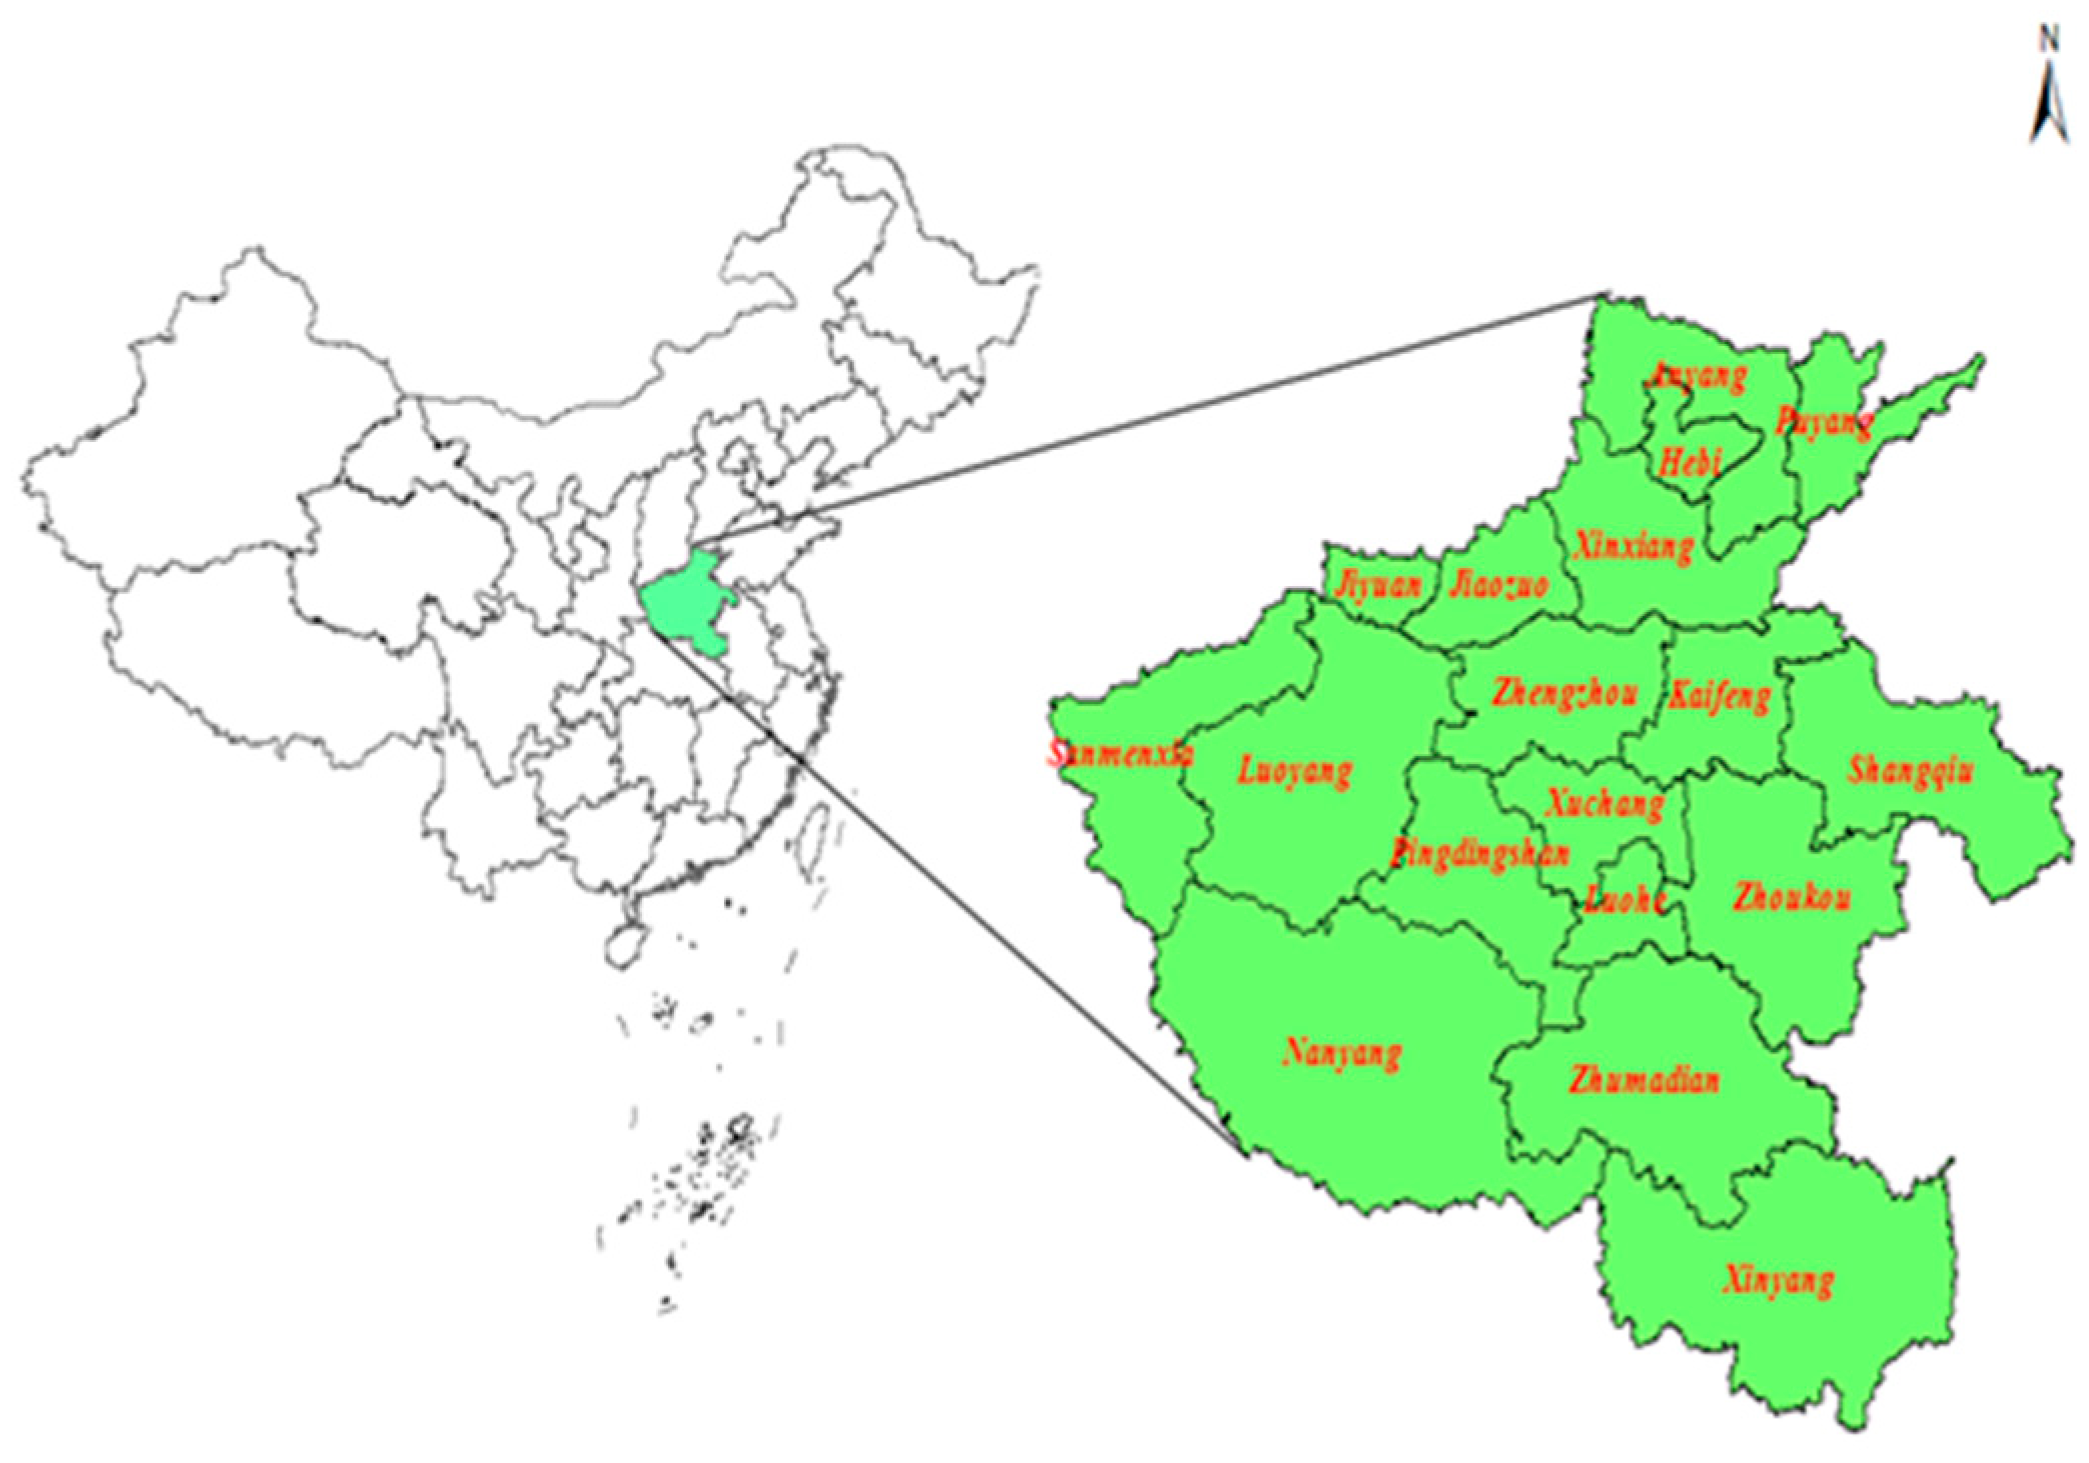
2.1. Regional Overview
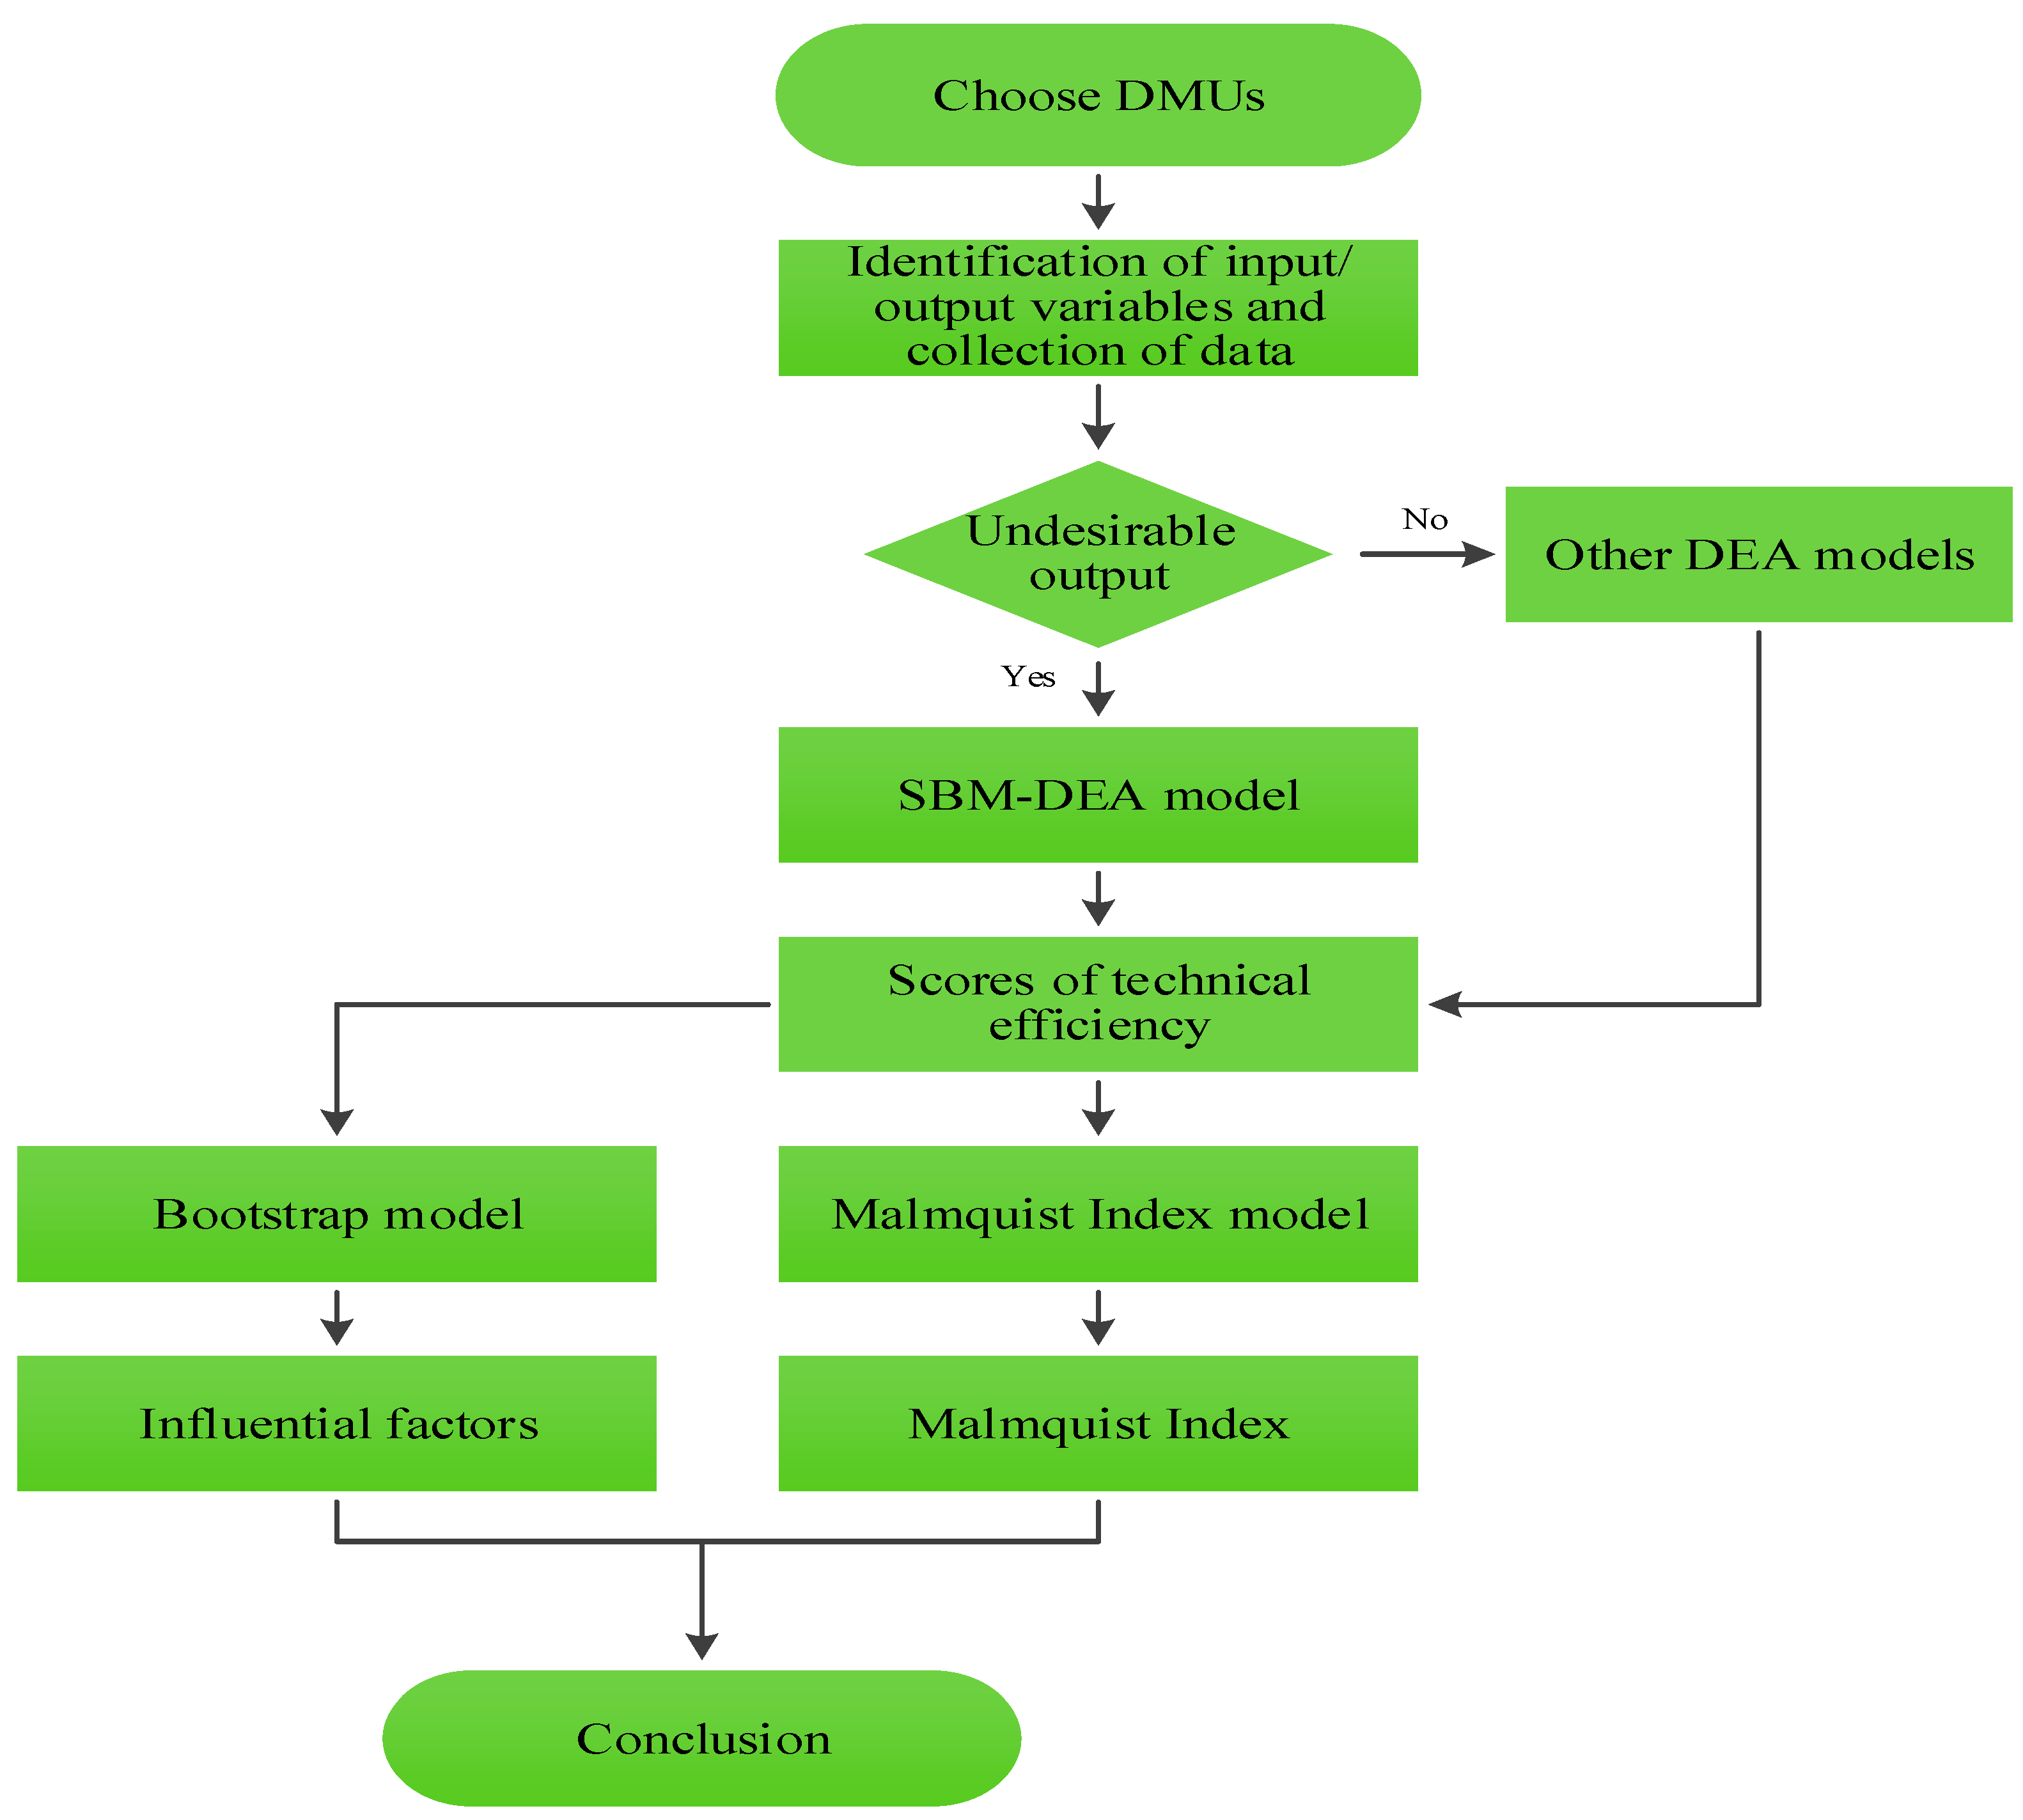
This paper takes Henan province as the research region (110°21′–116°39′ E, 31°23′–36°22′ N). It is located in central China and covers 18 prefecture-level cities (Figure 1). It connects Anhui province and Shandong province to the east, Hebei province and Shanxi province to the north, Shanxi province to the west, and Hubei province to the south. It looks north to south and inherits the trend of east and west. It covers an area of 167,000 square kilometers that account for 1.73% of the total national land area. It has a permanent resident population of 95.59 million and a permanent resident population urbanization rate of 50.16% which is lower than the national average level. In 2017, the regional gross domestic product (GDP) was 4.498816 trillion yuan, the per capita gross domestic product (GDP) was 47,130 yuan, ranking fifth and eighteenth, respectively. However, the resource and energy consumption is huge, and the environmental pollution problem is serious. The total electricity consumption accounts for more than 5% of the country, ranking sixth; the proportion of water resource consumption is about 3.87%, ranking 11th; and the air quality ranks the last one in the country [20]. The coexistence of the high-input, low-output, and high-pollution phenomena is an important feature of the regional development in Henan province.

2.2. Model Method

The methodology used in this paper is as following. First, select and determine the decision-making unit. The decision-making unit of this research is 18 prefecture-level cities in Henan province. Second, collect the relevant researches on the urban ecological efficiency, and combine them with the actual situation of the urban ecological efficiency development in Henan province so as to determine the input and output indexes of the urban ecological construction. By determining whether the output index has the undesirable output, the DEA method suitable for dealing with the urban ecological efficiency is selected. Because this research contains the undesirable output, the SBM-DEA model, which is most suitable for dealing with the undesirable output, was selected to obtain the static results of the urban ecological efficiency in Henan province. Third, use the Malmquist index model to measure the dynamic change process of the urban ecological efficiency in Henan province. Last, taking the measured urban ecological efficiency in Henan province as the dependent variable, the main influencing factors of the urban ecological efficiency in Henan province are found out by using the bootstrap regression model. Combined with the static and dynamic efficiency results above, this paper puts forward some policy suggestions to improve the urban ecological efficiency level in Henan province accordingly. The specific implementation framework of the methodology of this research is shown in Figure 2.

2.2.1. SBM-DEA Model Containing Undesirable Output

The production efficiency refers to the degree to which the average technical level of the industry is reached in the production process of a production unit. The production efficiency can be measured from the perspective of both input and output. In the case of the fixed input, the production efficiency is measured by the degree to which output is maximized; in the case of the fixed output, the production efficiency is measured by the degree to which input is minimized (Farrell, 1957) [21]. The production efficiency is initially measured quantitatively by the ratio of output to input, but this efficiency solution method is only suitable for the case of single input and single output. This method is no longer applicable if the production process involves more than one input or output. In order to solve the problem, Charnes, Cooper, and Rhodes of the U.S.A put forward the data envelopment analysis (DEA) method in 1978, that is, a nonparametric statistical method to evaluate whether some decision-making units with the same type of multiple inputs and multiple outputs are relatively effective [22]. Because the DEA method has characteristics such as the wide application range and the relatively simple principle, it has gradually become the mainstream method of the efficiency measurement. The traditional DEA model sets the output index as the desirable “good output”. However, in the process of the urban development, in addition to the products people need (the desirable output), some by-products that people do not need, for example the undesirable output, such as pollution and garbage, will also be produced. How to reasonably evaluate the urban ecological efficiency problem in the presence of the undesirable output has become a difficult point in DEA analysis. In order to solve the undesirable output problem, the academic circle has explored a variety of processing methods, including the positive attribute conversion method, the input–output transposition method and the directional distance function method. But these methods do not consider the slack problem of input–output variables. For this reason, Tone put forward the SBM model processing method. Based on the SBM model considering the slack problem of input–output variables, he established an SBM model to deal with the undesirable output in 2001 [23]. With the help of Tone’s model method, we established a SBM-DEA model containing the undesirable output to measure the urban ecological efficiency in Henan province.
The basic principle is as following: assume that the urban ecological efficiency evaluation system has n decision-making units (DMU), and each decision-making unit includes three input–output vectors, that is, the input vector, the desirable output vector, and the undesirable output vector, which are expressed respectively as: x R K , y g = R I , y d = R J . Define three matrices: X , Y d , Y u , and their equation is X = ( x i , j ) R K × n , Y d = ( y i , j ) R I × n , Y u = ( y i , j ) R J × n respectively. Thereinto, X > 0 , Y d > 0 , Y u > 0 . The production possibilities set P is defined as
P = { x , y d , y u | x X λ , y d Y λ , y u Y λ , λ > 0 }
According to the SBM model processing method proposed by Tone, the SBM model with the undesirable output can be written as:
ρ = 1 - 1 K κ = 1 K s k _ x k 0 1 + 1 I + J ( i = 1 I s i d y i 0 d + i = 1 J s i u y i 0 u ) s . t . { x k 0 = m = 1 M λ m x k m + s k , k = 1 , 2 , , K y i 0 d = m = 1 M λ m y i m d s i d , i = 1 , 2 , , I y i 0 u = m = 1 M λ m y i m u + s i u , i = 1 , 2 , , J 1 = m = 1 M λ m λ m 0 , s k 0 , s i d 0 , s i u 0
In the Equation (2), p * is the urban ecological efficiency value to be measured in Henan province, and its value range is 0–1; K, I, and J represent the variable number of input, the desirable output, and the undesirable output, respectively; s k , s i d , s i u represents the slack variable of input, the desirable output, and the undesirable output, respectively; x k 0 , y i 0 d , y i 0 u represents the quantity of input, the desirable output, and the undesirable output, respectively; λ m is the weight coefficient. When p * = 1, it shows that DMU is fully valid, and at this moment s i u , s i d , s i u are all zero; when p * > 1, it shows that DMU has a loss of efficiency, and it is necessary to improve the ecological efficiency by optimizing x k 0 , y i 0 d , y i 0 u . If i = 1 J s i u y i 0 u = 0, the above equation then becomes an SBM model that does not consider the undesirable output.

2.2.2. Malmquist Index Model

The Malmquist index model was first proposed by Swedish economist and statistician Malmquist S. in 1953 [24]. In 1992, Färe et al. combined it with the data envelopment analysis (DEA) method, which makes the Malmquist index model widely used [25]. The principle of the Malmquist index model is as following:
M I ( x t + 1 , y t + 1 ; x t , y t ) = D 0 t + 1 ( x t + 1 , y t + 1 ) D 0 t ( x t , y t ) [ D 0 t ( x t + 1 , y t + 1 ) D 0 t + 1 ( x t + 1 , y t + 1 ) D 0 t ( x t , y t ) D 0 t + 1 ( x t , y t ) ] 1 / 2
In the Equation (3), x t and x t + 1 represents the input vector during t and t + 1 period, respectively; y t and y t + 1 represents the output vector during t and t + 1 period, respectively; D 0 t ( x t , y t ) is the technical efficiency level of t period expressed in the technology of t period; D 0 t + 1 ( x t , y t ) is the technical efficiency level of t + 1 period expressed in the technology of t period; D 0 t ( x t + 1 , y t + 1 ) is the technical efficiency level of t period expressed in the technology of t + 1 period; D 0 t + 1 ( x t + 1 , y t + 1 ) is the technical efficiency level of t + 1 period expressed in the technology of t + 1 period.
The Malmquist index (MI) can be decomposed into the technical efficiency change (TEC) index and the technological progress (TP) index, and the equation is as following:
M I ( x t + 1 , y t + 1 ; x t , y t ) = [ D 0 t ( x t + 1 , y t + 1 ) D 0 t ( x t , y t ) D 0 t + 1 ( x t + 1 , y t + 1 ) D 0 t + 1 ( x t , y t ) ] 1 / 2 = D 0 t + 1 ( x t + 1 , y t + 1 ) D 0 t ( x t , y t ) [ D 0 t ( x t + 1 , y t + 1 ) D 0 t + 1 ( x t + 1 , y t + 1 ) D 0 t ( x t , y t ) D 0 t + 1 ( x t , y t ) ] 1 / 2 = T E C ( x t + 1 , y t + 1 ; x t , y t ) T P ( x t + 1 , y t + 1 ; x t , y t )
when MI > 1, it shows that the efficiency from t period to t + 1 period has been increased; conversely, when MI < 1, it shows that the efficiency from t period to t + 1 period has reduced. When TEC > 1, it shows that the technical efficiency from t period to t + 1 period has been increased; conversely, when TEC < 1, it shows that the technical efficiency from t period to t + 1 period has reduced. When TP > 1, it shows that technology has advanced from t period to t + 1 period; conversely, when TP < 1, it shows that technology has lagged behind from t period to t + 1 period.

2.2.3. Bootstrap Regression Model

The value range of the urban ecological efficiency is 0–1, and it belongs to the truncated data. If the least square method is directly used for the regression analysis, the results will be biased and inconsistent. Simar and Wilson proved that the classic Tobit regression model for processing the truncated data is not suitable for testing the decisive factors of efficiency, and accordingly proposed the bootstrap regression model, which can minimize the uncertainty of data and the statistical noise to overcome this limitation [26].
So, this paper uses the bootstrap regression model to estimate the parameters of the influencing factors of the urban ecological efficiency. After using the SBM-DEA model to measure and calculate the urban ecological efficiency of 18 prefecture-level cities in Henan province, this paper establishes the DEA-bootstrap two-step method to further explore the external influencing factors of the urban ecological efficiency. The specific method is to establish a regression model by using the urban ecological efficiency value calculated through DEA as the dependent variable and using each influencing factor as the independent variables.
The basic expression of the bootstrap regression model is:
θ i = z i β + ε i
In the Equation (5), θ i is the explained variable, β is the regression parameter, z i is the explanatory variable, ε i obeys the normal distribution of N ( 0 , δ 2 ) , i = 1, 2,..., n.

2.3. Construction of Index System and Data Sources

2.3.1. Evaluation Index Selection

The urban ecological efficiency reflects the coordinated and win–win relationship among the resource saving, the environmental protection, and the economic growth. Therefore, while selecting the input index, besides the labor force, capital, and land, this paper considers the energy consumption quantity as an important input factor in order to comprehensively investigate the resource cost and the environmental costs of the regional economic development. Meanwhile, it uses the regional gross domestic product as the desirable output, and uses the discharge quantity of three industrial wastes as the undesirable output, so as to construct the index system of the urban ecological efficiency in Henan province (Table 1).
The input index selects the regional year-end number of employed persons in the employment units of cities and towns as the labor force input [15]; the capital input is expressed by the fixed asset investment of the whole society [12]; the land resource and energy input are measured by the area of the urban build-up districts and the regional electricity consumption, respectively [27].
The output index selects the regional gross domestic product, which is widely used and representative, to reflect the value of products or services provided by the economic entity. The environmental pollution, as the undesirable output of the economic activity process, reduces the actual economic value [28], so it is more reasonable to include it in the output index than in the input index. The industrial waste water discharge quantity, the industrial sulfur dioxide discharge quantity, and the industrial smoke (powder) dust discharge quantity were selected to measure the undesirable output [29]. The descriptive statistics on the input and output indexes are shown in Table 2.

2.3.2. Research Object and Data Sources

The research object of this paper is 18 prefecture-level cities in Henan province, including Kaifeng, Shangqiu, and Zhoukou in Eastern Henan; Luoyang and Sanmenxia in Western Henan; Nanyang, Zhumadian, and Xinyang in Southern Henan; Anyang, Xinxiang, Jiaozuo, Puyang, Hebi, and Jiyuan in Northern Henan; Zhengzhou, Pingdingshan, Xuchang, and Luohe in Central Henan. The data in this paper mainly comes from the statistical yearbook of Henan province (2006–2017) [30], the urban statistical yearbook of China (2006–2017) [31] and the statistical yearbook of urban construction in China (2006–2017) [32], and the supplement of the pollutant data is supplied by the environmental statistics communique of Henan province. Finally, the panel data of 18 prefecture-level cities in Henan province from 2005 to 2016 was obtained by collating and summarizing the data for the urban ecological efficiency analysis.

3. Measurement and Evaluation of Urban Ecological Efficiency in Henan Province

This paper applies MaxDEA Ultra7 software, from the perspective of the output orientation (adjustment), and uses the SBM-DEA model containing the undesirable output to measure the urban ecological efficiency of 18 prefecture-level cities in Henan province from 2005 to 2016 and calculates the Malmquist index. The results are shown in Figure 3. Thereinto, the comprehensive technical efficiency can be decomposed into two parts, that is, the pure technical efficiency and the scale efficiency. Furthermore, the three have the following relationship: comprehensive technical efficiency = pure technical efficiency × scale efficiency.

3.1. Analysis on Evolution of Temporal and Spatial Pattern of Urban Ecological Efficiency in Henan Province

3.1.1. Analysis on Temporal Evolution of Urban Ecological Efficiency in Henan Province

First, the comprehensive technical efficiency is low in the mass, but shows a fluctuating growth trend. According to the average value of the urban ecological efficiency of Henan province from 2005 to 2016 (Figure 3), it was shown that the overall average value of the urban ecological efficiency in Henan province from 2005 to 2016 was a low level of 0.768, but presented a fluctuating growth trend in the mass. There were two declines during the period. The first significant decline was because the 2008 financial crisis had a great impact on the economic development level and made the urban ecological efficiency show a downward trend, which was reflected in the decrease in the average value of the urban ecological efficiency from 0.783 in 2007 to 0.709 in 2009. The second decline was because the rapid economic development increased the pressure on the urban environment, which was reflected in the decline in the urban ecological efficiency value from 0.829 in 2011 to 0.776 in 2013. The average value of the urban ecological efficiency in Henan province began to rise steadily from 2013 to 2016 and reached 0.847 in 2016. This shows that in recent years, with the economic development and the progress of science and technology, all kinds of pollution treatment equipment have been put into the environmental control; meanwhile, with the continuous deepening of national emphasis on the ecological civilization, the Henan provincial government has actively responded to the national call and issued a series of pollution control policies whose effect is obvious.
Second, the changes of the pure technical efficiency and the comprehensive technical efficiency are basically synchronous but are lower than the scale efficiency as a whole. The annual average value of the scale efficiency of the urban ecological efficiency in Henan province from 2005 to 2016 was 0.888, while that of the pure technical efficiency was 0.878. But after 2013, the gap between the two had begun to narrow, and the pure technical efficiency even exceeded the scale efficiency to a higher level of 0.932 in 2015. However, at present, the lower pure technical efficiency is the main reason for the lower comprehensive technical efficiency of the urban ecology. Elevating the pure technical efficiency level is still an important breakthrough to improve the urban ecological level in Henan province.

3.1.2. Spatial Pattern Distribution of Urban Ecological Efficiency in Henan Province

According to the common geographical orientation, Henan province is divided into five regions: Eastern Henan, Western Henan, Southern Henan, Northern Henan, and Central Henan. In Figure 4, to judge from the comprehensive technical efficiency value of the urban ecological efficiency, the urban ecological efficiency of the five regions shows the following distribution characteristics:
First, there is a significant difference in the urban ecological efficiency level among the five regions. From 2005 to 2016, the urban ecological efficiency value in the five regions of Henan province was, respectively, 0.875 in Eastern Henan, 0.911 in Western Henan, 0.840 in Southern Henan, 0.562 in Northern Henan, and 0.870 in Central Henan. Thereinto, the difference between Western Henan, with the highest urban ecological efficiency value, and Northern Henan, with the lowest urban ecological efficiency value of 0.349, indicated that the urban ecological efficiency level of the five regions presented significantly different. This may be related to the natural geographical orientation and the city type of Henan province. Northern Henan is connected with two major resource provinces, Hebei and Shanxi, and its environment is greatly affected by the surrounding areas; at the same time, most cities in Northern Henan are the resource-based cities with more developed industry, so its ecological efficiency ranking is at the end of the province.
Second, there is an obvious difference in the ecological efficiency among each prefecture-level city in the five regions of Henan province, and the level of their resource allocation and environmental control is uneven. Thereinto, the urban ecological efficiency value of Zhoukou in Eastern Henan reached the effective level of 1, while that of Shangqiu was less than 0.8; the urban ecological efficiency value of Zhumadian in Southern Henan was more than 0.9, while that of Nanyang was less than 0.8; the urban ecological efficiency value of Xuchang in Central Henan reached the effective level of 1, while those of Pingdingshan and Zhengzhou were less than 0.8; the gap between the ecological efficiency of each prefecture-level city in Western Henan and Northern Henan was small.
From the perspective of the efficiency value decomposition, the urban ecological efficiency in Henan province presents the following characteristics:
First, the driving factors of the urban ecological efficiency in the five regions are different. It can be found from Figure 3 that the scale efficiency is the main driving factor of the urban ecological efficiency in Eastern Henan and Northern Henan, and the pure technical efficiency is the main driving factor of the urban ecological efficiency in Western Henan, Southern Henan, and Central Henan. Therefore, for Eastern Henan and Northern Henan, the improvement of the pure technical efficiency is the key to elevate their urban ecological efficiency; while for Western Henan, Southern Henan, and Central Henan, the improvement of the scale efficiency will elevate their urban ecological efficiency level to a more effective level.
Second, the driving factors of the urban ecological efficiency in each region are inconsistent. According to the size of the pure technical efficiency value and the scale efficiency value, there are three categories: the first category is called the balanced-development type, that is, the pure technical efficiency value is equal to the scale efficiency value, mainly including two cities, Zhoukou and Xuchang; the second category is called the technology-oriented type, that is, the pure technical efficiency value is higher than the scale efficiency value, mainly including nine cities, Kaifeng, Luoyang, Sanmenxia, Nanyang, Puyang, Hebi, Jiyuan, Zhengzhou, and Luohe; the third category is called the scale-oriented type, that is, the pure technical efficiency value is lower than the scale efficiency value, mainly including seven cities, Shangqiu, Zhumadian, Xinyang, Anyang, Xinxiang, Jiaozuo, and Pingdingshan.

3.2. Temporal and Spatial Change Characteristics of Malmquist Index of Urban Ecological Efficiency in Henan Province

This paper applies the DEA-Malmquist index model to measure and calculate the Malmquist index of the urban ecological efficiency in Henan province from 2005 to 2016, and decomposes it into the efficiency change index and the technological progress index, in order to observe the dynamic change situation of the ecological efficiency. The results are shown in Figure 5 and Figure 6.

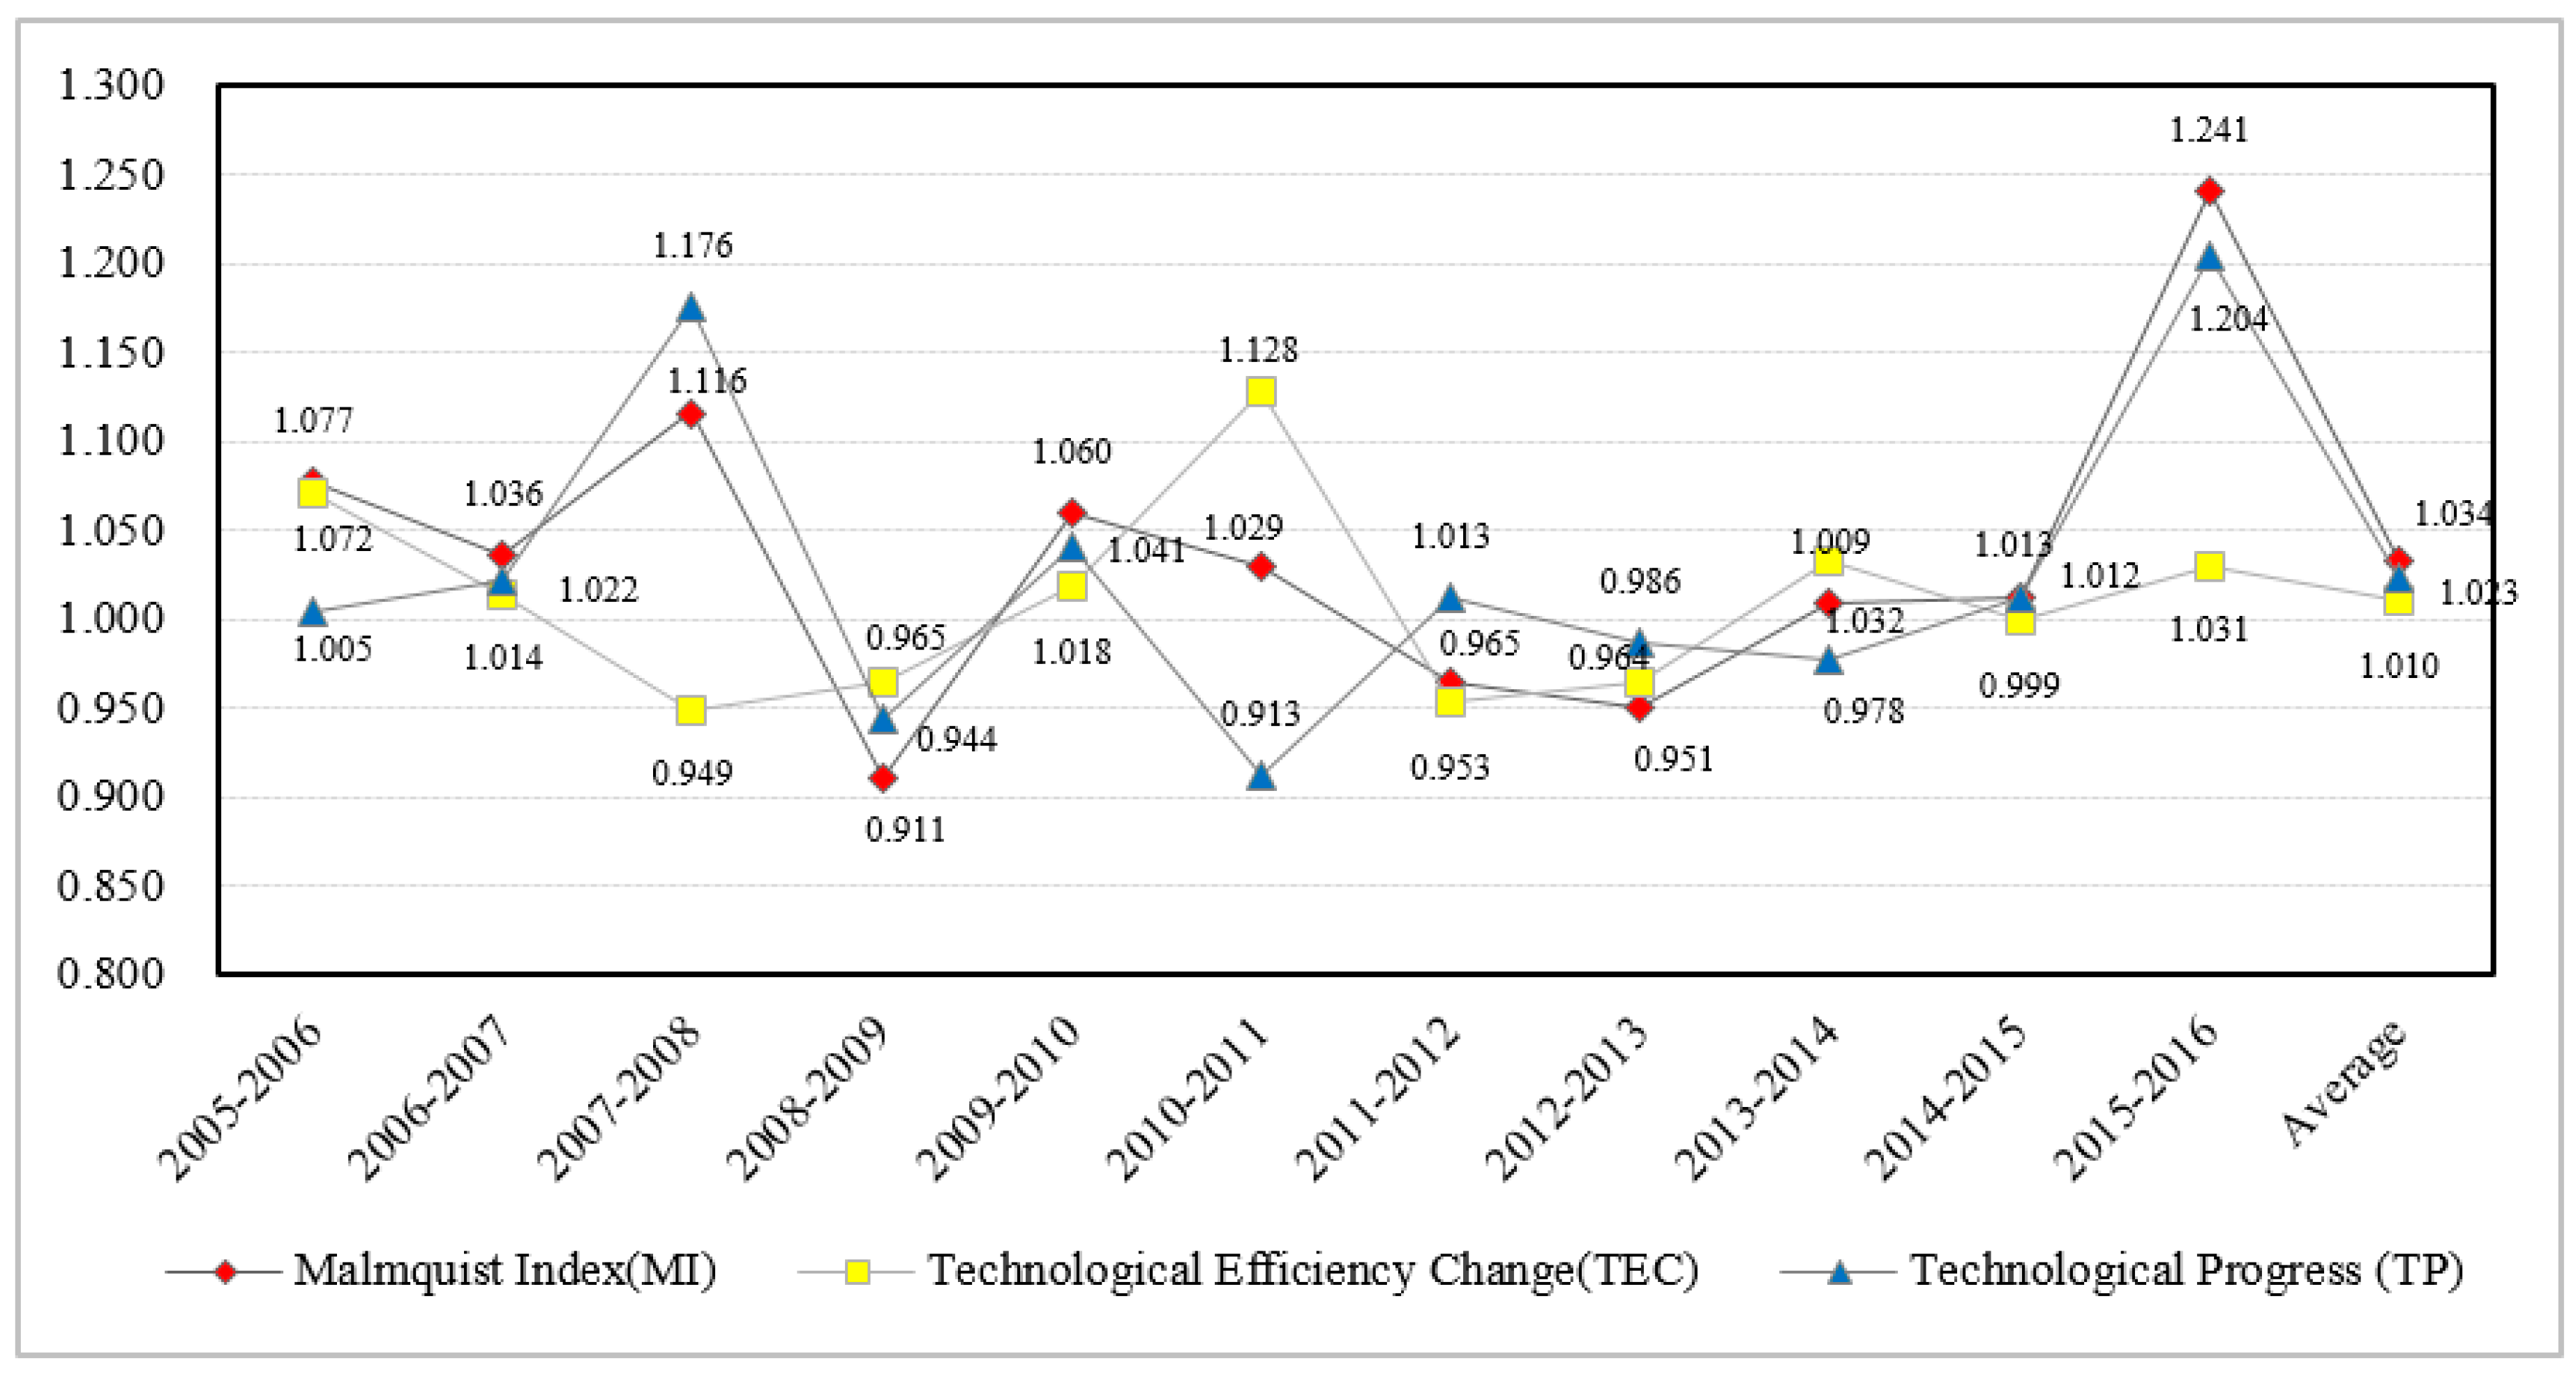
3.2.1. Temporal Evolution of Malmquist Index of Urban Ecological Efficiency

First, the Malmquist index of the urban ecological efficiency in Henan province shows a fluctuating growth trend. The Malmquist index of the urban ecological efficiency in Henan province increased by an average of 3.4% a year from 2005 to 2016, which indicated that the urban ecological efficiency in Henan province was in an upward trend as a whole and the resource utilization degree of each prefecture-level city was rising continuously. Through the specific analysis, it can be found that the Malmquist index of the urban ecological efficiency in Henan province had appeared in three negative growth situations during the 12 years from 2005 to 2016, which were from 2008 to 2009, from 2011 to 2012, and from 2012 to 2013, respectively, when there were a negative growth of Malmquist index less than 1. From 2008 to 2009, this period was mainly affected by the financial crisis, and the economic output of the whole city fell sharply. Since the rapid economic recovery in 2010, a large number of pollutants were discharged into cities, and the urban ecological efficiency level had declined. In 2016, with the continuously increasing efforts of Henan provincial government on the environmental control, various environmental policies were issued to greatly improve the urban ecological efficiency in Henan province in 2016, and the Malmquist index of the ecological efficiency increased by as high as 24.1% annually.
Second, the increase of the technological progress index is bigger than that of the efficiency change index, but the technological progress index fluctuates greatly. It can be found in Figure 4 that the average annual growth rate of the technological progress index and the efficiency change index during the 12 years from 2005 to 2016 was 2.3% and 1%, respectively. This indicates that with the progress of society, people pay more and more attention to the urban ecological efficiency, and the development of science and technology is a more important driving factor for the improvement of the urban ecological efficiency level. Meanwhile, it should be noted that the fluctuation amplitude of the technological progress index is as high as 29.1%. This shows that the stability of the current urban science and technological level is not high, and the level of science and technology fluctuates greatly. Therefore, Henan province should try its best to maintain the principle of the equal emphasis on the stability and growth of the technological progress in the later process of improving the urban ecological efficiency

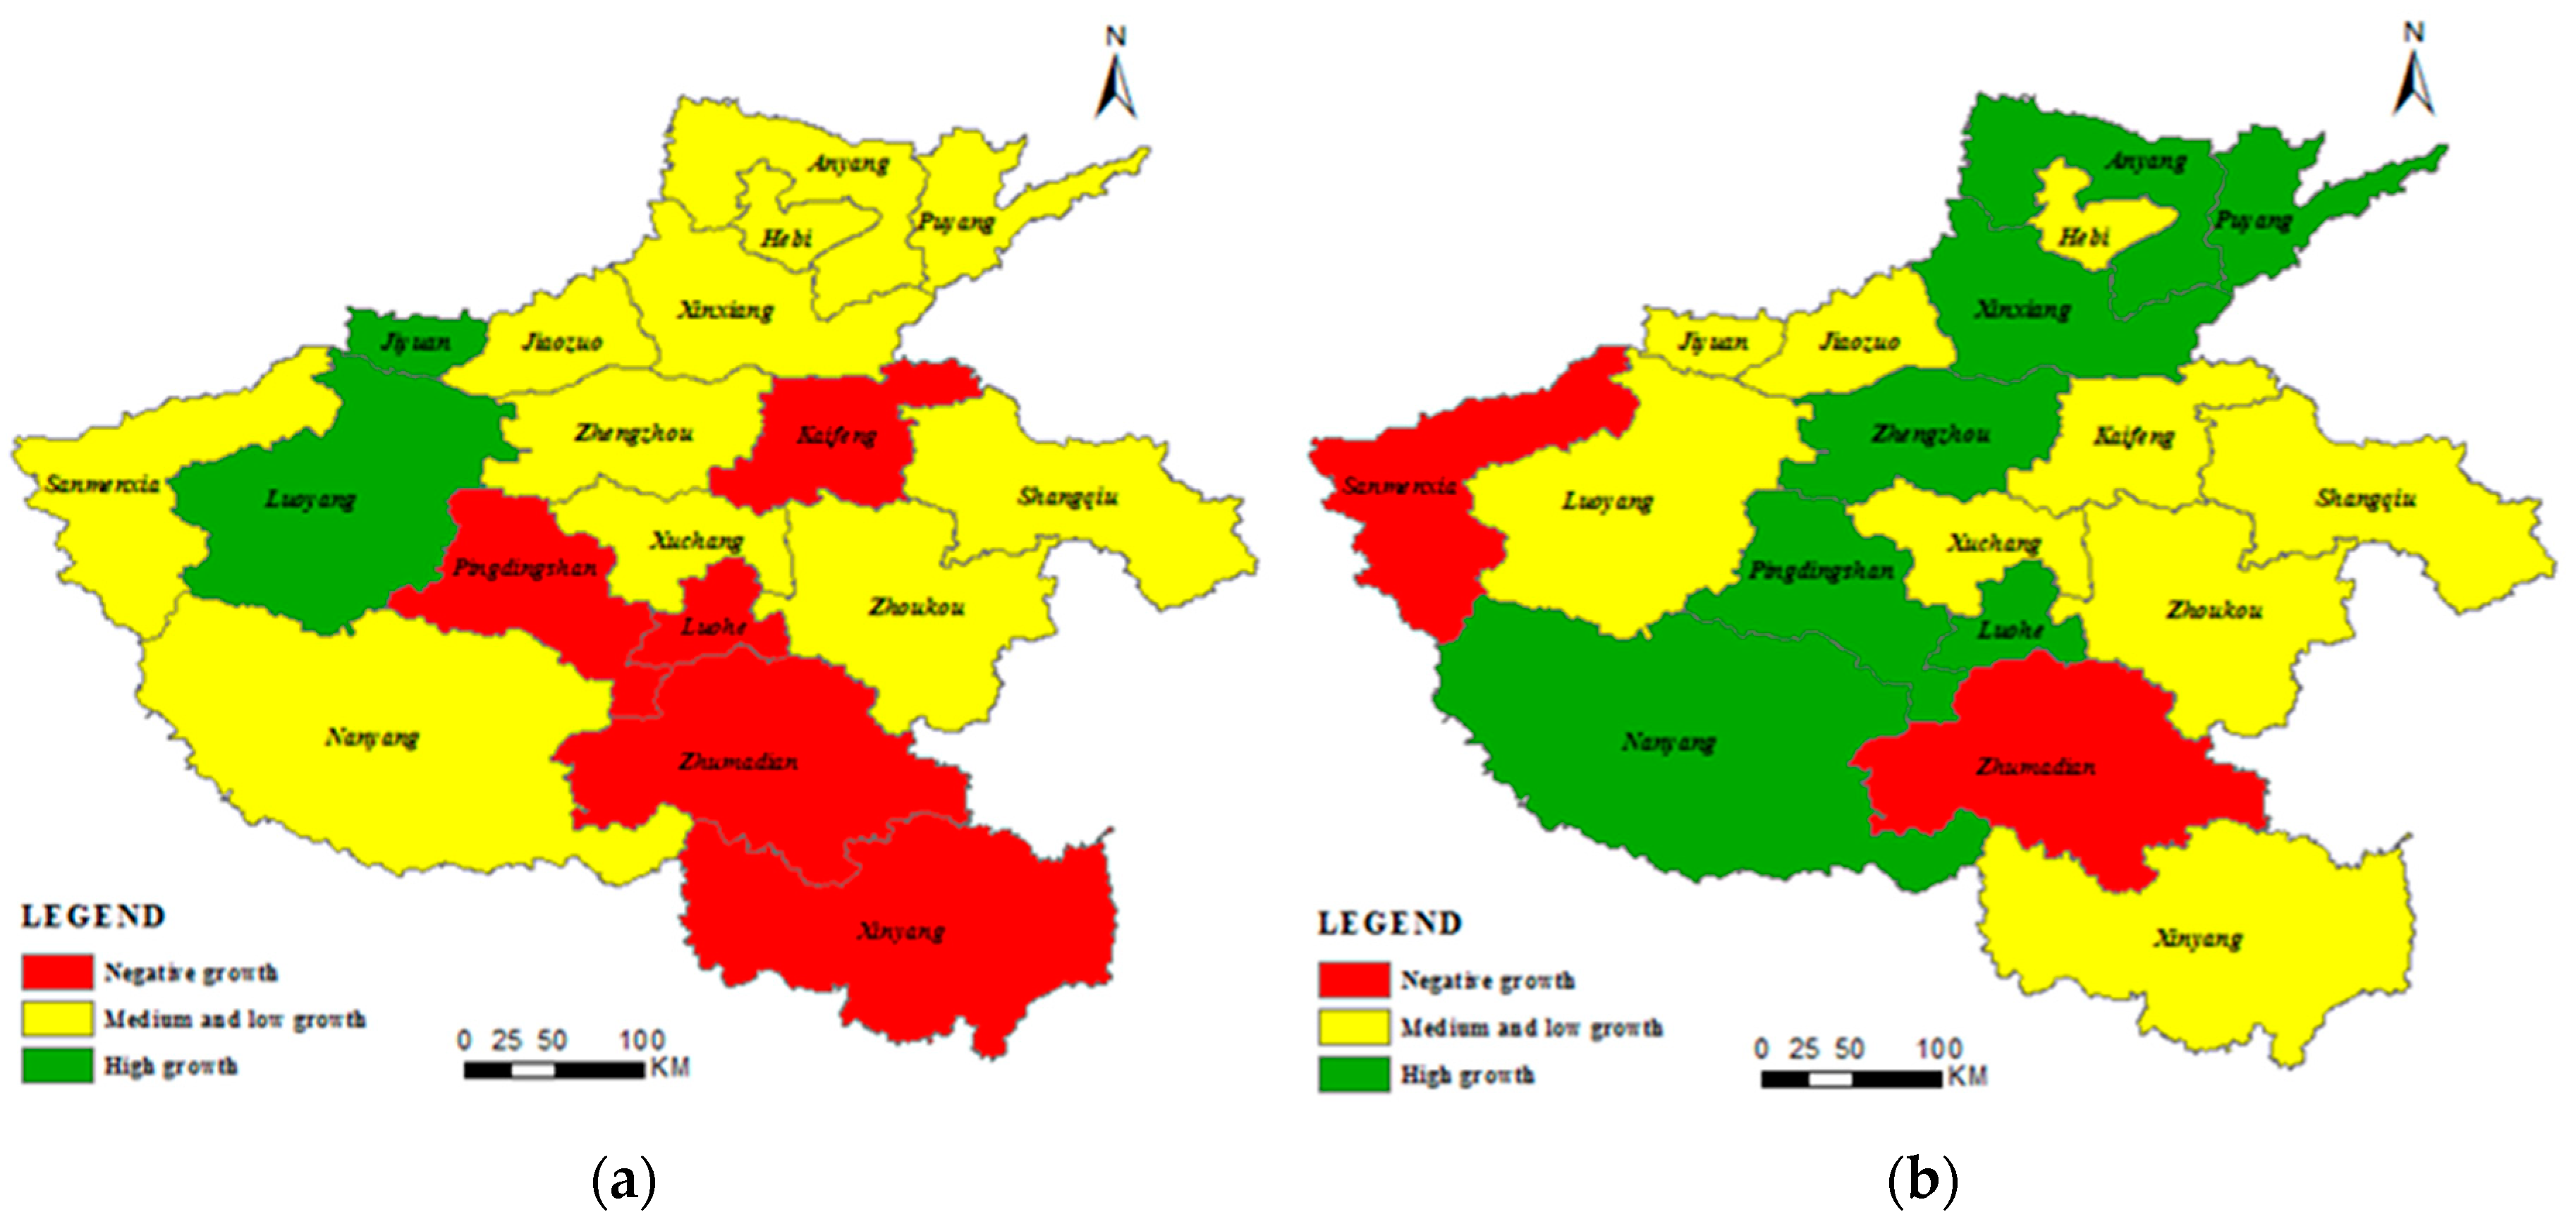
3.2.2. Regional Distribution of Malmquist Index of Urban Ecological Efficiency

When analyzing the Malmquist index of the urban ecological efficiency in Henan province and its decomposition situation from the perspective of the five regions, the main characteristics are as follows:
First, the change of the Malmquist index of the urban ecological efficiency in Eastern Henan and Central Henan is stable. The technological progress index, the efficiency change index, and the Malmquist index in Eastern Henan and Central Henan basically kept at the level of 1. This indicates that their urban ecological efficiency level have originally reached a higher level, and in recent years it has basically entered the state of constant or decreasing returns of scale, so as to make the Malmquist index of the innovative efficiency in the whole regions keeping at 1, neither increasing nor decreasing.
Second, the Malmquist index of the urban ecological efficiency in Southern Henan and Northern Henan is in the situation of low growth. The Malmquist index in Southern Henan and Northern Henan was 1.015 and 1.042, respectively, which indicates that the urban ecological efficiency in Southern Henan and Northern Henan is in an upward trend in the mass. The average annual growth rate of the total factor productivity in Southern Henan and Northern Henan was 1.5% and 4.2%, respectively, which indicates that the utilization degree of all kinds of factors is higher in the regional innovative construction. For Southern Henan, the technological progress contributed 2.5% and the efficiency change decreased by 0.1%. This indicates that the technological level in this region is rising, but the efficiency of resource management is declining, and there is a phenomenon of the excessive investment in the innovative resources. For Northern Henan, the technological progress contributed 3.0% and the efficiency change contributed 0.12%. This indicates that the urban ecological efficiency in Northern Henan was originally at the bottom of the province, and the situation of the low urban ecological efficiency of the whole region has been improved through promoting technology and the management efficiency in recent years.
Third, the Malmquist index of the urban ecological efficiency in Western Henan is in the situation of high growth. The technological progress index, the efficiency change index, and the Malmquist index in Western Henan were 1.082, 1.042, and 1.128, respectively, showing that the average annual growth rate of the urban ecological efficiency in Western Henan was as high as 12.8% during the 12 years. Thereinto, the technological progress contributed 8.2% and the efficiency change contributed 4.2%, indicating that Western Henan is in the leading position of the province in the improvement of the urban ecological efficiency level and its urban ecological civilization level is greatly improved.
Fourth, when analyzing the Malmquist index of the urban ecological efficiency in Henan province and its decomposition situation from the perspective of the 18 prefecture-level cities in the five regions of Henan province, the following characteristics can be obtained according to Figure 6.
The growth rate of the Malmquist index of the ecological efficiency of each prefecture-level city in the five regions presents a decreasing trend. The Malmquist index of the urban ecological efficiency is divided into three grades: the high growth (MI ≥ 1.3), the medium and low growth (1 ≤ MI < 1.3), and the negative growth (MI < 1). Based on this, the spatial distribution map of the Malmquist index of the urban ecological efficiency of each prefecture-level city in Henan province from 2005 to 2006 and from 2015 to 2016 is drawn by using GIS10.20 software, as shown in Figure 7.
From the change situation of the Malmquist index from 2005 to 2006 and from 2015 to 2016, it can be found that Zhumadian had been in the negative growth state, while Hebi, Jiaozuo, Zhoukou, Shangqiu, and Xuchang had been in the medium and low growth situation; Luoyang and Jiyuan had changed from the high growth to the medium and low growth, and Sanmenxia had changed from the medium and low growth to the negative growth; Nanyang, Zhengzhou, Xinxiang, Anyang, and Puyang had changed from the medium and low growth to the high growth, Pingdingshan and Luohe had changed from the negative growth to the high growth, and Xinyang and Kaifeng had changed from the negative growth to the medium and low growth. In a word, the Malmquist index of the urban ecological efficiency of each prefecture-level city in Henan province is presenting a rising state as a whole, which indicates that the urban ecological civilization construction in Henan province has achieved the remarkable results in recent years, and the policy effect has begun to appear.

4. Analysis on Influencing Factors of Urban Ecological Efficiency in Henan Province

The estimation results of the SBM-DEA model containing the undesirable output show that the overall ecological efficiency of 18 prefecture-level cities in Henan province is low and has not reached the effective level. Therefore, it is necessary to further find out the possible influencing factors of the low urban ecological efficiency in Henan province. Simar and Wilson pointed out that, because the input and output variables were related to the explanatory variables, it would result in the biased and inconsistent results to use the OLS regression method and the Tobit regression model to analyze the influencing factors of the efficiency in the second stage. Consequently, they used the bootstrap regression method to overcome this defect [26] and took the urban ecological efficiency value measured in the first stage as the explained variable for the regression analysis. Combined with the study of Wang et al. [33], Qian [34] and Wang et al. [35], considering the accessibility of regional indicators, this paper analyzes the selected variables from those aspects of the economic scale, the industrial structure, the level of opening to the outside world, the urban population density, the urban greening level, and the governmental financial support. Thereinto, the economic scale is expressed by the ratio of GDP of each prefecture-level city to the national GDP (X1); the industrial structure is expressed by the ratio of the industrial added value to GDP of each prefecture-level city (X2); the level of opening to the outside world is expressed by the proportion of the total foreign investment actually utilized in GDP (X3); the urban population density is expressed by the ratio of the total population of municipal districts to the built-up district area (X4); the urban greening level is expressed by the ratio of the green space coverage area in each region to the population number of municipal districts (X5); and the governmental financial support is expressed by the proportion of the regional fiscal expenditure in GDP of each prefecture-level city (X6). All data comes from the statistical yearbook of Henan province (2006–2017) [30], the urban statistical yearbook of China (2006–2017) [31] and the statistical yearbook of urban construction in China (2006–2017) [32]. The descriptive statistics on the raw data of the influencing factors are shown in Table 3:
According to the study of Simar and Wilson [26], this paper constructs the following bootstrap regression model:
T E i , t = C + β 1 E S i , t + β 2 I S i , t + β 3 F D I i , t + β 4 D P i , t + β 5 G L i , t + β 6 G O V i , t + ε i , t
In the Equation (6), TEi,t represents the comprehensive ecological efficiency value of region i in year t; the explained variables ESi,t, ISi,t, FDIi,t, DPi,t, GLi,t, and GOVi,t represent the economic scale, the industrial structure, the level of opening to the outside world, the urban population density, the urban greening level, and the governmental financial support of region i in year t respectively; C is a constant term; β1, β2, β3, β4, β5, β6 is the regression coefficient of the respective variable; i represents a particular region (i = 1, 2, …, 18); t represents a particular year (t = 2005, 2006,..., 2016); εi,t is a random interference term. The stata11 software is used to carry out the bootstrap regression analysis, and the results are shown in Table 4.
As can be seen from Table 4, the significance level of the four factors, including the level of opening to the outside world, the urban population density, the urban greening level, and the governmental financial support, is all below 10%. Thereinto, the governmental financial support has a negative impact on the urban ecological efficiency in Henan province; the level of opening to the outside world, the urban population density, and the urban greening level have a positive impact on the urban ecological efficiency in Henan province. The economic scale has a positive impact on the urban ecological efficiency in Henan province, and the industrial structure has a negative impact on the urban ecological efficiency in Henan province, but the significance of the two is not obvious.
The impact of the economic scale and the industrial structure on the urban ecological efficiency is not significant. The coefficient of the economic scale is 0.171 and it has not passed the significance test. On one hand, according to the environmental Kuznets curve, there is a U-shaped relationship between the economic development level and the ecological efficiency, which indicates that with the growth of the economic development level, the ecological efficiency declines to a certain point and then rises. This is in line with the economic development situation of Henan province. In the initial stage, the economic development mode of Henan province was the extensive development, which paid more attention to the GDP growth and paid less attention to the ecological efficiency. In recent years, with the influence of the environmental pollution on people’s production and life, the ecological problem has been paid more and more attention. While ensuring the economic growth, the ecological efficiency has also been improved. On the other hand, continuing developing economy will inevitably consume a great deal of energy, produce the excessive pollution discharge, resulting in the excessive undesirable output and having a negative effect on the improvement of the regional urban ecological efficiency. The joint role of the two makes the regional economic scale have a positive impact on the urban ecological efficiency, but the correlation is not strong. The coefficient of the industrial structure is −0.002 and has not passed the significance test, which indicates that the more the industrial added value, the lower the regional urban ecological efficiency. As a big traditional agricultural province, Henan province has begun to undertake a large number of the industrial industries from many countries and the eastern developed provinces and cities in order to promote the regional economic growth in recent years. On one hand, the development of industry has promoted the improvement of the economic development level in Henan province; on the other hand, it needs a great deal of resource and energy input, and the degree of its damage to the regional ecological environment is obvious. Hence, the industrial structure has a negative impact on the urban ecological efficiency in Henan province, but the significance is not obvious.
The governmental financial support has a negative impact on the urban ecological efficiency in Henan province. The coefficient of the governmental financial support is −0.002 and has passed the 5% significance test, which shows that the governmental financial support has a negative impact on the improvement of the urban ecological efficiency in Henan province. With the development of the urban ecological civilization, governments in each region have begun to increase the financial input (including the investment in the environmental control), but this has not brought the obvious improvement effect on the environmental system in Henan province. The reason is that the idea of the environmental pollution before the environmental control in each region brings the result that the marginal benefit of the governmental financial input is not significant, and the environmental control effect is much lower than the environmental deterioration speed. In addition, due to the failure of the current environmental protection policy and the poor green drainage effect, the utilization efficiency of the governmental financial fund is not high, so as to accelerate the environmental pressure of the urban development and make the governmental financial support become an obstacle factor for the improvement of the urban ecological efficiency.
The level of opening to the outside world, the urban population density, and the urban greening level have a positive impact on the improvement of the urban ecological efficiency in Henan province. The coefficient of the level of opening up to the outside world in the region is 0.596 and has passed the 1% significance test, which shows that the higher the actual utilization level of the foreign investment in the region, the higher the urban ecological efficiency level. Most of the foreign investment is concentrated in the capital-intensive and technology-intensive enterprises. On one hand, these enterprises will greatly promote the regional economic development level; on the other hand, they will also bring the advanced environmental control technology to the environmental pollution, improve the regional ecological level, and enormously promote the improvement of the urban ecological efficiency in Henan province. The coefficient of the urban population density is 0.042 and has also passed the significance test of 1%. This shows that the consumption demand of cities with a high population density is huge, which promotes the growth of the urban economy; at the same time, it will also require a higher-quality urban environment and ultimately improve the urban ecological efficiency. The coefficient of the urban greening level is 0.005 and has passed the significance test of 5%, which shows that the higher the urban greening level, the stronger the urban purification ability, and the more conducive to improving the urban ecological efficiency.

5. Conclusions and Policy Suggestions

5.1. Conclusions

This paper uses the SBM-DEA method containing the undesirable output and the Malmquist index model to fully evaluate the urban ecological efficiency level in Henan province during the period of 2005–2016 via both the static and dynamic analysis. Based on this, the bootstrap regression model is applied in analyzing the influencing factors of the urban ecological efficiency. The research shows that:
(1)
The urban ecological efficiency in Henan province is low in the mass but presented a fluctuating growth trend. The annual average value of the urban ecological efficiency in Henan province was only 0.768 but presented a fluctuating growth trend. The resource utilization level of the urban ecological construction was rising continuously. The annual average value of the scale efficiency of the urban ecological efficiency in Henan province from 2005 to 2016 was 0.888, while that of the pure technical efficiency was 0.878. But after 2013, the gap between the two had begun to narrow. The Malmquist index of the urban ecological efficiency in Henan province increased by an average of 3.4% a year, which indicated that the utilization degree of the ecological resource of each prefecture-level city in Henan province was rising continuously. Thereinto, the average annual growth rate of the technological progress index and the efficiency change index was 2.3% and 1%, respectively. The Malmquist index growth of the urban ecological efficiency in Henan province is mainly due to the technological progress, but it fluctuates greatly.
(2)
There is an obvious regional difference in the urban ecological efficiency in Henan province. There is a significant difference in the urban ecological efficiency level among the five regions in Henan province. From 2005 to 2016, the comprehensive technical efficiency value of the urban ecological efficiency in the five regions of Henan province was 0.875 in Eastern Henan, 0.911 in Western Henan, 0.840 in Southern Henan, 0.562 in Northern Henan, and 0.870 in Central Henan, respectively. Thereinto, the difference between Western Henan with the highest urban ecological efficiency value and Northern Henan with the lowest urban ecological efficiency value was 0.349. The Malmquist index of the urban ecological efficiency in Eastern Henan and Central Henan basically kept in the stable state of 1; the Malmquist index of the urban ecological efficiency in Southern Henan and Northern Henan was growing at a low speed of 1.5% and 4.2%, respectively; the average annual growth rate of the Malmquist index of the urban ecological efficiency in Western Henan was as high as 12.8%. Meanwhile, 18 prefecture-level cities of Henan province were divided into three categories according to their main driving factors: the balanced-development type, the technology-oriented type, and the scale-oriented type.
(3)
The governmental financial support has a negative impact on the urban ecological efficiency in Henan province; the level of opening to the outside world, the urban population density, and the urban greening level have a positive impact on the urban ecological efficiency in Henan province. The economic scale has a positive impact on the urban ecological efficiency in Henan province, and the industrial structure has a negative impact on the urban ecological efficiency in Henan province, but the significance of the two is not obvious.

5.2. Policy Suggestions

Based on the above analysis and the present policies, this paper puts forward the following policy suggestions:
(1)
Different strategies for improving the urban ecological efficiency should be adopted according to the actual situation of different regions in Henan province. Among the five regions of Henan province, Central Henan with Zhengzhou as the center and Western Henan with Luoyang as the center have a higher level of economic development, the advanced technology, and a pool of talents, and accordingly should take the energy-saving and emission-reduction technology development as the key point. Northern Henan should strive to change the economic development mode from the extensive development mode of “high-production and high-emission” to the intensive development mode, and improve the urban ecological efficiency through such measures as the industrial structure adjustment, the implementation of mandatory punishment to the heavily polluted industries, and the closure of the illegal pollution discharge enterprises. Eastern Henan and Southern Henan should realize that a good natural environment is an important driving force for the economic development, and cautiously choose and undertake the industrial transfer according to their own resource endowment and actual situation. In addition, Henan province should promote the overall improvement of the urban ecological efficiency from the perspective of the overall situation by such measures as strengthening the communication and cooperation among different regions and constructing a convenient and fast channel of technology popularization.
(2)
Henan province should upgrade the level of the opening to the outside world in an all-round way. Specifically, Henan province may attract the foreign investment with the help of the unique advantages of Zhengzhou airport area and the Central Plains urban agglomeration construction, optimize the trade export structure, transform from the processing export trade with high-pollution and high-emission to the innovative export industry with high-technology and low-pollution, so as to improve the urban ecological efficiency level in Henan province and achieve the overall goal of the sustainable development.
(3)
Henan province should moderately increase the urban population number. Around the central cities such as Zhengzhou and Luoyang, Henan province should push forward the citizenization process of migrant workers to enlarge the urban population scale. In recent years, the population of Henan province, especially the scientific and technological innovation talents, has been facing a serious outflow problem. To solve this problem, Henan province should optimize the policy system of the talent introduction, construct various innovative and entrepreneurial platforms for the talent development, and give priority to the talent introduction work, so as to form a good atmosphere of “respecting labor, respecting knowledge, and respecting talents” in the whole society and then enhance the attraction of Henan province to the outstanding talents and lay a good talent foundation for the improvement of the urban ecological efficiency.
(4)
Henan province should change the governmental development idea. The weight of the economic indicators such as GDP and the fiscal revenue in the governmental performance appraisal mechanism should be moderately decreased and that of the environmental control and the ecological protection should be greatly increased. The development idea of emphasizing economy over environment should be effectively reversed. The reward and punishment mechanism to promote the green ecological development of local governments should be constructed to provide the system guarantee for changing the governmental development idea.

Author Contributions

The research was designed by S.Y. The pertinent literature search and the data collection were completed by J.L. The model design and the result analysis were completed by T.L. and J.L. The policy analysis related to the research and the English correction were completed by J.C. and S.Y.

Funding

The APC was funded by Central University Fundamental Research Fund Project of Sichuan University (SKQY201644).

Acknowledgments

This research was funded by Central University Fundamental Research Fund Project of Sichuan University (SKQY201644), Humanity and Social Science Youth fund Project of Education Ministry of China (17YJC790097) and Philosophy and Social Science Planning Project of Henan Province (2017CJJ088).

Conflicts of Interest

The authors declare no conflict of interest.

References

  1. Yan, G. Green Paper on Ecological Civilization: An Evaluation Report on Ecological Civilization Construction in China’s Provinces; Social Sciences Academic Press: Beijing, China, 2015. (In Chinese) [Google Scholar]
  2. Schaltegger, S.; Sturm, A. Ökologische Rationalität: Ansatzpunkte zur Ausgestaltung von ökologieorientierten Managementinstrumenten. Die Unternehm. 1990, 44, 273–290. [Google Scholar]
  3. WBCSD. Eco-Efficient Leadership for Improved Economic and Environmental Performance; WBCSD Publishing: Geneva, Switzerland, 1995. [Google Scholar]
  4. OECD. Eco-Efficiency; OECD Publishing: Paris, France, 1998. [Google Scholar]
  5. Dyckhoff, H.; Allen, K. Measuring ecological efficiency with data envelopment analysis (DEA). Eur. J. Oper. Res. 2001, 132, 312–325. [Google Scholar] [CrossRef]
  6. York, R.; Rosa, E.A.; Dietz, T. The ecological footprint intensity of national economies. J. Ind. Ecol. 2004, 8, 139–154. [Google Scholar] [CrossRef]
  7. Hur, T.; Kim, I.; Yamamoto, R. Measurement of green productivity and its improvement. J. Clean. Prod. 2004, 12, 673–683. [Google Scholar] [CrossRef]
  8. Seppäläa, J.; Melanen, M.; Mäenpää, I.; Koskela, S.; Tenhunen, J.; Hiltunen, M.R. How Can the Eco-efficiency of a Region be Measured and Monitored. J. Ind. Ecol 2005, 9, 117–130. [Google Scholar] [CrossRef]
  9. Wursthorn, S.; Poganietz, W.R.; Schebek, L. Economic-environmental monitoring indicators for European Countries: A disaggregated sector-based approach for monitoring eco-efficiency. Ecol. Econ. 2011, 70, 487–496. [Google Scholar] [CrossRef]
  10. Lin, Z. Ecological urbanism in East Asia: A comparative assessment of two eco-cities in Japan and China. Landsc. Urban Plan. 2018, 179, 90–102. [Google Scholar] [CrossRef]
  11. Zheng, D.F.; Hao, S.; Sun, C.Z.; Lv, L.T. Temporal and spatial evolution analysis and trend prediction of ecological efficiency in mainland China. Geogr. Res. 2018, 37, 1034–1046. (In Chinese) [Google Scholar]
  12. Ren, Y.F.; Fang, C.L.; Lin, X.Q. Evaluation of ecological efficiency of four major urban agglomerations in eastern coastal areas of China. Acta Geogr. Sin. 2017, 72, 2047–2063. (In Chinese) [Google Scholar]
  13. Yang, L.; Du, P. Evaluation of urban ecological efficiency based on factor analysis and super efficiency DEA. Stat. Decis. 2017, 16, 52–55. (In Chinese) [Google Scholar]
  14. Giordano, P.; Caputo, P.; Vancheri, A. Fuzzy evaluation of heterogeneous quantities: Measuring urban ecological efficiency. Ecol. Model. 2014, 288, 112–126. [Google Scholar] [CrossRef]
  15. Fu, L.N.; Chen, X.H.; Leng, Z.H. Study on ecological efficiency of urban agglomeration based on super efficiency DEA model: A case study of Changsha-Zhuzhou-Xiangtan “3+5” urban agglomeration. China Popul. Resour. Environ. 2013, 23, 169–175. (In Chinese) [Google Scholar]
  16. Han, Z.L.; Wu, A.L.; Peng, F.; Sun, J.; Xia, K. Ecological efficiency of Bohai Rim region based on undesirable output and threshold regression model. Prog. Geogr 2018, 37, 255–265. (In Chinese) [Google Scholar]
  17. Hou, M.Y.; Yao, S.B. Measurement of urban ecological efficiency and its spatio-temporal dynamic evolution in China. China Popul. Resour. Environ. 2018, 28, 13–21. (In Chinese) [Google Scholar]
  18. Ma, X.; Wang, C.; Yu, Y.; Li, Y.; Dong, B.; Zhang, X.; Niu, X.; Yang, Q.; Chen, R.; Li, Y.; et al. Ecological efficiency in China and its influencing factors—A super-efficient SBM metafrontier-Malmquist-Tobit model study. Environ. Sci. Pollut. Res. 2018, 25, 20880–20898. [Google Scholar] [CrossRef] [PubMed]
  19. Lo Storto, C. Ecological efficiency based ranking of cities: A combined DEA cross-efficiency and Shannon’s entropy method. Sustainability 2016, 8, 124. [Google Scholar] [CrossRef]
  20. Henan Provincial People’s Government. Basic Situation of Henan Province. Available online: https://www.henan.gov.cn/2018/05-31/2408.html (accessed on 21 August 2019).
  21. Farrell, M.J. The measurement of productive efficiency. J. R. Stat. Soc. Ser. A (Gen.). 1957, 120, 253–281. [Google Scholar] [CrossRef]
  22. Charnes, A.; Cooper, W.W.; Rhodes, E. Measuring the efficiency of decision making units. Eur. J. Oper. Res. 1978, 2, 429–444. [Google Scholar] [CrossRef]
  23. Tone, K. A slacks-based measure of efficiency in data envelopment analysis. Eur. J. Oper. Res. 2001, 130, 498–509. [Google Scholar] [CrossRef] [Green Version]
  24. Malmquist, S. Index numbers and indifference surfaces. Trab. Estad. Investig. Oper. 1953, 4, 209–242. [Google Scholar] [CrossRef]
  25. Färe, R.; Grosskopf, S.; Lindgren, B.; Roos, P. Productivity changes in Swedish pharamacies 1980–1989: A non-parametric Malmquist approach. J. Product. Anal. 1992, 3, 85–101. [Google Scholar] [CrossRef]
  26. Simar, L.; Wilson, P.W. Estimation and inference in two-stage, semi-parametric models of production processes. J. Econom. 2007, 136, 31–64. [Google Scholar] [CrossRef]
  27. Li, J.J.; Luo, N.S. Influence of urban scale on ecological efficiency and analysis of regional differences. China Popul. Resour. Environ. 2016, 26, 129–136. (In Chinese) [Google Scholar]
  28. Wang, J.; Kong, F.B. Study on evaluation of regional industrial ecological efficiency: A case study of Poyang Lake ecological economic zone. Econ. Geogr. 2012, 32, 101–107. (In Chinese) [Google Scholar]
  29. Li, Q.; Gao, N. Study on evolution and influencing factors of spatial and temporal pattern of ecological efficiency in Yangtze River Economic Zone. J. Chongqing Univ. (Soc. Ed.). 2018, 24, 29–37. (In Chinese) [Google Scholar]
  30. Henan Province Bureau of Statistics. Statistical Yearbook of Henan Province (2006–2017); China Statistics Press: Beijing, China, 2006–2017. (In Chinese) [Google Scholar]
  31. Department of Urban Socio-Economic Survey, National Bureau of Statistics of China. Urban Statistical Yearbook of China (2006–2017); China Statistics Press: Beijing, China, 2006–2017. (In Chinese) [Google Scholar]
  32. Ministry of Housing and Urban-Rural Development of the People’s Republic of China. Statistical Yearbook of Urban Construction in China (2006–2017); China Statistics Press: Beijing, China, 2006–2017. (In Chinese) [Google Scholar]
  33. Wang, N.; Gai, M. Study on ecological efficiency and influencing factors in Bohai Rim region based on undesirable output SBM Model. Resour. Dev. Mark. 2018, 34, 741–746. (In Chinese) [Google Scholar]
  34. Qian, L. Study on the measurement of urban green economy efficiency and the spatial measurement of its influencing factors in China. Inq. Econ. Issues 2018, 8, 160–170. (In Chinese) [Google Scholar]
  35. Wang, X.L.; Fang, X.C. Study on Ecological efficiency Measurement and influencing factors of old industrial bases in Northeast China—An Analysis based on DEA-Malmquist-Tobit model. Ecol. Econ. 2017, 33, 95–99. (In Chinese) [Google Scholar]
Figure 1. Administrative regional distribution map of Henan province.
Sustainability 11 05048 g001
Figure 2. Implementation framework of methodology of this research.
Sustainability 11 05048 g002
Figure 3. Urban ecological efficiency in Henan province from 2005 to 2016 and its decomposition.
Sustainability 11 05048 g003
Figure 4. Urban ecological efficiency of each prefecture-level city in Henan province from 2005 to 2016 and its decomposition.
Sustainability 11 05048 g004
Figure 5. Malmquist index of urban ecological efficiency in Henan province from 2005 to 2016 and its decomposition.
Sustainability 11 05048 g005
Figure 6. Malmquist index of urban ecological efficiency of each prefecture-level city in Henan province from 2005 to 2016 and its decomposition.
Sustainability 11 05048 g006
Figure 7. Spatial distribution of Malmquist index change of urban ecological efficiency in Henan province from 2005 to 2006 and from 2015 to 2016. (a) 2005–2006; (b) 2015–2016.
Sustainability 11 05048 g007
Table 1. Evaluation index system of urban ecological efficiency in Henan province.
IndexVariableVariable Declaration
input index ( x k 0 )labor force input (x1)number of employed persons in employment units of cities and towns (10,000 person)
capital input (x2)total sum of fixed asset investment of whole society (100 million yuan)
land resource input (x3)area of urban built-up districts (square kilometer)
energy input (x4)annual electricity consumption (100 million kilowatt hour)
desirable output ( y i 0 d )economic aggregate (y1)gross domestic product (GDP) (100 million yuan)
undesirable output ( y i 0 u )environmental pollution (y2)industrial waste water discharge quantity (10,000 ton)
industrial sulfur dioxide discharge quantity (ton)
industrial smoke (powder) dust discharge quantity (ton)
Table 2. Analysis results of descriptive statistics on the input and output index of urban ecological efficiency in Henan province.
VariableStandard DeviationAverage ValueMaximum ValueMinimum Value
number of employed persons in employment units of cities and towns (10,000 person)30.51747.325200.8506.170
total sum of fixed asset investment of whole society (100 million yuan)1006.5881071.4147070.37068.948
area of urban built-up districts (square kilometer)75.03891.582457.00024.260
annual electricity consumption (100 million kilowatt hour)104.477128.168504.92015.327
gross domestic product (GDP) (100 million yuan)1141.6531399.7558113.970144.328
industrial waste water discharge quantity (10,000 ton)4496.7147119.65321807.000670.000
industrial sulfur dioxide discharge quantity (ton)53104.00362809.771304570.0001917.000
industrial smoke (powder) dust discharge quantity (ton)28458.15831998.875172219.0001114.000
Table 3. Analysis results of descriptive statistics on the influencing factors of urban ecological efficiency in Henan province.
VariableAverage ValueMaximum ValueMinimum ValueStandard Deviation
economic scale0.3101.0900.0710.200
industrial structure47.19670.33823.63111.273
level of opening to the outside world0.2981.0770.0180.223
urban population density7.74626.7691.2185.322
urban greening level30.81383.1418.12513.565
governmental financial support12.75921.2376.0553.532
Table 4. Bootstrap regression results of influencing factors of urban ecological efficiency in Henan province.
VariableCoefficientStandard ErrorZ ValueP Value
economic scale0.1710.1870.9140.360
industrial structure−0.0020.005−0.4020.686
level of opening to the outside world0.596 ***0.1983.0160.003
urban population density0.042 ***0.0085.2290.000
urban greening level0.005 **0.0022.3740.018
governmental financial support−0.002 **0.013−2.1460.032
constant term−0.3360.232−1.4510.149
Note: * represents 10% significance level, ** represents 5% significance level, *** represents 1% significance level.

