Article

Cow Milk versus Plant-Based Milk Substitutes: A Comparison of Product Image and Motivational Structure of Consumption

Institute of Marketing & Innovation, Department of Economics and Social Sciences, University of Natural Resources and Life Sciences, 1180 Vienna, Austria
*
Author to whom correspondence should be addressed.
Sustainability 2019, 11(18), 5046; https://doi.org/10.3390/su11185046
Submission received: 25 June 2019 / Revised: 30 August 2019 / Accepted: 10 September 2019 / Published: 16 September 2019
(This article belongs to the Special Issue Marketing of Sustainable Food and Drink)

Abstract

:
Cow milk is under increased scrutiny due to its environmental impact and ethical considerations concerning animal welfare. At the same time, a rising share of consumers is switching to plant-based milk substitutes (abbreviated “plant milk”). The objective of this study was (1) to analyze the product image of plant milk and cow milk and (2) to compare the motivational structure behind the consumption of both product categories. For this purpose, a quantitative survey with Austrian consumers was carried out to analyze the product image of plant milk in comparison to cow milk (n = 1001). The product image analysis revealed that the product image of cow milk is still much better than that of plant milk. Amongst others, cow milk is considered to be healthier, more natural, and better for bones. Product image valuation was dependent on the (non-)consumption of plant milk. Plant milk consumers evaluated plant milk significantly better; they considered plant milk to be much better digestible and allergy-free. The qualitative study using means-end-chain analysis, with two sub-samples of interviewees (plant milk consumers, n = 30, and cow milk consumers, n = 30), identified different motives for the consumption of cow milk and plant milk. Motives that were only reported from cow milk consumers are the origin of milk and the support of small-scale dairy production of farmers. Motives of plant milk consumers were much more diverse and included animal welfare and sustainability aspects.

1. Introduction

For more than 8000 years, cow milk has been an essential part of human nutrition. Milk contains several essential nutrients and is in many countries an important part of dietary recommendations [1]. In Austria for example, three portions of milk are recommended daily, due to its high content of calcium, proteins, and vitamins (A, B2, and B12) [2]. However, dairy production has a considerable environmental impact. The main environmental issues related to milk production are soil degradation, air and water pollution, and loss of biodiversity [3]. In the bigger context, one third of households’ total environmental impact in the EU countries is connected to food and drink consumption [4].
The rising emergence of lactose intolerance, milk allergies, environmental concerns, and problems due to diets rich in cholesterol are leading toward a growing demand for dairy alternatives [5]. Negative headlines in the internet, such as “Milk Life? How About Milk Destruction: The Shocking Truth About the Dairy Industry and the Environment” [6] from an animal welfare organization, “11 Reasons to Stop Drinking Cows’ Milk” [7] from an environmental platform, or “Milk is not good for your bones” [8] from a popular food blogger are exemplary for a rise of critical voices. Plant milk is often presented as a healthy, sustainable, and animal-welfare-friendly alternative [9,10,11]. Derived from the water extraction of legumes, nuts, or cereals, plant milk is completely free from animal-based ingredients [12]. Plant milk is similar in appearance and taste to conventional milk and is used for the same purposes [13]. Dietary lifestyles such as veganism and flexitarianism are drivers behind a rising demand for plant milk [13,14]. Plant milk has somehow become a lifestyle instrument, consumed by many not only because of dietary issues, but also because of individual beliefs [15]. The available plant milk products on the market vary with respect to their nutrients, and it is common practice to add vitamins, minerals, and proteins to them [13]. Vegan plant milk alternatives often contain added calcium to serve as a comparable cow milk substitute. Worldwide, the plant milk market is growing substantially. It is leaving the niche market and becoming main stream [16] (see also the next Section).
The category of plant milk is not really new on the market; leading companies such as Oatly or Alpro started in Europe in the 1980s. New is the dynamic growth in recent years [16]. Despite the rising economic success of plant milk beverages, there has been no study undertaken comparing the product image of cow milk with plant milk. Subsequently, there has been no study published yet comparing the motives of European consumers for consuming plant milk versus cow milk. There are three studies available that investigate the acceptance of soy-based products compared with conventional milk products [17,18,19], and one study done with consumers in North Carolina, looking at the importance of specific product attributes of cow milk versus plant milk [20]. This gap in the research leads to the two-fold research objective of this paper: first, to quantitatively measure the product image of cow milk and plant milk, and second, to qualitatively investigate the motivational structures of plant milk consumers versus cow milk consumers. Understanding the motives and the product image of both product categories delivers important insights for the plant milk sector; namely, how to further develop and explore a fast-growing food market category, and for the dairy sector, how to respond to changing consumer preferences.
The structure of the text is as follows: in Section 2, we will present trends and sustainability challenges in the global milk and plant milk market, followed by a literature review on consumer studies about cow milk and plant milk in Section 3. At the end of the literature review, we will present the research questions for Study 1, the quantitative part of this article including the derived hypotheses (product image analysis), and the research questions for Study 2, the qualitative part (means-end chain analysis). Section 4 describes the materials and methods of Study 1 and Study 2, Section 5 the results, followed by Section 6, where the results are discussed with respect to findings from literature and conclusions are drawn.

2. Trends and Sustainability Challenges in the Global Market for Dairy and Plant Milk

Worldwide, milk is one of the most valuable agricultural raw materials. In 2013, global milk production reached a value of US $328 billion, with a share of cow milk at 82.7%, buffalo milk (13.3%), goat milk (2.3%), sheep milk (1.3%), and camel milk (0.4%) [21]. For 2025, global milk production is forecasted to rise by 23% compared to the global production level in 2013 [21]. The increase of demand for dairy will mainly happen in Africa, South Asia, and East Asia [22]. The level of liquid cow milk consumption in Asia is significantly lower than that in developed countries, yet in the last decades, dairy consumption doubled in East Asia [22]. In the USA and in Europe, cow milk consumption is steadily declining [23].
The global plant milk market reached an estimated size of US $8.51 billion in 2016 and is forecasted to rise to a CAGR (compound annual growth rate) of 12.5% to triple to a market volume of US $24.6 billion in 2025. Soy milk is globally the dominant plant milk with respect to market shares [24]. The highest consumption of plant milk is in the Asian-Pacific area [25].
US market data from the retail sales research company Nielsen shows that cow milk’s sales have declined in the USA by 6% in 2017 [26]. Over the course of decades, the decline of cow milk sales in the USA was even more dramatic. The consumption of liquid cow milk in the USA has dropped by 35.6% from 1975 to 2016. From 2000 to 2004, it fell by 5.1%, but from 2010 to 2014, it decreased by 10.2% [27]. In contrast, plant milk sales are up by 9% compared to the previous year [26]. Even more impressive is the growth in the categories of plant-based yogurts (+55%), plant-based cheeses (+43%), and plant-based creamers (+131%) in the USA [26]. In the beginning, US consumers used soy milk to replace cow milk, but in recent years, other plant milk alternatives have gained popularity. Soy milk sales in the USA declined by “double digit per capita consumption” in 2014, while the milk alternative category with grain, nuts, rice, and seed milk had a 28% consumption gain [27].
In Europe, plant milk is on the way to leave its niche position. An estimated 15% of Europeans does not consume dairy anymore, resulting in a plant milk market share of 4% in Europe [13], which is still small; however, in the last decade, sales more than doubled, especially for non-soy beverages, which went from a 17% to a 40% share in the plant milk category [28]. In Austria, for example, the share of households using plant-milk—at least occasionally—amounts to 26% [29]. In 2015, more than 130 plant milk alternatives were available on the European market, with a value of US $1.5 billion [30]. In comparison, the turnover of the European dairy processing sector reached a value of €117 billion in 2004, which represents an approximate value of US $138 billion [31]. In EU-15, the per capita consumption of liquid milk declined by 6 kg to 52 kg from 2008 to 2018. The decline in the EU is expected to slow to half the rate of the last decade, resulting in 49 kg per capita by 2030 [28]. However, the production method has an influence on the growth rates of liquid milk. In France, conventional liquid milk consumption fell by 4%, while organic milk grew by 18% in 2018 [28].
From an environmental point of view, the dairy (and meat) sector is one of the biggest greenhouse gas producers in agriculture. Additionally, the water and ecological footprint for milk and dairy products is significantly higher than for fruits and vegetables [32]. On a global scale, the top 20 meat and dairy corporations emit more greenhouse gases than the whole country Germany [33]. Confirming a systematic review on greenhouse gas emissions of fresh food [34], the carbon footprint (CF) of cow milk is estimated to amount on average to a mean of M = 1.39 CO2-eq/kg (median 1.29; min 0.54, max 7.50); the CF of soy milk amounts to M = 0.88 (median 0.77; min 0.66, max 1.40). The relevant data for almond milk are M = 0.42 CO2-eq/kg (median 0.42; min 0.39, max 0.44) [34]. Confirming another study, the water footprint of cow milk is 3.5 times higher compared with soy milk [35]. Altogether, these estimations show that the consumption of plant milk products seems to be much more sustainable compared with the consumption of cow milk.
Cow milk also has a significant environmental impact, because its productions is linked to extensive cultivation of soy beans. Soy bean is a major feed ingredient for dairy cows, and its production is forecasted to double until 2050 [23]. The main drivers behind the rising dairy demand is a growing middle class in China and other emerging countries, who are switching to a Western-oriented diet. It is highly probable that the additional agricultural area necessary to produce the rising supply of soy bean will be at the expense of rapidly shrinking rainforests. This will further contribute to the loss of biodiversity, whose speed and rate are unprecedented in human history [36]. In 2017, the EU used 12% of the global soybean production (i.e., 34.4 million tons), of which only 13% (4.5 million tons) can be considered deforestation-free [37]. Approximately 90% of its use was for feed and less than 5% for human food consumption [37]. Because of consumer concerns, European soy milk brands aim to source most of its supply from European farmers [38]. The impact of unhealthy and unsustainable produced food poses a great risk not only for the health of the people, but also for the health of the planet. “Healthy diets have an appropriate caloric intake and consist of a diversity of plant-based foods, low amounts of animal source foods, unsaturated rather than saturated fats, and small amounts of refined grains, highly processed foods, and added sugars” [39] (p. 448). If more and more consumers are switching from cow milk to plant milk, that could lessen the environmental foot print. Nevertheless, not all plant milk products may be considered sustainable per se. California produces 80% of the world’s almonds, while having experienced four severe droughts in the last decade. Intensive irrigation with aquifer water has led, in some areas, to an annual subsidence of approximately 28 cm per year, which also damages the infrastructure (bridges, roads, etc.) [40].

3. Literature Review on Consumer Studies about Cow Milk and Plant Milk

A study from 2017 [20] done with consumers of cow and plant milk from North Carolina applied a choice-based conjoint analysis to rank the importance of specific product features for cow milk and plant milk. For cow milk, the most important attributes identified were fat content (1–2% fat), packaging size (gallon), and label claims (locally farmed). Based on an additional Kano Analysis, “Attractive features for fluid milk (i.e., cow milk) consumers (n = 827) included milk that was all natural, organic, reduced fat, and vitamin fortified” [20] (p. 6131). However, usually, cow milk is not a natural, untreated product. For example, in Austria, it is not allowed to sell raw milk in retail [41].
The most important attributes for plant milk were sugar level (naturally sweetened), plant source (almond), and the size of the packaging (half a gallon). Important values for both consumer groups were to achieve a healthy lifestyle and a balanced diet. Both consumer groups reported healthy nutrients, taste (sweetness, creaminess, aftertaste), and interestingly, being lactose free as important product attributes. The interviewees, who consumed only plant milk, reported as motives: the goal to consume fewer animal-derived foods and perceived lower negative impacts on the environment. They had strong beliefs about the abuse of livestock during rearing and slaughtering. Both groups mentioned protein and calcium content as important product attributes. For cow milk consumers, cow milk is seen as a staple food that is often consumed out of habit [20].
Besides the study from North Carolina, all other studies investigated soy milk or soy products in comparison with cow milk. Palacios et al. found that cow milk is significantly better evaluated with respect to taste and other sensory attributes than soy milk [17]. Variables like ethnicity, age, gender, or lactose intolerance had no influence. In a follow-up study with children and adolescents, they found similar results. Soy milk without added flavor was the least preferred alternative [18]. Villegas et al. did a similar study about soy milk with vanilla flavor, and again, cow milk was much more preferred than soy milk [19]. In those soy milk studies, the consumers were not dedicated plant milk consumers. Taste was the main reason to prefer cow milk over soy milk [17,18,19].
A study with Australian consumers reported better perceptions of cow milk versus soy milk with respect to sensory quality and convenience. Cow milk was perceived as a good source of nutrients with good taste. Negative perceptions of cow milk were related to high cholesterol, fat and energy content of whole milk [42]. Other studies have shown that cow milk is also consumed because of its nutritional and health benefits [42,43,44,45]. Lea et al. [46] observed for consumers of plant-based food products health and nutritional benefits as important factors.
Research indicates that in general consumers are aware of the health benefits of cow milk, especially its importance for bone health and as a source of calcium [47,48]. Although soy milk contains about 10 times less calcium compared to cow milk [49], the studies of McCarthy et al. [20] and Bus and Worsley [42] observed that consumers see plant/soy milk as an important source for calcium. Both studies do not clarify if this is a misconception or if it is related to the fact that many plant milk products on the market are fortified with calcium. A study in Switzerland analyzed 45 plant milk products (soy, rice, coconuts, etc.) from the main supermarket chains with respect to their nutrient content. They found that replacing cow milk with plant milk leads to a reduced intake of calcium, proteins, minerals, certain vitamins, and an increased intake of salt [49].
In 2016, a study of Finnish consumers investigated the motives to replace animal proteins with plant proteins and found the main motives to be environmental concerns, health, weight control, and social aspects [50]. A focus group study of US consumers and non-consumers of soy food products found that consumers switched to soy because of a lifestyle change [51]. Lactose intolerance, starting a vegetarian diet, and environmental concerns were the decisive factors to consume soy products. However, as shown by Hajek [52], many consumers are reporting food intolerances based on their believes and not on medical diagnosis.
The good taste of these products was the reason to continue the consumption of soy products [51]. For non-consumers, soy had a bad product image, they were not familiar with soy products, they reported that the taste of animal-based products was not replaceable, and they had a lack of knowledge concerning the preparation and use of soy products. The higher costs and reduced availability were the main barriers against the consumption of soy products [51].
It makes sense to also look at the motives leading to a flexitarian [13,14], vegetarian, or vegan lifestyle [53,54], because these lifestyles are closely related to consuming more plant milk products. Over the last decades, the motives to become a vegetarian have changed. A study done between 1993 to 1995 reported that the main reason to be a vegetarian was to live healthy. Less prominent reasons were ethical, taste, social, environmental, and economic aspects [53]. Today, many studies report ethical considerations with respect to animal welfare as the main reason to pursue a vegetarian lifestyle [54,55,56,57,58]. Animal welfare is especially, for vegans, the most prominent argument for dietary choices. Less prominent than animal welfare are wellness, health, and environmental concerns [54]. An international study from 2015 came to similar results. Ethical concerns about animal welfare represented, for 81% of the vegan consumers, the most important motive, and only 19% mentioned health as the main motive (which could also have been influenced by social desirability) [56]. Another common finding between all of these studies is that mostly women are prone to lead a vegan or vegetarian lifestyle [54,55,56,57].
Health and environmental aspects are reoccurring motives in those mentioned studies. Other important aspects influencing consumers in their food choice are in particular the local or regional origin [59], tradition [60], and the support of farmers and the local economy [43]. The preference for local, domestic produced food is a form of consumer patriotism, which is also observed in the dairy sector [43].
Based on these studies the different views of consumers regarding cow milk and plant milk are connected to different values (health, animal welfare, environment, etc.), lifestyles (vegetarian, vegan, etc.), and consumption versus non-consumption or familiarity (factors such as taste, experience, etc. influencing product acceptance [61]). Such values might influence the perception of a product category and the motivation to consume it. In addition, the product image of a specific product (such as plant milk) is also depending on the product image of competing products (such as cow milk) [62]. Product images are important means in marketing because they deliver essential information to create unique “brand worlds” and insights into future communication strategies [63]. This leads to the following research questions (RQ) for the quantitative part of this study (Study 1: Product Image Analysis):
RQ1.
Is there a difference in the product image of cow milk and plant milk?
RQ2.
Is the assessment of the product image influenced by the consumption versus non-consumption of plant milk?
As mentioned above, health is an important factor for the food product choice [20,50,51]. “Liking, Habits, Need & Hunger, and Health were rated as triggering eating behavior fairly often” [64] (p. 125). Therefore, we assumed that the assessment of a product image is influenced in particular by health consciousness. The variable “health consciousness” was used as a mediator variable [65]. More health-conscious persons will probably try to reduce animal products in their diet, as mentioned above [20], and will therefore evaluate cow milk worse and soy milk better than persons with less healthy behavior. The inclusion of mediator variables such as health consciousness to explain purchase behavior is comparable to studies from the literature [66]. The relevant research question 2 is:
RQ3.
Is health consciousness influencing the product image evaluation of cow milk and plant milk?
The corresponding hypotheses for research questions 1 to 3 are:
Hypotheses (H1).
There are significant differences in the assessment of the product image of cow milk compared to plant milk.
Hypotheses (H2).
The consumption of plant milk influences the evaluation of the product image of plant milk positively and the evaluation of cow milk negatively.
Hypotheses (H3).
There is a positive correlation between health consciousness and the evaluation of the product image of plant milk and a negative correlation between health consciousness and the evaluation of the product image of cow milk.
The product image analysis delivered first insights into the different perceptions of cow milk versus plant milk. The literature about the consumption of plant milk showed that most studies are dealing with the acceptance of plant milk in comparison to cow milk. However, there is still a lack of literature dealing with motives in connection with values of consumers and specific product attributes. This information was obtained from consumer interviews through a means-end chain analysis. Therefore, in the second, qualitative part of this study (Study 2: Means-End Chain Analysis), in depth qualitative interviews with two separate groups, cow milk and plant milk consumers, were applied. The corresponding research questions are:
RQ4.
Which motives are determining the consumption of plant milk in comparison to cow milk?
RQ5.
Are environmental aspects and animal-welfare important motives for the consumption of cow milk and plant milk?
Because of the qualitative and explorative nature of the second method, it is not possible to test hypotheses. In accordance with theory of science, the results of the qualitative interviews represent hypotheses.

4. Materials and Methods

This study consisted of a quantitative online survey of 1001 Austrian consumers (Study 1) and a qualitative study (Study 2) with one group of cow milk consumers (n = 30) and one group of plant milk consumers (n = 30).

4.1. Materials and Methods for Study 1

The intention of the quantitative online survey was to assess the product image of cow milk in comparison with plant milk, using the example of soy milk, in Austria. As we pointed out above, soy milk still has the biggest market share [60%] within the European plant milk market [28]. A market research institute collected the data, and the sample size amounted to n = 1001 valid cases. The total sample size of the survey amounted to 1018; 17 participants delivered incomplete data and were eliminated from the sample. The respondents were selected randomly by the market research institute out of a large online panel (in terms of socio-demographics, the online panel was representative of the Austrian population) and checked the sample in view of usual quotas (age, gender, education, household size). Of course, this is not a guarantee that the sample is representative of the Austrian population. The main part of the survey was the assessment of the image profile of cow milk versus soy milk. Soy milk served as a conceivable plant milk example, as it is—although declining—still by far the most important product category within the plant milk range [27]. The semantic differential measuring the product image contains 11-word pairs with converse meaning: fresh–preserved, healthy–unhealthy, good for bones–bad for bones, natural–artificial, digestible–indigestive, valuable–worthless, rich in minerals–poor in minerals, tastes good–tastes bad, light–fatty, energetic–powerless, allergy-free–allergenic. The items cover the product image of cow milk versus soy milk and were selected by a qualitative pre-study (interviews with students) and a number of expert interviews with professionals from the milk and dairy sector. To avoid order effects, the sequence of the items was randomized. The respondents of the online survey were asked to specify their rating for the left (positive) or right (negative) side of the semantic differential, based on a five-point Likert scale (with 1 = totally agree with item on the left side of the scale to 5 = totally agree with converse item on the right side of the scale). The respondents evaluated cow milk first, followed by the assessment of soy milk. Concerning H1, we assumed that there was a significant difference between the product image of cow milk compared with that of plant milk (tested on the example of soy milk).
Furthermore, we identified those people within the sample already consuming plant milk. We assumed that the consumption/non-consumption of plant milk will influence the evaluation of the product image of cow and plant milk (H2).
To test H3, we approximated the respondents’ health consciousness based on a simplified scale with six items. In contrast to other studies using, e.g., an 11-item scale to approximate health consciousness [67], we used a simplified six-item scale. The simplification of the scale was mainly due to shorten the length of the questionnaire, and to make it as easy as possible to answer the questions. Agreement/disagreement with the following statements was measured by a five-point Likert scale with 1 = totally agree to 5 = totally disagree:
  • I pay attention to a healthy diet.
  • I avoid alcohol.
  • I avoid cigarettes.
  • Regular consultations with doctors are important to me.
  • Regular physical training is important to me.
  • I am a health-conscious person.
The assessment of this variable is comparable to the health consciousness scale used in other studies [67,68]. Comparable to studies such as Schifferstein and Ophuist [69], we added general statements as well as very specific ones, including alcohol and cigarette consumption, in order to at least roughly approximate healthy versus unhealthy behavior.
To test Hypotheses 1 to 3, we will use a t-test and correlation analysis, including the bootstrap method, in order to further improve the reliability of the test results [65]. Bootstrapping is usually used when the standard normal distribution cannot be guaranteed. It is “a computationally intensive method that involves repeatedly sampling from the data set and estimating the indirect effect in each resampled data set” [65] (p. 80). Bootstrapping was developed in the 1970s and helps to further increase the reliability of analytical interpretations in quantitative research [70,71].

4.2. Materials and Methods for Study 2

After the product image analysis, we analyzed the motivational structure of cow milk and plant milk consumers using a qualitative study design. The qualitative interviews followed the laddering technique and means-end chain analysis [72,73]. Reynolds und Olson showed that 20 interviews for one subgroup of consumers are sufficient to generate reliable conclusions with means-end chain analysis [74]. The interviews took place in September 2018. The basic assumption of the means-end chain analysis is that consumers make their product choices based on their own values of life. A simple example is that consumers choose healthy food products because health is an important value in their life. It is further assumed that consumers are aware that these choices can have positive or negative consequences (functional or psychosocial), which can be related to specific product attributes. A high content in sugar can have, for example, a negative consequence on health. Laddering interviews are a useful technique to elicit these structures by asking consumers which product attributes are important for them when they buy a specific product [75]. After generating this list of product attributes, the interviewer uses each attribute to ask why each one is important. The answers to these repeated questions identify consequences of product choice and finally lead to the underlying values [76]. By repeating this process, the interviewer identifies for each respondent specific motivational “ladders”, which, in total, display the hierarchical value map of one respondent. By combining the hierarchical value maps of all of the interviewees, it is possible to visualize the motivational/cognitive structure of a specific consumer group. Often, it is not clear if laddering interviews collect more of the cognitive or the motivational part of a consumer decision [77]. The majority of studies in the field of food consumption claim to measure primarily the motivational structure [76].
There are different ways to generate the list of product attributes necessary to start the laddering interviews. Triadic sorting or free sorting provides the interviewee with a list of objects that he has to sort to identify commonalities or differences. Another approach is free elicitation, a method we used for our study. We asked the interviewees to name the product attributes that come to their mind when they think about buying/consuming plant milk or cow milk. This free elicitation generated a list of product attributes, which could contain for each interviewee a different number and different kinds of attributes. We further applied the soft laddering technique, which aims to disrupt the “answering flow” as little as possible. Hard laddering is a paper-and-pencil method, with predefined product attributes, and it is normally applied for bigger samples, but with fewer options to go in-depth [76].
Due to the fact that laddering interviews can take between 30 and 45 min, it is important to make the interviews occur in a relaxed situation, where consumers are not put under time pressure. The interviewees for the cow milk interviews were people relaxing in public parks in Vienna. We took a convenience sample, with the following restrictions. The interviewees in the cow milk sample had to consume cow milk more frequently than plant milk and at least twice a week. The subjects in the plant milk sample had to consume plant milk more frequently than cow milk, also at least twice a week. Besides those conditions, all male and female interviewees between 18 and 69 years, living in Vienna, represented potential interviewees.
It was difficult to find enough plant milk consumers in the public parks. Hence, we tried to find interviewees in organic supermarkets and health food stores, but there, the consumers were not willing to participate in the interviews due to time pressure. To find interviewees, advertisements in the Facebook groups “Wien Vegan 2.0” and “Lactose Free” were more successful. We interviewed the consumers, who responded to these advertisements in Viennese coffee bars. We used the same questionnaire for both consumer groups, with the laddering part focused either on plant milk or cow milk. The questionnaire also contained a series of questions about triggers for the consumption, the main use of the product, and food intolerances or food allergies. The laddering interviews were recorded after the interviewees gave their consent. The laddering interviews were coded into attributes, consequences, and values, and then were further analyzed with the software LadderUX to derive the implication matrices and hierarchical value maps.

5. Results

5.1. Study 1: Results of the Product Image Analysis

5.1.1. Sample Description of the Product Image Analysis

1001 subjects delivered valid data for the product image analysis. Compared with the overall Austrian population, the sample had a similar structure. Deviations can be found with the variables “education level” (less educated sample) and “household size” (sample contains less singles and more households with more than three people; Table 1). The sample is also slightly biased in terms of age (younger sample). However, because of the widely comparable structure of the sample and the random selection of respondents, the results of the product image analysis are considered to provide a realistic picture of the Austrian population.
Within the sample of n = 1001, 9% didn’tdid not drink cow milk or use it for cooking, baking, etc. (the majority of them areconsumed neither consuming cow nor plant milk). Over 90% of all of the respondents were drinking or using cow milk, 73% of them on a daily basis and a further 20% several times a week. The rest of the cow milk consumers within the sample using it more seldomless frequently amounted to less than 7%. The respondents were asked whether and which plant milk products they includeincluded in their diet; 5% stated that they consume plant milk products, mainly soy milk (in addition to cow milk or solely). This is an important result for our study, because we assumeassumed that the consumption/non-consumption of plant milk will influence the image profile of the respondents, as pointed out in Hypothesis 2 above. The 5% share of the sample more or less correspondscorresponded to the real market-share approximations found in the literature [13]. In Section 2, we showed that the market share in Europe is approximately 4%; using the bootstrap method—confirming the literature with 1000 randomly selected bootstrap samples [65]—the 95% confidence interval amounts from 3.6% to 6.2%.

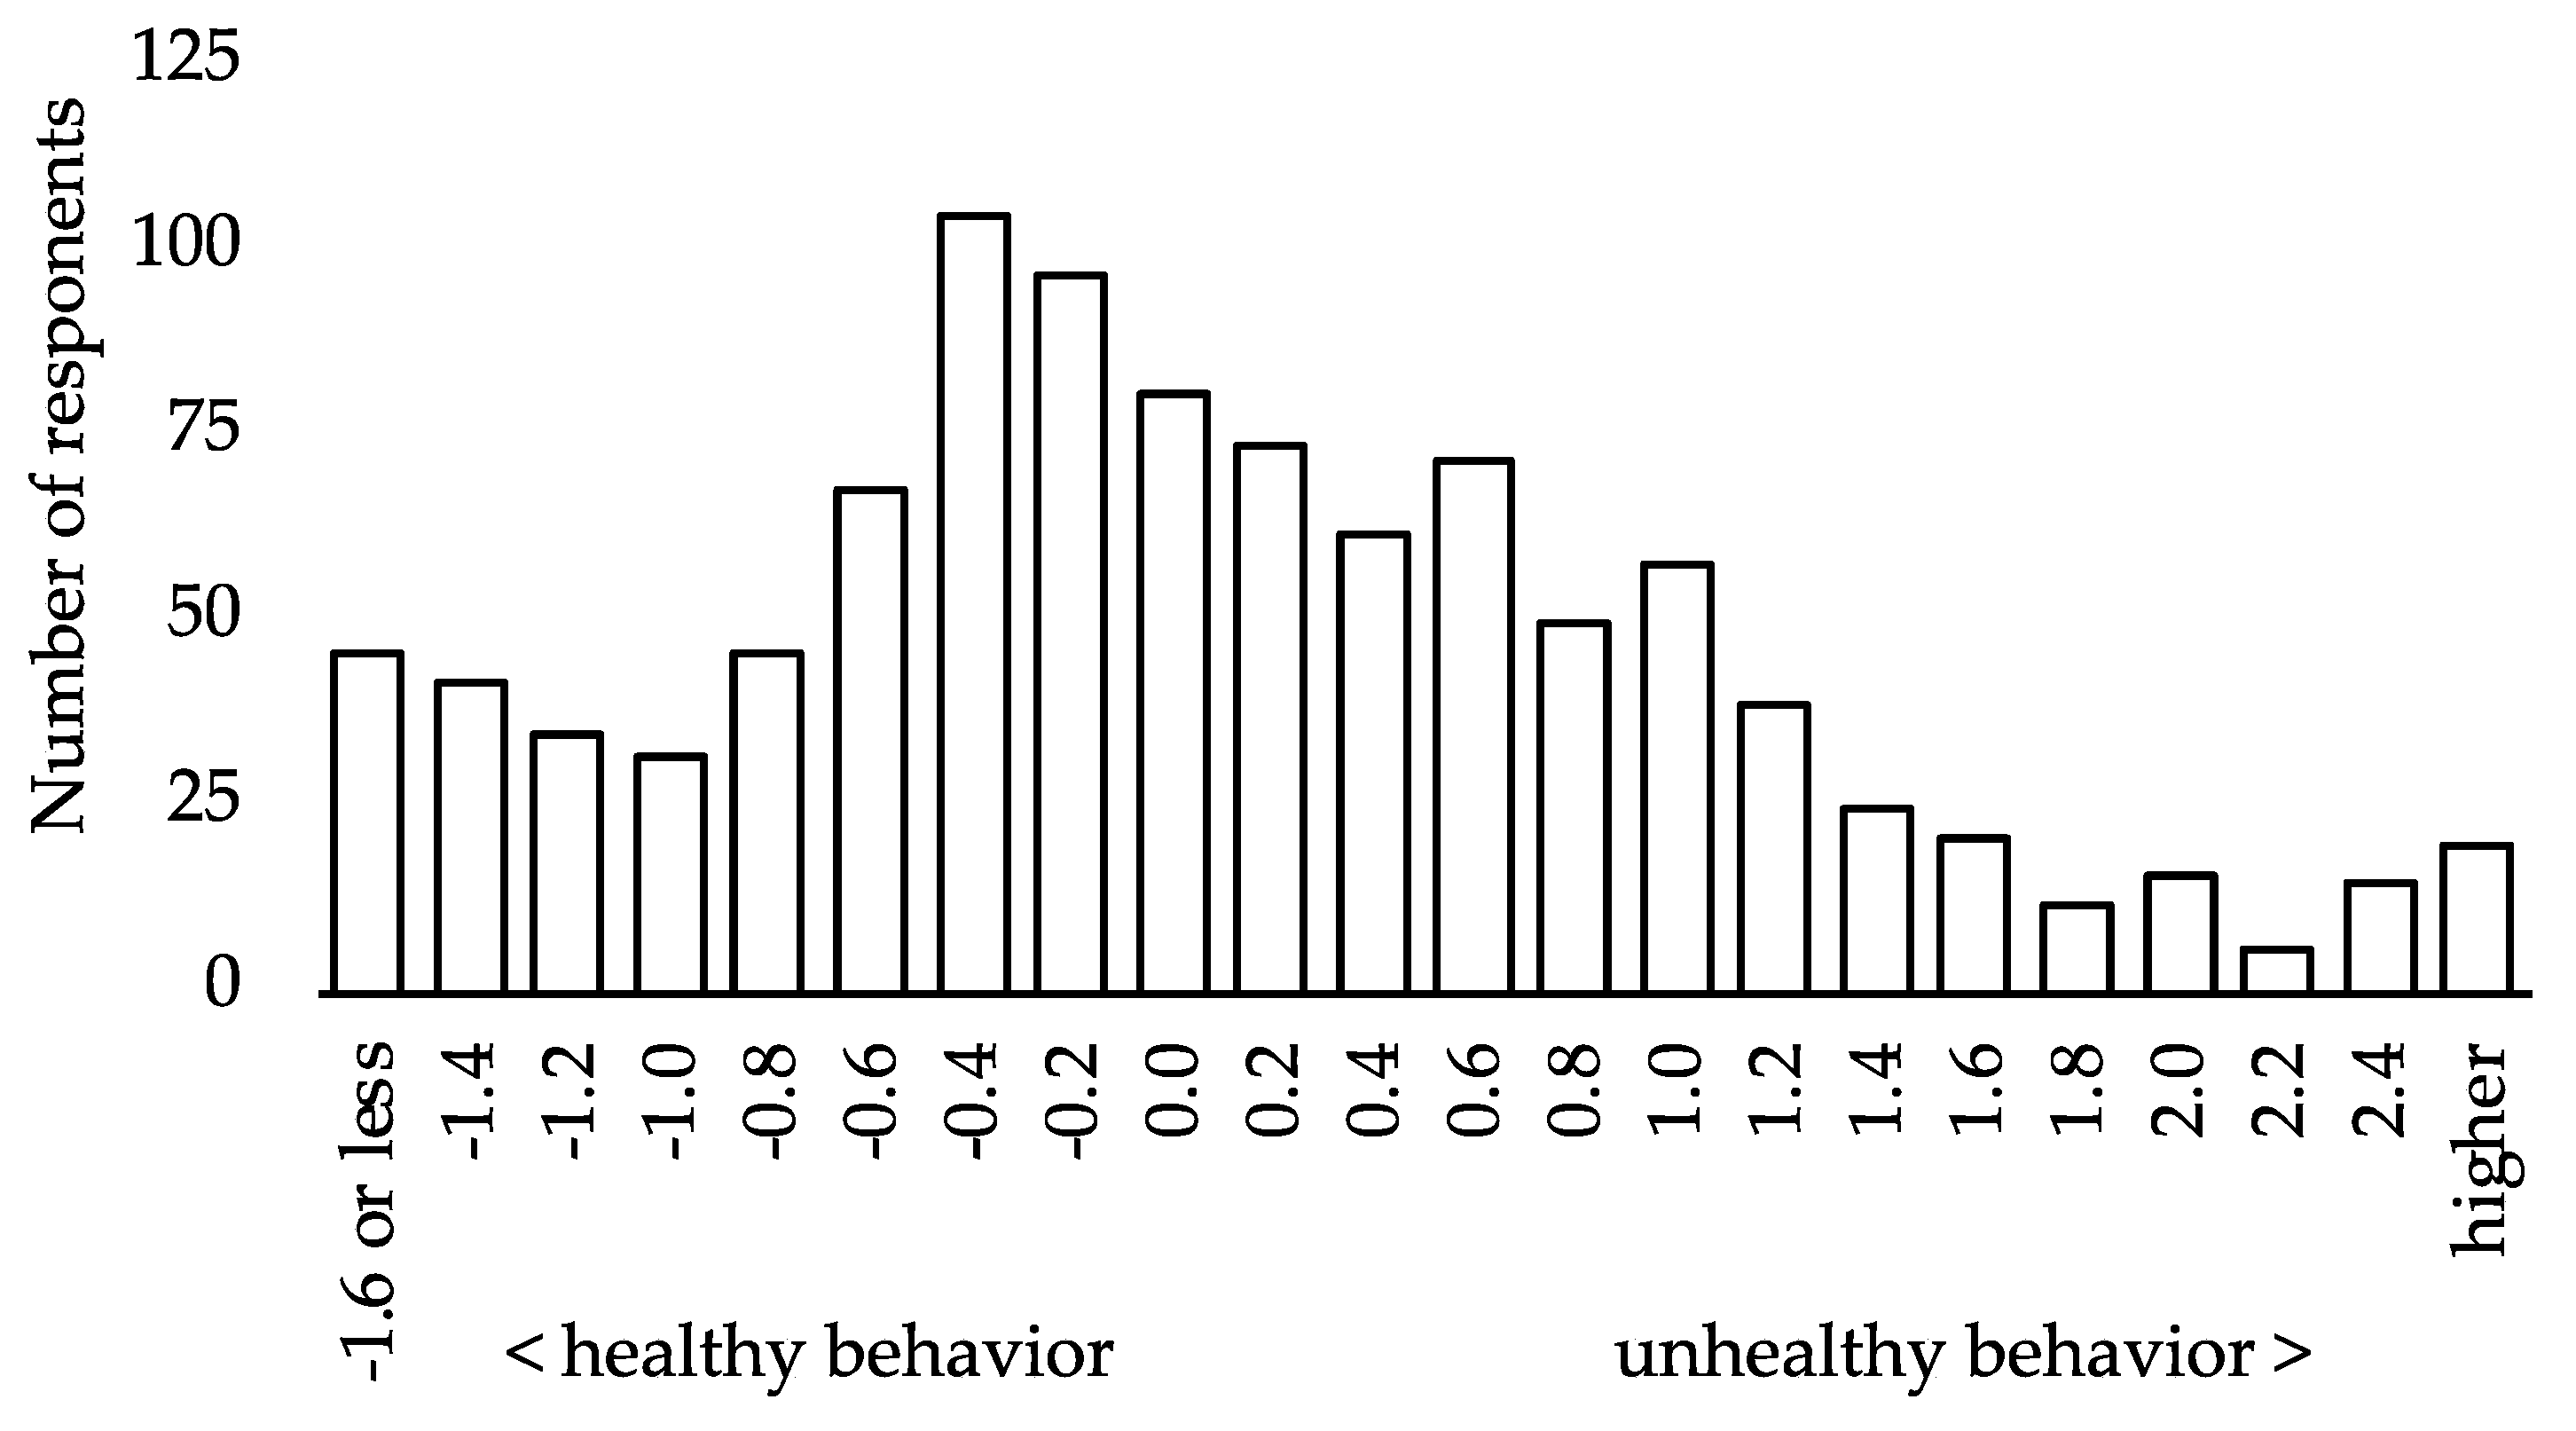
5.1.2. Health Consciousness

To evaluate the validity of our (simplified) measurement approach of health consciousness with six health-related statements, we checked the scale by means of factor analysis (principal component analysis). The mean of the six health-related statements varies between 2.14 and 2.57. As a matter of fact, based on the eigenvalue = 1 criterion, all of the statements can be aggregated to one dimension (health consciousness factor). Cronbach’s Alpha amounts to 0.726, which is above 0.7 and therefore acceptable. It would not be higher if one or more items were excluded from the scale. Concerning the individual statements, the MSA (measure of sampling adequacy) lies between 0.71 and 0.90; the KMO (Kaiser-Meyer-Olkin criterion) amounts to 0.77, proving the suitability of the variables to be aggregated. 46.7% of the variance can be explained by the factor extraction. Furthermore, the component matrix contains factor loadings between 0.52 and 0.87 (i.e., correlations between the variable and the factor). Based on these analytical results, we aggregated the scale to one dimension, the health factor Hx. Figure 1 shows the distribution of the factor values of Hx for our sample (approximated by means of regression analysis).
The left, negative side of Figure 1 reflects healthier behavior (due to positive factor loadings of Hx and initial values, whereby lower numbers represent a higher agreement with statements). This only reflects a general tendency; we cannot figure out the point from which respondents behave in a healthy or unhealthy manner. We only assume that a general tendency to the left side of the graph reflects healthier behavior of respondents and, to the right side, unhealthier behavior. About 54% of all respondents show an Hx below the mean of 0. This could be the group of people with a healthier behavior. In Hypothesis 3, we will test if Hx influences the evaluation of the product image of cow milk and soy milk.

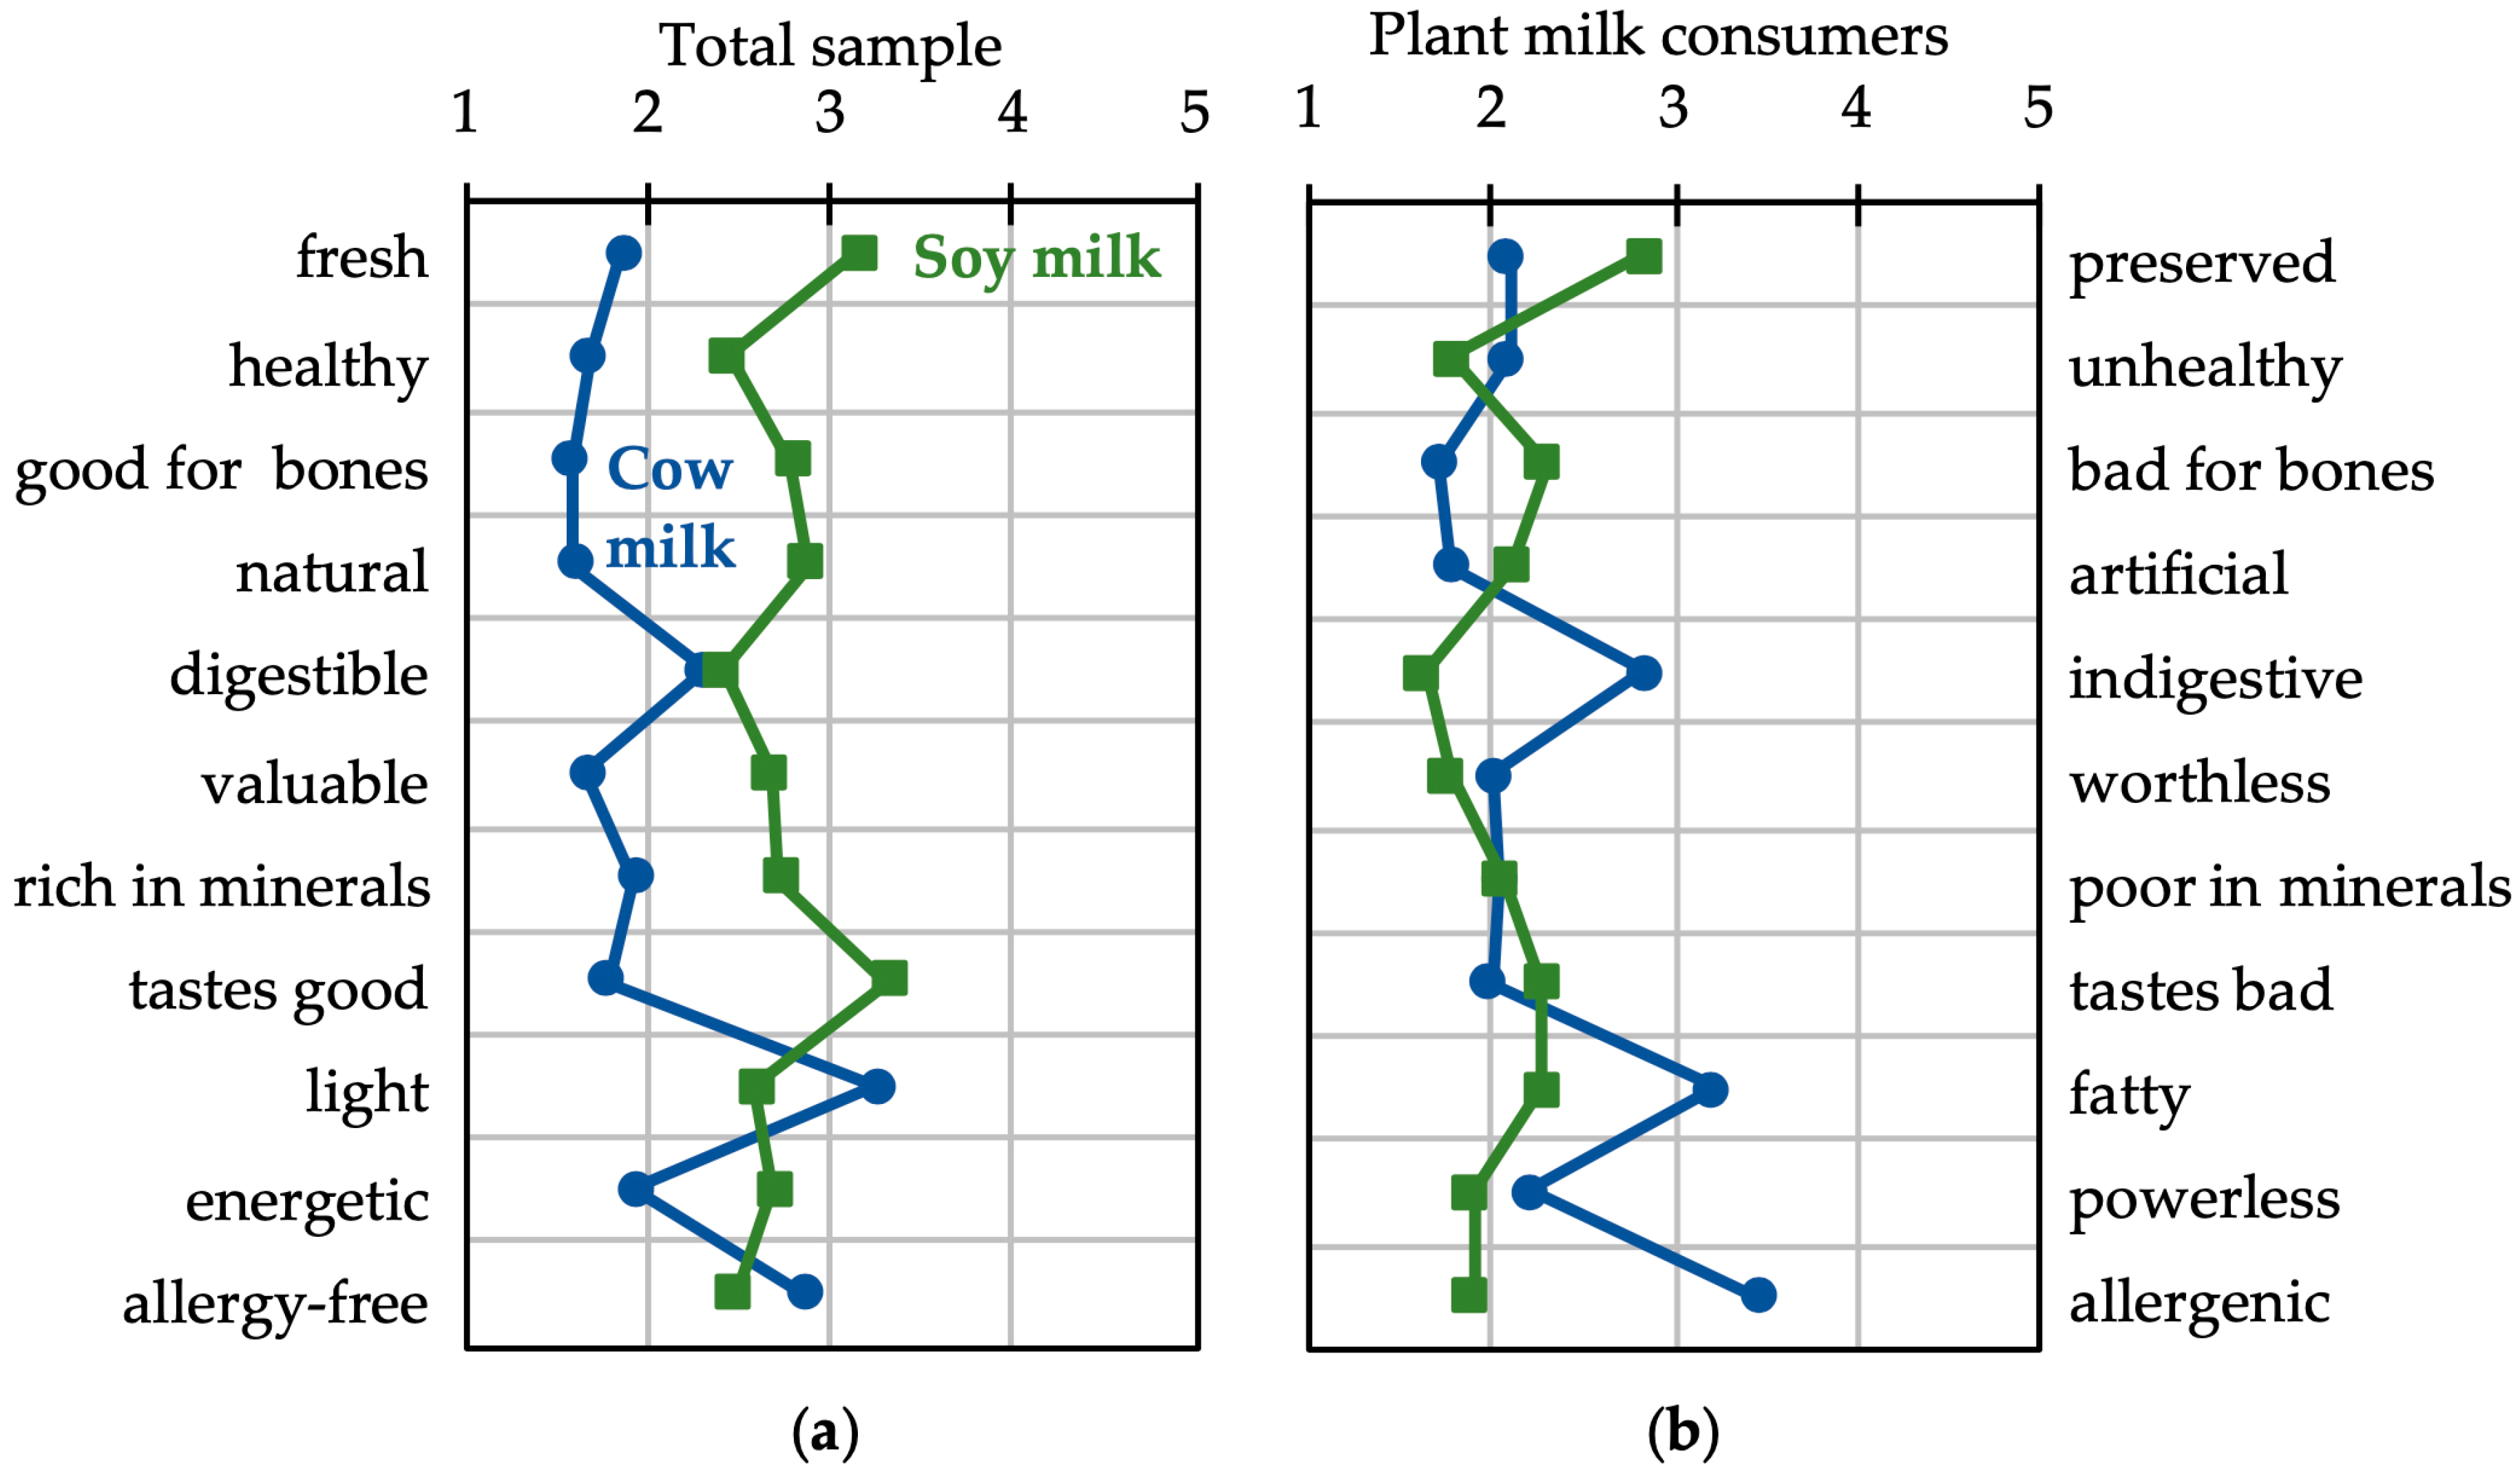
5.1.3. Product Image Analysis

Based on the results of the image profile of all of the respondents (n = 1001), cow milk was evaluated to be fresher, healthier, better for bones, richer in minerals, etc. (Figure 2). In view of digestibility, both product categories were evaluated to be almost equal; only with respect to energy content (lighter, less fatty) and allergic potential (less allergenic), soy milk was evaluated to be superior to cow milk. We aggregated the 11-item scale to one product image index Ix (by building the sum and normalizing the sum on a 1-0 scale, where 1 means the most positive product image, total agreement with the left side of the scale—fresh, healthy, etc.—and 0 means the most negative product image, total agreement with the right side of the scale—preserved, unhealthy, etc.). Again, the distribution and mean of Ix (Figure A1 in Appendix A) clearly show that cow milk has a much more positive product image compared with soy milk (mean of cow milk (M) = 0.741, standard deviation (SD) = 0.151; soy milk M = 0.566, SD = 0.182).
Test of Hypothesis 1: The differences were tested by means of a paired sample t-test including bootstrap sampling with 1000 random bootstrap samples (Table 2). All of the differences were significant, and most of them were considerable; on average, cow milk was partly evaluated to outrank soy milk by 1 Likert scale point (or even more). The biggest differences can be found in taste (with a difference of the mean Md = −1.558; standard error SE = 0.048; t = −32.68; p = 0.001), naturalness (Md = −1.269; SE = 0.042; t = −30.20; p = 0.001), and goodness for bones (Md = −1.219; SE = 0.033 t = −36.85; p = 0.001). Cow milk clearly outperforms soy milk; its product image is significantly more positive compared with soy milk, with two interesting exceptions: energy content and allergic potential. In view of these attributes, soy milk was evaluated slightly better. Comparing the 1-0 product image index Ix between cow and soy milk using bootstrapping clearly supports the significance of the difference: Md = 0.175; SE = 0.007; t = 24.66; p = 0.001 (95% confidence interval 0.160 to 0.189). However, the overall assessment of the product image changes if only soy milk consumers are analyzed (theoretically assumed in Hypothesis 2). This result is visualized in Figure 2b and will be analytically tested below.
Test of Hypothesis 2: To analyze the deviations between the consumers of plant milk and the non-consumers, we performed an independent samples t-test including the bootstrap method with 1000 random bootstrap samples. The differences between the mean M of non-consumers (n = 951) and consumers (n = 50) of plant milk are tested to be zero for both categories, cow milk and soy milk. The image profile of plant milk consumers can be taken from Figure 2b, and the image profile of non-consumers widely corresponds to Figure 2a. As we can see from the graph, the deviations seem to be smaller for cow milk than for soy milk. The t-test with bootstrapping shows that non-consumers evaluated cow milk as being significantly less healthy (Md = 0.442; SE = 0.164; t = 2.728; p = 0.009). Based on the five-point Likert scale, a positive deviation means less agreement with healthy and more agreement with unhealthy. In comparison to non-consumers, cow milk was considered by plant milk consumers to be less digestible (Md = +0.560; SE = 0.170; t = 4.010; p = 0.003), less valuable (Md = +0.379; SE = 0.154; t = 3.261; p = 0.017), less energetic (Md = +0.301; SE = 0.158; t = 1.918; p = 0.048), and less allergy-free (Md = +0.635; SE = 0.169; t = 3.788; p = 0.002). All of the other differences between the semantic items of the image profile of cow milk between non-consumers and consumers of plant milk are not significant (Table A1 in Appendix A).
The differences in the evaluation of the image profile for soy milk were even larger: for all of the semantic items despite the first one, fresh, Md is significant; consumers evaluated soy milk to be healthier, good for bones, natural, rich in minerals, etc. All of the deviations were negative based on our five-point Likert scale. Therefore, consumers of plant milk evaluated soy milk better than non-consumers. On an aggregated level, plant milk consumers assessed Ix of cow milk (M = 0.670) even lower than Ix of soy milk (M = 0.730), a clear contradiction to the assessment of non-consumers. All of the differences are significant (Table 3).
Based on these results, Hypothesis 2 is clearly supported: the consumption of plant milk influences the evaluation of the product image of plant milk positively (shown via the example of soy milk) and the evaluation of cow milk negatively.
Test of Hypothesis 3: As we pointed out above, we assumed that the assessment of the product image of plant milk will probably be influenced by the health consciousness of the respondents. Healthier behavior might influence the product image of plant milk positively and that of cow milk negatively. To test Hypothesis 3, the effects of the health factor Hx (Section 5.1.2) will be correlated with each item of the product image analysis and with the product image index Ix. If there is a significant and considerable correlation between these variables, we will further analyze if Hx is a mediator variable for the product image assessment [65]. The correlation analysis between the items of the product image scale and Hx and between Ix and Hx are all positive and significant. However, all correlation coefficients were low (we calculated both Pearsons’ r and non-parametric Spearman-Rho; Table A2 in Appendix A); even the upper limit of the bootstrap 95% confidence interval was usually below 0.25. The effect of Hx seems to be negligible. An explanatory regression analysis showed that only about 3–5% of the variance of the independent variables Ix for cow/soy milk can be explained by Hx (cow milk: R2 = 0.048; soy milk: R2 = 0.029). Because of the low explanatory power of Hx, we rejected Hypothesis 3, which states that the health consciousness influences the assessment of the product image of cow and soy milk.
To sum up, we see that, in general, cow milk still has a more positive product image compared to plant milk (H1). However, the product image highly depends on the consumption versus non-consumption of plant milk (H2), and health-consciousness of consumers does not influence the product image assessment (H3).

5.2. Results of the Means-End Chain Analysis

5.2.1. Sample Description of Means-End Chain Analysis

In the plant milk sample (n = 30), 83% were females and only 17% male consumers (Table A3 in Appendix A). It is not completely clear if this was due to a lower willingness of male interviewees to participate in the study or if fewer men consume plant milk. 37% of the interviewees were vegetarians, 23% vegan, 23% omnivores, and 17% flexitarians.
In the cow milk sample, 60% of the 30 interviewees were female, and 40% were male. There was a rather low participation rate in the age group from 50 to 69 years. The interviewees in that age group, who declined to participate, mentioned that they stopped using cow milk because they believe to be lactose intolerant. In the cow milk sample, 70% were omnivores, 23% defined themselves as flexitarians, and 7% were vegetarians.
All plant milk interviewees named a trigger for the consumption of plant milk. Most frequently, they named the switch to a vegetarian or vegan diet, a reduced tolerance for cow milk, and curiosity (each with n = 7). Other triggers were a change to a healthier lifestyle (n = 5), knowledge about abuse in animal husbandry (n = 4), and the negative environmental consequences of milk production (n = 4). The recommendation of friends (n = 3) and a greater supply in supermarkets (n = 3) were the least frequently mentioned triggers.
The interviewees in the plant milk sample were also asked about the main uses of plant milk and if they consume cow milk at all, and if not, why. The most mentioned use of plant milk was for coffee (n = 14) and cooking (n = 14), then as a drink (n = 13), for cereals (n = 10) or for oat meal (n = 8). 17 of 30 plant milk consumers used cow milk occasionally. The main reason to consume cow milk occasionally was its good taste in coffee (some mentioned they miss the taste and consistency of cow milk in coffee). The main reasons to not consume cow milk at all were the “suffering of animals” (n = 7), “it is hard to digest” (n = 5), “the production is bad for the environment” (n = 4), “milk is not healthy” (n = 4), and “milk does not taste good” (n = 4).
The interviewees in the cow milk sample also reported as main use for cow milk coffee (n = 23), followed by cooking (n = 12), cereals (n = 11), baking (n = 8), for chocolate beverages (n = 8) and as drinking milk (n = 8). 13 of 30 cow milk consumers use plant milk occasionally. The main reason to consume plant milk was to try something new. The main reasons to not consume plant milk at all were its taste (n = 11), no interest (n = 6), cow milk is more natural (n = 2), and habit (n = 2).
Figure A2 in the Appendix A depicts the number of interviewees in the plant milk sample (12 of 30 interviewees) with reported food intolerances or food allergies. Most frequently, they reported food intolerance (lactose, milk protein, neurodermitis, and histamines). All of the mentioned food intolerances are related to milk consumption or cheese (milk is low in histamines, but ripened cheese can be high in histamines) consumption. Some interviewees also mentioned stone fruit, wheat, and cod fish intolerance. In the cow milk sample, only four of the 30 interviewees mentioned food intolerances, and none of them were directly related to milk. Two mentioned gluten intolerance, one histamine intolerance, and one stone fruit intolerance.

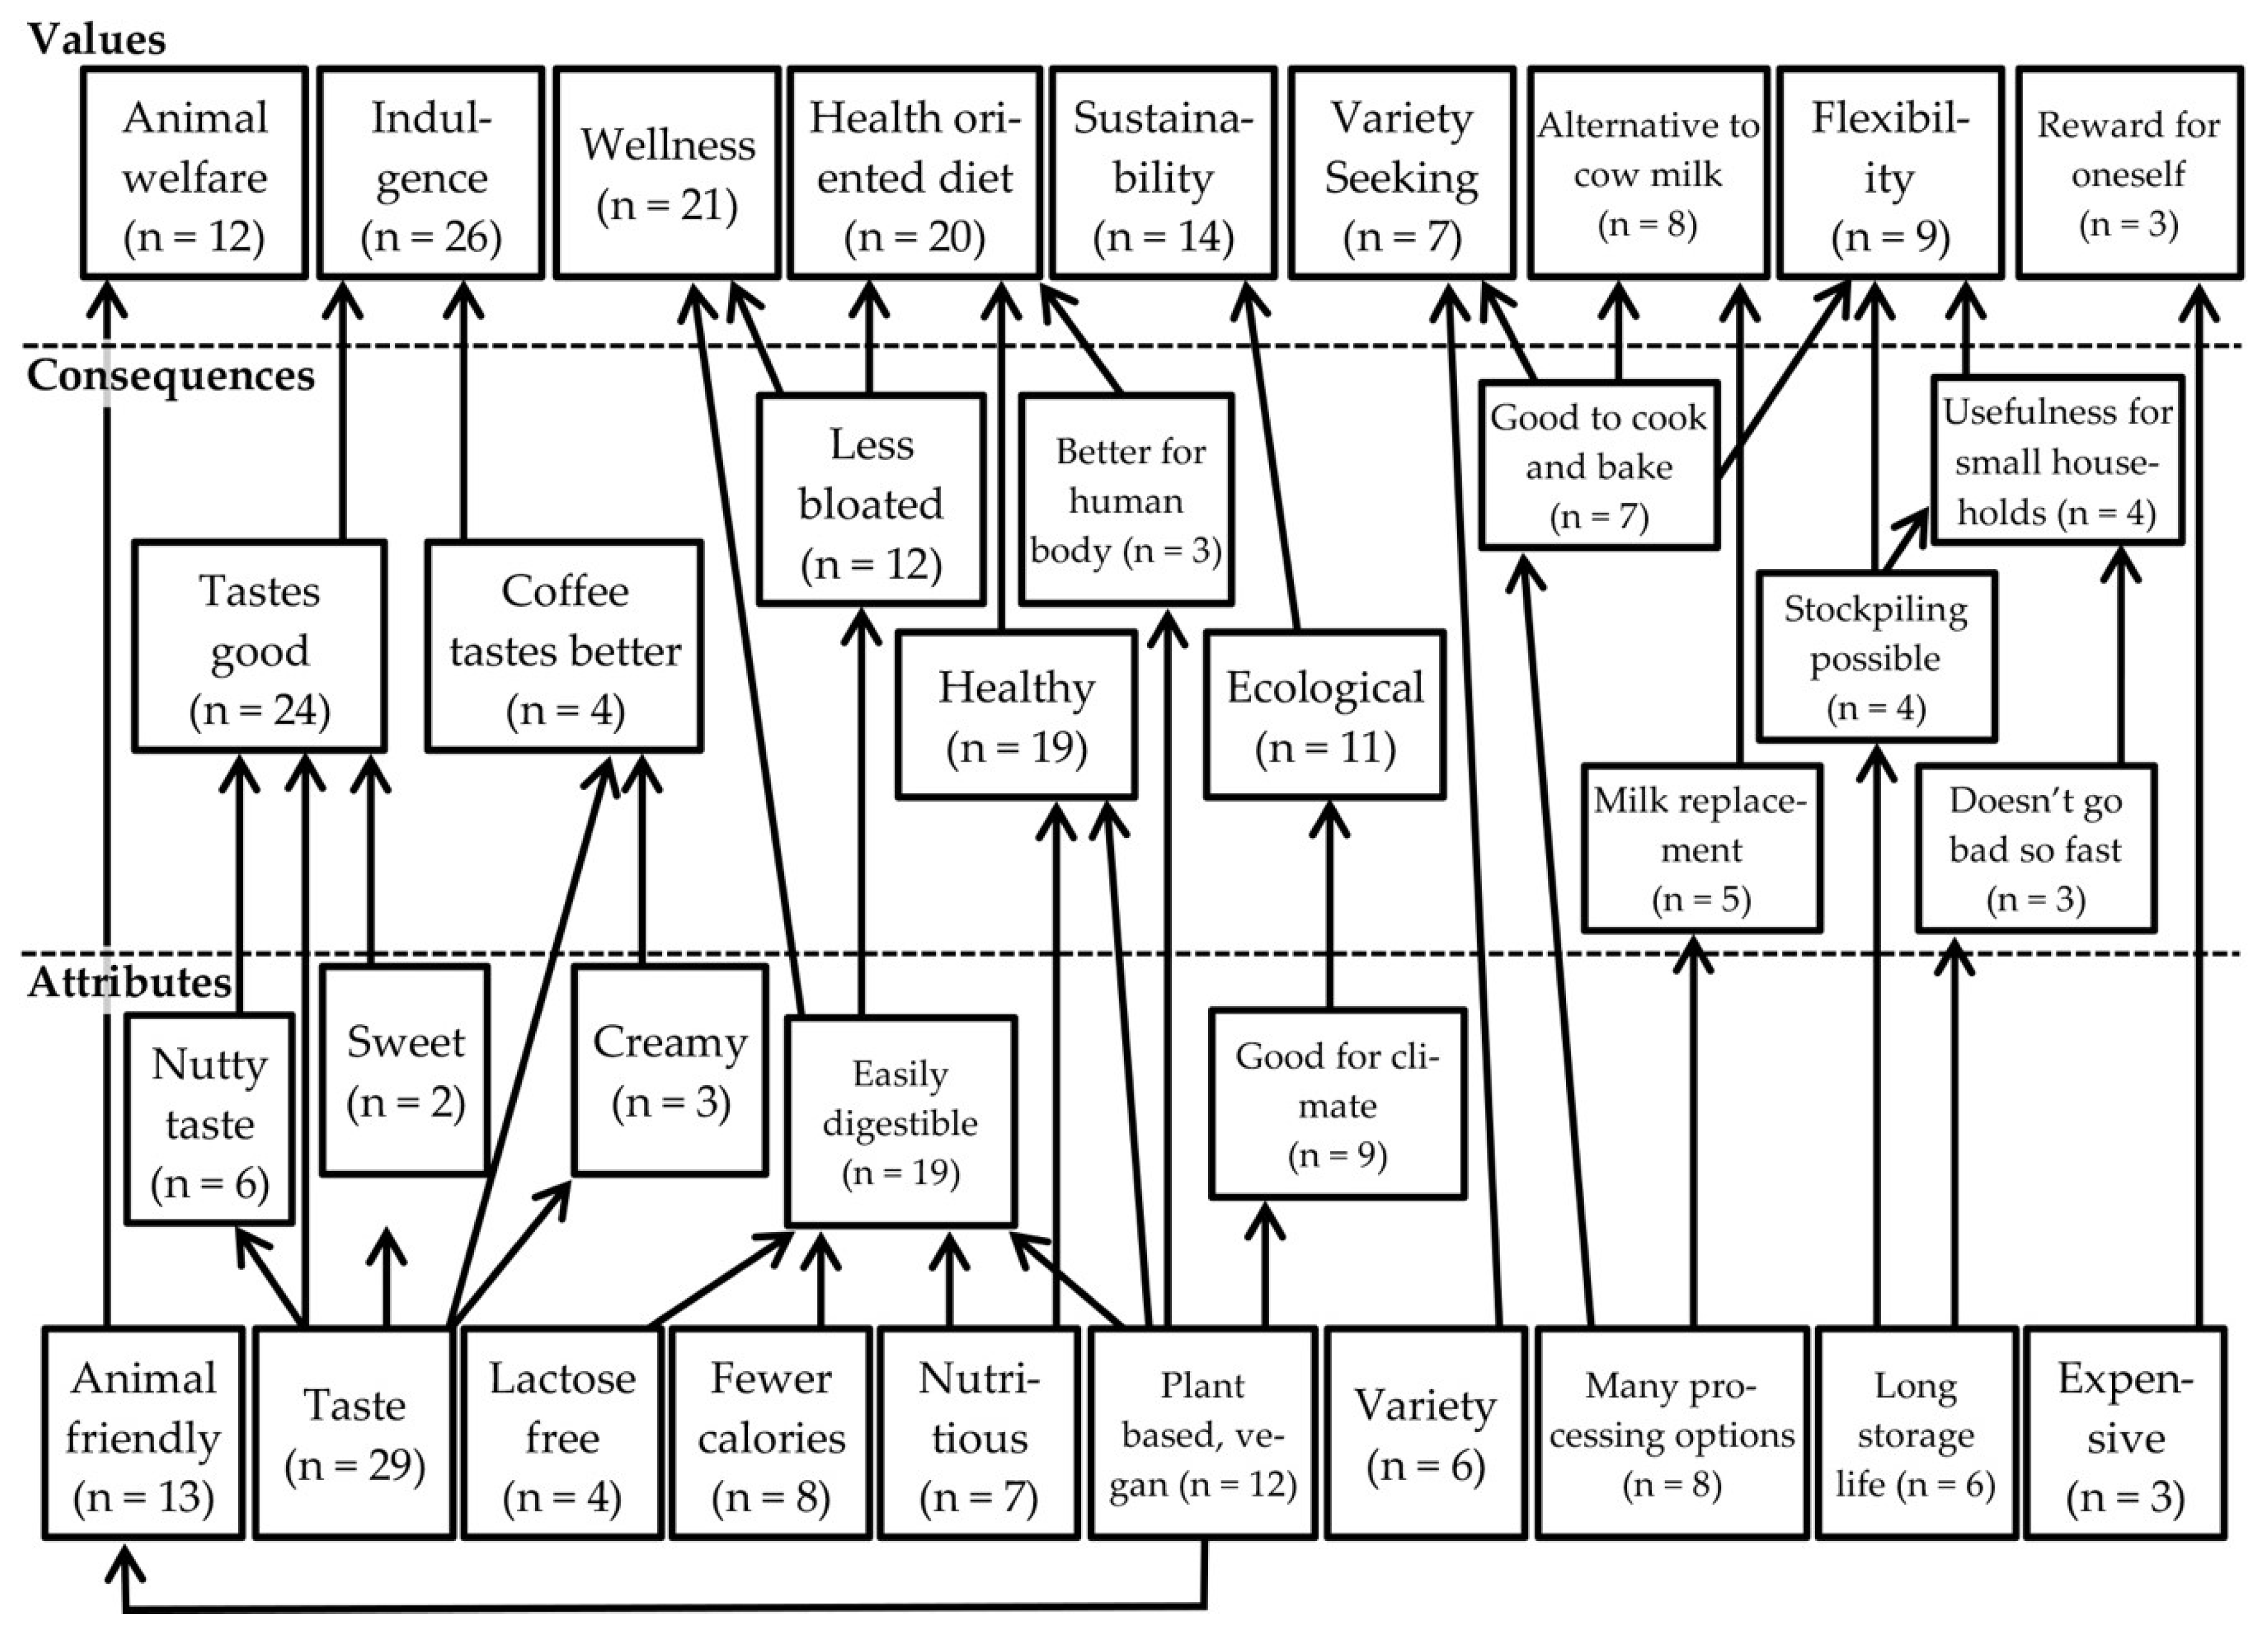
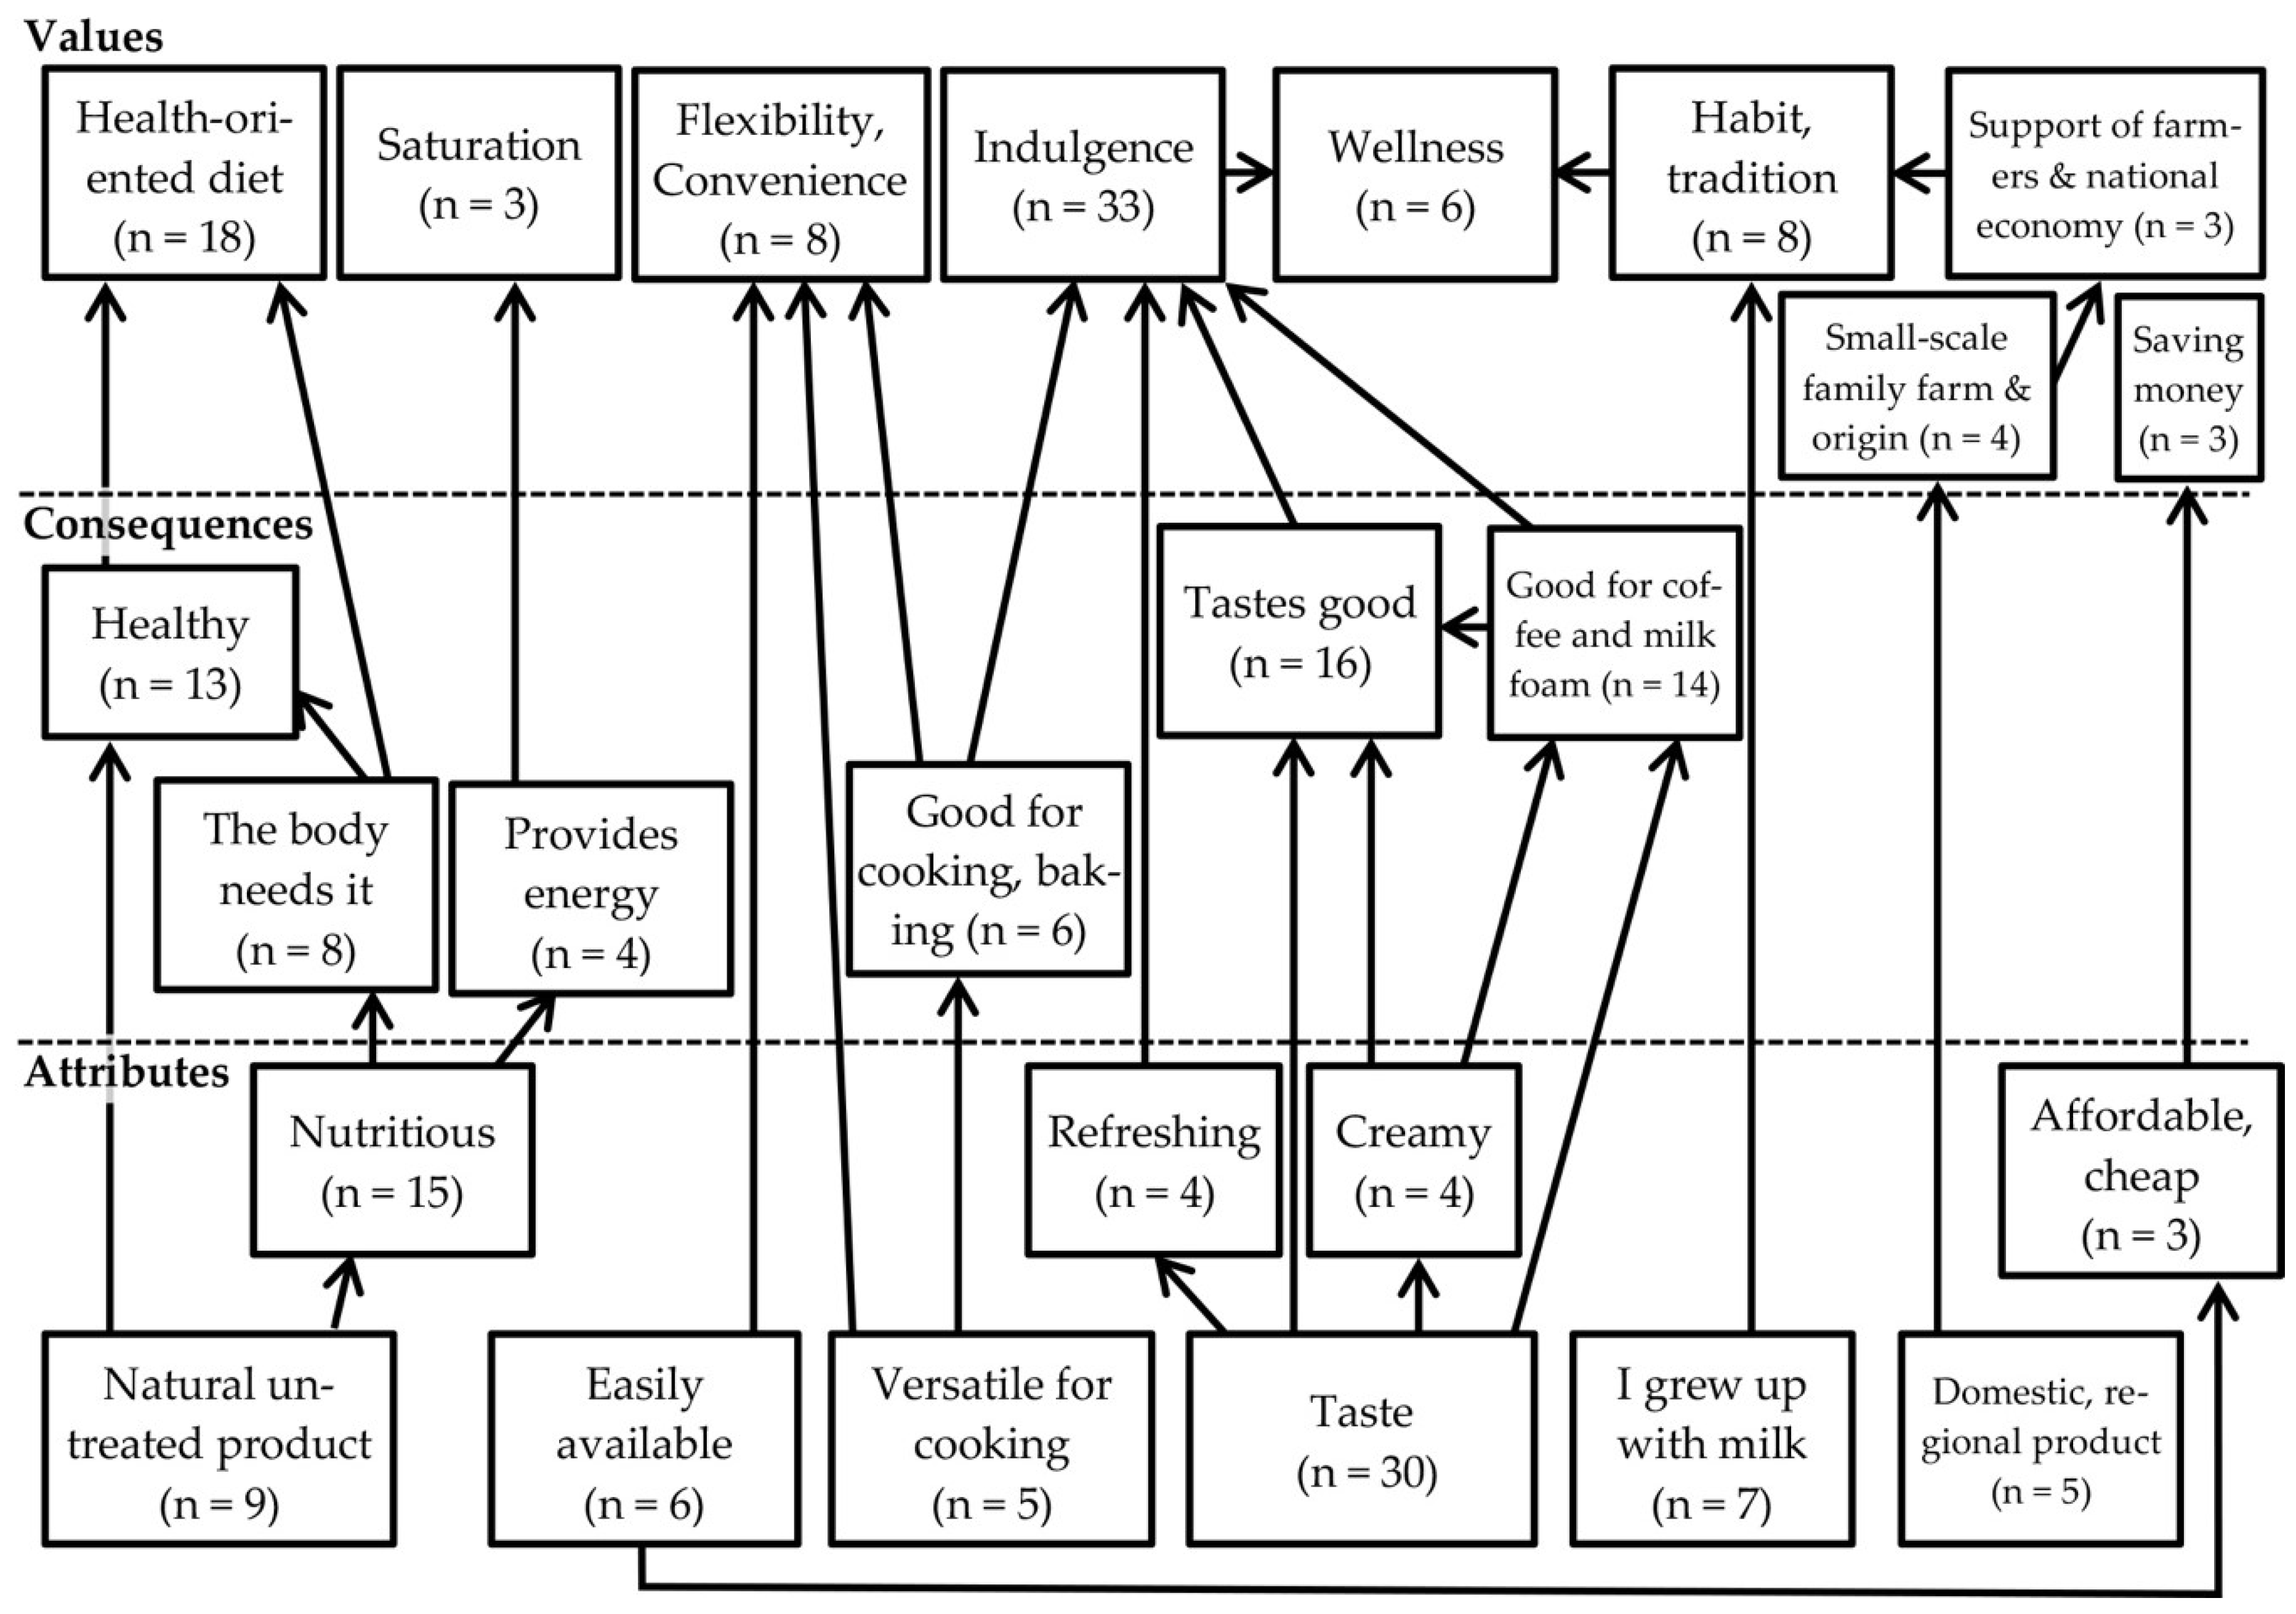
5.2.2. Means-End Chain Analysis

Figure 3 displays the hierarchical value maps (HVM) of plant milk consumers. We used a cut-off level of 2 to improve the readability and clarity of the HVM. The elicited product attributes are on the lowest level of the chart, followed by the functional and psychosocial consequences and the values of the interviewees on the top level. In total, the HVM contained 15 product attributes, 11 consequences, and nine values. Based on the frequencies of the mentioned values, we identified the following ladders:
  • The indulgence ladder.
  • The health ladder and wellness ladder.
  • The environmental ladder.
  • The animal welfare ladder.
  • The variety/flexibility ladder.
  • The price ladder.
The indulgence ladder started with the attribute taste”, leading to the consequences ”creamy”, “sweet”, and “nutty taste”, ending in the indulgence value (see Figure 3). The health and wellness ladder consisted of the attributes nutritious”, ”plant-based/vegan”, “lactose-free”, and “fewer calories”. The attributes led to the consequences “easily digestible”, “less bloated”, “better for human body”, and “healthy”. Those consequences were connected with the values of a health-oriented diet and wellness. The “environmental” ladder followed the motivational ladder of “plant-based/vegan” to the attribute “good for climate” and “ecological”, and resulted in the value of “sustainability”. The “animal welfare” ladder was connected to the attribute “plant-based/vegan”, leading from the product attribute “animal friendly” directly to the value of animal welfare.
Besides these four dominant ladders, there was the variety/flexibility ladder, which contains “many processing options” and “good to cook and bake”. Interestingly, in the flexibility ladder, the interviewees saw “a usefulness for small households”, because “stockpiling is possible”, since “it does not go bad so fast”. The final ladder with the least mentioned attribute (“expensive”) reflected the higher prices of plant milk, seeing the expense for this product as a reward for oneself.
Figure 4 shows the HVM for cow milk consumers and contains 10 product attributes, six consequences, and nine values. Again, we applied a cut-off level of 2 to improve the readability and clarity of the HVM. The structure of the HVM for cow milk was simpler and less elaborate than the plant milk HVM. The interviews for cow milk also took significantly less time, probably because the respondents did not see cow milk as a high-involvement product. We identified the following dominant ladders for cow milk consumption:
  • The indulgence ladder (with a wellness aspect).
  • The health ladder.
  • The flexibility/convenience ladder.
  • The habit/tradition ladder.
  • The support farmers and national economy ladder.
The indulgence ladder (with a wellness aspect) in the cow milk HVM started with the dominant attribute “taste”, with a strong connection to the consequences “better taste”, and “good for coffee and milk foam”. Cow milk was perceived as “refreshing”, and “creamy”. Some of the cow milk interviewees connected the value of indulgence with wellness. The “health ladder” started with the attribute “natural, untreated product”, an attribute mentioned by almost a third of the cow milk sample. The “flexibility/convenience ladder” was based on the attributes “easily available” and “versatile for cooking”, which showed that cow milk is one of the basic ingredients for cooking in Austrian households. The habit/tradition ladder started with the attribute “childhood memories” (“I grew up with milk”) and led directly to the value “habit/tradition”. Interestingly, there was a connection with the support farmers and national economy ladder. This ladder reflected the importance of a domestic, regional origin of cow milk for the consumers. The interviewees connected the domestic, regional character with the values of “small-scale production of family farms”, and the “support of Austrian farmers and the national economy”.

6. Discussion and Conclusions

6.1. Discussion About Product Image Analysis

To get more reliable results, the product image analysis tested differences between cow milk and plant milk perception with the bootstrap method, as suggested in the literature research [65,70,71]. The analytical approach is commonly used, e.g., for experimental designs [69]. In this paper, the original study design was not primarily an experimental one; however, as shown in testing Hypothesis 2, a field experiment design was used in order to investigate the influence of the consumption versus non-consumption of plant milk on the product image assessment (which could be confirmed). Altogether, the product image analysis delivered valuable and partly unexpected results: in general, cow milk still seems to have a product image of a healthy, natural, and valuable part of our diet, which is comparable to findings from literature [17]. It is necessary for our bones, tastes good, and delivers minerals. The product image of soy milk is, except for two items, more negatively evaluated than cow milk, which is surprising, as it is, in fact, a plant-based alternative that might be considered to meet a healthier diet [9,10,11]. For example, despite the fact that the raw material of soy milk is plant-based, soy milk is not seen as a natural product, in particular, compared to cow milk. This result is in accordance with previous studies [18,20]. The “non-natural” image of soy milk might be due to the common practice to add vitamins, minerals, etc. [13].
The assessment of the image profiles showed considerable differences. The relevant Hypothesis 1 that there are significant differences in the assessment of the product image of cow milk compared to soy milk could be confirmed.
Although there has been more and more critical discussion in the media about the healthy product image of milk (and about the health benefits of milk) [6,7], the positive consumers’ opinion about cow milk seems to be persistent and is also comparable to the healthy product image of milk in other studies [17,18,19,43]. We rather expected, from an environmental point of view, that plant-based substitutes would be at least evaluated to be equal, and for some of the milk characteristics, even better. The negative environmental impacts of the dairy sector on soil, water, air, and biodiversity are well-documented [3,32,33,34]. Combined with the negative media headlines, one could expect to find this reflected in a less favorable product image of cow milk. One reason for the positive cow milk image could be that there were only 5% of plant milk consumers in the sample of the product image analysis. Previous studies with a majority of cow milk users found also a preference of cow milk over soy milk [17,18,19]. However, on the other hand, this corresponds with the market reality, with a market share of 4% for plant milk in Europe [13]. Another reason could be that the mainstream of consumers is unfazed or simply do not pay attention to the negative reports about cow milk. McCarthy et al. [20] found that consumers see cow milk as a staple food and consume it out of habit. A staple food is a necessity of everyday life and, one could argue, consumers maintain a positive product image by ignoring negative media reports to avoid cognitive dissonance when consuming cow milk.
Based on our results, the only attributes where the product image of plant milk is better rated than that of cow milk are for energy content (less fatty) and allergic potential (less allergenic). This corresponds to findings from other authors, where food intolerances are a trigger to switch to plant milk [50,51], and where the fat and energy content of cow milk were negatively perceived [42]. Product experience seems to be highly relevant here. In Hypothesis 2, we assumed that the consumption of plant milk influences the evaluation of the product image of plant milk positively and the evaluation of cow milk negatively. H2 could be confirmed. This is not really surprising, as we know from literature that familiarity with a food product is a key factor for product acceptance, influencing the perception of the product [61].
From the literature, we also know that soy milk was perceived to be rich in calcium [20,42]. This could explain why also in our study plant milk consumers consider soy milk to be at least as good for bones and rich in minerals as cow milk. However, a study in Switzerland showed that due to the real mineral and calcium levels of plant milk products on the market, the replacement of cow milk by plant milk could lead to a reduced intake of calcium and minerals [49]. Obviously, consumers misconceive the calcium and mineral content of plant milk. What we do not know is if this misconception comes from the widespread use of labels like “added calcium” on plant milk products [13].
The group of plant milk consumers in the sample is small; only 5% seem to have integrated plant milk substitutes into their diet. However, as mentioned above, that share corresponds to the general estimations about the market share in Europe found in the literature [13]. Even the much higher proportion of Austrian households that already consume plant milk (26%, as shown in literature review [29]) is not a real contradiction to our findings: of course the share of households that already tried plant milk is much higher, but most of them obviously did not integrate this product category into their everyday diet.
We also found out that health consciousness has only a minor or even nonexistent influence on the product image assessment. Hypothesis 3, which states that there is a correlation between health consciousness and the evaluation of the product image, could not be confirmed. This is a clear contradiction to literature, where more health-conscious persons are assumed to reduce animal products in their diet [20,69], and therefore, will perceive cow milk to be much less healthy compared to plant milk. Confirming literature, vegans and vegetarians are considered to be significantly more health conscious [67,68]. Therefore, we expected that health consciousness will also influence the perception of cow milk as an animal product. Maybe we reached too few vegans or vegetarians with our study. This is only an assumption, as we did not measure nutrition lifestyles within our image study.

6.2. Discussion About Means-End Chain Analysis

The socio-demographic structure of the two sub-samples within the qualitative study differs in terms of gender and age (Table A3 in Appendix A). The plant milk sample contains more females and is younger (more than 50% of them are below 29 years old). However, this is in accordance with the fact that more women lead a vegan or vegetarian lifestyle [54,55,56,57]. The higher share of younger people in the plant milk sample was probably caused by the recruitment procedure. The lower participation rate in the age group from 50 to 69 years in the cow milk sample was due to the fact that many of the potential interview partners in this age group had stopped consuming cow milk, because they believed to be lactose intolerant.
Based on our results of the means-end chain analysis, the consumption of plant milk is primarily led by the motives of indulgence and taste, to feel good, and to achieve a healthy diet. Other important motives are environmental protection, animal welfare, a flexible, convenient lifestyle, and the desire for variety in one’s diet. Taste is, in general, the most important attribute for the consumption of milk [17,18,19]. If taste is not agreeable, other attributes, such as specific ingredients, cannot compensate for the lack of it [18]. In comparable studies, consumers mentioned taste as an important factor to explain why plant milk or food alternatives were preferred over dairy products [5,20,51].
Better digestibility played a crucial role in the consumer preference for plant milk in this study. Being free from lactose and having fewer calories were attributes in our study connected with better digestibility. These results are in accordance with the studies of McCarthy et al. [20], Vainio et al. [50], and Schyver and Smith [51], where consumers were reported to perceive plant milk as a healthier alternative. Consumers who consciously renounce cow milk and switch to plant, sheep, or goat milk mention the better digestibility, connecting it to being “free from lactose” as the main reason. Accordingly, this substitute of cow milk is for many plant milk consumers essential. In our study, much more plant users reported food intolerances or allergies (12 of 30) compared to the cow milk group (4 of 30). In Austria, approximately 1–3% of the population has food allergies. Around 0.1 to 1% suffer from gluten intolerance, and up to 10% suffer from lactose intolerance [17,18,19]. The higher share of reported food intolerances and allergies in the plant milk sample may be an indicator that consumers report intolerances/allergies without scientific proof. As shown in our literature review, it “is a scientific fact that the intestines have a significant influence on our health. But the hype is simply not justified. Not every person that experiences digestive issues from time to time automatically has an intolerance, let alone an allergy” [52] (p. 1). Another reason for the higher share of reported food intolerances/allergies may also stem from the recruitment of respondents from the Facebook-group called “lactose-free”.
Wellness is important for both consumer groups, but seen in a different light. Plant milk consumers derive the feeling of wellness from a better perceived food tolerance and digestibility (“lactose-free”, “easily digestible”, “less bloated”). In the HVM for cow milk consumers there is a connection between “wellness” and the value “habit and tradition to drink cow milk” (see Figure 4). Plant milk consumers derive wellness from physiological benefits and cow milk consumers derive wellness from indulgence (“refreshing”, “tastes good”) and the habit/tradition, which is connected to childhood memories (“I grew up with milk”). Accordingly, school milk programs are an important marketing measure to establish the tradition and habit of consuming cow milk. Some authors see cow milk programs as key factors to leading consumers to a lifelong cow milk consumption [20]. This might be a core reason why the product image of cow milk outperforms the product image of plant milk.
Plant milk consumers also try to reduce their environmental impact and increase sustainability by replacing cow milk. They see plant milk production as climate-friendly. The environmental ladder starts with the product attributes “plant based/vegan” and “good for climate”, leads to the consequence “ecological” to end in the value “sustainability” (see Figure 3). Furthermore, animal welfare is an important aspect of their product choice. These aspects have been found in several studies as well [20,50,51]. The similarity of motives for plant milk consumption to motives for being vegetarian/vegan is obvious, but there is a significant difference. For vegetarian and vegan consumers, animal welfare is the main motive for their dietary lifestyle, followed by health and environmental protection. This was found in recent studies [53,54,56,57,58]. In our study, indulgence, health, and wellness were more often mentioned than animal welfare (which is still a dominant motive). This finding is in accordance with Schyver et al. [51], who reported health as the most important motive. However, the prominence of the health motive could be related to the high share of food intolerances and allergies in the plant milk sample. Altogether, we can see that only within the plant milk sample, environmental (good for climate) and animal welfare aspects were relevant consumption motives.
In our study, plant milk consumers loved to have a diverse diet (variety-seeking), and they liked the versatile use of plant milk and its long shelf life. These aspects have not been found in the above-mentioned studies [20,50,51].
Cow milk had a distinct “support of farmers and national economy” ladder, starting with the product attribute “domestic, regional product”. Previous studies on local/organic food [59] and traditional food [60] have found similar motives, where domestic/regional origin of the product was an important attribute for the consumers to support farmers and local economy. There seems to be still a strong emotional connection to small-scale family-oriented farming.
There was no motivational ladder to support farmers and local economy in the plant milk sample. This could be an indicator that consumers do not see plant milk as a domestic/regional product. Almond, rice, and coconut milk cannot be produced in Austria. Long transport distances of these products could cast doubt on the environmental friendliness of plant milk products. Furthermore, some of them, like almonds, are already under scrutiny due to worsening water scarcity in California [40].
The motives to consume cow milk are similar to those to consume plant milk, but are less differentiated than those for plant milk consumption. Taste, health, and convenience are the main motives. Obviously, both consumer groups consume their product category because they consider it to be healthy. This is in accordance with findings from literature, where both consumer groups consider their favorite product category as healthy [42,43,44,45,46].
Cow milk is considered to be a natural, untreated product. As shown in our literature review, the reality of cow milk in the supermarket is a different one. It is prohibited to sell raw cow milk in Austrian supermarkets [41]. Cow milk in the supermarket is pasteurized and homogenized, the fat content is modified, and some milk products are exposed to ultra-high temperatures.
Animal welfare and sustainability motives are not important issues for cow milk consumers. In general, our interviewees saw milk in an idealistic way and rarely connected it with negative aspects (which is close to the findings from the product image study). This result clearly shows the high emotional status of cow milk.
There is a strong connection between drinking coffee and cow milk. For cow milk consumers, this is the most important use of milk. Even plant milk consumers miss cow milk because of its taste and its consistency in coffee. The negatively perceived taste of plant milk is the main reason why cow milk consumers do not use plant milk [17,18,19]. Therefore, milk as a by-product of coffee is an important strategic factor. Both consumer groups criticized plant milk for being less suitable for coffee. Plant milk producers would be well advised to develop plant milk specifically designed to be used in coffee. Up to now, there is only one product available on the Austrian food market.

6.3. Limitations and Future Research

There are several limitations, which could be addressed by future research projects. The 11-item scale to measure the product image of cow and soy milk consisted mainly of items addressing aspects of quality, taste, and health, but lacked items about environmental or animal welfare aspects. Measurement instruments with fewer item pairs have the advantage that there are lower response drop-outs, but future product image studies could include items addressing the broader concept of sustainability (for example, environmental, ethical, and economic aspects). This limitation is also valid for the measurement of health consciousness. In order to avoid drop outs or no-responses, we also used a simple, comprehensible scale compared to other scales approximating health consciousness [67,68]. Even though we could prove the one-dimensionality of this scale, this could be at least a weak reason for the inadequacy of health consciousness as a mediator variable. Future studies could therefore also address the valid and reliable measurement of this variable.
Another limitation was the use of soy milk as a proxy for plant milk products in the quantitative study. Soy milk is still the plant milk product with the biggest market share; however, the plant milk market is highly dynamic and other products such as almond, cashew, or coconut milk are catching up rapidly [27]. Future quantitative studies could include several plant milk categories in the product image analysis, to see if there are differences in the respective product images.
In the product image analysis, both consumers groups rated cow and soy milk as rich in minerals. However, soy milk or other plant milk products are only rich in calcium if the products are additionally fortified. It would be interesting to know if the above mentioned misconception about the calcium/mineral (and also protein content) of plant milk products is a learning effect from the labeling of some plant milk products as fortified with minerals, vitamins, etc. [13,49].
It was difficult to find interviewees for the plant milk sample, thus, we recruited them via vegan and lactose-free social media-groups, which could be a limitation of the qualitative study results. Plant milk consumers with a less narrow focus on lactose-free and vegan topics might have reported different motives. In the cow milk sample of the qualitative study, there was a lower participation rate in the age group from 50 to 69 years. Many approached consumers in this age group declined to participate by saying they stopped to consume cow milk because of lactose intolerance. Future research projects could investigate how much of this intolerance is an assumption and how much is based on facts.

6.4. Conclusions

Plant milk and plant milk products will gain a bigger market share in the years to come, especially in developed countries. The trend towards changing food lifestyles (flexitarian, vegetarian, and vegan lifestyles) seems to be the main driver behind it [13,14]. Combined with the growing issues of health, animal welfare, and environmental impacts, plant milk and plant milk products will challenge the dairy sector.
Understanding consumer behavior better, in respect to how they see food products and their environmental and ethical impacts, should be helpful to support a more sustainable consumer lifestyle by designing better products and/or creating better communication strategies. A more plant-based diet in milk consumption will certainly support a more sustainable lifestyle (as the carbon and water footprint analysis in the literature review showed). However, in developed markets like Austria, there is still a clear, positive product image of cow milk as a natural and healthy product. Cow milk’s product image is, generally speaking, much more positive for most consumers compared with plant-based alternatives. From a sustainability point of view, cow milk is related to a number of important environmental issues [5]. We discussed the dramatic externalities of the dairy sector in our literature review [33,35]. Nevertheless, consumers largely seem to still favor cow milk in comparison to plant milk. There might be a strong market potential for milk substitutes that are closer to the taste, odor, and texture of cow milk. Additionally, as could be shown by the motivational structure of plant milk consumers, plant milk companies could further differentiate their market: the indulgence and wellness aspects could be used to emphasize the delight and joy of consuming plant milk. The health aspect could be addressed by providing information about different food lifestyles and their impact on health. Information about selected environmental impacts (in comparison to cow milk) and animal welfare aspects could be addressed as well to support the consumption of plant milk. Besides sustainability issues, this would also support healthy diets with more plant-based foods and fewer animal food sources [39], as pointed out in our literature review.

Author Contributions

Conceptualization, R.H. and O.M.; Methodology, R.H. and O.M.; Supervision, R.H.; Project Administration, R.H.; Validation; R.H. and O.M.; Original Draft Preparation, R.H. and O.M.; Writing—Review & Editing; R.H. and O.M.; Visualization; R.H., O.M., A.S., and A.P.; Formal Analysis, R.H., O.M., A.S., and A.P.; Data Curation, A.S. and A.P.

Funding

This research received no external funding.

Acknowledgments

We would like to thank the Austrian Agricultural Marketing Association (AMA) for supporting the study. We also thank the anonymous reviewers for their valuable comments.

Conflicts of Interest

The authors declare no conflict of interest.

Appendix A

Figure A1. Distribution of plant-based milk index—sum of 11 plant-based milk items normalized on 1-0 scale (1 = total agreement with left side of scale; positive plant-based milk; 0 = total agreement with right side of scale; negative plant-based milk).
Sustainability 11 05046 g0a1
Table A1. Differences of product image evaluation of cow milk between consumers (n = 50) and non-consumers (n = 951) of plant milk; independent samples t-test including bootstrap sampling.
ItemMdSEDFtSig.Bootstrap 2
95% Confidence IntervalSig.
fresh–preserved 1+0.2520.18752.1021.3890.171−0.0890.6280.196
healthy–unhealthy 1+0.4420.16451.7742.7280.0090.1500.7760.009
good for bones–bad for bones+0.1570.1409991.3980.163−0.0850.4590.272
natural–artificial 1+0.1970.15451.9091.3040.198−0.0810.5380.204
digestible–indigestive+0.5600.1709994.010≤0.0010.2300.8990.003
valuable–worthless+0.3790.1549993.261≤0.0010.0970.7020.017
rich in minerals–poor in minerals+0.1130.1469990.9010.368−0.1510.4140.457
tastes good–tastes bad+0.2470.1829991.6140.107−0.0720.6220.176
light–fatty−0.0310.154999−0.2240.823−0.3520.2560.843
energetic–powerless 1+0.3010.15851.9761.9180.0610.0360.6390.048
allergy-free–allergenic 1+0.6350.16952.4863.788≤0.0010.2920.9710.002
1 Levene test on homogeneity of variances: variances are not equal, Welsh test used; 2 1000 bootstrap samples.
Table A2. Correlation analysis of product image for cow/soy milk and health factor Hx, and plant-based milk items and Ix (n = 1001).
Image Cow Milk × Hx 1Pear-Son’s rSig.Bootstrap 2 95% Confidence IntervalSpear-Man-RhoSig.Bootstrap 2 95% Confidence Interval
fresh–preserved0.128≤0.0010.0590.1950.150≤0.0010.0890.208
healthy–unhealthy0.166≤0.0010.0980.2310.180≤0.0010.1180.239
good for bones–bad for bones0.201≤0.0010.1340.2660.206≤0.0010.1440.266
natural–artificial0.0990.0020.0310.1680.1060.0010.0390.169
digestible–indigestive0.0900.0040.0260.1550.1030.0010.0330.159
valuable–worthless0.153≤0.0010.0870.2160.168≤0.0010.1070.226
rich in minerals–poor in minerals0.188≤0.0010.1230.2530.185≤0.0010.1250.245
tastes good–tastes bad0.135≤0.0010.0660.1960.122≤0.0010.0640.183
light–fatty0.154≤0.0010.0890.2160.125≤0.0010.0570.185
energetic–powerless0.189≤0.0010.1220.2560.202≤0.0010.1350.258
allergy-free–allergenic0.131≤0.0010.0660.1970.113≤0.0010.0460.173
Ix−0.218≤0.001−0.281−0.154−0.232≤0.001−0.288−0.167
Image Soy Milk × Hx 1Pear-Son’s rSig.Bootstrap 2 95% Confidence IntervalSpear-Man-RhoSig.Bootstrap 2 95% Confidence interval
fresh–preserved0.150≤0.0010.0890.2080.0960.0020.0380.159
healthy–unhealthy0.180≤0.0010.1180.2390.150≤0.0010.0870.210
good for bones–bad for bones0.206≤0.0010.1440.2660.177≤0.0010.1160.237
natural–artificial0.1060.0010.0390.1690.1040.0010.0430.168
digestible–indigestive0.1030.0010.0330.1590.114≤0.0010.0530.180
valuable–worthless0.168≤0.0010.1070.2260.162≤0.0010.1010.229
rich in minerals–poor in minerals0.185≤0.0010.1250.2450.153≤0.0010.0920.218
tastes good–tastes bad0.122≤0.0010.0640.1830.139≤0.0010.0740.201
light–fatty0.125≤0.0010.0570.1850.0560.078−0.0090.119
energetic–powerless0.202≤0.0010.1350.2580.116≤0.0010.0570.177
allergy-free–allergenic0.113≤0.0010.0460.1730.1070.0010.0450.172
Ix−0.232≤0.001−0.288−0.167−0.169≤0.001−0.234−0.100
1 Item: 1 = total agreement with left side of scale, 5 = total agreement with right side of scale; Ix: 1 = most positive image; 0 = most negative image; 2 1000 bootstrap samples.
Table A3. Sociodemographic variables of means-end chain analysis—sample structure.
Plant Milk Consumers %Cow Milk Consumers %
Age15–2953.3%40.0%
30–4933.3%33.3%
50 or older13.3%26.7%
GenderMale16.7%40.0%
Female83.3%60.0%
EducationCompulsory School--
Middle/Vocational School10.0%3.4%
High School36.7%48.3%
Higher Education53.3%48.3%
Household sizeSingle23.3%23.3%
Two people56.7%56.7%
Three people10.0%10.0%
Four people or more10.0%10.0%
Figure A2. Triggers for the consumption of plant milk: food intolerances and allergies in the plant milk sample of the means-end chain analysis (n = 30).
Sustainability 11 05046 g0a2

References

  1. Rozenberg, S.; Body, J.J.; Bruyère, O.; Bergmann, P.; Brandi, M.L.; Cooper, C.; Devogelaer, J.P.; Gielen, E.; Goemaere, S.; Kaufman, J.M.; et al. Effects of Dairy Products Consumption on Health: Benefits and Beliefs—A Commentary from the Belgian Bone Club and the European Society for Clinical and Economic Aspects of Osteoporosis, Osteoarthritis and Musculoskeletal Diseases. Calcif. Tissue Int. 2016, 98, 1–17. [Google Scholar] [CrossRef]
  2. Elmadfa, I.; Freisling, H. Food-based dietary guidelines in Austria. Ann. Nutr. Metab. 2007, 51, 8–14. [Google Scholar] [CrossRef]
  3. Centre for European Agricultural Studies and The European Forum on Nature Conservation and Pastoralism. The Environmental Impact of Dairy Production in the EU: PRACTICAL Options for the Improvement of the Environmental Impact. Available online: https://ec.europa.eu/environment/agriculture/pdf/dairy.pdf (accessed on 20 May 2019).
  4. European Environmental Agency. Household Consumption and the Environment; EEA: Copenhagen, Denmark, 2005; ISBN 929167768X. [Google Scholar]
  5. Pistrich, K.; Wendtner, S.; Janetschek, H. Versorgung Österreichs Mit Pflanzlichem Eiweiß—Fokus Sojakomplex. Available online: https://www.dafne.at/prod/dafne_plus_common/attachment_download/d709373b9b5e9badcfb18587e974a30b/SR107_Soja.pdf (accessed on 23 January 2019).
  6. Good, K. Milk Life? How About Milk Destruction: The Shocking Truth About the Dairy Industry and the Environment. Available online: https://www.onegreenplanet.org/animalsandnature/the-dairy-industry-and-the-environment/ (accessed on 11 May 2019).
  7. PETA. 12 Reasons to Stop Drinking Cow’s Milk. Available online: https://www.peta.org/living/food/reasons-stop-drinking-milk/ (accessed on 11 May 2019).
  8. Wolfe, D. Milk Is Not Good for Your Bones. This Is Why! Available online: https://www.davidwolfe.com/milk-is-bad-for-bones/ (accessed on 20 July 2019).
  9. Rayburn, E. Research Shows No Matter Which Plant-Based Milk You Try, It Will Always Be More Environmentally-Friendly Than Dairy. Available online: https://www.onegreenplanet.org/news/plant-based-milk-try-will-always-environmentally-friendly-dairy/ (accessed on 28 July 2019).
  10. Plant Based News World Plant Milk Day. 22 August 2019. Available online: https://www.worldplantmilkday.com (accessed on 28 July 2019).
  11. Clayton, A. Milk. Available online: https://www.ethicalconsumer.org/food-drink/shopping-guide/milk (accessed on 20 July 2019).
  12. Chen, S. Preparation of Fluid Soymilk. In Proceedings of the World Congress on Vegetable Protein Utilization in Human Foods and Animal Feedstuffs; Applewhite, T.H., Ed.; American Oil Chemists’s Society: Champaign, IL, USA, 1989; pp. 341–352. [Google Scholar]
  13. Mäkinen, O.E.; Wanhalinna, V.; Zannini, E.; Arendt, E.K. Foods for Special Dietary Needs: Non-dairy Plant-based Milk Substitutes and Fermented Dairy-type Products. Crit. Rev. Food Sci. Nutr. 2016, 56, 339–349. [Google Scholar] [CrossRef] [PubMed]
  14. Derbyshire, E.J. Flexitarian Diets and Health: A Review of the Evidence-Based Literature. Front. Nutr. 2016, 3, 55. [Google Scholar] [CrossRef] [PubMed]
  15. Mintel Group US. Sales of Dairy Milk Turn Sour as Non-Dairy Milk Sales Grow 9% in 2015. Available online: https://www.mintel.com/press-centre/food-and-drink/us-sales-of-dairy-milk-turn-sour-as-non-dairy-milk-sales-grow-9-in-2015 (accessed on 11 May 2019).
  16. Dünnebacke, T. Getränke, Eine Regelrechte Explosion. Available online: https://lebensmittelpraxis.de/getraenke/24028-getraenke-eine-regelrechte-explosion.html (accessed on 28 July 2019).
  17. Palacios, O.M.; Badran, J.; Drake, M.A.; Reisner, M.; Moskowitz, H.R. Consumer acceptance of cow’s milk versus soy beverages: Impact of ethnicity, lactose tolerance and sensory preference segmentation. J. Sens. Stud. 2009, 24, 731–748. [Google Scholar] [CrossRef]
  18. Palacios, O.M.; Badran, J.; Spence, L.; Drake, M.A.; Reisner, M.; Moskowitz, H.R. Measuring Acceptance of Milk and Milk Substitutes Among Younger and Older Children. J. Food Sci. 2010, 75, 522–526. [Google Scholar] [CrossRef] [PubMed]
  19. Villegas, B.; Carbonell, I.; Costell, E. Acceptability of milk and soymilk vanilla beverages: Demographics consumption frequency and sensory aspects. Food Sci. Technol. Int. 2009, 15, 203–210. [Google Scholar] [CrossRef]
  20. McCarthy, K.S.; Parker, M.; Ameerally, A.; Drake, S.L.; Drake, M.A. Drivers of choice for fluid milk versus plant-based alternatives: What are consumer perceptions of fluid milk? J. Dairy Sci. 2017, 100, 6125–6138. [Google Scholar] [CrossRef]
  21. FAO. Dairy Sector Global Facts. Available online: https://www.fil-idf.org/wp-content/uploads/2016/12/FAO-Global-Facts-1.pdf (accessed on 11 May 2019).
  22. Alexandratos, N.; Bruinsma, J. World Agriculture towards 2030/2050. Available online: http://www.fao.org/3/a-ap106e.pdf (accessed on 11 May 2019).
  23. Zingone, F.; Bucci, C.; Iovino, P.; Ciacci, C. Consumption of milk and dairy products: Facts and figures. Nutrition 2017, 33, 322–325. [Google Scholar] [CrossRef]
  24. Statistics Market Research Consulting Dairy Alternatives—Global Market Outlook (2017–2023). Available online: https://www.researchandmarkets.com/reports/4426299/dairy-alternatives-global-market-outlook-2017#rela0-4386954 (accessed on 29 July 2019).
  25. Allied Market Research Dairy Alternative Market by Source (Soy Milk, Almond Milk, Rice Milk, Other Sources), Application (Food and Beverage)—Global Opportunity Analysis and Industry Forecast, 2014–2022. Available online: https://www.alliedmarketresearch.com/dairy-alternative-market (accessed on 10 May 2019).
  26. Chiorando, M. Sales of Vegan Food Skyrocket To $3.3 Billion in One Year. Available online: https://www.plantbasednews.org/post/sales-of-vegan-food-skyrocket-3-3-billion (accessed on 12 May 2019).
  27. Vierhile, T. How Other Milk Alternatives Are Gaining on Soy Milk in US—Analysis. Available online: https://www.just-food.com/analysis/how-other-milk-alternatives-are-gaining-on-soy-milk-in-us-analysis_id132209.aspx (accessed on 14 February 2019).
  28. EC. EU Agricultural Outlook for Markets and Income, 2018–2030; EC: Brussels, Belgium, 2018. [Google Scholar]
  29. Pichelbauer, M. Pflanzen-Kunde. Produkt—Der Informationsservice für Handel, Gastronomie & Markenartikler, 6 July 2015; 21. [Google Scholar]
  30. Jeske, S.; Zannini, E.; Arendt, E.K. Past, present and future: The strength of plant-based dairy substitutes based on gluten-free raw materials. Food Res. Int. 2018, 110, 42–51. [Google Scholar] [CrossRef]
  31. European Commission. Milk and Milk Products in the European Union. Available online: https://ec.europa.eu/agriculture/publi/fact/milk/2007_en.pdf (accessed on 20 January 2019).
  32. Barilla Center for Food and Nutrition Double Pyramid. 2016 Eat Better Eat Less Food for All. Available online: https://www.barillacfn.com/m/publications/doublepyramid2016-more-sustainable-future-depends-on-us.pdf (accessed on 29 May 2019).
  33. Stiftung Heinrich Böll Fleischatlas—Daten und Fakten über Tiere als Nahrungsmittel. Available online: https://www.bund.net/fileadmin/user_upload_bund/publikationen/massentierhaltung/massentierhaltung_fleischatlas_2018.pdf (accessed on 29 May 2019).
  34. Clune, S.; Crossin, E.; Verghese, K. Systematic review of greenhouse gas emissions for different fresh food categories. J. Clean. Prod. 2017, 140, 766–783. [Google Scholar] [CrossRef] [Green Version]
  35. Ercin, A.E.; Aldaya, M.M.; Hoekstra, A.Y. The water footprint of soy milk and soy burger and equivalent animal products. Ecol. Indic. 2012, 18, 392–402. [Google Scholar] [CrossRef] [Green Version]
  36. Cardinale, B.J.; Duffy, J.E.; Gonzalez, A.; Hooper, D.U.; Perrings, C.; Venail, P.; Narwani, A.; Mace, G.M.; Tilman, D.; Wardle, D.A.; et al. Biodiversity loss and its impact on humanity. Nature 2012, 486, 59–67. [Google Scholar] [CrossRef] [PubMed]
  37. IDH and IUCN NL European Soy Monitor. Available online: https://www.idhsustainabletrade.com/uploaded/2019/04/European-Soy-Monitor.pdf (accessed on 20 July 2019).
  38. Burrows, D. How Danone’s Alpro is Future-Proofing Its Soy Supply: Local Sourcing Direct from Farmers. Available online: https://www.foodnavigator.com/Article/2019/02/01/How-Danone-s-Alpro-is-future-proofing-its-soy-supply-local-sourcing-direct-from-farmers (accessed on 29 July 2019).
  39. Willett, W.; Rockström, J.; Loken, B.; Springmann, M.; Lang, T.; Vermeulen, S.; Garnett, T.; Tilman, D.; Declerck, F. The Lancet Commissions Food in the Anthropocene: The EAT—Lancet Commission on healthy diets from sustainable food systems. Lancet 2019, 3293, 447–492. [Google Scholar] [CrossRef]
  40. Saner, E. Almond Milk: Quite Good for You—Very Bad for the Planet. Available online: https://www.theguardian.com/lifeandstyle/shortcuts/2015/oct/21/almond-milk-quite-good-for-you-very-bad-for-the-planet (accessed on 27 May 2019).
  41. Bundesministerin für Gesundheit und Frauen (Federal Ministry of Health and Women). Verordnung der Bundesministerin für Gesundheit und Frauen über Rohmilch und Rohrahm (Rohmilchverordnung); Federal Ministry of Health and Women: Vienna, Austria, 2006.
  42. Bus, A.; Worsley, A. Consumers’ sensory and nutritional perceptions of three types of milk. Public Health Nutr. 2003, 6, 201–208. [Google Scholar] [CrossRef]
  43. Haas, R.; Canavari, M.; Imami, D.; Gjonbalaj, M.; Gjokaj, E.; Zvyagintsev, D. Attitudes and Preferences of Kosovar Consumer Segments Toward Quality Attributes of Milk and Dairy Products. J. Int. Food Agribus. Mark. 2016, 28, 407–426. [Google Scholar] [CrossRef]
  44. Tuorila, H. Selection of milks with varying fat contents and related overall liking, attitudes, norms and intentions. Appetite 1987, 8, 1–14. [Google Scholar] [CrossRef]
  45. Brewer, J.L.; Blake, A.J.; Rankin, S.A.; Douglass, L.W. Theory of reasoned action predicts milk consumption in women. J. Am. Diet. Assoc. 1999, 99, 39–44. [Google Scholar] [CrossRef]
  46. Lea, E.J.; Crawford, D.; Worsley, A. Consumers’ readiness to eat a plant-based diet. Eur. J. Clin. Nutr. 2006, 60, 342–351. [Google Scholar] [CrossRef]
  47. Harel, Z.; Riggs, S.; Vaz, R.; White, L.; Menzies, G. Adolescents and calcium: What they do and do not know and how much they consume. J. Adolesc. Heal. 1998, 22, 225–228. [Google Scholar] [CrossRef]
  48. Chapman, K.M.; Chan, M.W.; Clark, C.D. Factors Influencing Dairy Calcium Intake in Women. J. Am. Coll. Nutr. 1995, 14, 336–340. [Google Scholar] [CrossRef] [PubMed]
  49. Sousa, A.; Bolanz, K.A.K. Nutritional Implications of an Increasing Consumption of Non-Dairy Plant-Based Beverages Instead of Cow’s Milk in Switzerland. Adv. Dairy Res. 2017, 5, 2. [Google Scholar] [CrossRef]
  50. Vainio, A.; Niva, M.; Jallinoja, P.; Latvala, T. From beef to beans: Eating motives and the replacement of animal proteins with plant proteins among Finnish consumers. Appetite 2016, 106, 92–100. [Google Scholar] [CrossRef] [PubMed]
  51. Schyver, T.; Smith, C. Reported attitudes and beliefs toward soy food consumption of soy consumers versus nonconsumers in natural foods or mainstream grocery stores. J. Nutr. Educ. Behav. 2005, 37, 292–299. [Google Scholar] [CrossRef]
  52. Hajek, E. Food Intolerance—Fact or Fad? Available online: https://www.acv.at/presse/2016_PR_Food_intolerance___fact_or_fad.pdf (accessed on 13 February 2019).
  53. Hamilton, M. Eating Death. Food Cult. Soc. 2006, 9, 155–177. [Google Scholar] [CrossRef]
  54. Janssen, M.; Busch, C.; Rödiger, M.; Hamm, U. Motives of consumers following a vegan diet and their attitudes towards animal agriculture. Appetite 2016, 105, 643–651. [Google Scholar] [CrossRef] [PubMed]
  55. Leitzmann, C.; Keller, M. Vegetarische Ernährung; Ulmer UTB: Stuttgart, Germany, 2013; p. 380. ISBN 978-3-8252-3873-5. [Google Scholar]
  56. Radnitz, C.; Beezhold, B.; DiMatteo, J. Investigation of lifestyle choices of individuals following a vegan diet for health and ethical reasons. Appetite 2015, 90, 31–36. [Google Scholar] [CrossRef] [PubMed]
  57. Fox, N.; Ward, K. Health, ethics and environment: A qualitative study of vegetarian motivations. Appetite 2008, 50, 422–429. [Google Scholar] [CrossRef] [Green Version]
  58. Kerschke-Risch, P. Vegan Nutrition: Motives, Getting started and Duration. Ernahr. Umsch. 2015, 62, M330–M335. [Google Scholar]
  59. Haas, R.; Stern, J.; Meixner, O.; Nyob, D.I.; Traar, V. Do US Consumers’ perceive local and organic food differently? An analysis based on means-end chain analysis and word association. Int. J. Food Syst. Dyn. 2013, 4, 214–226. [Google Scholar]
  60. Cerjak, M.; Haas, R.; Brunner, F.; Tomić, M. What motivates consumers to buy traditional food products? Evidence from Croatia and Austria using word association and laddering interviews. Br. Food J. 2014, 116, 1726–1747. [Google Scholar] [CrossRef]
  61. Torrico, D.D.; Fuentes, S.; Viejo, C.G.; Ashman, H.; Dunshea, F.R. Cross-cultural effects of food product familiarity on sensory acceptability and non-invasive physiological responses of consumers. Food Res. Int. 2019, 115, 439–450. [Google Scholar] [CrossRef] [PubMed]
  62. Malik, M.E.; Naeem, B.; Munawar, M. Brand Image: Past, Present and Future. J. Basic Appl. Sci. Res. 2012, 2, 13069–13075. [Google Scholar]
  63. Kotler, P.; Keller, K.L. Marketing Management, 14th ed.; Pearson: London, UK, 2012; ISBN 9780132102926. [Google Scholar]
  64. Renner, B.; Sproesser, G.; Strohbach, S.; Schupp, H.T. Why we eat what we eat. The Eating Motivation Survey (TEMS ). Appetite 2012, 59, 117–128. [Google Scholar] [CrossRef] [PubMed]
  65. Preacher, K.J.; Hayes, A.F. Asymptotic and resampling strategies for assessing and comparing indirect effects in multiple mediator models. Behav. Res. Methods 2008, 40, 879–891. [Google Scholar] [CrossRef] [PubMed]
  66. Hoque, M.Z.; Alam, M.N. What determines the purchase intention of liquid milk during a food security crisis? The role of perceived trust, knowledge, and risk. Sustainability 2018, 10, 3722. [Google Scholar] [CrossRef]
  67. Hoek, A.C.; Luning, P.A.; Stafleu, A.; De Graaf, C. Food-related lifestyle and health attitudes of Dutch vegetarians, non-vegetarian consumers of meat substitutes, and meat consumers. Appetite 2004, 42, 265–272. [Google Scholar] [CrossRef]
  68. Schifferstein, H.N.J.; Ophuist, P.A.M.O. Health-related determinants of organic food consumption in The Netherlands. Food Qual. Prefer. 1997, 9, 119–133. [Google Scholar] [CrossRef]
  69. Siegrist, M.; Hartmann, C. Impact of sustainability perception on consumption of organic meat and meat substitutes. Appetite 2019, 132, 196–202. [Google Scholar] [CrossRef]
  70. Efron, B. The 1977 Rietz Lecture—Bootstrap methods: Another look at the jackknife. Ann. Stat. 1979, 7, 1–26. [Google Scholar] [CrossRef]
  71. DiCiccio, T.J.; Efron, B. Bootstrap confidence intervals. Stat. Sci. 1996, 11, 189–228. [Google Scholar]
  72. Reynolds, T.J.; Gutman, J. Laddering theory, method, analysis, and interpretation. J. Advert. Res. 1988, 28, 11–31. [Google Scholar]
  73. Gutman, J. A Means-End Chain Model Based on Consumer Categorization Processes. J. Mark. 1982, 46, 60–72. [Google Scholar] [CrossRef]
  74. Reynolds, T.C.; Olson, J.C. Understanding Consumer Decision Making. In The Means End Approach to Marketing and Advertising Strategy; Reynolds, T.C., Olson, J.C., Eds.; Lawrence Erlbaum Associates: Hillsdale, NJ, USA, 2001; p. 447. [Google Scholar]
  75. Audenaert, A.; Steenkamp, J.B. Means-end chain theory and laddering in agricultural marketing research. In Agricultural Marketing and Consumer Behavior in a Changing World; Wierenga, B., van Tilbury, A., Grunert, K., Steenkamp, J.B., Eds.; Kluwer Academics: Boston, MA, USA, 1997; pp. 217–230. [Google Scholar]
  76. Costa, A.I.A.; Dekker, M.; Jongen, W.M.F. An overview of means-end theory: Potential application in consumer-oriented food product design. Trends Food Sci. Technol. 2004, 15, 403–415. [Google Scholar] [CrossRef]
  77. Grunert, K.G.; Grunert, S.C. Measuring subjective meaning structures by the laddering method: Theoretical considerations and methodological problems. Int. J. Res. Mark. 1995, 12, 209–225. [Google Scholar] [CrossRef]
  78. Statistics Austria Population. Available online: http://www.statistik.at/web_en/statistics/PeopleSociety/population/index.html (accessed on 12 December 2018).
Figure 1. Distribution of health factor values, based on self-assessment health consciousness items; total sample (n = 1001).
Sustainability 11 05046 g001
Figure 2. Image profile of cow milk and soy milk of (a) total sample (n = 1001) and (b) plant milk consumers (n = 50).
Sustainability 11 05046 g002
Figure 3. Hierarchical Value Map for plant milk (n = 30).
Sustainability 11 05046 g003
Figure 4. Hierarchical Value Map for cow milk (n = 30).
Sustainability 11 05046 g004
Table 1. Sociodemographic variables of the product image analysis—sample structure.
Sample %Austrian Population % (2016 [78])
Age15–2924.821.4
30–4942.732.5
50 or older32.646.1
GenderMale48.549.1
Female51.550.9
EducationCompulsory School25.518.3
Middle/Vocational School46.749.2
High School18.515.4
Higher Education9.417.1
Household sizeSingle13.237.2
Two people32.030.3
Three people24.914.9
Four people or more30.017.6
Table 2. Differences of product image evaluation between cow milk and soy milk (n = 1001); paired sample t-test including bootstrap sampling.
MMdSE2tSig.Bootstrap 3
Item/Index 1CowSoy95% Confidence IntervalSig.
fresh–preserved1.863.15−1.2910.045−28.93≤0.001−1.374−1.199≤0.001
healthy–unhealthy1.682.43−0.7490.039−19.28≤0.001−0.824−0.676≤0.001
good for bones–bad for bones1.572.79−1.2190.033−36.85≤0.001−1.285−1.156≤0.001
natural–artificial1.592.86−1.2690.042−30.20≤0.001−1.350−1.188≤0.001
digestible–indigestive2.312.41−0.1030.045−2.260.024−0.186−0.0190.019
valuable–worthless1.662.67−1.0100.039−25.87≤0.001−1.083−0.937≤0.001
rich in minerals–poor in minerals1.932.72−0.7870.038−20.95≤0.001−0.863−0.713≤0.001
tastes good–tastes bad1.773.32−1.5580.048−32.68≤0.001−1.643−1.464≤0.001
light–fatty3.252.580.6670.04215.73≤0.0010.5860.754≤0.001
energetic–powerless1.932.69−0.7580.039−19.62≤0.001−0.834−0.687≤0.001
allergy-free–allergenic2.862.470.3860.0448.67≤0.0010.2960.475≤0.001
Ix 1-00.740.570.1750.00724.66≤0.0010.1600.189≤0.001
M = Mean; Md = Mean Difference; SE = Standard Error; Sig. = Significance; 1 Item: 1 = total agreement with left side of scale, 5 = total agreement with right side of scale; Ix: 1 = most positive image; 0 = most negative image; 2 1000 degrees of freedom (DF); 3 1000 bootstrap samples.
Table 3. Differences of product image evaluation of soy milk between consumers (n = 50) and non-consumers (n = 951) of plant milk; independent samples t-test including bootstrap sampling.
MdSEDFtSig.Bootstrap 2
Item/Index95% Confidence IntervalSig.
fresh–preserved 1−0.3270.18752.476−1.7500.086−0.6940.0670.090
healthy–unhealthy−0.6840.140999−4.886≤0.001−0.912−0.453≤0.001
good for bones–bad for bones 1−0.5150.13452.933−3.835≤0.001−0.778−0.263≤0.001
natural–artificial−0.7800.159999−4.892≤0.001−1.082−0.500≤0.001
digestible–indigestive 1−0.8110.12556.123−6.511≤0.001−1.041−0.538≤0.001
valuable–worthless−0.9580.142999−6.731≤0.001−1.177−0.743≤0.001
rich in minerals–poor in minerals−0.6950.132999−5.253≤0.001−0.952−0.462≤0.001
tastes good–tastes bad−1.0990.162999−6.780≤0.001−1.416−0.755≤0.001
light–fatty−0.3180.133999−2.3970.017−0.554−0.0810.010
energetic–powerless−0.8340.141999−5.912≤0.001−1.096−0.566≤0.001
allergy-free–allergenic−0.6020.139999−4.339≤0.001−0.870−0.321≤0.001
Ix cow milk 1−0.0740.03251.446−2.4130.019−0.135−0.0120.033
Ix soy milk0.1730.0239996.715≤0.0010.1290.218≤0.001
Md = Mean Difference; SE = Standard Error; DF = Degrees of Freedom; Sig. = Significance; 1 Levene test on homogeneity of variances: variances are not equal, Welsh test used; 2 1000 bootstrap samples.

