Review

Do We Know Enough to Save European Riverine Fish?—A Systematic Review on Autecological Requirements During Critical Life Stages of 10 Rheophilic Species at Risk

1
Aquatic Systems Biology Unit, Department of Ecology and Ecosystem Management, Technical University Munich, Freising 85354, Germany
2
Leibniz-Institute of Freshwater Ecology and Inland Fisheries, Berlin 12587, Germany
*
Author to whom correspondence should be addressed.
Sustainability 2019, 11(18), 5011; https://doi.org/10.3390/su11185011
Submission received: 17 August 2019 / Revised: 6 September 2019 / Accepted: 6 September 2019 / Published: 13 September 2019
(This article belongs to the Special Issue Hydropower Impacts on Aquatic Biota)

Abstract

:
Modeling of fish population developments in the context of hydropower impacts and restoration planning requires autecological information on critical life stages (especially on juvenile stages and reproduction). We compiled and examined the current data availability in peer-reviewed and grey literature on autecological requirements of ten rheophilic fish species at risk, belonging to the salmonid, cyprinid, and cottid families. In total, 1725 data points from 223 sources were included. Economically important salmonids and the common nase were the most studied species. Grey and peer-reviewed data showed similar dispersion and variance and contributed nearly equally to the data pool of the specific species. An in-depth analysis on seven ecological parameters revealed no significant differences between both sources in terms of data availability and quality. We found substantial deficits in the data for about a quarter of the reviewed ecological parameters, in particular on individual densities in the habitats, egg development and information about juvenile stages despite the necessity of such data for more advanced population analyses. To secure fish populations in the long term, more data on basic autecological parameters is needed and grey literature might add valuable information, particularly if it relies on standardized methodologies.

1. Introduction

Multiple stressors, including environmental and anthropogenic impacts such as climate change, pollution, habitat fragmentation and degradation, contributed to a massive decline in aquatic biodiversity in the last century [1,2,3,4,5]. In this context, especially riverine fish species experience the greatest threat by river regulation and fragmentation due to barriers including weirs, dams and hydroelectric plants [6,7]. The latter can have detrimental consequences for fish populations such as preventing migratory species from moving between key habitats during their life cycles [8,9,10]. Further, e.g., water abstraction and the loss of shallow littoral areas cause large-scale change, homogenization and loss of fish habitats [11] resulting in reduced abundance, loss of genetic diversity, population decline and change in community structure in the long run [12,13,14,15,16]. The situation becomes even more severe when multiple stressors act in concert [4].
Successful mitigation of these impacts depends not only on basic and applied research but also on mechanistically understanding the effects of these stressors on freshwater communities and ecosystems. Moreover, targeted research is needed to implement successful river rehabilitation measures including measure design, strategic planning and prioritization tools [17,18,19,20]. In conjunction with improved planning tools there is an urgent need for data about species-specific habitat requirements to streamline rehabilitation efforts. Accurate data on life history traits fostering recovery are considered most important to derive rehabilitation targets, to run realistic model scenarios, to identify possible population bottlenecks and to implement suitable mitigation methods [21]. These traits include for instance reproductive traits as well as habitat requirements of early life-stages for spawning and nursery. Basic autecological knowledge is therefore not only crucial for long-term population conservation and enhancement, but its systematic analysis also provides new insights [22,23,24], e.g., on setting research priorities for the future. Usual sources of autecological data are—among others—peer-reviewed articles and grey literature. In the context of river restoration measures and fish conservation, the latter is becoming more and more important today [25]. In particular, the implementation of rehabilitation measures commissioned by local authorities is often based on the findings of investigation reports from local expert offices alone or in combination with peer-reviewed data [25,26].
Here, we apply a systematical meta-analysis approach to summarize data from grey and peer-reviewed literature on selected life history traits, ecological parameters and habitat requirements related to the most critical life stages of representative riverine fish species, which are considered target species of conservation [27]. We aimed at (i) determining data availability for each parameter and species using a defined systematic search, (ii) identifying existing knowledge gaps and (iii) examining whether the grey literature has the potential to provide valuable additional data that will help close existing knowledge gaps and provide a more balanced picture of available evidence. With this, we provide a defendable information basis drawn on all relevant and scientifically sound research to be used in evidence-based population conservation actions.

2. Materials and Methods

2.1. Literature Review

In this paper, we examined the scope of the literature and available data on the autecology of ten European riverine fish species: Barbus barbus (common barbel), Chondrostoma nasus (common nase), Cottus gobio (European bullhead), Hucho hucho (Danube salmon), Leuciscus leuciscus (European dace), Phoxinus phoxinus (European minnow), Salmo salar (Atlantic salmon), Salmo trutta (brown trout), Squalius cephalus (European chub), and Thymallus thymallus (European grayling). According to recent findings in stream fish population trends [28] these species were found to be strongly decreasing over the last decades and deserve high conservation priority. We provide the current national and international conservation status and the affiliation to the main ecological guilds of these species in Table S1. Twenty-six ecological parameters comprising critical life phases such as reproductive and early life stage conditions, habitat space requirements, life history traits, and environmental tolerances in respect to the species-specific ecological niche were included, as detailed in Table 1. These parameters are considered fundamental to relate fish populations to habitat availability and quality, to predict fishes’ response to habitat changes, degradation, and rehabilitation and to secure a self-sustaining fish population [21].
For the database screening, we used a combination of the species’ common or scientific names and the ecological parameter (e.g., “Barbus barbus *degree days”) as a search string, both in English and German language. All used search strings are summarized in Appendix A, Table A1. The search was conducted on the Web of Knowledge, Google Scholar, FishBase, in the Technical University Munich library data base, and in the references lists of the literature already found. In total, we obtained 223 publications originating from peer-reviewed articles and grey literature (e.g., academic papers, dissertations, research-, committee-, and government reports; Table S2) providing data on at least one of the parameters listed in Table 1. For publications providing more than one data point per ecological parameter and species we only considered the minimum and maximum value (Table S3), which then were counted as two observations. Two or more values from the same publication but from independent sampling periods, sites, and populations were treated as individual observations. We exclusively used primary data and omitted data cited from another source (“secondary data”) where the original source could not be found. All observations and values used in this review will further be referred to as “data points”.

2.2. Data Analyses

To get an overview of the available data on the autecological parameters for each species we visualized the data using a heatmap with a color gradient indicating the amount of data points found. An in-depth analysis focused on those seven ecological parameters for which the most data points and at least one data point per species were available including “current speed spawning site”, “current speed juvenile habitat”, “water depth spawning site”, “water depth juvenile habitat”, “water temperature spawning site”, “degree days” and “substrate spawning site”. We tested data differences and variability depending on the literature source using descriptive statistics and unpaired two-sample Wilcoxon tests (Wilcoxon rank sum test). Significance levels are indicated as follows: 0.01 < p ≤ 0.05 *, 0.001 < p ≤ 0.01 **, and p ≤ 0.001 ***. Following the recommendations of McDonald [29], we excluded species with less than five data points per ecological parameter from the analysis.
To consider for a bias towards broader data ranges, means and standard deviations driven by a higher amount of publications, we conducted a linear regression on the available data points and the normalized span of range, as well as the normalized mean and the normalized standard deviation (Figure A1). Univariate analyses and graphs for data visualization were computed using the statistical and graphical open-source software R [30] including the following packages: car [31], dplyr [32], extrafont [33], ggalt [34], ggplot2 [35], gplots [36], grid [37], plyr [38], RColorBrewer [39], and tidyr [40].
To test how the inclusion of grey literature would influence the overall data picture, we used multivariate analysis tools provided by the statistical software PRIMER v7 (PRIMER-e, Massey University, Auckland, NZ). For this purpose, we created four new data sets. The first and second set included the z-transformed median values of each ecological parameter for all species, from grey and peer-reviewed literature, respectively. We created a resemblance matrix using Euclidian distance. To test similarity of the gathered data from the two different literature sources, we used the RELATE function of PRIMER v7. The third data set was created to see if there would be a benefit if grey and peer-reviewed data were combined. Thus, the set included combined median values of the environmental parameter measures from both sources and median values coming only from peer-review. After normalization and creating the Euclidian distance matrix, we conducted nonmetric multi-dimensional scaling (nMDS) to obtain graphical ordination of the samples [41]. Additionally, we included the number of data points reviewed per species and data sources using the bubble function. The fourth data set was of the same structure as the third but included the number of data points per species and parameters instead. We added this data as a correlation vector layer to the nMDS.

3. Results

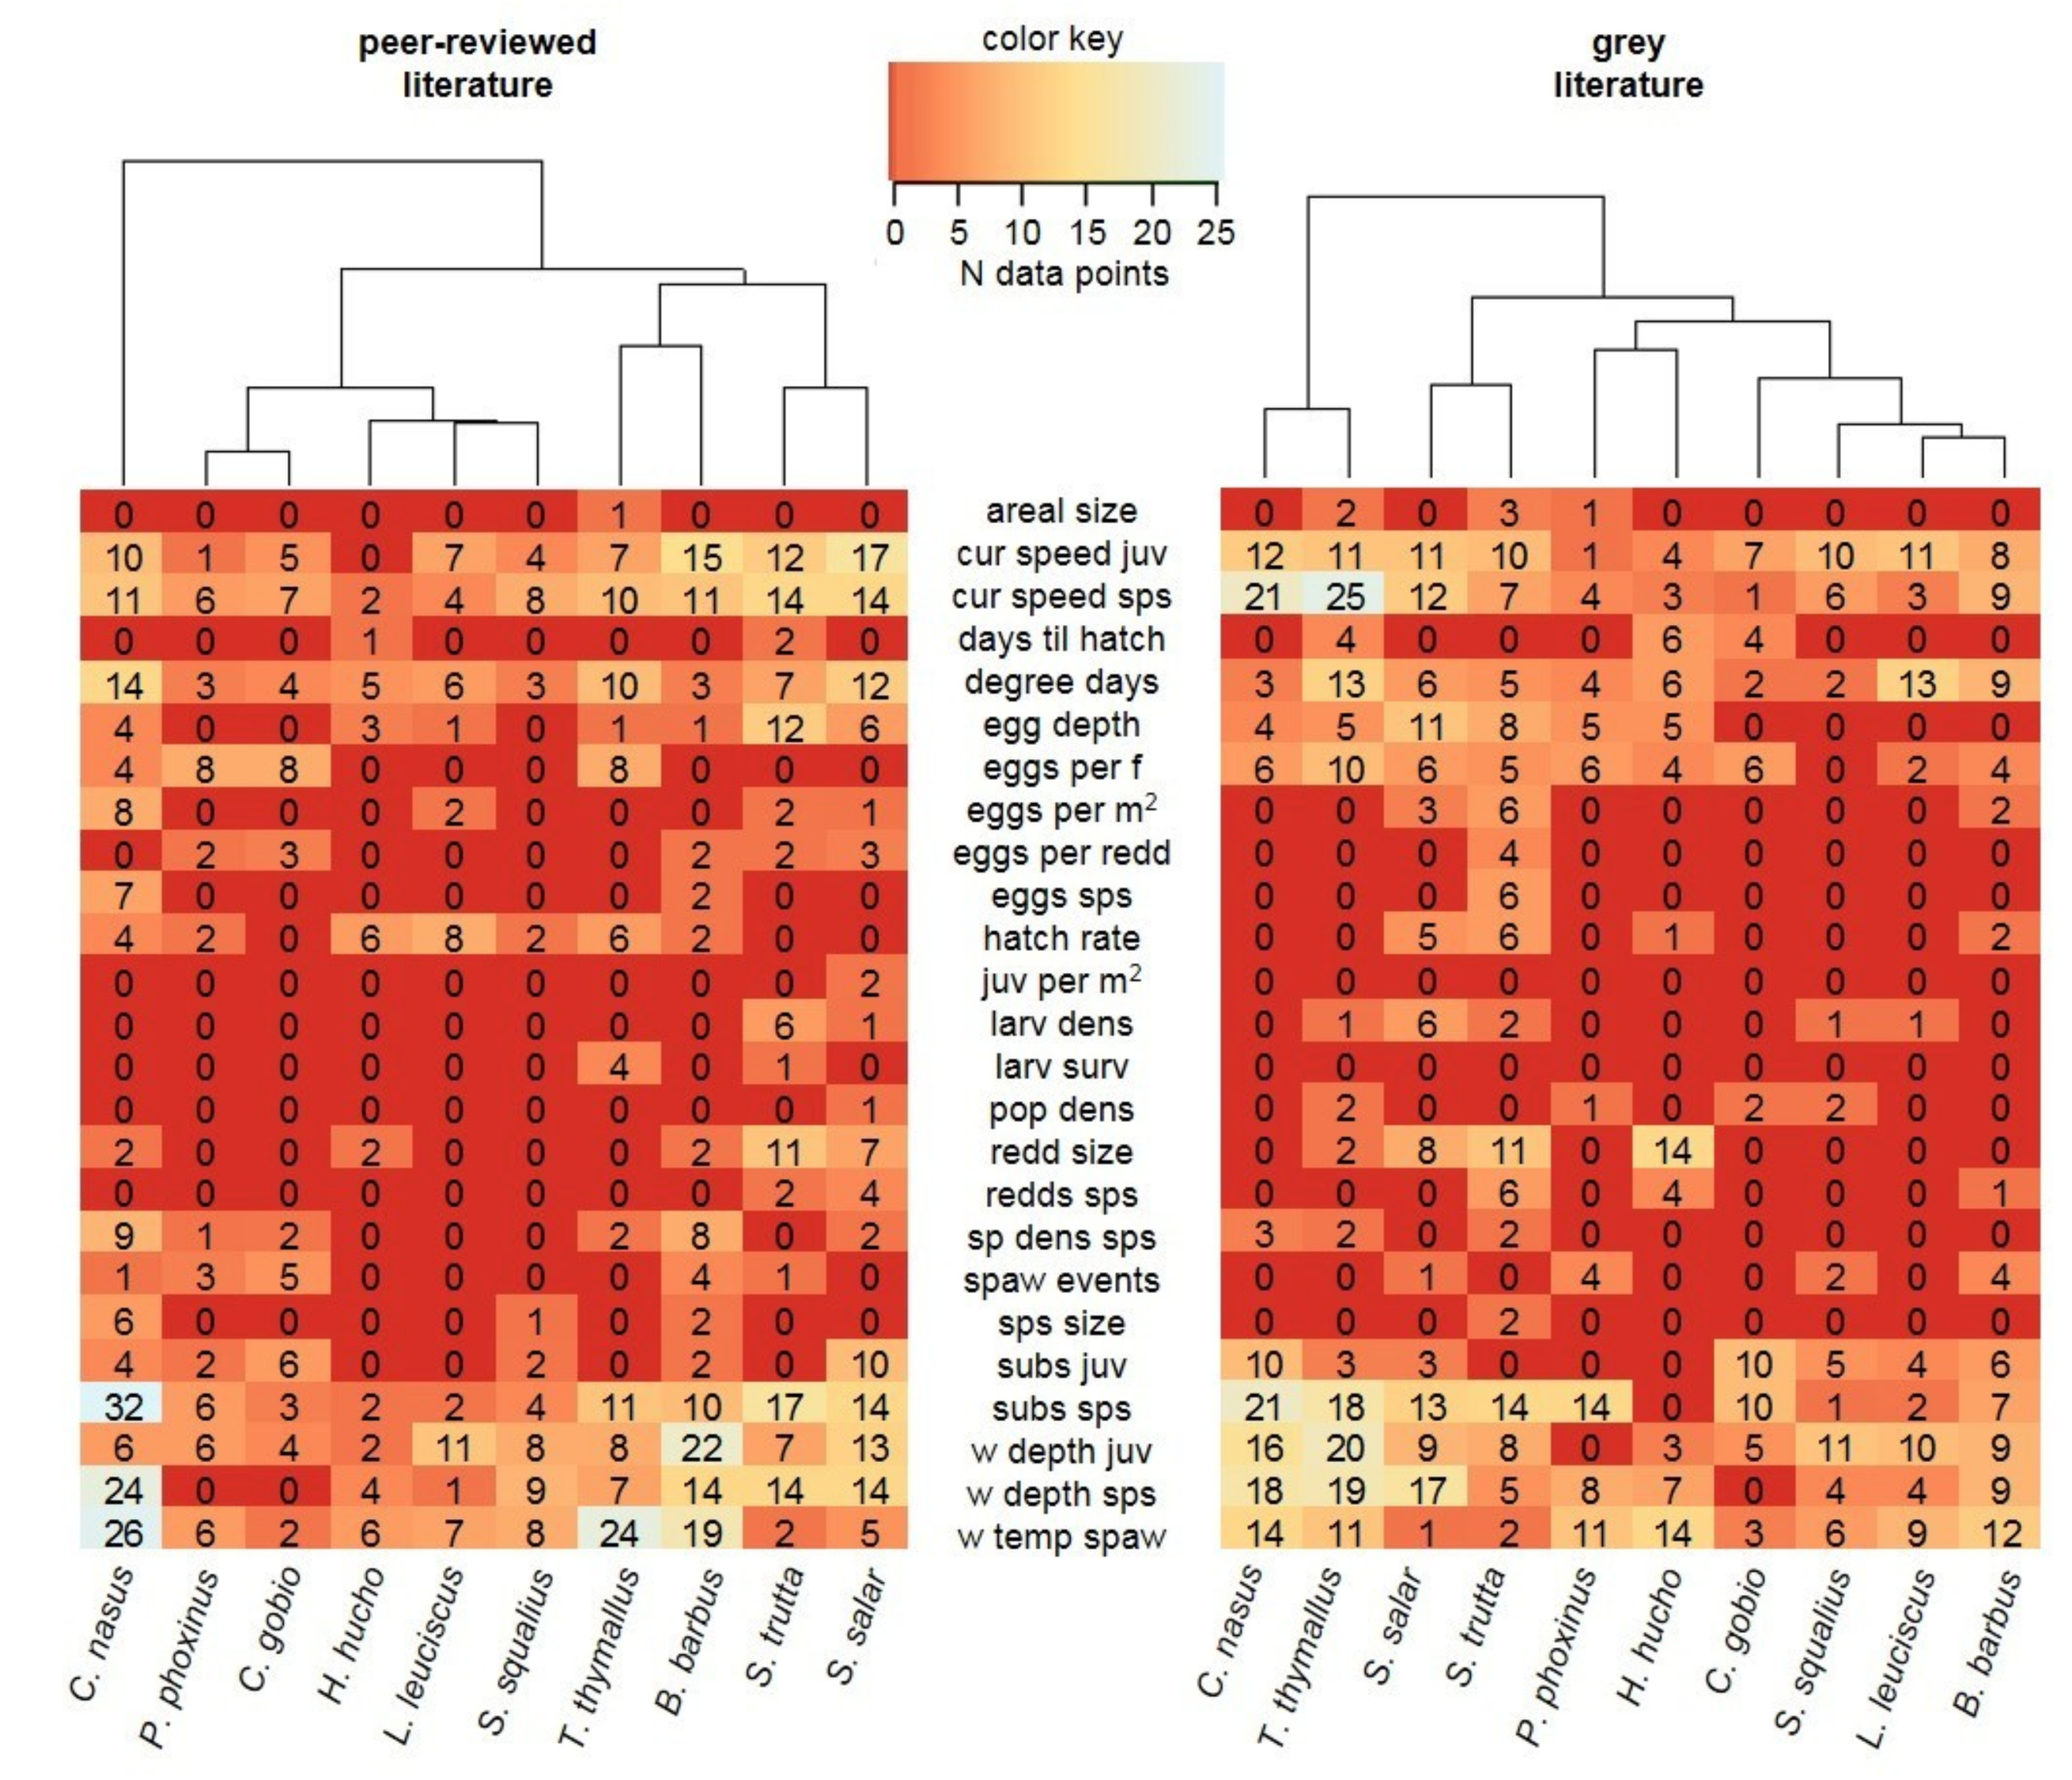
3.1. Data Availability

Overall, we compiled 1725 data points from 223 sources reviewed, of which 33% were identified as grey literature (31 reports, 31 books, 10 dissertations, one personal communication, and one web source from experts) and 67% being peer-reviewed studies. Peer-reviewed articles were accessible over Google Scholar and the university’s library, whereas grey literature was mainly found using the Google search or by inquiring with responsible authorities. We provide a list of all literature sources used in the Supplementary Material (Table S2).
As expected, the success of the data search varied according to species (Figure 1 and Figure 2). The literature reviewed on common nase yielded the highest number of 300 data points (57% peer-reviewed, 43% grey), followed by Atlantic salmon (238; 53% peer-reviewed, 47% grey) and brown trout (124; 50% peer-reviewed, 50% grey). We found the fewest data points for European bullhead and European dace (both 99; both 50% peer-reviewed, 50% grey). For six of the ten species both literature sources provided nearly equal amounts of data points (Figure 1).
Data on physical habitat characteristics, e.g., current speed, water depth, and water temperature, were better represented than data on the areal needs and characterizations, e.g., population density, spawning site size, and early-life stages, considering both literature sources. “water temperature during spawning” yielded 83 data points from grey sources (derived from 45 publications) and 105 data points form peer-reviewed literature (out of 54 publications) whereas there was only one search hit for “juveniles per square meter” (Figure 2).

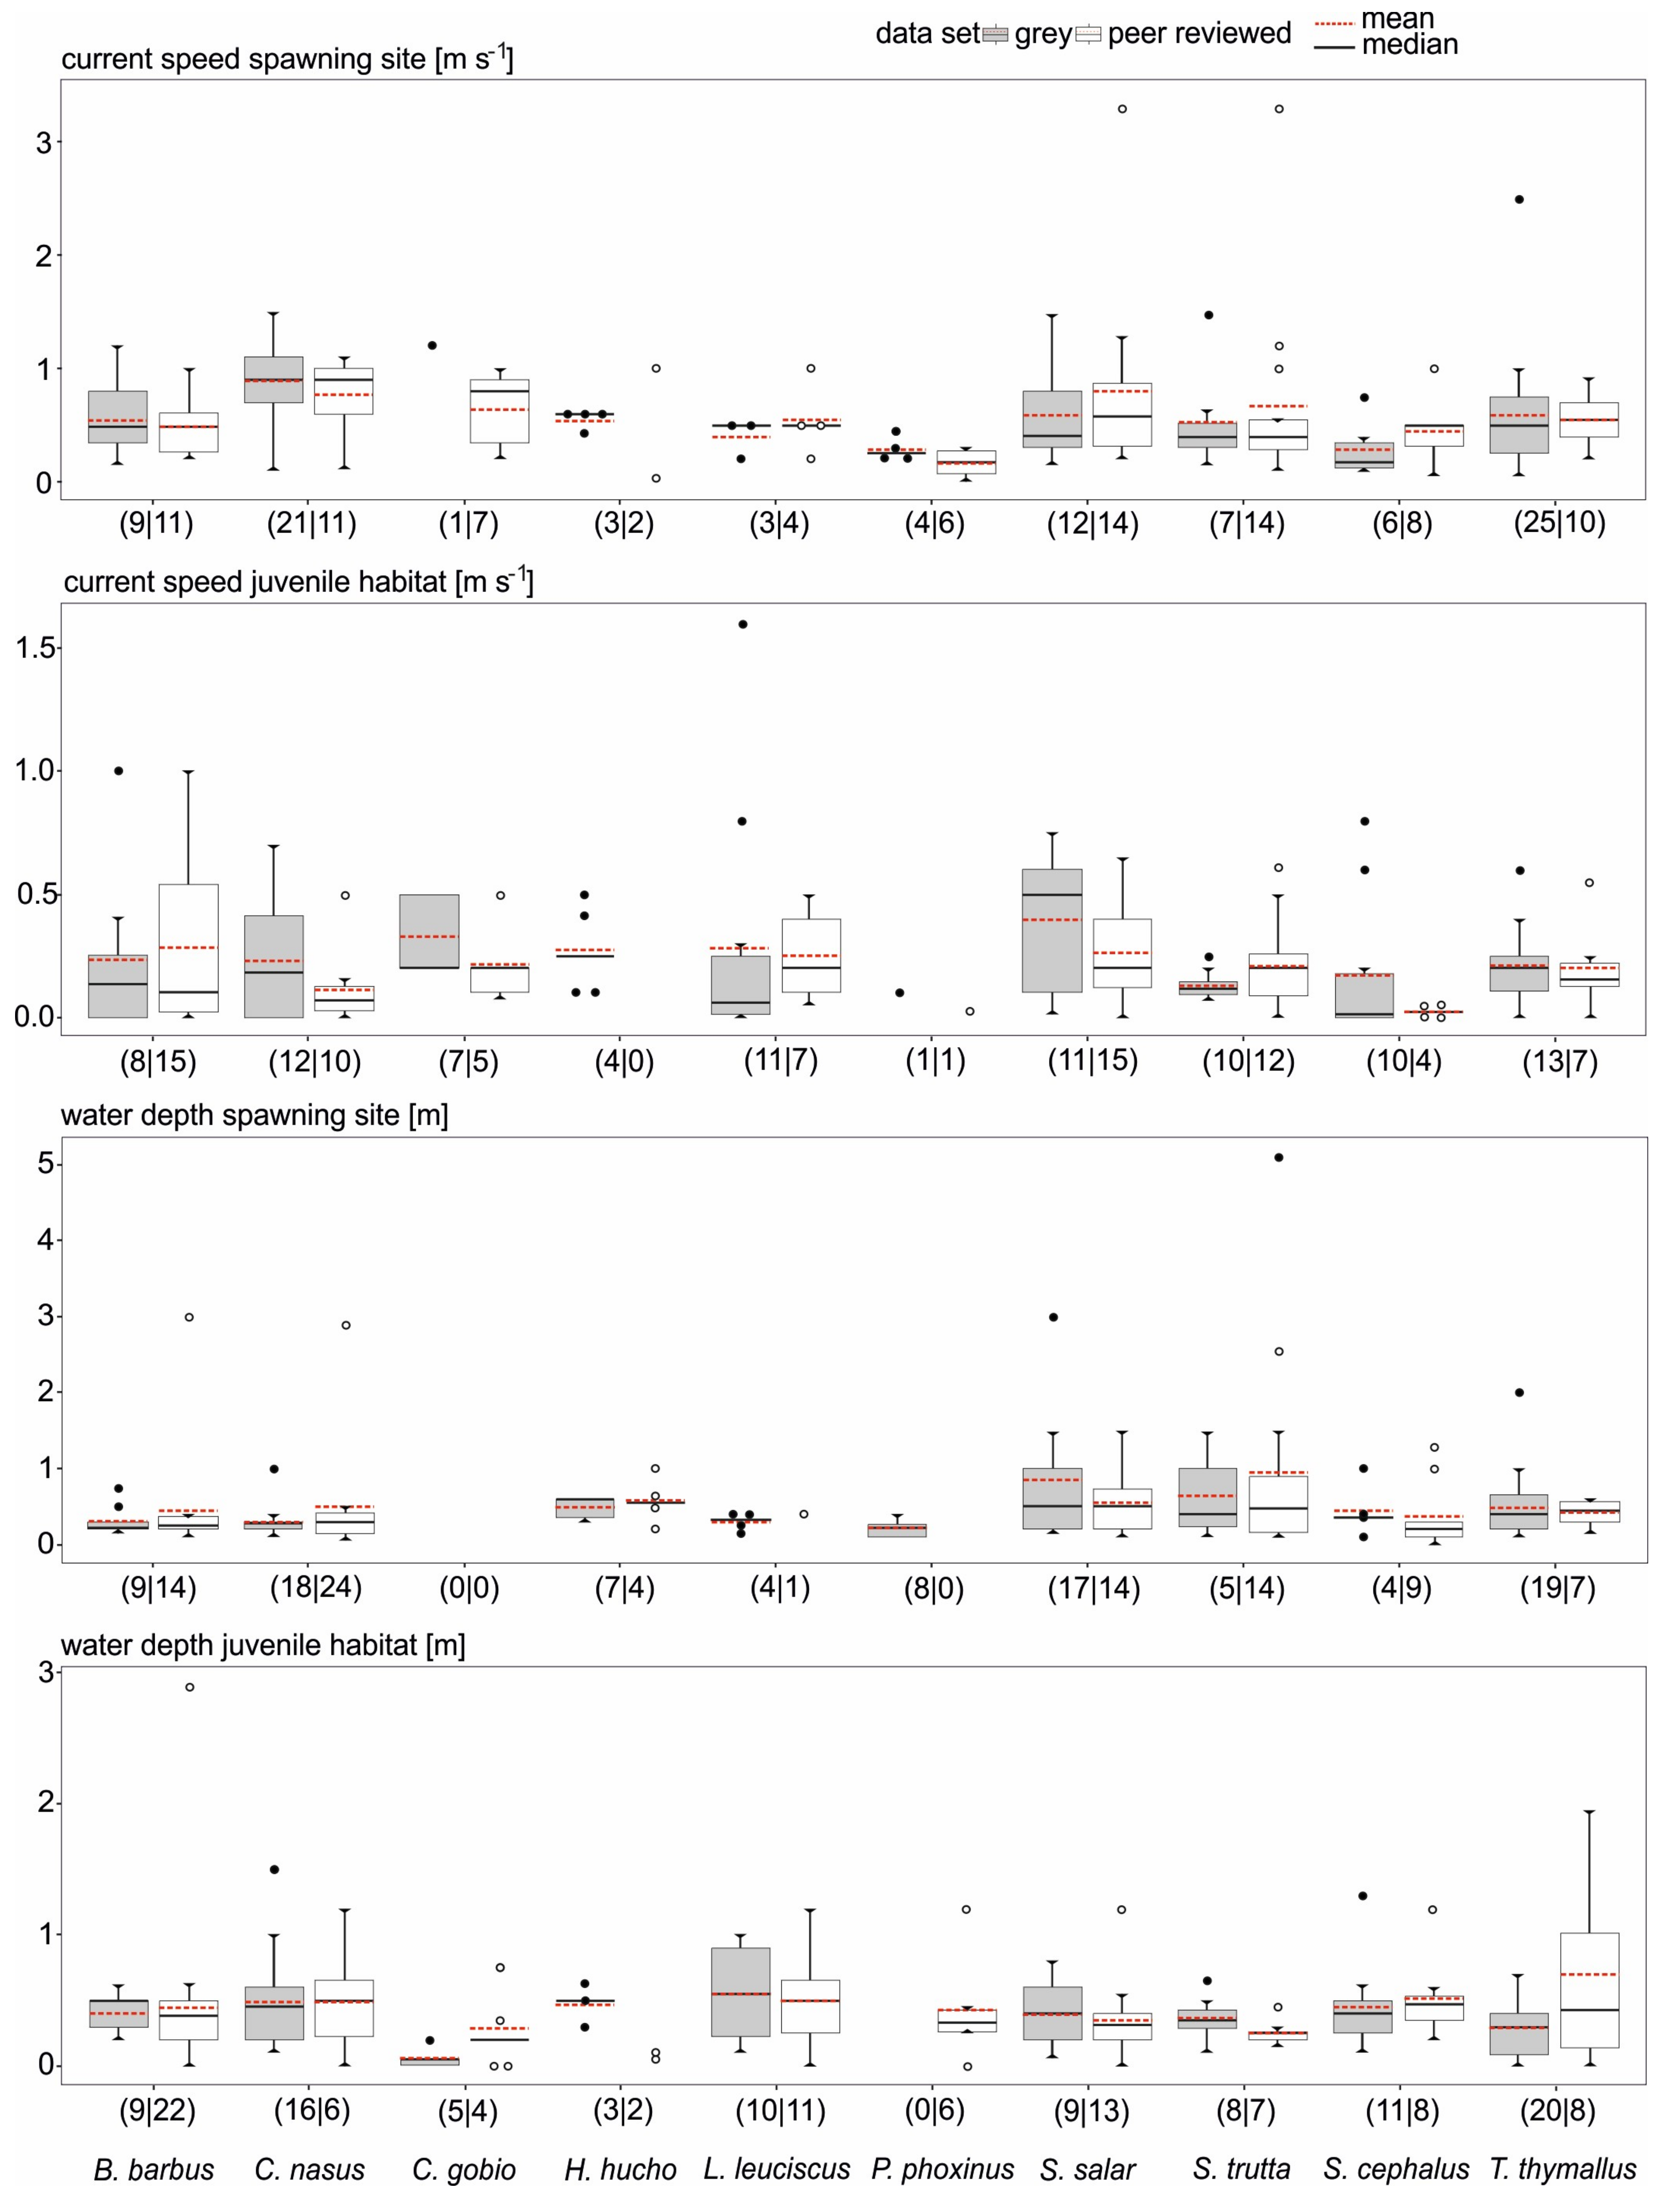
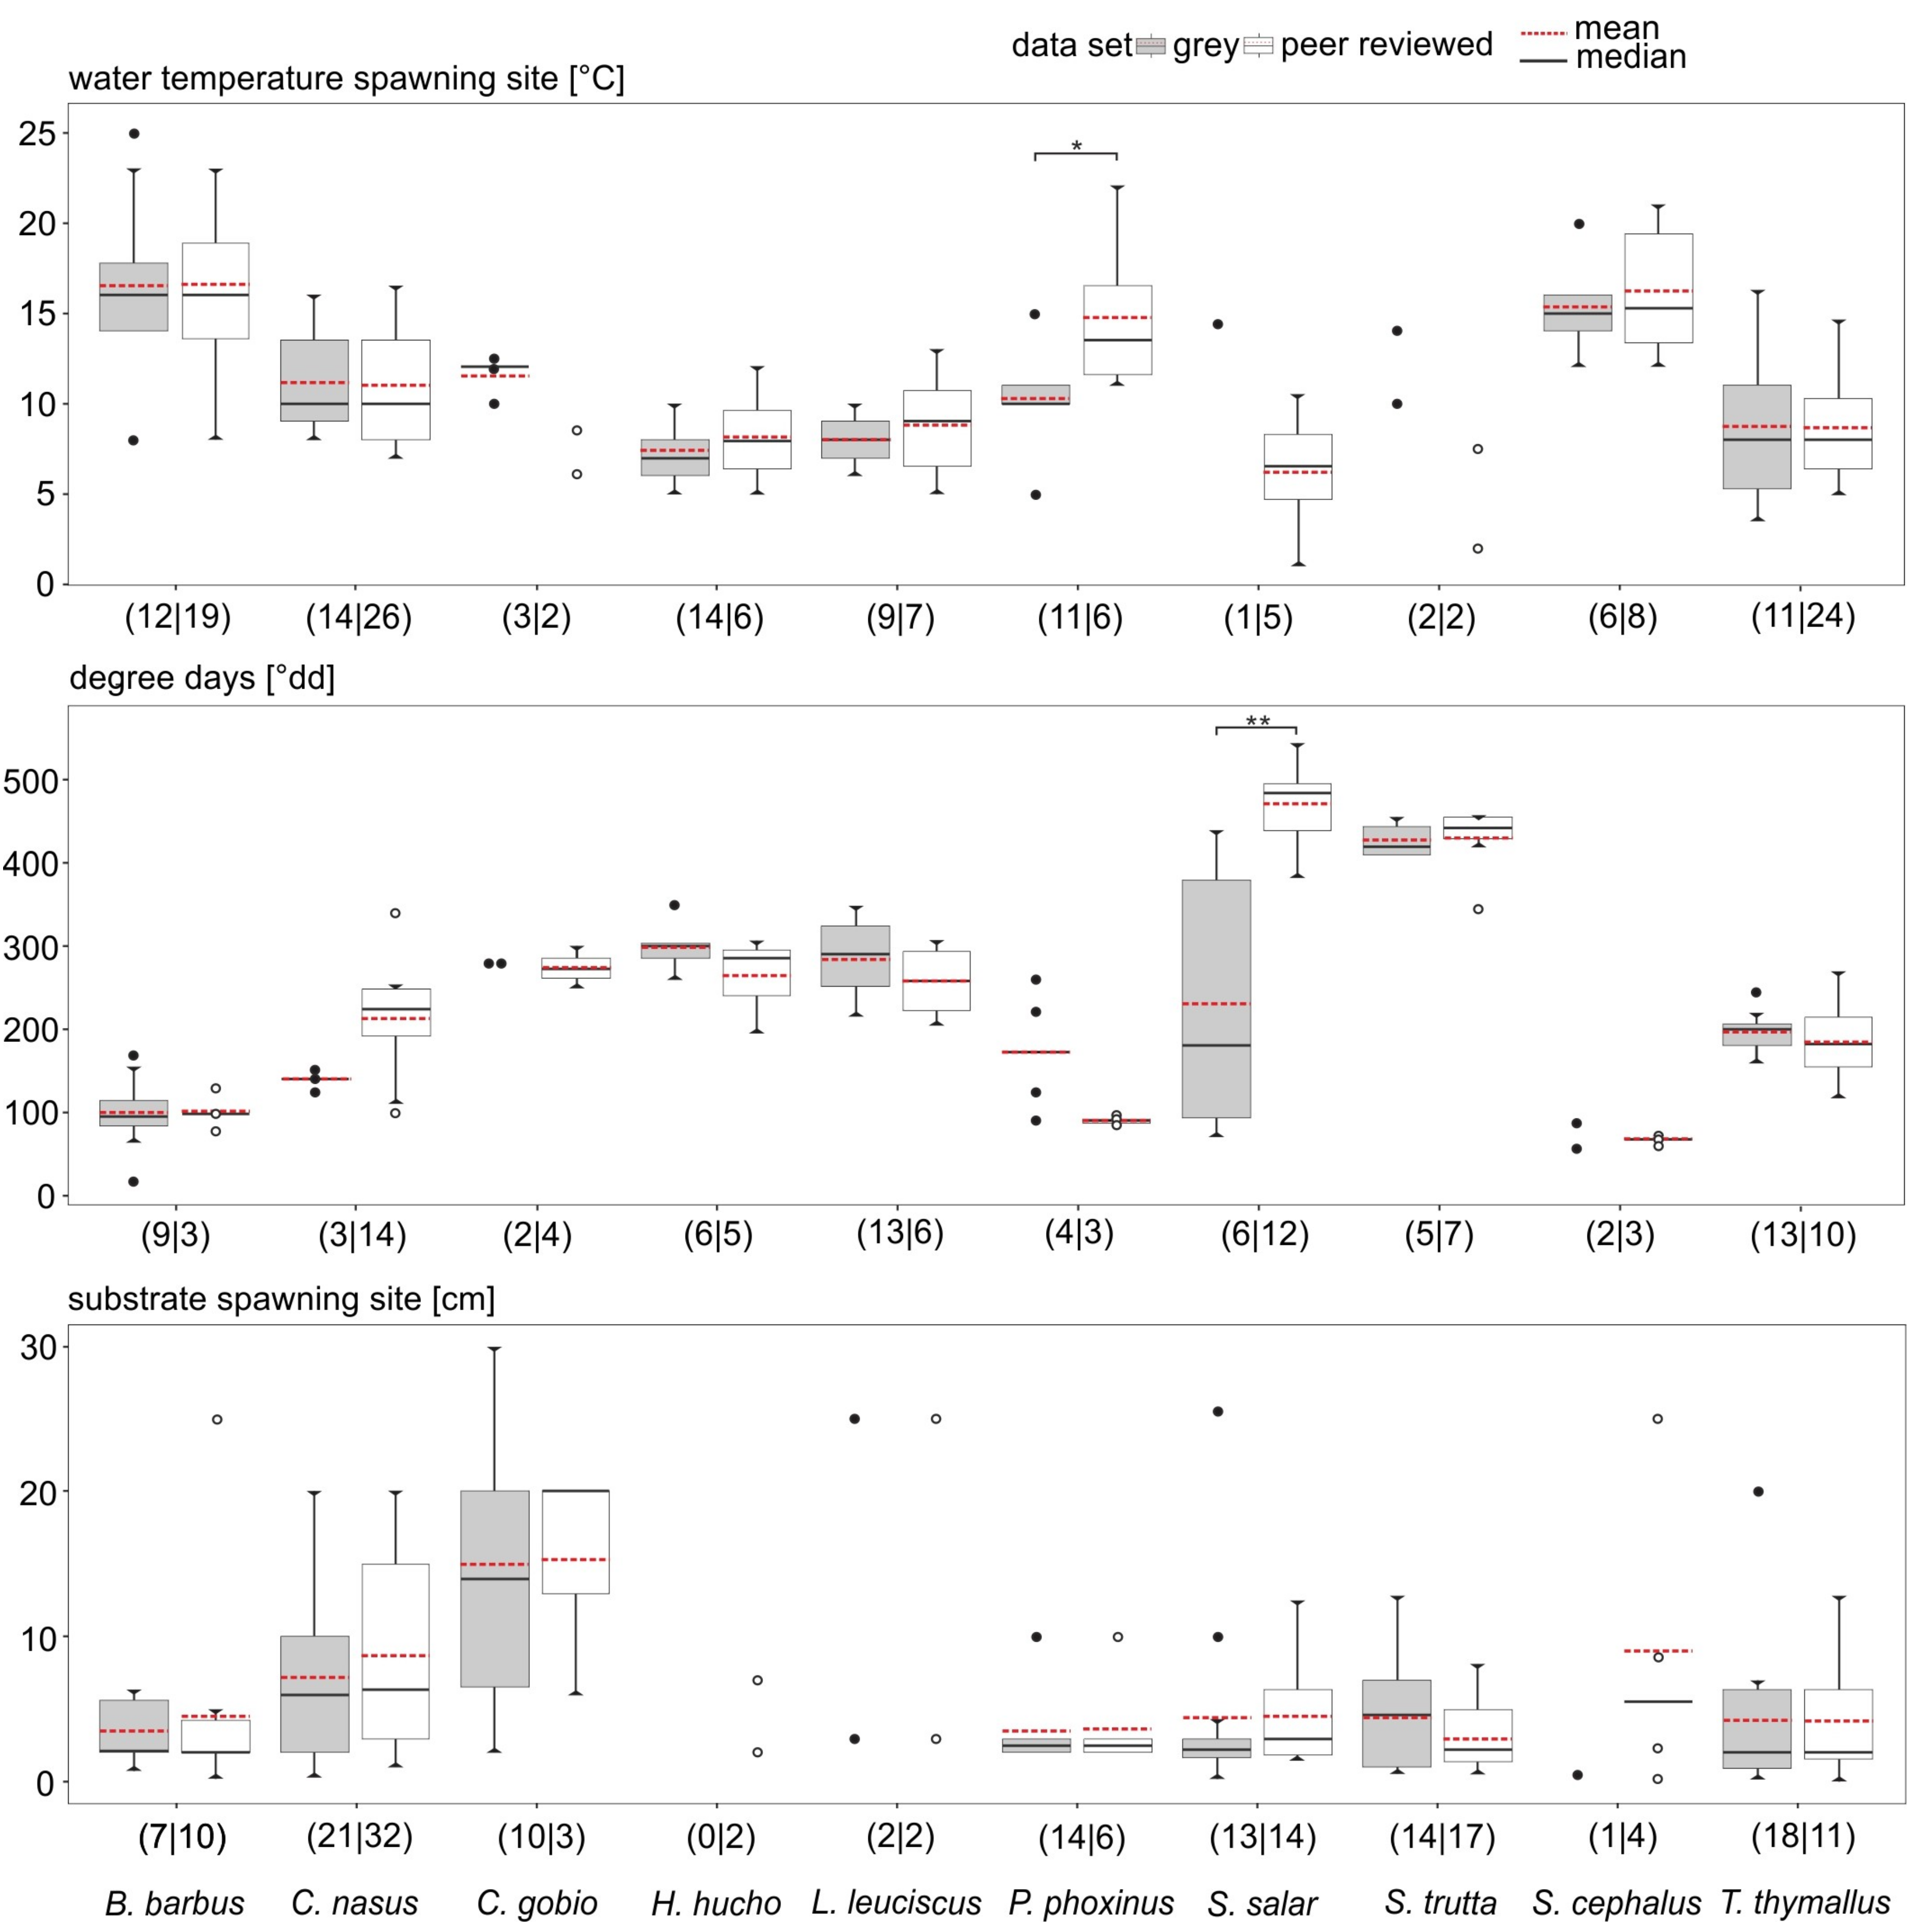
3.2. Data Comparability and Variability from Different Sources

Besides quantifying the differences in data availability, we also analyzed data comparability and variability depending on the source and species (Figure 3). In both, grey and peer-reviewed data, scatter occurred. However, except for “water temperature during spawning” at the spawning ground for European minnow (Wilcoxon rank sum test; p < 0.05 *) and “degree days” for Atlantic salmon (Wilcoxon rank sum test; p < 0.01 **) we found no significant difference in the number of data points between grey and peer-reviewed data for a specific parameter and fish species.
Furthermore, we found no linear relationship for the number of publications and the normalized data range (r2 = 0.101; Figure A1a), normalized mean (r2 = 0.013; Figure A1b), and normalized standard deviation (r2 = 0.002; Figure A1c), i.e., the assumption that a larger number of data points from different studies would increase the scatter, was not confirmed. For example, for the European grayling more data was available compared to the other species (seven to 25 values per parameter and source compared to the group mean of all species of 11 values). Variability of grey and peer-reviewed data was very similar where again for the Atlantic salmon, significant differences between both sources occurred. On the other hand, European chub and European dace showed a low variability within the data despite poor data availability.

3.3. Data Quality Differences Among Species

Grey and peer-reviewed data showed an overall similarity between matrices (RELATE, Spearman’s rank correlation coefficient (Rho): 0.8, significance level 0.1%, 999 permutations). The nMDS on the basis of the ecological parameters (comparison of median values) led to a segregation of the fish species (Figure 4).
Except for European grayling, the salmonids aggregated close to each other, as well as common barbel, European chub, and European minnow. We also found some shifts in preferences when comparing the positions of the combined and peer-reviewed data sets per species. The distance between the bubbles indicates a higher dissimilarity in the data while overlaps point to more similar data. Thus, considerable differences were visible for Danube salmon and brown trout, whereas for European grayling the inclusion of grey literature just added more values in accordance to the peer-reviewed data base. The size of the bubbles also clearly showed the overall differences in the data availability of the species depending on the source. The vector overlay of the data points per species and all ecological parameters indicated which of the species had the most data points on a specific parameter. For species aligned on or close to a line more data was available on that specific trait than for species further away. Accordingly, all salmonids but European grayling held the majority of the data (e.g., for “larval density” and “number of redds on spawning site”). We found most data on the parameters “days till hatch” and “water depth at juvenile habitats” for European bullhead and common nase.

4. Discussion

In this study, we applied a systematical meta-analysis approach to summarize data from grey and peer-reviewed literature on selected life history traits, ecological parameters, and habitat requirements related to the most critical life stages of ten riverine fish species. We found substantial deficits in the data for about a quarter of the reviewed ecological parameters across all species. In particular, data on individual densities in the habitats, egg development and information about juvenile stages was scarce. This is very surprising since such data is particularly crucial for any population modeling and management [42,43,44] as well as for evidence-based conservation [18] and restoration [19,20]. Searching for grey and peer-reviewed data yielded the same amount of data points, and also revealed their similarity in dispersion and variance. The poor data availability for different species corresponds very well to previous works reporting that common species of high economic importance are usually better studied and overrepresented in publications as e.g., evident for brown trout and Atlantic salmon (e.g., [45,46]). Both species are of high economic value in Europe [47,48]. Further, the common nase, once a very common species, became a target fish for conservation and restoration of European rivers since its rapid decline in the last century [28]. Common barbel and European grayling are both character species of specific river zones and are considered indicators for the ecological integrity of a riverine fish region [49,50]. In contrast, the mainly small-bodied endemic species of low societal and economic interest have been rarely investigated. Consequently, data is scarce and analyses are often based on a rather low number of sources (e.g., we found only 23 peer-reviewed studies for European minnow searching for 26 ecological parameters). As a result, practical applications, e.g., in the context of conservation or management, are often prioritized for species with high data availability and appreciation both in economical or conservation terms. However, the rehabilitation of fish stocks is not only dependent on abiotic factors such as habitat quality [51]. It is also dependent on biotic interactions among the entire fish community, as observed for many novel communities that are severely affected by invasive species [52,53,54], or by predator–prey relationships [55], involving apex predators like the Danube salmon [56]. Therefore, it is advantageous to ground conservation applications of fish populations on a broader basis. This can help to enhance restoration success [26,57] and to achieve a sustainable ecosystem based fisheries management (EBFM) as suggested by Fletcher et al. [58]. Although this concept has developed more recently in marine environments, it should be equally considered in freshwater ecosystems.
Another reason for limited data availability is the accessibility of literature. The first studies on critical life stage-specific ecological parameters of the species covered in this review were conducted before the 1960s (e.g., common barbel 1949, European bullhead 1957, and common nase 1958), and sometimes even reach back as far as the 1940s (Danube salmon 1910, brown trout 1932, and European grayling 1937). Old publications like that are harder to access, especially via the common online search engines like Google Scholar and Web of Knowledge. We found the original articles to be often solely accessible through university libraries and research institutes, and copies were not always available or very costly to get. However, old studies can be very beneficial to evaluate the species conservation status and may furthermore present insights on how autecological preferences of fish species change over time.
Additionally, a severe problem is the highly random accessibility of grey literature. In this review, grey literature displayed a hidden value on autecological data that was found to be within the quality range of peer-reviewed literature. Numerous autecology-related data on fish species presented in methodological studies and monitoring reports are generated by governmental or industrial projects for the assessment and management of the ecological integrity of freshwaters as well as by monitoring to implement national legislation such as Environmental impact assessments [19,26]. However, most of these reports are written in the language of the country in which they were commissioned making them difficult to find via English key words. If found, their content is restricted to readers that know the language. In addition, as Silva et al., [26] state in their paper on fish passage science, the current practice of decentralized collection by different institutions, based on individual measures, dramatically restricts causal research. This, in turn, can result in decision making based on anecdotal rather than scientific evidence. Since many of these reports are not openly accessible for the general public it contradicts the principles of "Open Data" and the FAIR criteria according to which data should be searchable, accessible, interoperable, and reusable as suggested by Pander and Geist [19] and Silva et al. [26].
An ongoing problem, which contributes to the difficulties in comparing autecological studies, is the missing standardization of methods and materials used in ecological field studies [59,60]. To date, a great variety of methods, materials, and ways of data presentations exist, making it difficult to compare even simple traits within one species. During the search process of this review, we dismissed many sources, including peer-reviewed articles, because the authors did not use a measurement standard or the procedure of data collection was insufficiently described, hampering their use. This was particularly apparent for spatially referenced data. It is not surprising that most literature was available for physical parameters like current speed or water depth, since those are often well defined and based on a standardized sampling procedure (e.g., [61]). However, during our search, we found substrate size mostly described by using either notations of standardized classification systems (e.g., resulting from sieving the material, [62]) or expressed after visual estimations in the field. We found 29 different descriptions of preferred substrate during spawning (e.g., gravel, sand, cobble, pebble or boulders, sand and silt, blocks, big stones, coarse gravel, crushed rock, etc.). None of them referred to a common standard, e.g., the European Standard (EN 933-1, 1997) or the Udden-Wentworth grain size classification [63,64,65,66], making systematic analyses very difficult to compare.
Biotic data, such as the number of individuals in a designated habitat, can be measured in multiple ways depending on the situation, which creates multiple data sets that are hardly comparable. For example, species abundance would be described either as individuals per 100 m river length or by individuals per m2. Certainly, there are good reasons why one is sometimes favored over the other. For large datasets in well-studied species, this is likely to be less problematic than in understudied species where a small data basis gets further reduced applying strict standards.
To mitigate these issues, a classification and standardization system for streams and stream habitats was already developed in 1986 by Frissell et al., [67]. However, today for many fish species, space requirements for self-sustaining populations are largely unknown. Factors like the high habitat complexity required by many species, as well as the ongoing, highly controversial discussion about the definition of a population and the concept of a minimum viable population [68,69,70,71] hinder the measures associated with them.
Besides the substantial deficits in the data, our review revealed that grey and peer-reviewed data could be used to complement each other. The underrated input of knowledge from grey sources has been lately discussed in the scientific community (e.g., [72,73,74]) and the authors concluded, that by including grey literature publication bias could be reduced and comprehensiveness and timeliness raised. Grey literature may therefore provide a more balanced picture of available data and knowledge. Of course, when including grey literature, the same standard as for using peer-reviewed literature should be applied. Further, there might be a publication error in a way that many ecological data reported in the grey literature will not be accepted into peer-reviewed journals because the latter have shifted their scope away from basic data compilation. This potential bias might selectively comprise especially high quality grey literature such as theses, which include disproportionately high quality ecological data without publishing them beyond the thesis.
Nonetheless, in the general overview of the nMDS we found some exceptions were grey and peer-reviewed literature was not fully in accordance with each other. That observation was found for Danube salmon and brown trout, as the distance between the two data sets indicated some differences. For Danube salmon grey literature dominated the data availability and the addition of these data to the peer-reviewed pool led to a shift as there was now more data on all ecological parameters available that were not examined in the peer-reviewed literature. For brown trout we found an equal amount of grey and peer-reviewed data. However, the distribution of the data points per ecological parameter, besides the physical variables, varied depending on the literature source. Hence, for “areal size”, “redds per spawning site”, and “eggs per square meter” all or the majority of data were derived from grey literature sources. In contrast, data for “larval density”, “spawning events” and “days till hatch” were predominantly based on peer-reviewed sources. Another exception to the high coherence between grey and peer-reviewed literature was found for “degree days” of Atlantic salmon and “water temperature spawning” for European minnow. While the four peer-reviewed sources had been quite consistent, the values of the four grey literature sources varied considerably. Again, reasons for these deviations include the lack of standardized measuring and reporting, some as basic as whether the data were derived from a natural or laboratory observations (e.g., [75,76]).

5. Conclusions

Ideally, population conservation actions and strategies should be evidence-based with underlying rich and reliable data. Four aspects appear particularly crucial: (1) closing existing autecological knowledge gaps, (2) better standardization during data generation and reporting, (3) accessibility, and (4) inclusion of additional data sources that complement peer-reviewed literature.
Closing existing autecological knowledge gaps primarily relates to the need of further research into currently understudied species of low socioeconomic appreciation, but also in spatial requirements and early-life stage ecology for prominent and understudied species (e.g., spawning site size, juveniles per m2). Establishing standards in data generation and reporting refer to the need to clearly distinguish well-defined laboratory experiments from field studies as well as to include a minimum set of directly comparable physicochemical parameters (e.g., water temperature, current speed, water depth, following international texture definitions for substrate, etc.) and strict biological endpoint definitions (hatching stages, size of a minimum viable population, etc.). Data accessibility can be improved if “Open Data” policies are applied. This can be achieved if funding entities oblige researchers to disseminate their data (including a link to the original study) on international open online data bases such as FishBase (fishbase.se). This process could be similar to that for the National Center for Biotechnology Information (NCBI), which provides open access to biomedical and genomic information and offers a checklist of minimum standards that need to be met before uploading material to ensure high comparability of data. In times of striking headlines, the findability of literature via conventional keywords can be hindered (e.g., substrate preference of Barbus barbus) since some of these wordings may appear unattractive. However, using standard keywords is still the most effective way to notably improve the findability of sources. Further, the use of the English language is highly recommended to allow access to knowledge and data for people beyond the own country. The last aspect is the recommendation to consider grey literature such as academic theses and dissertations, research-, committee- and government reports as potential data source to improve comprehensiveness and timeliness of the data, which will then provide a more balanced picture of available knowledge.

Supplementary Materials

The following Supplementary Materials are available online at https://www.mdpi.com/2071-1050/11/18/5011/s1, Table S1: Overview information about the ten chosen species reviewed, Table S2: Grey and peer-reviewed literature sources, Table S3: Compiled data points for ten riverine species on 25 ecological parameters used for univariate and multivariate statistics in the review.

Author Contributions

Conceptualization, N.S., M.M., J.G., J.P., C.W.; methodology, N.S.; validation, N.S., J.P., M.M., J.G., C.W. and R.v.T.; formal analysis, N.S., M.M.; investigation, N.S.; resources, J.G.; writing—original draft preparation, N.S.; writing—review and editing, N.S., J.G., J.P., M.M., C.W. and R.v.T.

Funding

This research was funded by the European Union’s Horizon 2020 research and innovation program under grant agreement No 727830.

Acknowledgments

We are grateful to the experts of the FIThydro project for sharing their expertise and data.

Conflicts of Interest

The authors declare no conflict of interest.

Appendix A

Table A1. Search strings.
Species NameEnvironmental Parameter
German English Latin
Barbeorcommon barbelorBarbus barbus+ areal size
Naseorcommon naseorChondrostoma nasus+ current speed juvenile
Mühlkoppe or Groppe *orEuropean bullheadorCottus gobio+ current speed spawning site
HuchenorDanube salmonorHucho hucho+ days till hatch
HaselorEuropean daceorLeuciscus leuciscus+ degree days
ElritzeorEuropean minnoworPhoxinus phoxinus+ egg depth
Atlantischer LachsorAtlantic salmonorSalmo salar+ eggs per female
Bachforelleorbrown troutorSalmo trutta+ eggs per m2
Döbel or Aitel *orEuropean chuborSqualius cephalus+ eggs per redd
ÄscheorEuropean graylingorThymallus thymallus+ eggs spawning site
+ hatch rate
+ juvenile per m2
+ larval density
+ larval survival
+ population density
+ nest size
+ redd size
+ redds spawning site
+ spawner density spawning site
+ spawning events
+ spawning site size
+ substrate juvenile
+ substrate spawning site
+ water depth juvenile
+ water depth spawning site
+ water temperature spawning
+ habitat
+ spawning
+ eggs
+ individual density
+ hatch success
+ substrate
+substrate quality
+ juvenile
+ fecundity
+ autecology
* Equally used common names of the species depending on the German region.
Figure A1. Test for linear relationship between the number of publications and the normalized range (a), normalized mean (b), and normalized standard deviation (c) of the seven selected ecological parameters as specified in Table 1.
Sustainability 11 05011 g0a1

References

  1. Aarts, B.G.; Van Den Brink, F.W.; Nienhuis, P.H. Habitat loss as the main cause of the slow recovery of fish faunas of regulated large rivers in Europe: The transversal floodplain gradient. River Res. Appl. 2004, 20, 3–23. [Google Scholar] [CrossRef]
  2. Dudgeon, D.; Arthington, A.H.; Gessner, M.O.; Kawabata, Z.I.; Knowler, D.J.; Lévêque, C.; Naiman, R.J.; Prieur-Richard, A.; Soto, D.; Stiassny, M.L.J.; et al. Freshwater biodiversity: Importance, threats, status and conservation challenges. Biol. Rev. 2006, 81, 163–182. [Google Scholar] [CrossRef] [PubMed]
  3. Ormerod, S.J.; Dobson, M.; Hildrew, A.G.; Townsend, C. Multiple stressors in freshwater ecosystems. Freshw. Biol. 2010, 55, 1–4. [Google Scholar] [CrossRef]
  4. Arthington, A.H.; Dulvy, N.K.; Gladstone, W.; Winfield, I.J. Fish conservation in freshwater and marine realms: Status, threats and management. Aquat. Conserv. Mar. Freshw. Ecosyst. 2016, 26, 838–857. [Google Scholar] [CrossRef]
  5. Bierschenk, B.M.; Pander, J.; Mueller, M.; Geist, J. Fish injury and mortality at pumping stations: A comparison of conventional and fish-friendly pumps. Mar. Freshw. Res. 2018, 70, 449–458. [Google Scholar] [CrossRef]
  6. Auerswald, K.; Moyle, P.; Seibert, S.P.; Geist, J. HESS Opinions: Socio-economic and ecological trade-offs of flood management - benefits of a transdisciplinary approach. Hydrol. Earth Syst. Sci. 2019, 23, 1035–1044. [Google Scholar] [CrossRef]
  7. Grill, G.; Lehner, B.; Thieme, M.; Geenen, B.; Tickner, D.; Antonelli, F.; Babu, S.; Borrelli, L.; Crochetiere, C.H.; Macedo, H.E.; et al. Mapping the world’s free-flowing rivers. Nature 2019, 569, 215. [Google Scholar] [CrossRef]
  8. Lucas, M.C.; Frear, P.A. Effects of a flow-gauging weir on the migratory behaviour of adult barbel, a riverine cyprinid. J. Fish Biol. 1997, 50, 382–396. [Google Scholar] [CrossRef]
  9. Caudill, C.C.; Daigle, W.R.; Keefer, M.L.; Boggs, C.T.; Jepson, M.A.; Burke, B.J.; Zabel, R.W.; Bjornn, T.C.; Peery, C.A. Slow dam passage in adult Columbia River salmonids associated with unsuccessful migration: Delayed negative effects of passage obstacles or condition-dependent mortality? Can. J. Fish. Aquat. Sci. 2007, 64, 979–995. [Google Scholar] [CrossRef]
  10. Wolter, C.; Buijse, A.D.; Parasiewicz, P. Temporal and spatial patterns of fish response to hydromorphological processes. River Res. Appl. 2016, 32, 190–201. [Google Scholar] [CrossRef]
  11. Mueller, M.; Pander, J.; Geist, J. The effects of weirs on structural stream habitat and biological communities. J. Appl. Ecol. 2011, 48, 1450–1461. [Google Scholar] [CrossRef]
  12. Santucci, V.J., Jr.; Gephard, S.R.; Pescitelli, S.M. Effects of multiple low-head dams on fish, macroinvertebrates, habitat, and water quality in the Fox River, Illinois. N. Am. J. Fish. Manag. 2005, 25, 975–992. [Google Scholar] [CrossRef]
  13. Catalano, M.J.; Bozek, M.A.; Pellett, T.D. Effects of dam removal on fish assemblage structure and spatial distributions in the Baraboo River, Wisconsin. N. Am. J. Fish. Manag. 2007, 27, 519–530. [Google Scholar] [CrossRef]
  14. Spens, J.; Englund, G.; Lundqvist, H. Network connectivity and dispersal barriers: Using geographical information system (GIS) tools to predict landscape scale distribution of a key predator (Esox lucius) among lakes. J. Appl. Ecol. 2007, 44, 1127–1137. [Google Scholar] [CrossRef]
  15. Slawski, T.M.; Veraldi, F.M.; Pescitelli, S.M.; Pauers, M.J. Effects of tributary spatial position, urbanization, and multiple low-head dams on warmwater fish community structure in a Midwestern stream. N. Am. J. Fish. Manag. 2008, 28, 1020–1035. [Google Scholar] [CrossRef]
  16. Nislow, K.H.; Hudy, M.; Letcher, B.H.; Smith, E.P. Variation in local abundance and species richness of stream fishes in relation to dispersal barriers: Implications for management and conservation. Freshw. Biol. 2011, 56, 2135–2144. [Google Scholar] [CrossRef]
  17. Langhans, S.; Gessner, J.; Hermoso, V.; Wolter, C. Coupling systematic planning and expert judgement enhances the efficiency of river restoration. Sci. Total Environ. 2016, 560, 266–273. [Google Scholar] [CrossRef]
  18. Geist, J. Seven steps towards improving freshwater conservation. Aquat. Conserv. Mar. Freshw. Ecosyst. 2015, 25, 447–453. [Google Scholar] [CrossRef]
  19. Pander, J.; Geist, J. Ecological indicators for stream restoration success. Ecol. Indic. 2013, 30, 106–118. [Google Scholar] [CrossRef]
  20. Geist, J.; Hawkins, S.J. Habitat recovery and restoration in aquatic ecosystems: Current progress and future challenges. Aquat. Conserv. 2016, 26, 942–962. [Google Scholar] [CrossRef]
  21. Van Looy, K.; Tonkin, J.D.; Floury, M.; Leigh, C.; Soininen, J.; Larsen, S.; Heino, J.; Poff, N.L.; Delong, M.; Jähnig, S.C.; et al. The three Rs of river ecosystem resilience: Resources, Recruitment and Refugia. River Res. Appl. 2019, 35, 107–120. [Google Scholar] [CrossRef]
  22. Casas-Mulet, R.; Saltveit, S.J.; Alfredsen, K. The survival of Atlantic salmon (Salmo salar) eggs during dewatering in a river subjected to hydropeaking. River Res. Appl. 2015, 31, 433–446. [Google Scholar] [CrossRef]
  23. Radinger, J.; Kail, J.; Wolter, C. Differences among expert judgments of fish habitat suitability and implications for river management. River Res. Appl. 2017, 33, 538–547. [Google Scholar] [CrossRef]
  24. Duerregger, A.; Pander, J.; Palt, M.; Mueller, M.; Nagel, C.; Geist, J. The importance of stream interstitial conditions for the early-life-stage development of the European nase (Chondrostoma nasus L.). Ecol. Freshw. Fish 2018, 27, 920–932. [Google Scholar] [CrossRef]
  25. Morandi, B.; Kail, J.; Toedter, A.; Wolter, C.; Piégay, H. Diverse approaches to implement and monitor river restoration: A comparative perspective in France and Germany. Environ. Manag. 2017, 60, 931–946. [Google Scholar] [CrossRef] [PubMed]
  26. Silva, A.T.; Lucas, M.C.; Castro-Santos, T.; Katopodis, C.; Baumgartner, L.J.; Thiem, J.D.; Aarestrup, K.; Pompeu, P.S.; O’Brien, G.C.; Braun, D.C.; et al. The future of fish passage science, engineering, and practice. Fish Fish. 2018, 19, 340–362. [Google Scholar] [CrossRef]
  27. Geist, J. Integrative freshwater ecology and biodiversity conservation. Ecol. Indic. 2011, 11, 1507–1516. [Google Scholar] [CrossRef]
  28. Mueller, M.; Pander, J.; Geist, J. Comprehensive analysis of >30 years of data on stream fish population trends and conservation status in Bavaria, Germany. Biol. Conserv. 2018, 226, 311–320. [Google Scholar] [CrossRef]
  29. McDonald, J.H. Handbook of Biological Statistics, 3rd ed.; Sparky House Publishing: Baltimore, MD, USA, 2014; pp. 157–164. [Google Scholar]
  30. RC Team. R: A Language and Environment for Statistical Computing; R Foundation for Statistical Computing: Vienna, Austria, 2018; Available online: http://www.R-project.org (accessed on 6 July 2018).
  31. Fox, J.; Weisberg, S. An {R} Companion to Applied Regression, 2nd ed.; Sage: Thousand Oaks, CA, USA, 2011; Available online: http://socserv.socsci.mcmaster.ca/jfox/Books/Companion (accessed on 20 February 2018).
  32. Wickham, H.; François, R.; Henry, L.; Müller, K. dplyr: A Grammar of Data Manipulation. R package version 0.7.5. 2018. Available online: https://CRAN.R-project.org/package=dplyr (accessed on 6 July 2018).
  33. Chang, W. Extrafont: Tools for Using Fonts. R package version 0.17. 2014. Available online: https://CRAN.R-project.org/package=extrafont (accessed on 20 February 2018).
  34. Rudis, B.; Bolker, B.; Schulz, J.; Kothari, A.; Sidi, J. ggalt: Extra Coordinate Systems, ‘Geoms’, Statistical Transformations, Scales and Fonts for ‘ggplot2’. R package version 0.6.0. 2017. Available online: https://github.com/hrbrmstr/ggalt (accessed on 6 July 2018).
  35. Wickham, H. ggplot2: Elegant Graphics for Data Analysis, 2nd ed.; Springer-Verlag: New York, NY, USA, 2009; p. 213. [Google Scholar] [CrossRef]
  36. Warnes, G.R.; Bolker, B.; Bonebakker, L.; Gentleman, R.; Liaw, W.H.A.; Lumley, T.; Maechler, M.; Magnusson, A.; Moeller, S.; Schartz, M.; et al. gplots: Various R Programming Tools for Plotting Data. R package version 3.0.1. 2016. Available online: https://CRAN.R-project.org/package=gplots (accessed on 6 July 2018).
  37. RC Team. R: A Language and Environment for Statistical Computing; R Foundation for Statistical Computing: Vienna, Austria, 2017; Available online: https://www.R-project.org/ (accessed on 20 February 2018).
  38. Wickham, H. The Split-Apply-Combine Strategy for Data Analysis. J. Stat. Softw. 2011, 40, 1–29. Available online: http://www.jstatsoft.org/v40/i01/ (accessed on 20 February 2018). [CrossRef] [Green Version]
  39. Neuwirth, E. RColorBrewer: ColorBrewer Palettes. R package version 1.1-2. 2014. Available online: https://CRAN.R-project.org/package=RColorBrewer (accessed on 20 February 2018).
  40. Wickham, H.; Henry, L. Tidyr: Easily Tidy Data with ‘spread()’ and ‘gather()’ Functions. R package version 0.8.1. 2018. Available online: https://CRAN.R-project.org/package=tidyr (accessed on 6 July 2018).
  41. McCune, B.; Grace, J.B. Analysis of Ecological Communities, 1st ed.; MjM Software Design: Gleneden Beach, OR, USA, 2002; p. 300. [Google Scholar]
  42. Anders, P.J. Conservation aquaculture and endangered species. Fisheries 1998, 23, 28–31. [Google Scholar]
  43. Schiemer, F.; Keckeis, H.; Kamler, E. The early life history stages of riverine fish: Ecophysiological and environmental bottlenecks. Comp. Biochem. Physiol. 2002, 133, 439–449. [Google Scholar] [CrossRef]
  44. Rhodes, J.R.; Ng, C.F.; de Villiers, D.L.; Preece, H.J.; McAlpine, C.A.; Possingham, H.P. Using integrated population modelling to quantify the implications of multiple threatening processes for a rapidly declining population. Biol. Conserv. 2011, 144, 1081–1088. [Google Scholar] [CrossRef]
  45. Denic, M.; Geist, J. Habitat suitability analysis for lacustrine brown trout (Salmo trutta) in Lake Walchensee, Germany: Implications for the conservation of an endangered flagship species. Aquat. Conserv. 2010, 20, 9–17. [Google Scholar] [CrossRef]
  46. Mertens, M.; Bösiger, R.; Imhof, P.; Knutti, A.; Küry, D.; Staub, E. Der Lachs—Ein Fisch kehrt zurück, 1st ed.; Haupt Verlag: Bern, Switzerland, 2011; p. 264. [Google Scholar]
  47. Butler, J.R.; Radford, A.; Riddington, G.; Laughton, R. Evaluating an ecosystem service provided by Atlantic salmon, sea trout and other fish species in the River Spey, Scotland: The economic impact of recreational rod fisheries. Fish. Res. 2009, 96, 259–266. [Google Scholar] [CrossRef]
  48. ICES. Baltic Sea Ecoregion—Fisheries overview. Report of the ICES Advisory Committee, Section 4.2. 2018; 23. [Google Scholar] [CrossRef]
  49. Huet, M. Profiles and biology of western European streams as related to fish management. Trans. Am. Fish. Soc. 1959, 88, 155–163. [Google Scholar] [CrossRef]
  50. Lasne, E.; Bergerot, B.; Lek, S.; Laffaille, P. Fish zonation and indicator species for the evaluation of the ecological status of rivers: Example of the Loire basin (France). River Res. Appl. 2007, 23, 877–890. [Google Scholar] [CrossRef]
  51. Sternecker, K.; Wild, R.; Geist, J. Effects of substratum restoration on salmonid habitat quality in a subalpine stream. Environ. Biol. Fish. 2013, 96, 1341–1351. [Google Scholar] [CrossRef]
  52. Brandner, J.; Auerswald, K.; Cerwenka, A.F.; Schliewen, U.K.; Geist, J. Comparative feeding ecology of invasive Ponto-Caspian gobies. Hydrobiologia 2013, 703, 113–131. [Google Scholar] [CrossRef]
  53. Brandner, J.; Cerwenka, A.F.; Schliewen, U.K.; Geist, J. Bigger is better: Characteristics of round gobies forming an invasion front in the Danube River. PLoS ONE 2013, 8, e73036. [Google Scholar] [CrossRef] [PubMed]
  54. Cerwenka, A.; Brandner, J.; Schliewen, U.; Geist, J. Population trends of invasive alien gobies in the upper Danube River: 10 years after first detection of the globally invasive round goby (Neogobius melanostomus). Aquat. Invasions 2018, 13, 525–535. [Google Scholar] [CrossRef]
  55. Decker, E.; Linke, S.; Hermoso, V.; Geist, J. Incorporating ecological functions in conservation decision making. Ecol. Evol. 2017, 7, 8273–8281. [Google Scholar] [CrossRef] [Green Version]
  56. Schmutz, S.; Zitek, A.; Zobl, S.; Jungwirth, M.; Knopf, N.; Kraus, E.; Bauer, T.; Kaufmann, T. Integrated approach to the conservation and restoration of Danube salmon, Hucho hucho, populations in Austria. In Conservation of Freshwater Fishes: Options for the Future, 1st ed.; Cowx, I.G., Collares-Pereira, M.J., Coelho, M.M., Eds.; Fishing News Books: Oxford, UK, 2002; pp. 157–173. [Google Scholar]
  57. Lewis, C.A.; Lester, N.P.; Bradshaw, A.D.; Fitzgibbon, J.E.; Fuller, K.; Hakanson, L.; Richards, C. Considerations of scale in habitat conservation and restoration. Can. J. Fish. Aquat. Sci. 1996, 53, 440–445. [Google Scholar] [CrossRef]
  58. Fletcher, W.J.; Shaw, J.; Metcalf, S.J.; Gaughan, D.J. An ecosystem based fisheries management framework: The efficient, regional-level planning tool for management agencies. Mar. Pol. 2010, 34, 1226–1238. [Google Scholar] [CrossRef]
  59. Burgman, M.A.; Breininger, D.R.; Duncan, B.W.; Ferson, S. Setting reliability bounds on habitat suitability indices. Ecol. Appl. 2001, 11, 70–78. [Google Scholar] [CrossRef]
  60. Bonar, S.A.; Hubert, W.A. Standard sampling of inland fish: Benefits, challenges, and a call for action. Fisheries 2002, 27, 10–16. [Google Scholar] [CrossRef]
  61. Trudgill, D.L.; Honek, A.; Li, D.; Van Straalen, N.M. Thermal time–concepts and utility. Ann. Appl. Biol. 2005, 146, 1–14. [Google Scholar] [CrossRef]
  62. Blott, S.J.; Pye, K. Particle size scales and classification of sediment types based on particle size distributions: Review and recommended procedures. Sedimentology 2012, 59, 2071–2096. [Google Scholar] [CrossRef]
  63. EN933-1. European Standard. Tests for Geometrical Properties of Aggregates—Part 1: Determination of Particle Size Distribution—Sieving Methods, 1st ed.; The Office for Standards, Metrology and testing (ÚNMZ): Prague, Czech Republic, 2012; p. 10. [Google Scholar]
  64. Udden, J.A. Mechanical composition of clastic sediments. Bull. Geol. Soc. Am. 1914, 25, 655–744. [Google Scholar] [CrossRef]
  65. Wentworth, C.K. A scale of grade and class terms for clastic sediments. J. Geol. 1922, 30, 377–392. [Google Scholar] [CrossRef]
  66. Udden, J.A. The Mechanical Composition of Wind Deposits; Augustana Library Publications No 1: Rock Island, IL, USA, 1898; p. 69. [Google Scholar]
  67. Frissell, C.A.; Liss, W.J.; Warren, C.E.; Hurley, M.D. A hierarchical framework for stream habitat classification: Viewing streams in a watershed context. Environ. Manag. 1986, 10, 199–214. [Google Scholar] [CrossRef]
  68. Flather, C.H.; Hayward, G.D.; Beissinger, S.R.; Stephens, P.A. Minimum viable populations: Is there a ‘magic number’for conservation practitioners? Trends Ecol. Evol. 2011, 26, 307–316. [Google Scholar] [CrossRef] [PubMed]
  69. Brook, B.W.; Bradshaw, C.J.; Traill, L.W.; Frankham, R. Minimum viable population size: Not magic, but necessary. Trends Ecol. Evol. 2011, 26, 619–620. [Google Scholar] [CrossRef]
  70. Jamieson, I.G.; Allendorf, F.W. How does the 50/500 rule apply to MVPs? Trends Ecol. Evol. 2012, 27, 578–584. [Google Scholar] [CrossRef] [PubMed]
  71. Frankham, R.; Brook, B.W.; Bradshaw, C.J.; Traill, L.W.; Spielman, D. 50/500 rule and minimum viable populations: Response to Jamieson and Allendorf. Trends Ecol. Evol. 2013, 28, 187–188. [Google Scholar] [CrossRef]
  72. Conn, V.S.; Valentine, J.C.; Cooper, H.M.; Rantz, M.J. Grey literature in meta-analyses. Nurs. Res. 2003, 52, 256–261. [Google Scholar] [CrossRef]
  73. Haddaway, N.R.; Bayliss, H.R. Shades of grey: Two forms of grey literature important for reviews in conservation. Biol. Conserv. 2015, 191, 827–829. [Google Scholar] [CrossRef]
  74. Paez, A. Gray literature: An important resource in systematic reviews. J. Evid. Based Med. 2017, 10, 233–240. [Google Scholar] [CrossRef] [PubMed]
  75. Gerstmeier, R.; Romig, T. Die Süßwasserfische Europas, 1st ed.; Franckh-Kosmos Verlags-GmbH und Co.: Stuttgart, Germany, 1998; p. 367. [Google Scholar]
  76. Kottelat, M.; Freyhof, J. Handbook of European Freshwater Fishes, 1st ed.; Publications Kottelat: Cornol, Switzerland, 2007; p. 646. [Google Scholar]
Figure 1. Bar plot representing the number and type of literature sources and the resulting data points per species compiled for this review.
Sustainability 11 05011 g001
Figure 2. Heatmaps representing the number of data points found for all environmental variables and fish species. The color-gradient is picturing high (light blue) to low (red) data availability. The species were clustered according to data availability using the Euclidian distance. Abbreviations are defined in Table 1.
Sustainability 11 05011 g002
Figure 3. Box plots representing the compiled peer-review (white boxes) and grey (grey boxes) literature data on seven variables for each of the ten fish species. The numbers in brackets reflect the available data points. The dashed red line indicates the mean, the black line the median per species. Box: 25% quantile, 75% quantile; whiskers: minimum, maximum values; outliers refer to data points that are more than 1.5 IQR above the third quartile or below the first quartile; square brackets between boxes show significant differences between grey and peer-reviewed data sets. Significance levels are indicated as follows: 0.01 < p ≤ 0.05 *, 0.001 < p ≤ 0.01 **, and p ≤ 0.001 ***.
Sustainability 11 05011 g003aSustainability 11 05011 g003b
Figure 4. Non-metric multidimensional scaling (nMDS) plot showing the number of studies compiled for ten fish species including all reviewed environmental variables. The distance between the circles resembles the (dis-) similarity of their environmental needs (increasing distance = increasing dissimilarity). The circle size indicates the number of data points (N) found for each species differentiated in data derived from peer-reviewed sources (light grey) or combined with data from grey sources (dark grey). Included as a vector layer are the data on environmental parameters. The vector length represents the strength of correlation with the species arrangement (100% = outer circle line).
Sustainability 11 05011 g004
Table 1. Overview on the 26 ecological parameters considered to evaluate the autecological requirements of the 10 rheophilic species at risk.
Selected Ecological ParameterAcronymDescription
Population
population density (individuals m2, individuals m−1, kg ha−1, individuals per fish school)pop densreported density of individuals in a population
areal size (m2, km)areal sizereported areal size used by a population
Spawner
spawner density (individuals m−2)sp dens spsspawner density on spawning ground during spawning
spawning events per female (events female−1)spaw eventsspawning events per female per year
Spawning site
spawning site size (m2)sps sizesize of spawning site used by fish population
current speed spawning site (m s−1)cur speed spsmeasured current speed at spawning ground during spawning
substrate spawning site (cm, %, term)subs spssubstrate at spawning site
water depth spawning site (m)w depth spswater depth at spawning ground during spawning
water temperature spawning (°C)w temp spawwater temperature measured during spawning
Redd/Nest
redds at spawning site (redds m−1, redds m−2, redds spawning site−1)redds spstotal number of redds/nests per spawning site
redd size (m2)redd sizesize of a redd/nest
Egg and Larvae
egg depth (cm)egg depthdepth of eggs in interstitial zone
eggs (eggs m−2)eggs per m2eggs density found at spawning ground
eggs per female (eggs female−1)eggs per fnumber of eggs per female
eggs per redd (eggs redd−1)eggs per reddnumber of eggs in a redd/nest
eggs at spawning site (eggs sps−1)eggs spstotal number of eggs counted for a spawning site
days till hatch (days)days till hatchdays till hatch of fish larvae
degree days (days)degree daysdegree days till hatch of fish larvae
hatch rate/success (%)hatch ratehatching rates of eggs
larval survival (%)larv survpercentage of larvae surviving till yolk sack depletion
larvae density (individuals m−2)larv denslarvae density in larval habitats
Juvenile
* juvenile survival (%)juv survpercentage of juvenile surviving first year post hatching
juveniles per m2 (juveniles m−2)juv per m2juvenile density in juvenile habitat
current speed juvenile (m s−1)cur speed juvmeasured current speed in juvenile habitat
substrate juvenile (cm, term)subs juvsubstrate in juvenile habitat
water depth juvenile (m)w depth juvwater depth in juvenile habitat
The abbreviations of the ecological variables are used in the text and figures. The names of the selected variables in the first column are identical with the search terms used to find relevant literature. The units in the brackets indicate the reported units found in the publications. * Term was searched but no data was found.

