Article

Spatiotemporal Variation of Annual Runoff and Sediment Load in the Pearl River during 1953–2017

1
School of Civil Engineering and Transportation, South China University of Technology, Guangzhou 510641, China
2
China Water Resources Pearl River Planning Surveying & Designing Co., LTD., Guangzhou 510640, China
3
Guangdong Research Institute of Water Resources and Hydropower, Guangzhou 510640, China
4
State Key Laboratory of Water Resources and Hydropower Engineering Science, Wuhan University, Wuhan 430072, China
5
Center for Water Resource and Environment, Sun Yat-Sen University, Guangzhou 510275, China
*
Author to whom correspondence should be addressed.
Sustainability 2019, 11(18), 5007; https://doi.org/10.3390/su11185007
Submission received: 12 July 2019 / Revised: 27 August 2019 / Accepted: 6 September 2019 / Published: 12 September 2019

Abstract

:
Anthropogenic activities have had a great impact on the characteristics of runoff and sediment load along the Pearl River in China in recent decades. We investigated the spatiotemporal variations, including the trends, abrupt changes, and periodicities of annual runoff and sediment load in the Pearl River by using the datasets from nine hydrological stations for the period of 1953–2017. We found that annual runoff was stable during the study period, with only two stations in the upper reach showing decreasing trends. Annual sediment load has generally experienced a significant decreasing trend, while one of the stations in the middle reach showed an opposite trend due to severe rocky desertification and soil erosion in the local karst terrain. Abrupt changes in sediment load were mainly between the 1990s and 2000s, when many hydraulic projects were conducted, implying the significant impact of anthropogenic activities on river sediment load. Results also indicate 2–4 year and 4–8 year periodicities in both annual runoff and sediment load, with long periodicities less significant than the short ones. Our study is conducive to water and soil resource management in the Pearl River basin, whilst provides a guide for other basins, particularly those characterized by karst terrains where local desertification and soil erosion might likewise cause increase in river sediment load.

1. Introduction

River runoff and sediment load play a critical role in the functioning of a river system that reveal the state of regional soil condition and water dynamics and eventually influence delta evolution [1,2]. The transport of water and sediment from headwater to the ocean is an important pathway for material transfer in the circulation of substances [3,4,5]. Particularly recent years, the sediment loads of the primary rivers in China have presented considerable decreasing trends due to constructions of numerous water regulation projects, causing distinct changes in river systems, as well as in the downstream estuarine regions [6]. Characterization of runoff and sediment load is essential for river ecosystems, water resource management, and predictions [7,8,9].
During the past few decades, much attention has been paid to runoff and sediment load changes in different rivers across the globe. Milliman et al. stated that cumulative discharge from mid-latitude rivers decreased by 60% because of damming and other types of human water consumption, while numerous high-altitude rivers have experienced increased discharge, despite generally declining precipitation [10]. Walling used a graph to show that sediment load in many large rivers, including the Nile, Ebro, Colorado, and Rio Grande, has declined from 70% to nearly 100% in recent decades [11]. Syvitski et al. held the viewpoint that human activity is forcing the sediment transport through soil erosion but is slowing it through sediment retention in reservoirs, which has brought severe damage to the environment [12]. For China, the runoff and sediment load in the Yellow River have received considerable attention because of their drastic reductions since the 1950s. Such reduction is mainly due to the implementation of numerous soil and water regulation infrastructures, the construction of large reservoirs, and climate change [13,14,15,16,17,18]. It has been demonstrated that the sediment load has decreased by approximately 90% over the past 60 years in the Loess Plateau and, correspondingly, the Yellow River Delta suffers from erosion [13,16]. A similar situation has also occurred in the Yangtze River [19,20,21,22,23]. The difference between the two rivers is that dam construction is the primary reason for the sediment load decline in the Yangtze River, while water and soil conservation and reforestation projects contribute mostly to the reduction in the Yellow River [6,20].
The Pearl River is the second largest river in terms of water discharge in China, which plays a vital role in supplying water and sediment resources to the Pearl River Delta. The geographic and geomorphic conditions along the river are complex and diverse, which include the Yunnan–Guizhou Plateau and karst landforms in the upper reach, hills and basins in the middle reach, and highly urbanized areas in the downstream [24]. Anthropogenic impacts, climate change, and local karst landforms provide favorable conditions for vegetation deterioration, soil erosion, and rocky desertification, threatening the Pearl River Basin (PRB) [25,26]. According to the Bulletin of the First National Census for Water, the erosion area in the PRB is approximately 58,900 km2, accounting for 13% of the PRB [27]. In recent years, the construction of hydraulic structures, land-use changes, and excessive sand mining have significantly aggravated sediment disturbance in the PRB [6,28]. In addition, frequent extremes of weather and climate, such as droughts and rainstorms, have caused a large change in the river system [29]. More recently, droughts have increased in southwest China, including the headwater of the Pearl River [30]. On the other hand, strengthened rainfall intensity in the PRB suggests higher rainfall erosivity [31,32]. All these factors together could pose significant changes in runoff and sediment in the Pearl River. Previous studies mostly focus on trends or abrupt changes in runoff and sediment load in the river [25,26,33,34,35,36]; however, few of them have diagnosed the periodicity that is needed to provide comprehensive information toward runoff and sediment load change. A systematic and detailed study of the spatiotemporal changes of runoff and sediment load in the PRB is required to better serve the implementation of hydraulic projects along the river.
The primary objectives of this study are to (1) diagnose the changing trends, abrupt changes, and periodicities of runoff and sediment load in the Pearl River, and (2) assess the spatiotemporal variation characteristics in the Pearl River. We hope that our work can offer a scientific reference for water and soil resource management in the basin, and further support relevant studies regarding river runoff and sediment load changes in other basins.

2. Material and Methods
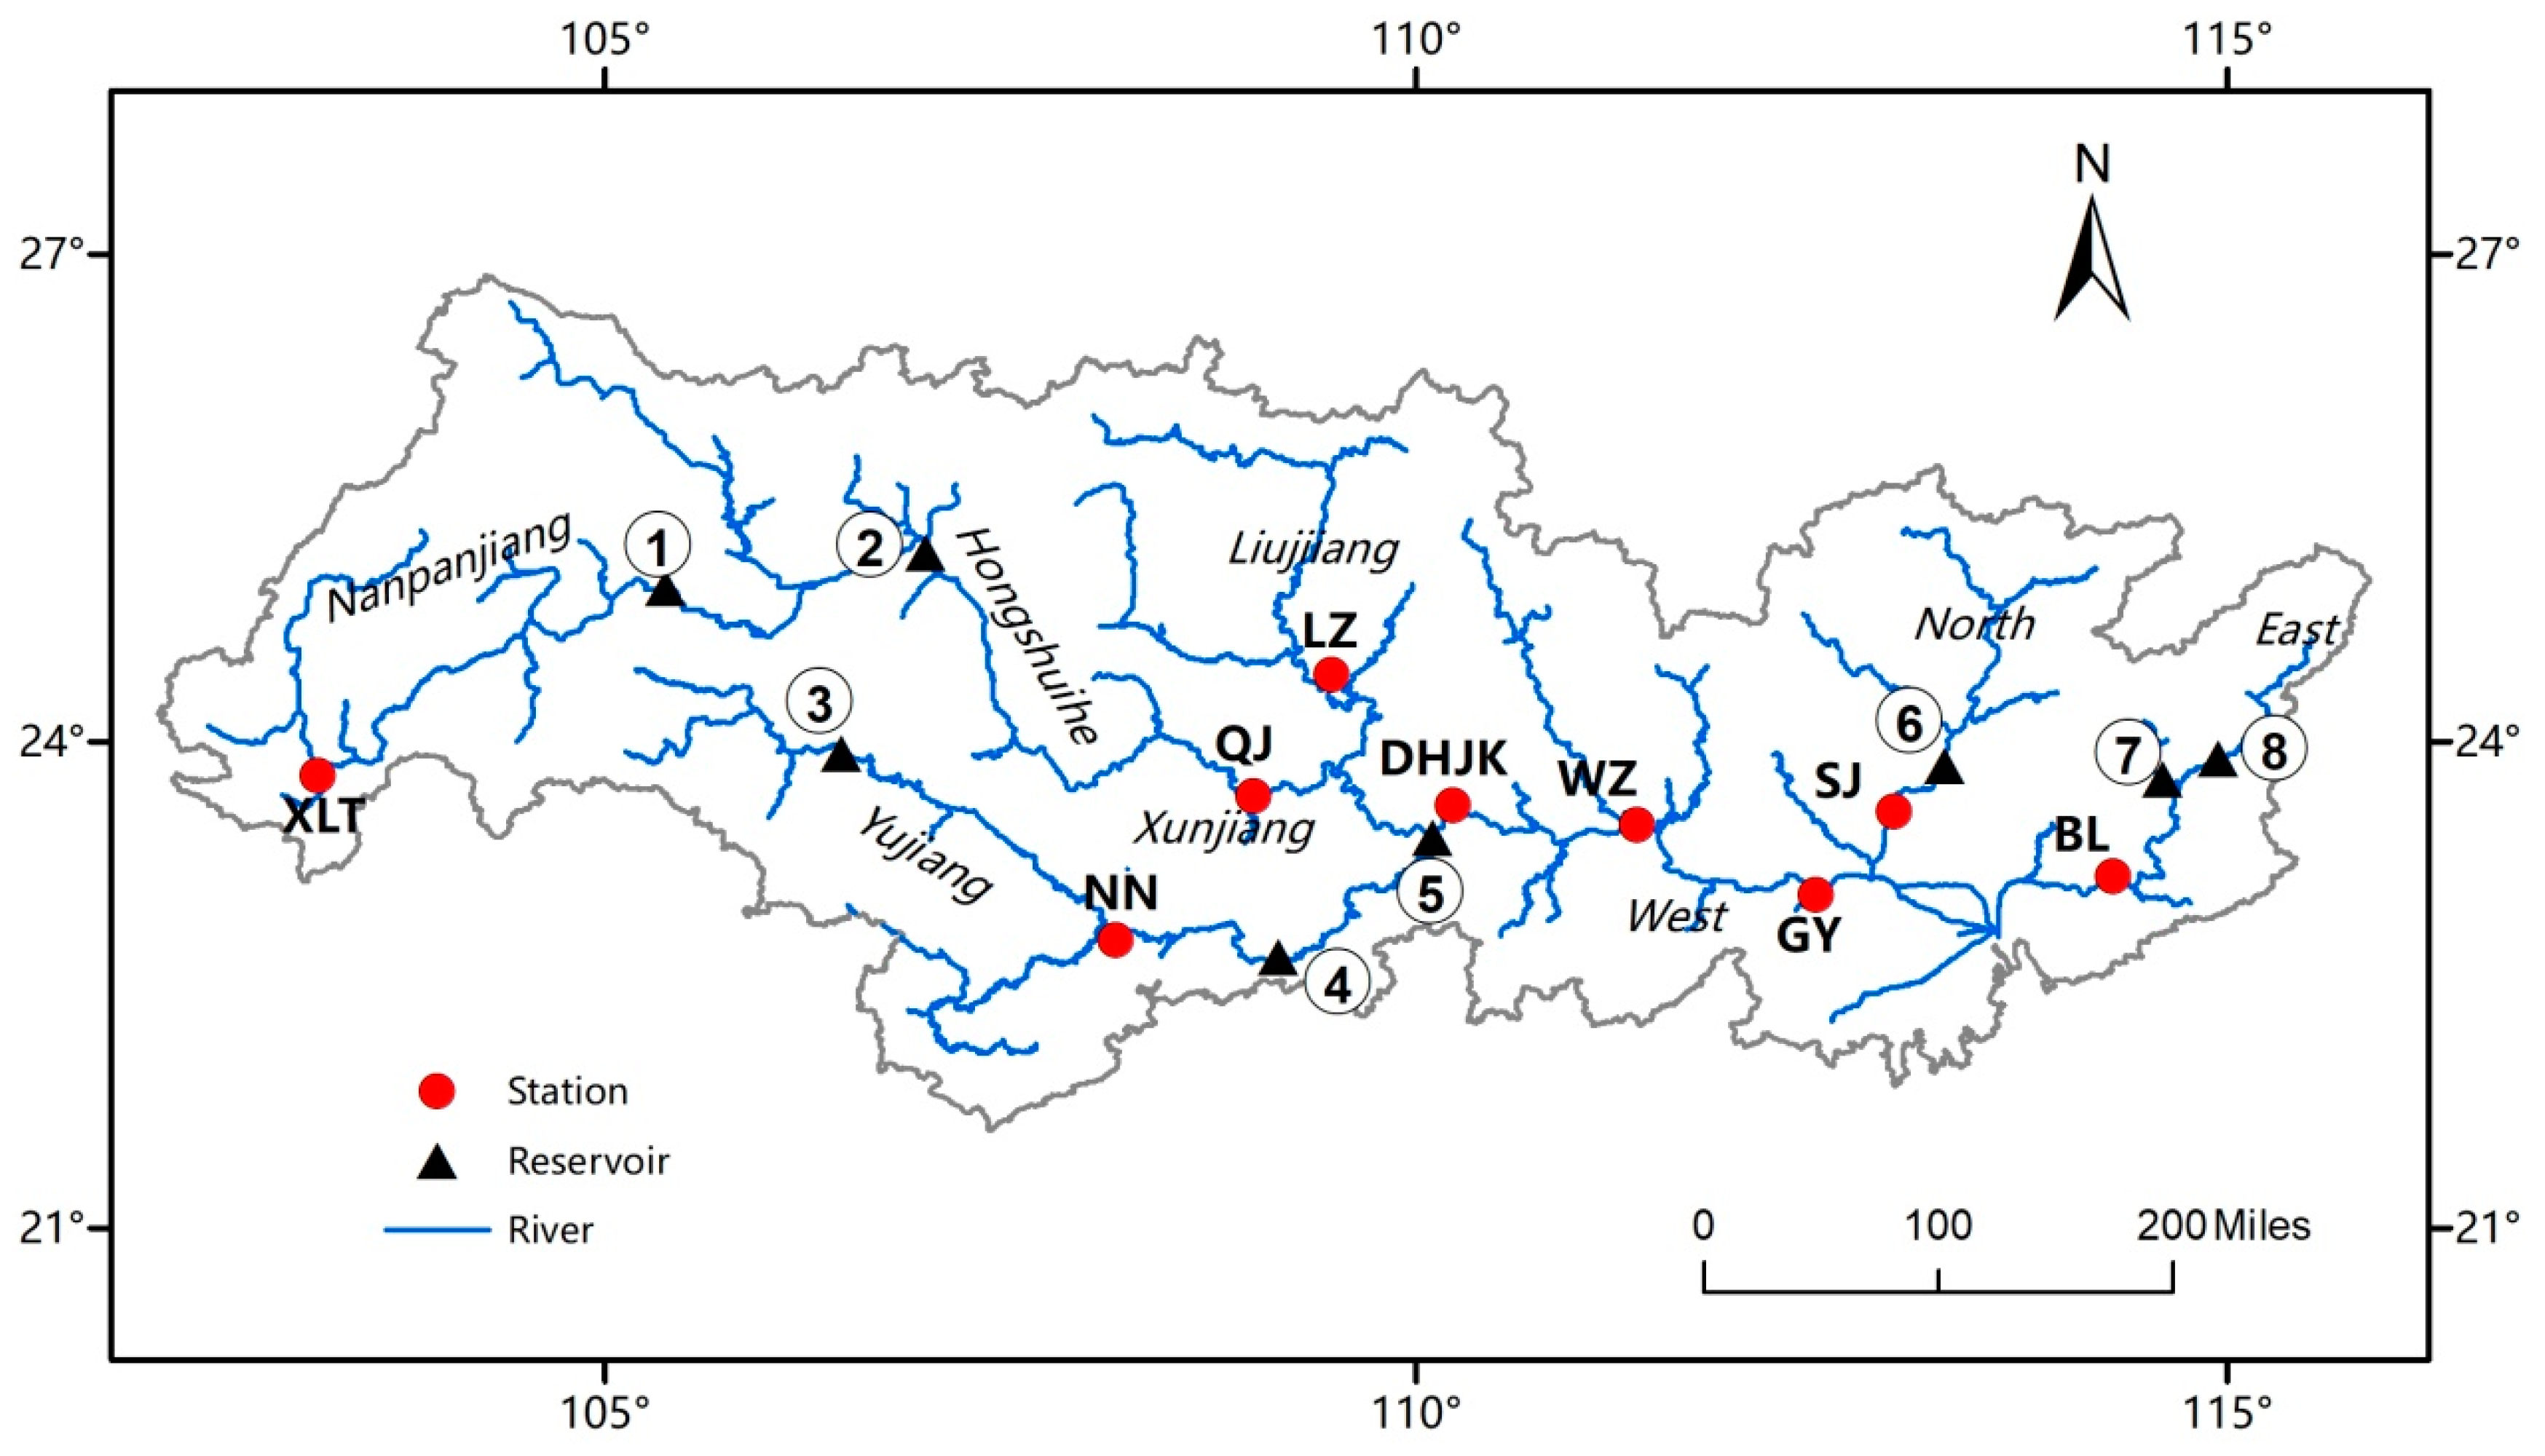
2.1. Study Area

The PRB is situated between 102°14′–115°53′ E, 21°31′–26°49′ N, featured with subtropical and tropical monsoon climates. It is the second largest basin in China, with a length over 2320 km and a total drainage area of about 450,000 km2. Originating from the Yunnan–Guizhou Plateau, the Pearl River flows eastward with a river slope of 0.045% and finally runs into the South China Sea. The mean annual water discharge of the Pearl River is about 336 km3. The mean annual precipitation and temperature range from 1200 to 2200 mm and 14 to 22 °C, respectively. The PRB contains complex river systems due to relatively high humidity and ample rainfall brought by the subtropical monsoon climate, including the West River, North River, East River, and other tributaries. The upper reach of the West River flows through the well-known karst region in southwest China.
Nine hydrological stations—the Xiaolongtan (XLT), Qianjiang (QJ), Liuzhou (LZ), Dahuangjiangkou (DHJK), Wuzhou (WZ), Nanning (NN), Gaoyao (GY), Shijiao (SJ), and the Boluo (BL)—record runoff and sediment load since 1953. The locations of these stations are indicated in Figure 1. Specifically, the GY, SJ, and BL stations are located in the downstream portion of the West River, North River, and East River, respectively, and these three stations can be grouped as being located in the lower reach of the Pearl River. QJ, DHJK, and WZ stations are located in the middle reach of the main stream, while LZ and NN stations are located in two different branches in the middle reach of the Pearl River. The XLT station is the only station in the upper reach. Annual runoff and sediment load data during 1953–2017 were collected from these nine hydrological stations in the PRB, which are operated by the Ministry of Water Resources of the People’s Republic of China. The data of annual total discharge and sediment load were employed in this study. Most of the data were continuous, except that SJ station had lost five years of annual sediment load data during 1970–1974. In order to satisfy the continuity of methods applied in this study, the sediment load data length of SJ station was 1975–2017 when applied to the tests. Detailed information of the data set is presented in Table 1.
There are many reservoirs along the river, and the locations of eight major reservoirs in the PRB are shown in Figure 1. All of these reservoirs play vital roles in regulation, hydropower generation, irrigation, and shipping. Among these reservoirs, the Feilaixia Reservoir is the largest comprehensive reservoir in Guangdong province. Datengxia Reservoir is now under construction, and is anticipated to operate by the end of 2019. More information of these reservoirs is given in Table 2.

2.2. Methodology

2.2.1. Trend and Abrupt Changes Analysis

The non-parametric Mann–Kendall (MK) test was firstly developed by Mann and Kendall [37,38]. It is widely used for trend and abrupt change analysis [18,30,39,40,41,42]. In this study, trends and abrupt changes of the time series of runoff and sediment load were tested. The advantage of the MK method is that the data series does not need to comply with a certain distribution of samples to avoid interference from abnormal values. The MK method is described as follows.
For a time series, a statistic S is defined as
S = i = 1 n 1   j = i + 1 n sgn ( x j x i ) ,
where n is the length of the series and sgn ( x j x i ) is computed by
sgn ( x j x i ) = { + 1 ( x j > x i ) 0 ( x j = x i ) 1 ( x j < x i ) ,
where x i and x j are the sequential data values of the series. The statistic S is approximately normally distributed when n ≥ 8, with the mean E(S) and the variance Var(S) defined as
E ( S ) = 0
Var ( S ) = [ n ( n 1 ) ( 2 n + 5 ) i = 1 n t i i ( i 1 ) ( 2 i + 5 ) ] 18 ,
where t i is the extent of any given time. The standardized statistic z is formulated as
z = { ( S 1 ) / V a r ( S ) ( S > 0 ) 0 ( S = 0 ) ( S + 1 ) / V a r ( S ) ( S < 0 ) .
In the trend analysis of this study, the calculated z value was compared with the standard normal distribution with the 95% confidence level. The null hypothesis of no trend would be rejected when the absolute z value exceeds 1.96 at the 95% confidence level. Also, a significance level of P = 0.05 was applied to decide whether the increasing or decreasing trend was accepted. When the absolute z value exceeds 1.96 (p < 0.05), a positive z value indicates an increasing trend of the series, while a negative value indicates the opposite.
The MK method is also used to detect abrupt changes in a time series in this study. The Mann–Kendall’s rank statistic S k of the abrupt change test is given by
S k = i = 1 k r i ( k = 2 ,   3 ,   4 ,   n ) ,
where n is the length of the series and r i is given by
r i = { 1 i f   x i > x j 0 i f   x i > x j ,
where x i and x j are values of the series at times i and j. The statistic UFk is computed by the following equation:
U F k = [ S k E ( S k ) ] V a r ( S k )   ( k = 1 ,   2 ,   3 ,   , n ) ,
where E( S k ) and Var( S k ) are mean value and variance of S k , respectively. The mean value and variance of S k are calculated by the two expressions
E ( S k ) = n ( n + 1 ) 4 ,
V a r ( S k ) =   n ( n 1 ) ( 2 n + 5 ) 72 .
Similarly, the values of UBk are computed with the inverted sequence, starting from the end of the time series. If UFk (sequentially computed curves) and UBk (computed curve with an inverted sequence) curves intersect and then diverge and acquire a specific threshold value of 1.96 (corresponding to the 0.05 significance level), there is a statistically significant trend. The intersection point is the approximate year when the trend begins. Detailed information of the MK methods can be found in [43,44].

2.2.2. Periodicity Analysis

In this study, the continuous wavelet transform (CWT) is a spectral analysis method used to decompose time series wavelets that are localized in both frequency and time. Wavelet analysis has been widely used for detecting periodicity and other frequency spectrum characteristics of various hydro-climatic variables [30,45,46,47,48]. It was used to identify periodic oscillations in runoff and sediment load series at the nine stations in our study. The Morlet wavelet allows better balance between time and frequency localization, and is widely used to identify periodic oscillations [9,18,49]. However, the wavelet is not always localized in a given time series and, to eliminate the edge effect, the cone of influence is presented. To perform the CWT, the Morlet wavelet was applied that is defined as
ψ ( t ) = π 1 4 e i ω 0 t e t 2 2 ,
where t is the independent variable and ω 0 is the nondimensional frequency. Assuming the time series considered is x n , the CWT of a discrete sequence x n is defined as
W n ( s ) = n = 0 N 1 x n Ψ * [ ( n n ) δ t s ] ,
where is the wavelet coefficient, (*) is the complex conjugate, s is the wavelet scale, n is localized time index, n′ is translated time index, N is the number of points in the time series, and Ψ is the normalized wavelet. The wavelet power spectrum is defined as | W n ( s ) | 2 . The time-averaged wavelet power spectrum over the entire local wavelet spectra is defined as a global wavelet spectrum which is shown as
W ¯ 2 ( s ) = 1 N n = 0 N 1 | W n ( s ) | 2 ,
The scale-averaged wavelet power spectrum is the weighted sum of the wavelet power spectrum over scales k 1 to k 2 for the identified dominant variability band, which is shown as
W n ¯ 2 ( s ) = δ k δ t C δ k = k 1 k 2 | W n ( s k ) | 2 S k ,
where C δ is a constant. Detailed information about continuous wavelet transform can be found in the study of Torrence and Compo [50].

3. Results

3.1. Trends in Annual Runoff and Sediment Load

The trends in runoff and sediment load in PRB are listed in Table 3. Note that except for the XLT and QJ stations, where annual runoff displayed downward trend, the other stations showed no significant trends, implying a decline in runoff in the upper reach, but no obvious change in the middle and lower reaches of the Pearl River. For sediment load, in most cases, the trends were significantly downward, indicating that sediment load in the PRB is generally decreasing. However, there was nearly no trend at the SJ station. We found that, surprisingly, the trend at the LZ was upward. Moreover, as shown in Table 3, the absolute values of z at the QJ, DHJK, WZ, GY, and BL stations were generally larger than those of the XLT and NN stations.

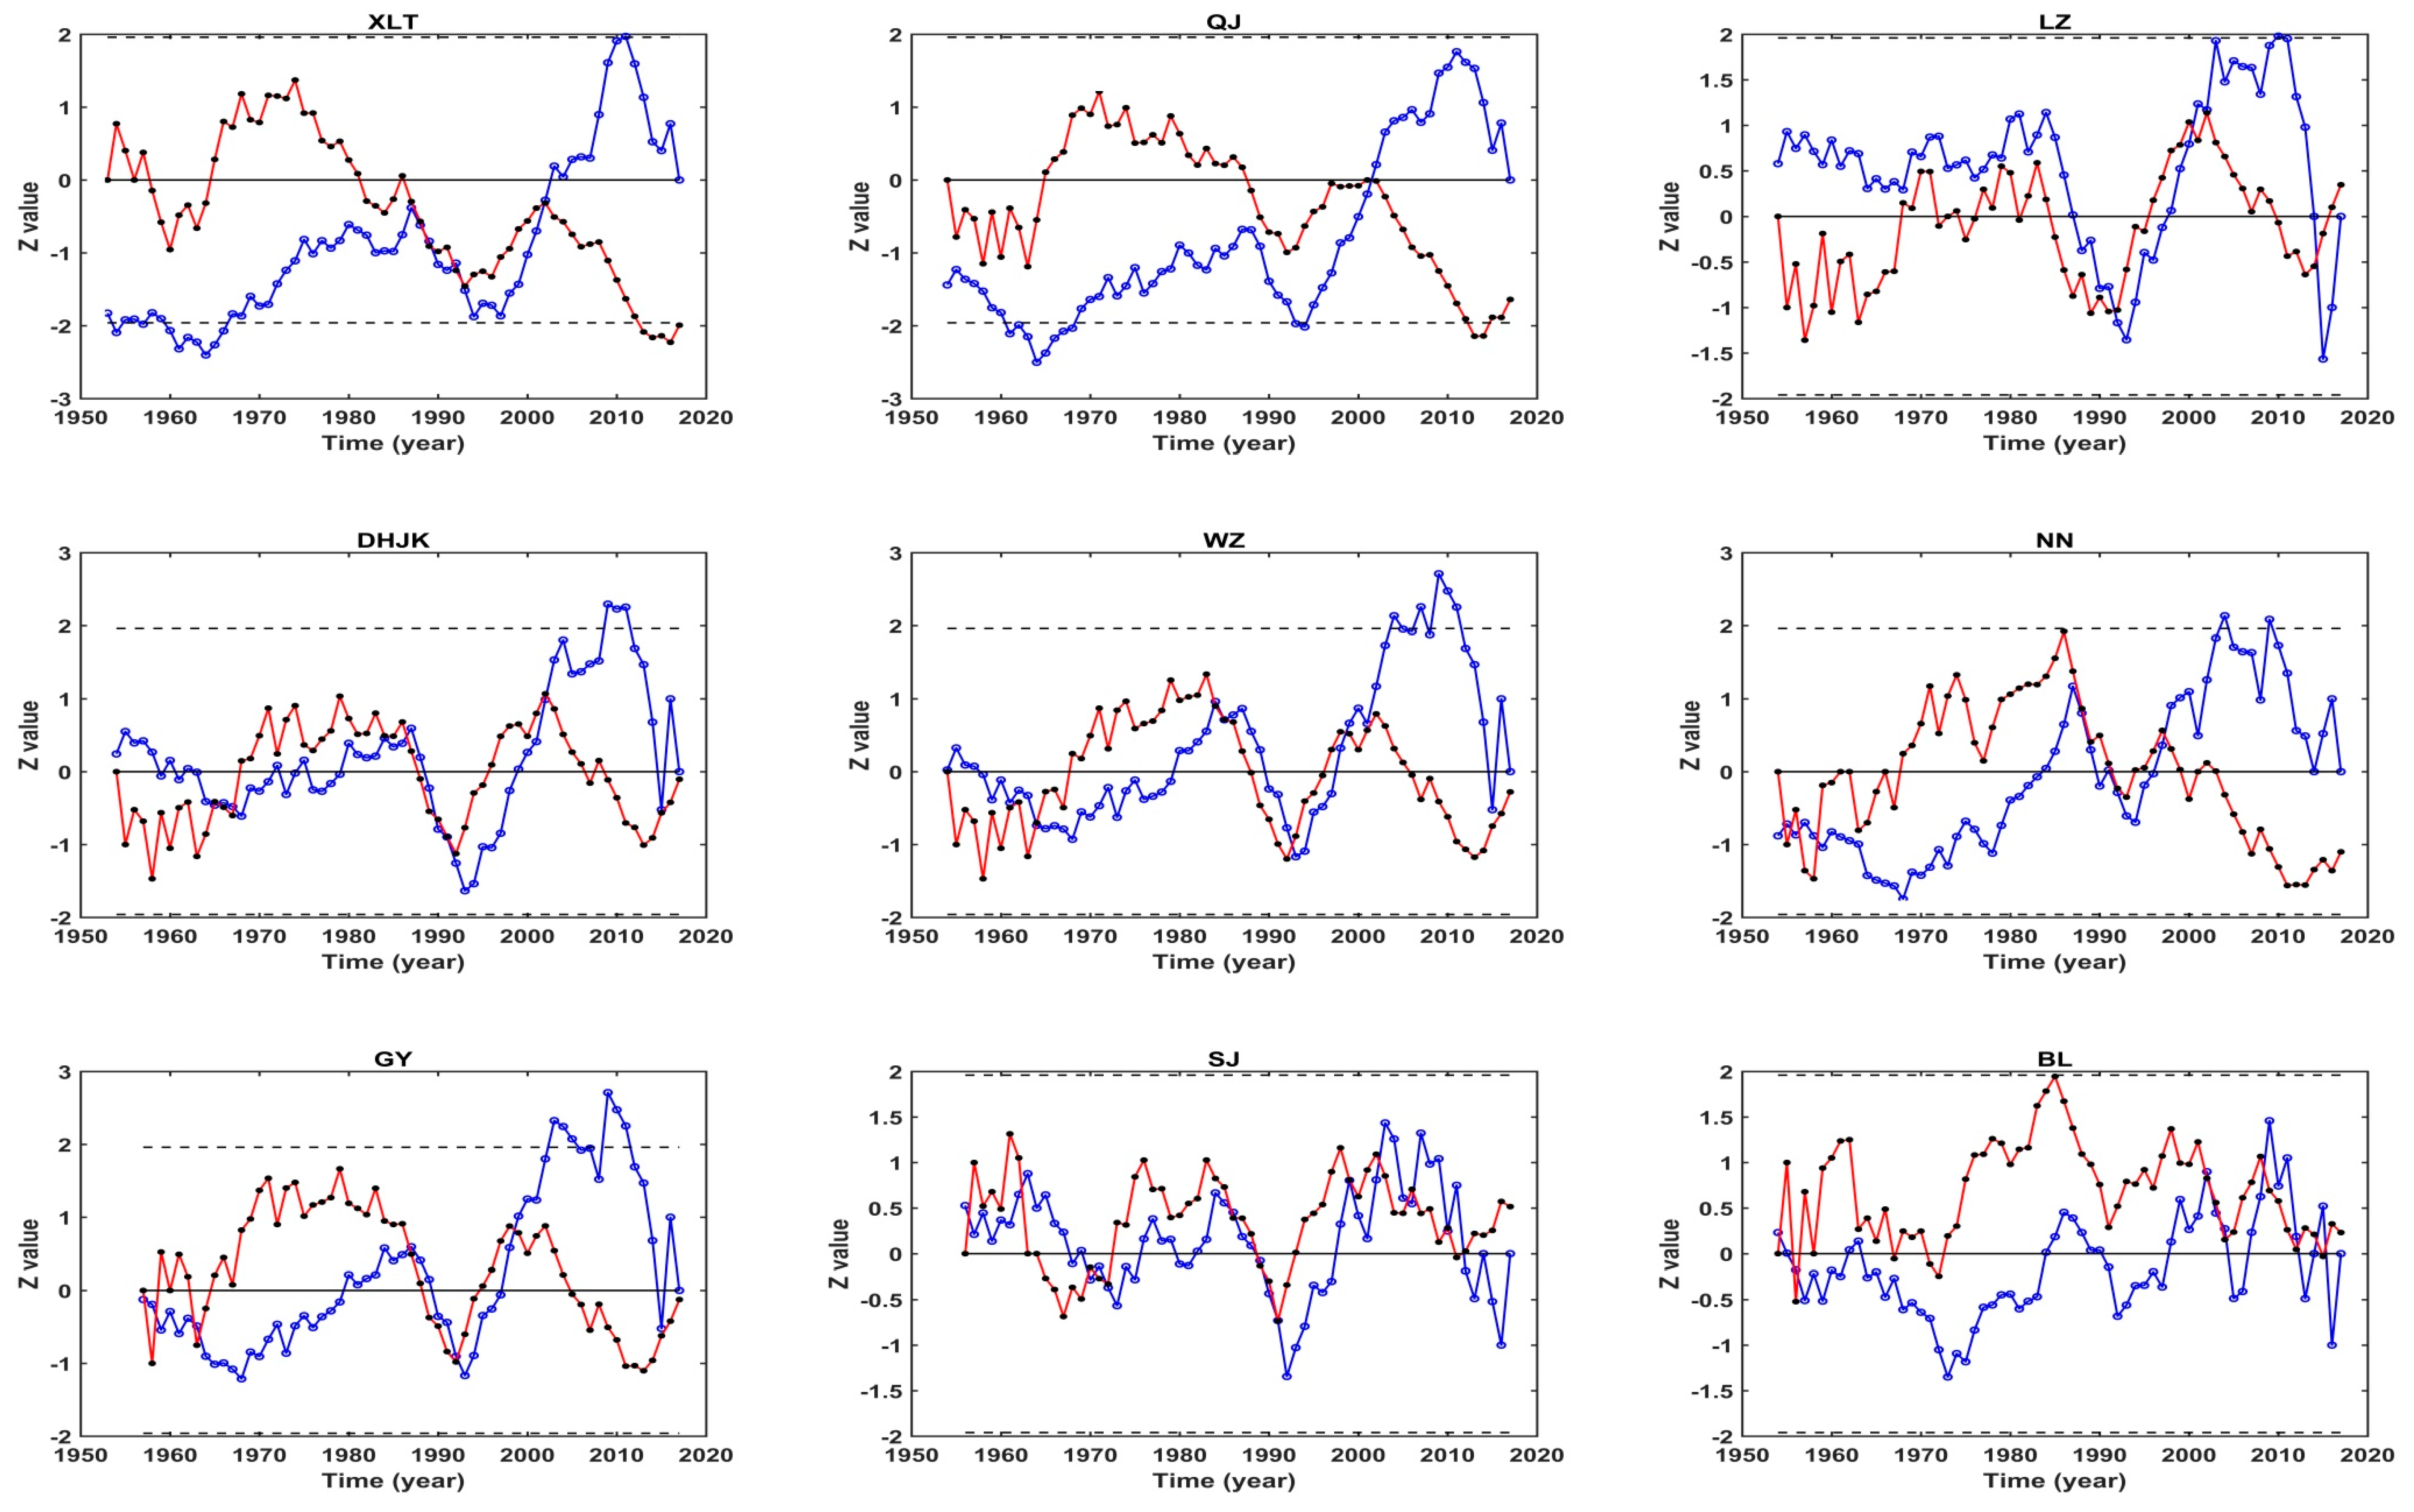
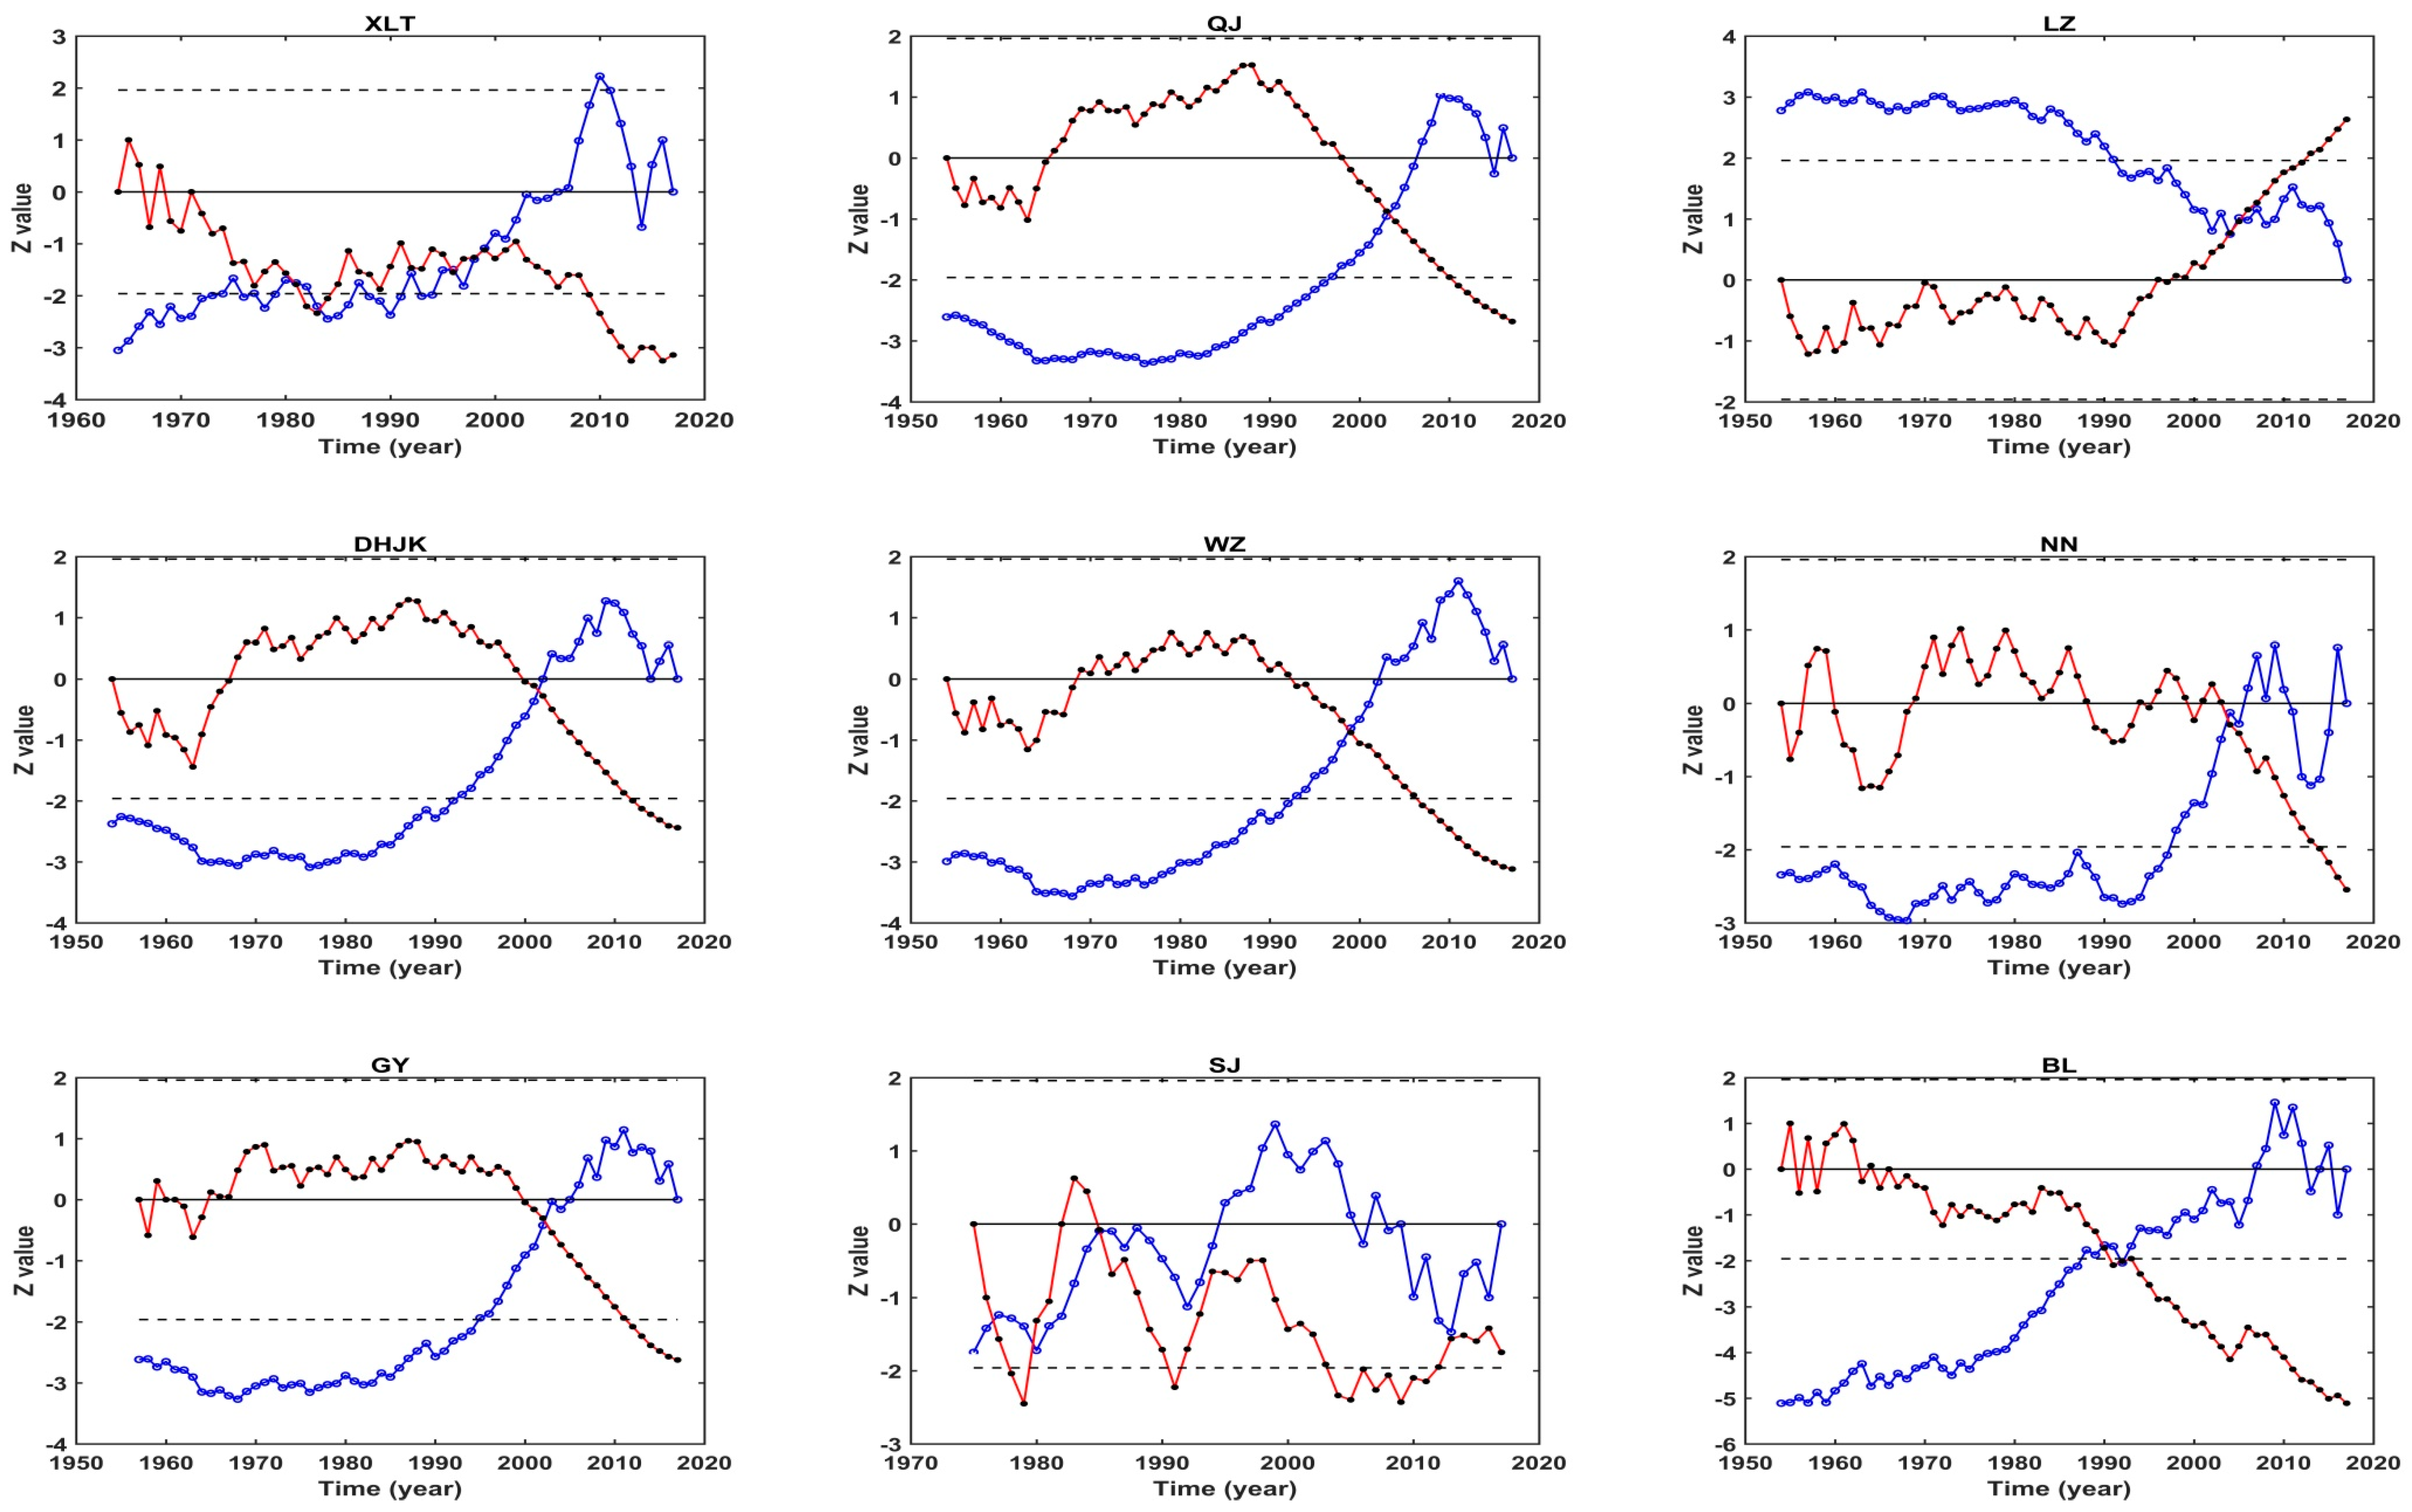
3.2. Abrupt Changes of Annual Runoff and Sediment Load

The results of abrupt change detection in annual runoff and sediment load in the PRB are shown in Figure 2 and Figure 3, respectively, and the approximate abrupt change years is concluded in Table 4. As shown in Figure 2, the abrupt changes of annual runoff at the XLT and QJ stations approximately occurred in 2003 and 2001, respectively, where UF and UB curves intersected, and then the UF curve went downward and reached the dashed lines with the ordinate values of ± 1.96 (the 95% confidence level). As for the remaining stations, the UF and UB curves intersected more than one time, but the abrupt changing points were not significant since none of the UF curves of annual runoff reached the critical values of ± 1.96.
By comparison, annual sediment load shows many more abrupt changes than runoff; except for the SJ station, the other stations all had abrupt change points in annual sediment load. More specifically, as shown in Figure 3, the XLT, QJ, DHJK, WZ, NN, GY, and BL stations all showed significant downward trends in sediment load, with abrupt changes occurring during 1992–2004. Before the abrupt change points, the sediment loads at these stations fluctuated moderately, but began to decrease significantly afterwards. Different from the other stations, the annual sediment load at the LZ station showed a significant upward trend and the abrupt change point was around 2005. In addition, we found that the abrupt change points of the annual runoff and sediment load were basically synchronized at the XLT and QJ stations.

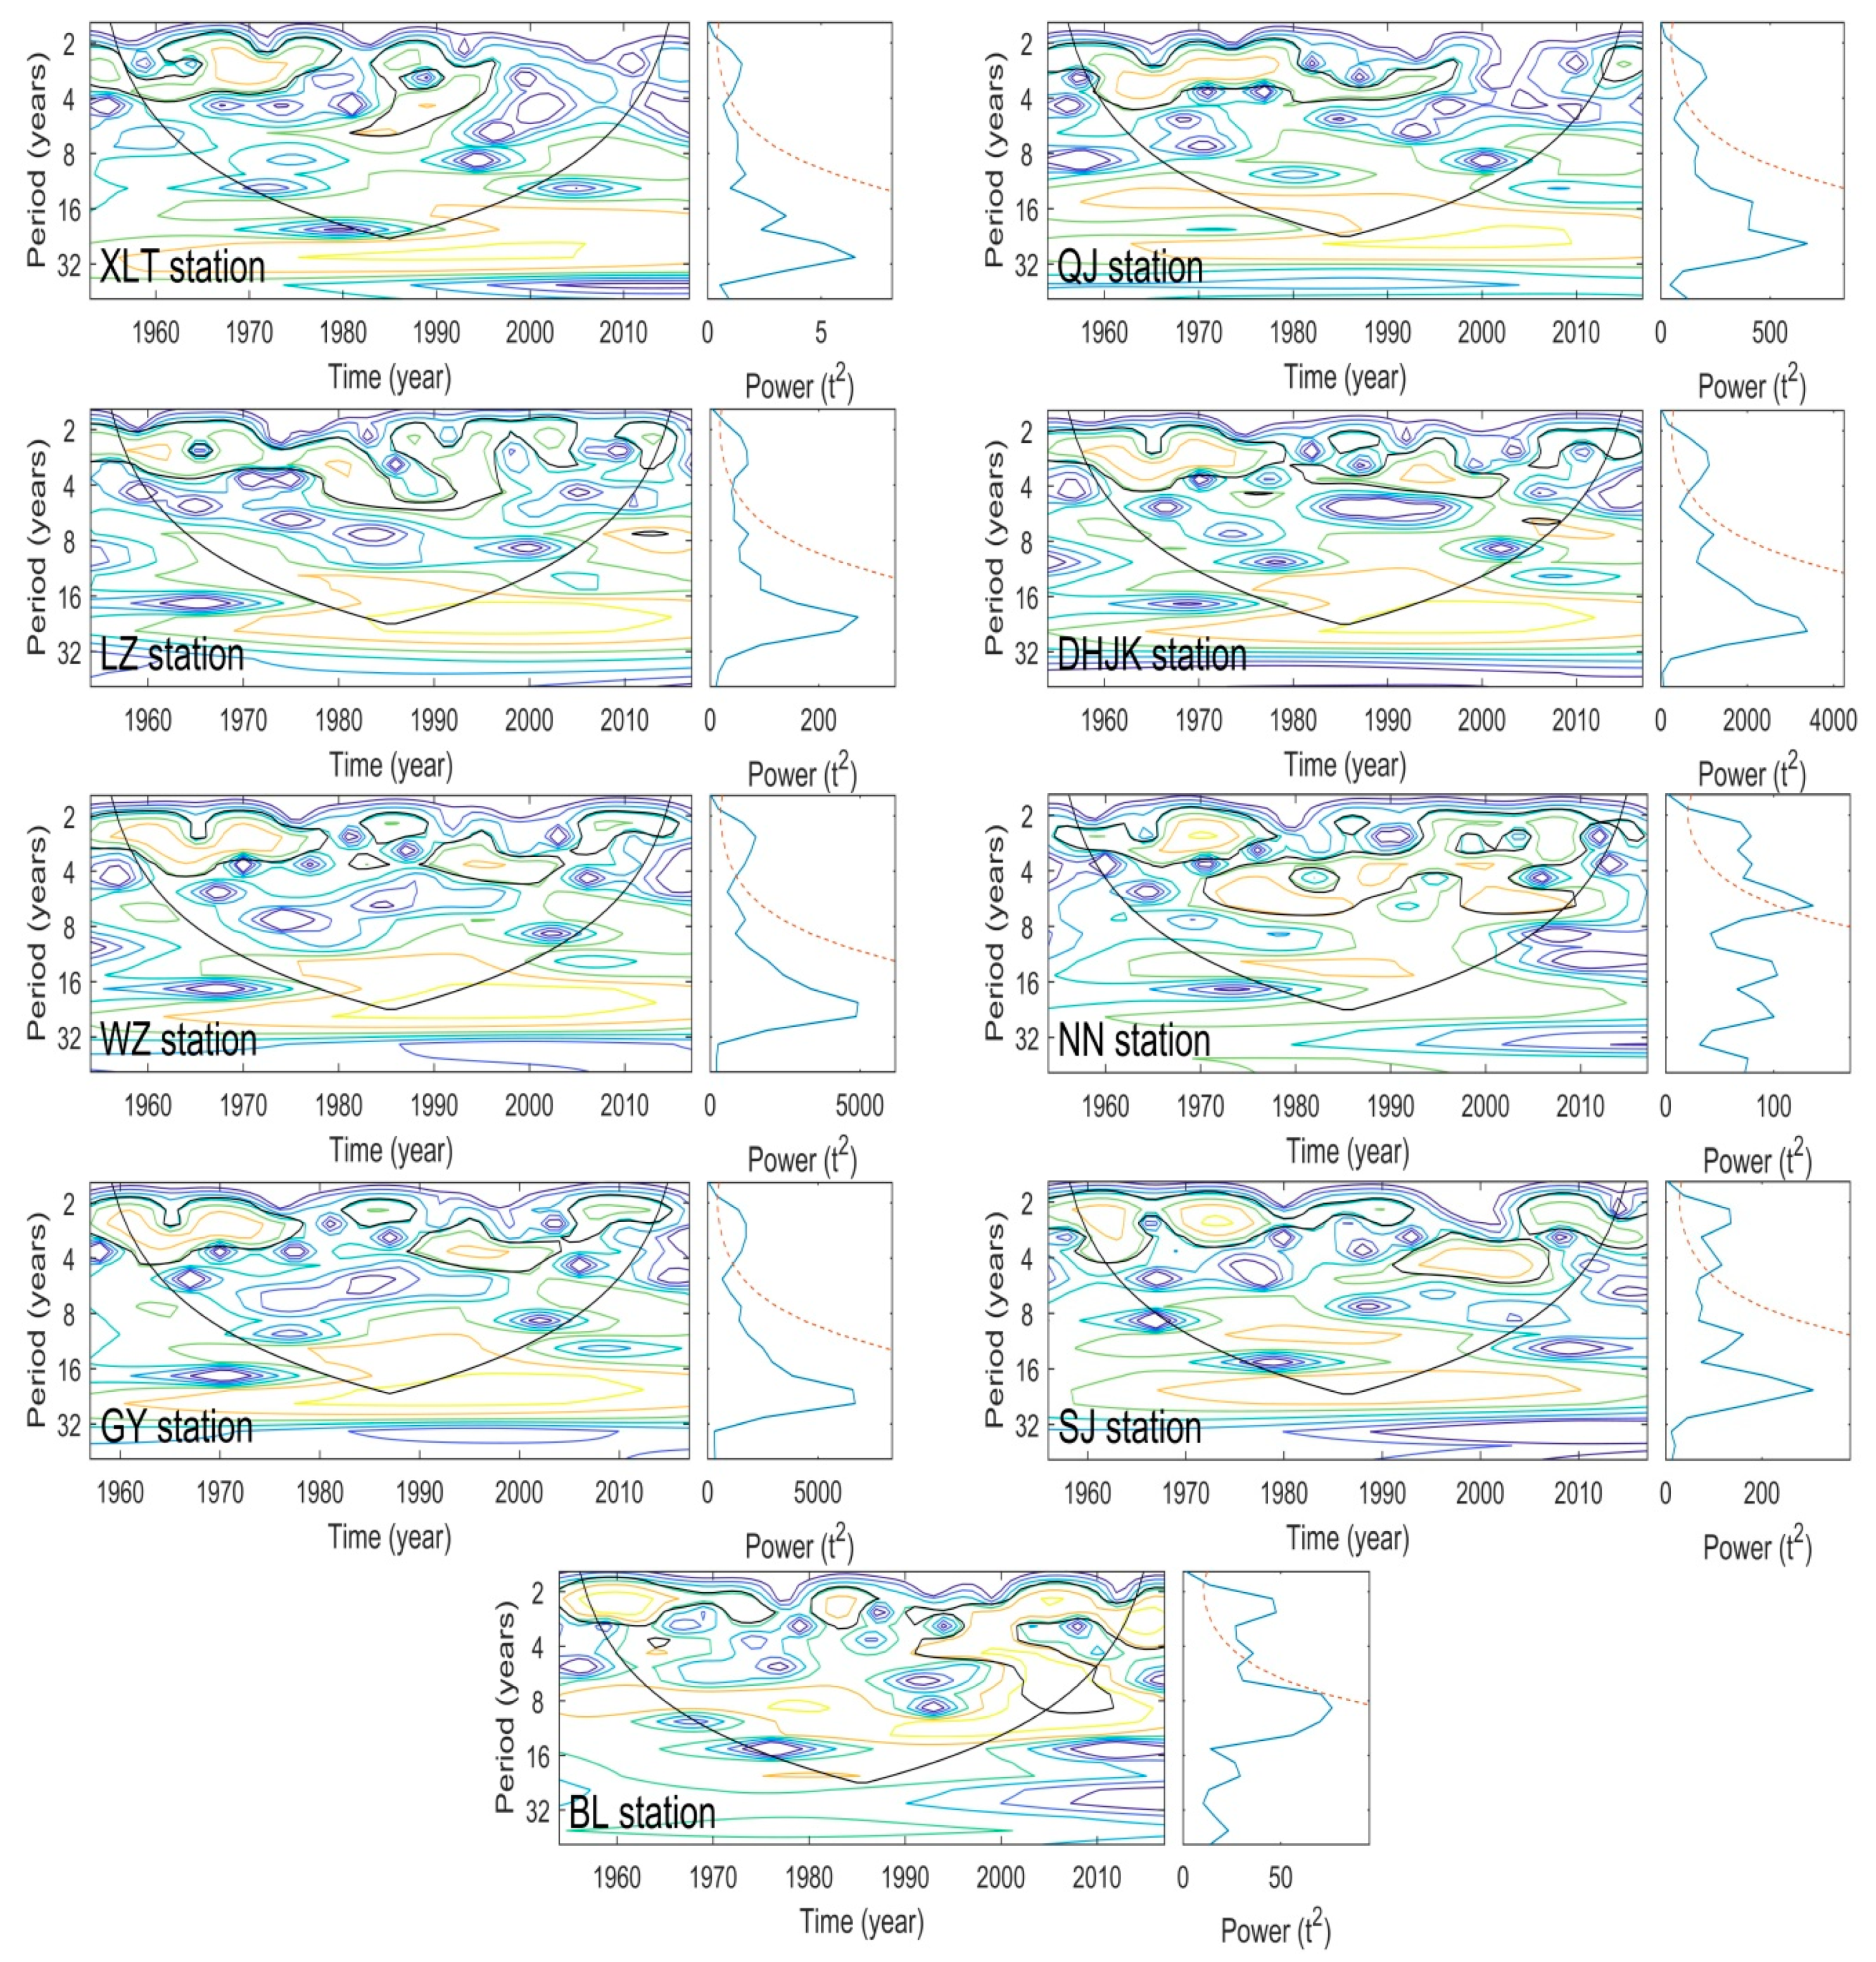
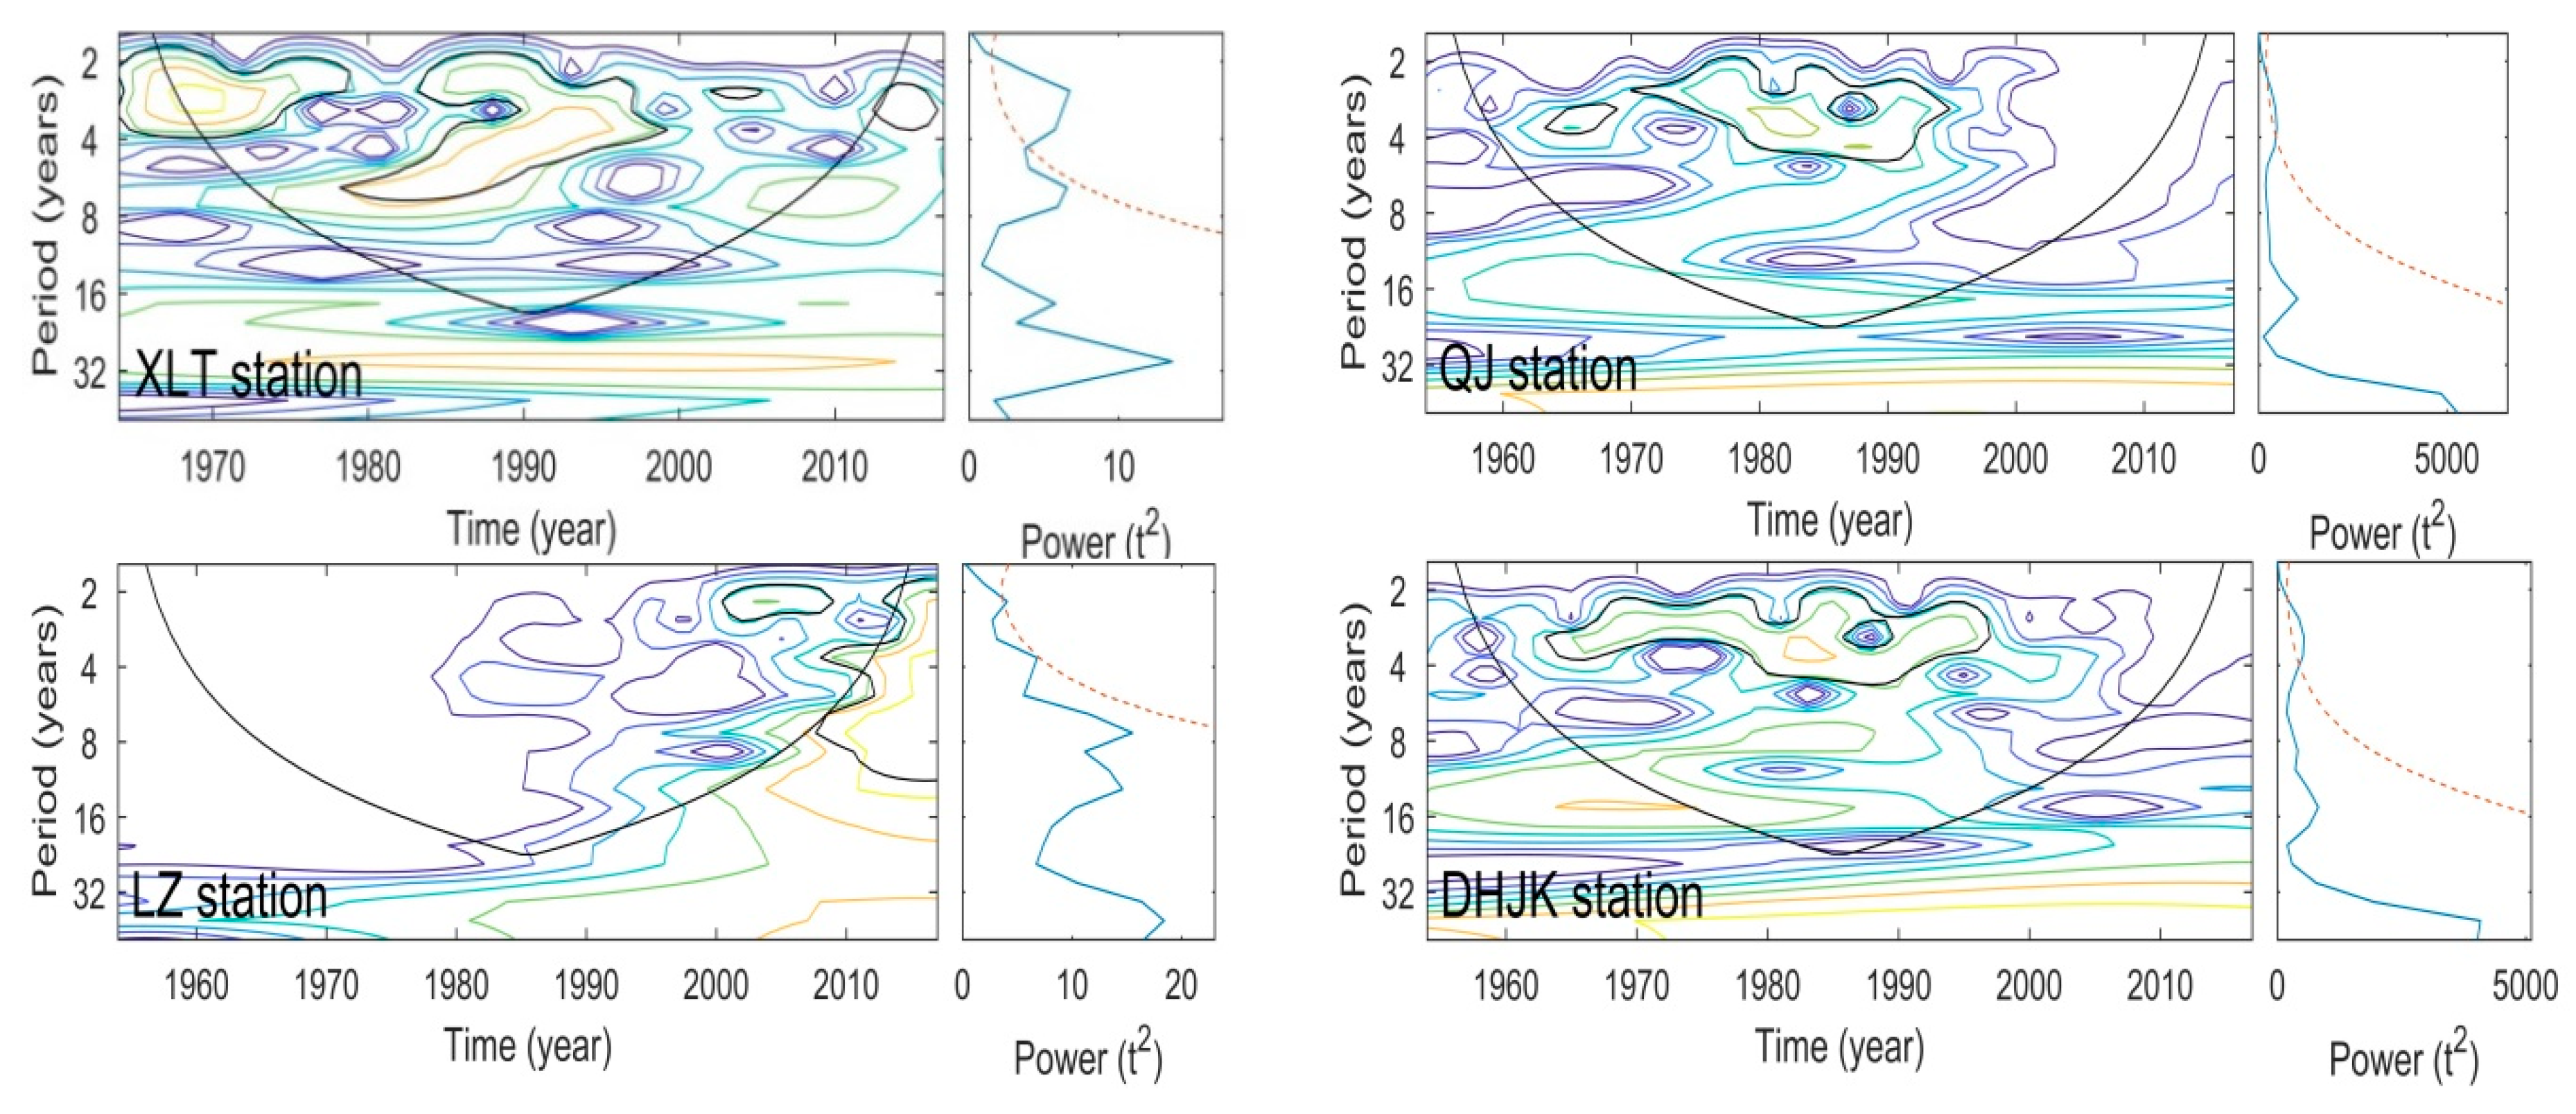
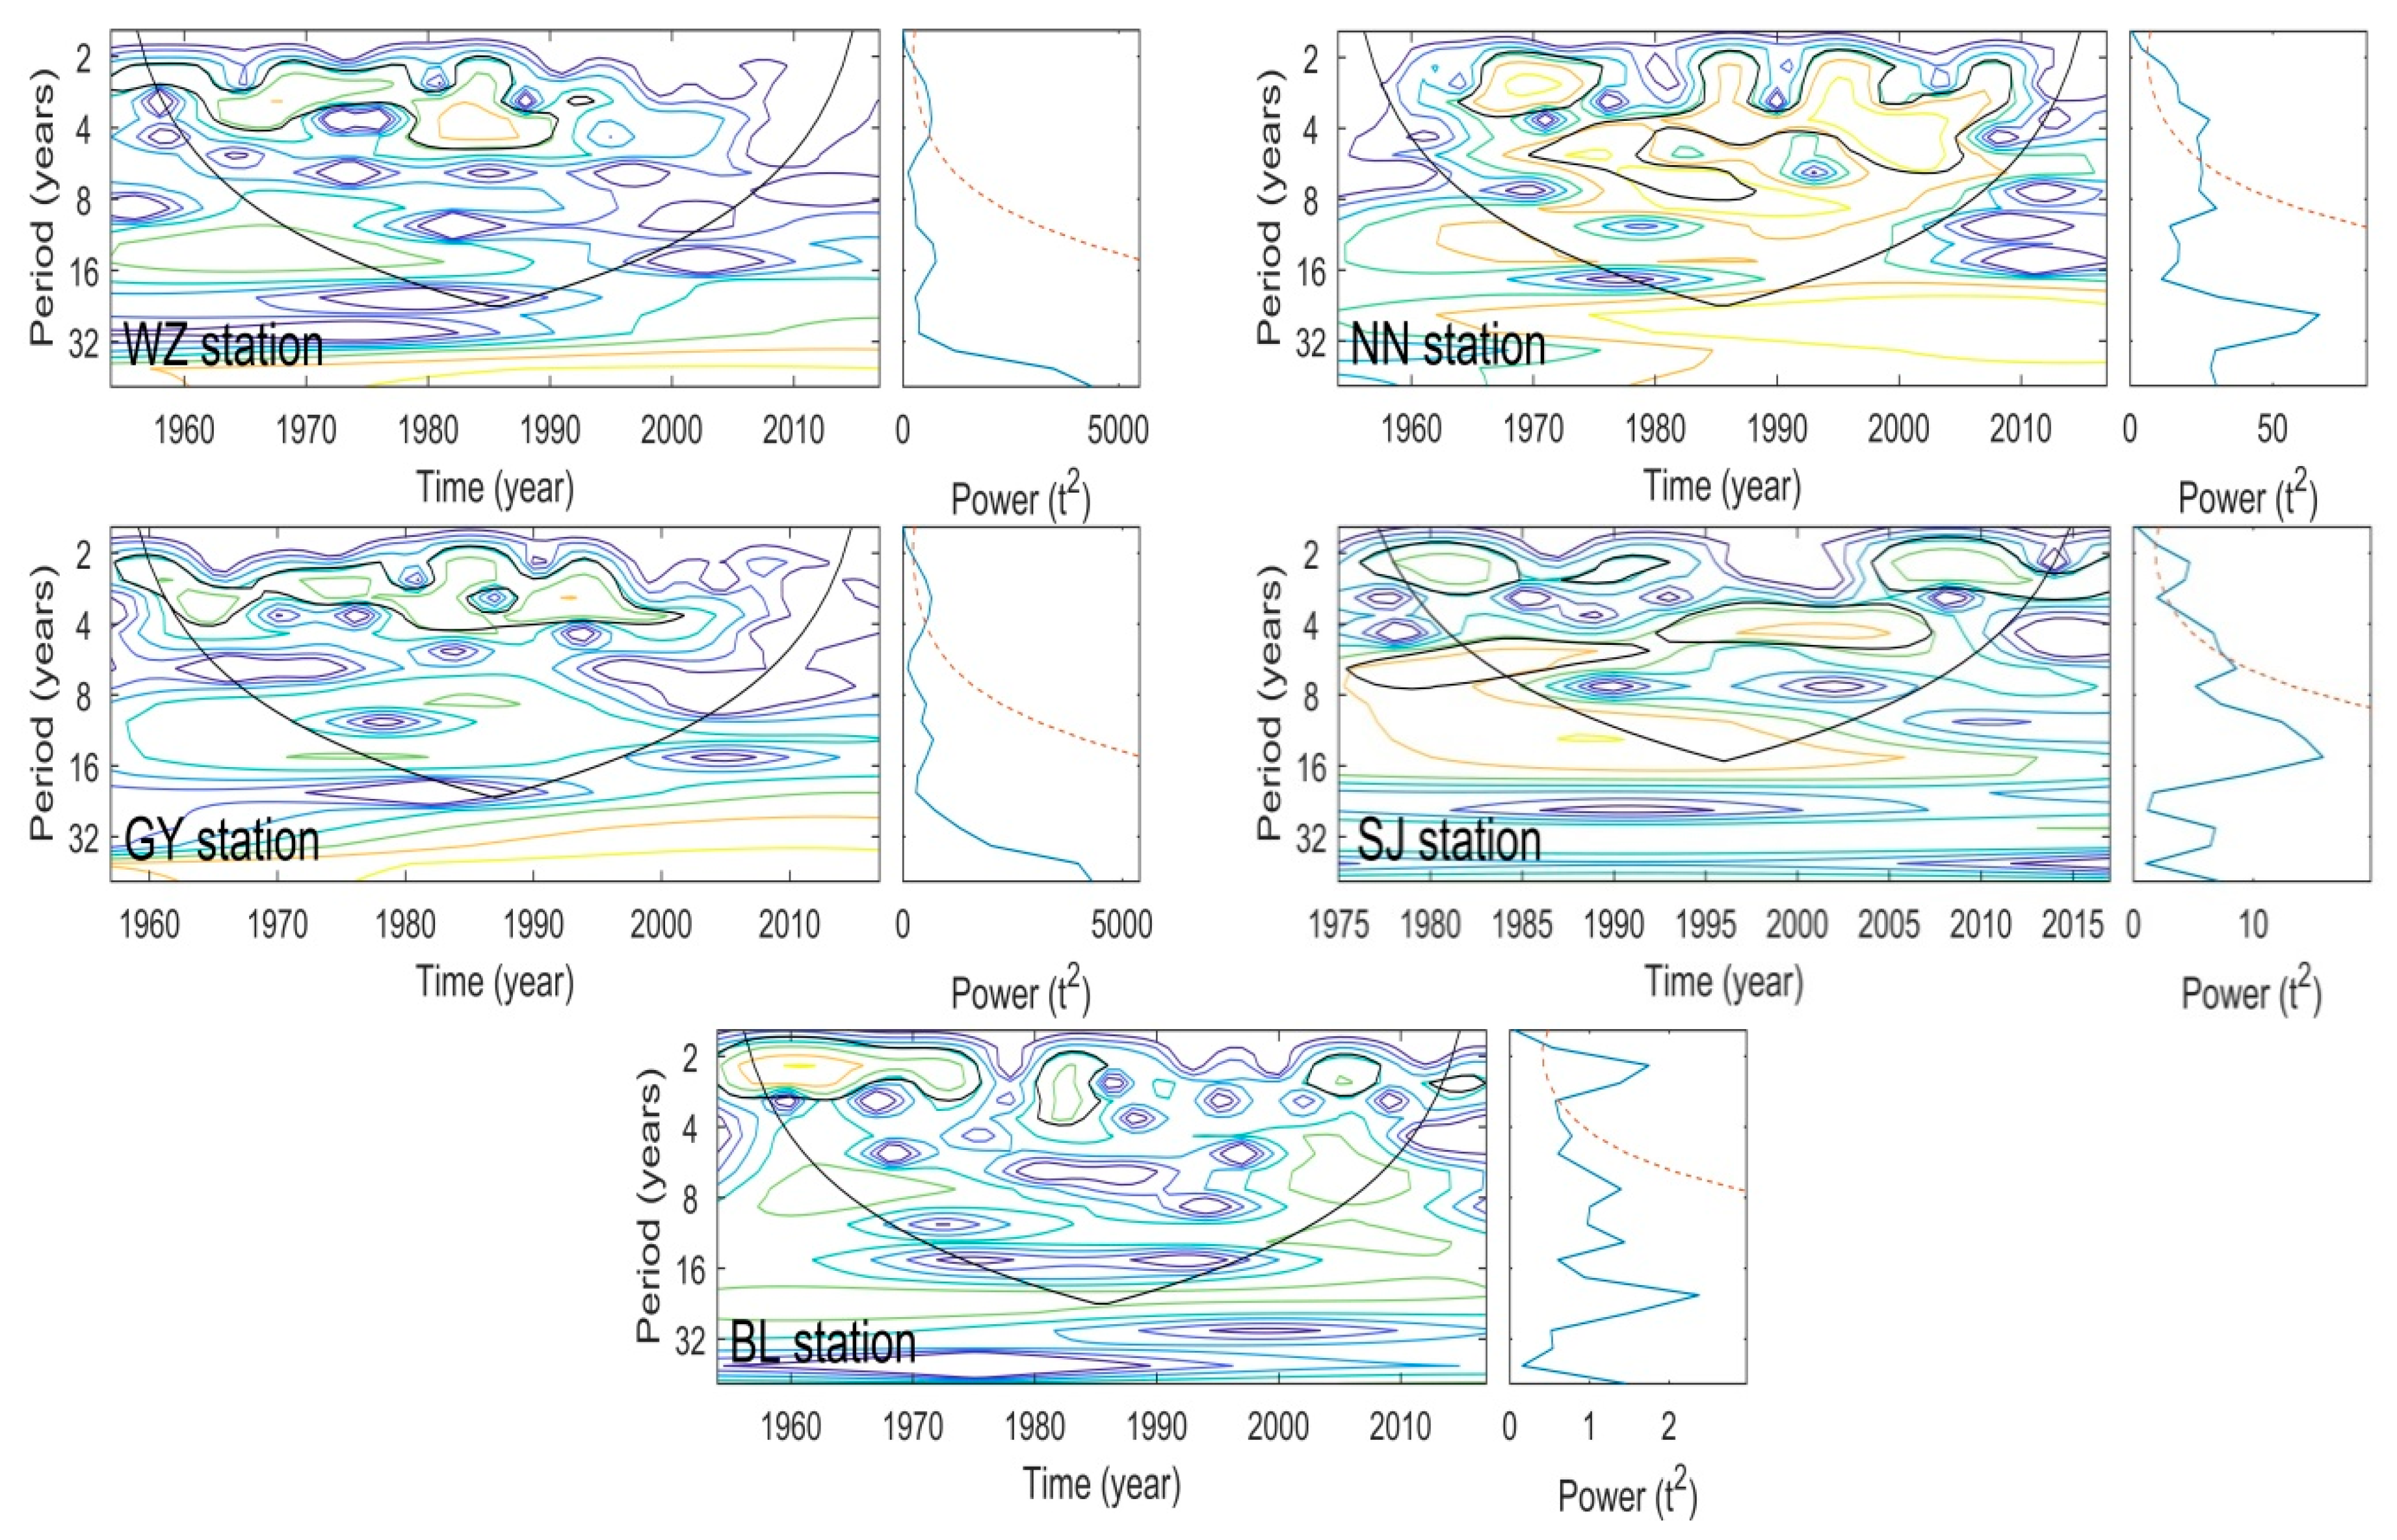
3.3. Periodicity of Annual Runoff and Sediment Load

Figure 4 and Figure 5 illustrate the continuous wavelet power spectrum of annual runoff and sediment load at the nine stations. Taking the BL station as an example, we showed 2.6, 4.4, 8.8, and 20.9 year periods of annual runoff, with the 2.6 and 4.4 year periods being the main oscillation periods. Significant wavelet power was detected in the 2–4 year band around 1954–1976, 1980–1987, and after 1990, as well as in the 4–8 year band during 1991–2012. Moreover, no periodicity was detected in the late 1970s and 1980s. The annual sediment load at the BL station showed a primary period of 2.2 years; 7.4, 12.4, and 20.9 year periods. Inter-annual oscillations in the 2–4 year band existed around 1954–1976, 1980–1986, 2002–2008, and after 2012, in agreement with the high-frequency oscillation in the annual runoff. There was no significant periodicity in the low-frequency oscillation for sediment load. The periodicities for the remaining stations are summarized in Table 5.
Figure 4 shows that the annual runoff at stations, except for XLT and QJ, had stable periods of 2–8 years. No significant periods were found for XLT and QJ stations after 1996 and 1999, respectively. Similarly, Figure 5 shows that the annual sediment loads at the XLT, QJ, DHJK, WZ, GY, and BL stations did not have any significant period after the disturbance. Annual sediment load at the NN station had relatively stable periodicities, but no period existed after 2009. With no significant trend in sediment load, the SJ station displayed discontinuous periodicities over the period of record. It was apparent that valid information for the sediment load at LZ station was limited because of the abnormal increase. As a consequence, only a 1–3 year band was detected during the period 2001–2009.

4. Discussion

4.1. Rationality of the Study and Comparison with Other Literatures

When analyzing the properties of time series, one should note that the findings are conditional on the methods and data used. The MK method and wavelet analysis, employed in our study, are well-proven robust methods for hydrologic time series analysis [18,30,39,40,41,42,45,46,47,48]. As described in the methodology section, the time series does not need to comply with a certain distribution of samples with MK, and thus can avoid interference from abnormal values, while the wavelet analysis allows better balance between time and frequency localization. The original data employed in this study was extracted from the authorities, i.e., the Ministry of Water Resources of the People’s Republic of China. An alternative way of checking data validity is to preliminarily analyze if the changing points of runoff and sediment load are synchronized with the operation years of reservoirs in the basin (see Section 4.2 for details). From our results, we have no reason to believe that the data set suffered from data quality problems. Moreover, the findings of the current study can also be well explained based on the existing literature (also see below for details). Therefore, we confirmed that the data and method applied in this study are convincible.
It is found that both the annual runoff and sediment load in the Yellow River have shown significant decreasing trends [9,17,18]. Human activities play the most important role in the Yellow River, which has caused the significant declines that could not be offset [18]. However, the decreasing trends in the annual runoff of the Yangtze and Pearl Rivers are not considerable, even though the annual sediment load has been generally declining [22,23,25]. Our results, as shown in Table 2, are in accord with previous findings that annual runoff does not change significantly, whereas sediment load has generally decreased. This could be possibly due to abundant water resources in the PRB, known as a humid basin, and decreased runoff is a minor cause of sediment decline [25,51]. Niu and Chen also stated that runoff is correlated mostly with precipitation variability [36]. While dams and reservoirs cause limited decline in runoff in the Pearl River, precipitation along the river has an offset effect. As a result, XLT and QJ stations located in the upper reach showed a reduction in annual runoff. Additionally, most stations at the middle and lower reaches did not detect any significant trends in annual runoff. Except for LZ station, which showed increased sediment, most of the stations displayed significant decreasing trends in annual sediment load. The unusual increase in sediment load in the Liujiang River, caused by severe soil erosion of the karst landform, was distinct from the Yellow River and the Yangtze River in recent years. On the whole, the annual sediment load in the PRB has decreased significantly, while the annual runoff has remained stable.
The abrupt changes in the annual runoff and sediment load in the upper Yellow River were in the 1980s and were due to the construction of the Longyangxia Reservoir and urbanization [18]. In this study, however, the abrupt changes in the runoff and sediment load in the Pearl River occurred in the 1990s and 2000s, when multiple large dams and reservoirs were constructed. On the other hand, a study of the Yangtze River showed that annual runoff and sediment load had notable periods of 2–3 years, 7–9 years, and 16–18 years [52]. Similar to those of the Yangtze River, annual runoff and sediment load exhibited periods of 3–4 years, 8–11 years, 16 years, and 22–27 years in the Yellow River [18]. In this study, the dominant periods of annual runoff and sediment load in the Pearl River were 2–4 years and 4–8 years.

4.2. Multiple Influential Factors and Implications

Because of the abundant water resources brought by the subtropical monsoon climate, most of the stations did not show significant trends in annual runoff. Nonetheless, there is a decline in annual runoff at the XLT and QJ stations due to the slightly decreasing precipitation and construction of multiple reservoirs [34,35]. XLT station is located in the upstream, where water resources are relatively deficient compared with those in the downstream. Multiple reservoirs in the upper reaches may result in the reduction of runoff at the QJ station situated in the lower reach of the Hongshuihe River. As mentioned in the introduction, multiple factors influence the hydrological features of the Pearl River, and natural factors and anthropogenic influences are two main causes. As one of the potential key natural factors, rainfall—especially heavy rainfall usually brought by typhoons—could cause soil erosion and, in turn, increase river sediment load. We additionally conducted correlation analysis between rainfall erosivity and sediment load in the PRB. The changing properties of sediment load at the GY, BL, and SJ stations (the control stations of the West, East, and North River, respectively) were compared to the rainfall erosivity of the West, East, and North River basins, respectively. The correlation was not significant, i.e., the rainfall erosivity was slightly upward, while the sediment loads were downward. In this regard, it was possible that heavy storms might have a limited effect on the long-term changes in sediment load in the PRB. Among the human activities, dam and reservoir construction and water and soil conservation policies were mainly responsible for the reduction in sediment load in the PRB [15,21,25]. To qualitatively reveal whether the changes in sediment load in the basin are indeed associated with dam and reservoir construction, we compared the operational years of reservoirs with the abrupt change points of sediment load series (Table 4), and found that they were basically synchronized. For example, the Baise Reservoir started to operate in 2002 in the upper Yujiang River, which directly influenced the sediment in the Yujiang River, and the abrupt change year of the sediment load at the NN station in 2004. Tianshengqiao Reservoir, including the Tianshengqiao I and II hyperpower stations, began to operate in late 2000 in the upper Hongshuihe River. Annual sediment load at the QJ station accordingly had an abrupt change in 2003. Therefore, the constructions of reservoirs have probably influenced sediment load in the basin. On the other hand, reservoir constructions could also influence the river periodic characteristics. For example, no periodicity of annual runoff at BL station was detected in the late 1970s and 1980s, which may be attributed to the operations of Xinfengjiang Reservoir and Fengshuba Reservoir in 1969 and 1973, respectively, which altered the runoff properties.
The joint operation of Tianshengqiao Reservoir and Longtan Reservoir in the upper reach trapped a massive amount of sediment. Similarly, the stations in the midstream, i.e., DHJK and WZ stations, also showed a great reduction in sediment load. Moreover, our results indicated that the absolute z values at the QJ, DHJK, WZ, GY, and BL stations were generally larger than those of the XLT and NN stations (Table 3), suggesting that the middle and lower portions of the main stream of the Pearl River experienced more significantly decreased sediment load than the upper portion and the tributaries. This could be due to the large dam and reservoir constructions in the main stream. Also, from Table 3, it can be inferred that the anthropogenic impact on sediment load changes was more significant than on runoff in the PRB. When comparing the sediment load trends of the three main tributaries, differences can be found. With the construction of hydraulic projects in the upper reach of the West and East River, the GY and BL stations showed significant declines in annual sediment load after the 1990s. However, no significant trend was detected for the North River (SJ station), though multiple reservoirs also operated in the upstream. A previous study indicated that precipitation in the North River Basin is decreasing, while the runoff is increasing because of the changed water allocation between the West River and North River [35]. This inconsistency may be due to the prevalent sand mining activity in the past, which began in the Pearl River estuary in the 1980s and reached its peak in the 1990s [53]. Sand mining can lead to severe downcut of the river channel. Ni et al. found that the North River has experienced more serious downcut than the West River, causing the split ratio of runoff and sediment load to change [28]. With a greater extent of downcut in the North River, water from the West River flooded into the North River, along with a massive amount of suspended sediment, which may have offset the reduction in sediment load at the SJ station.
One unanticipated finding of this work was that the LZ station showed an unusual rise in sediment load. Considering the location of LZ station, the increased sediment load at this station might be due to local desertification arising from karst landforms along the Liujiang River [54]. The karst region in the Liujiang River Basin is faced with serious problems of rocky desertification and soil erosion. LZ station is the control station of the Liujiang River, located in the north of Guangxi province where famous karst landforms are distributed. Over the past two decades, reforestation in this region has, to some extent, made some improvement. However, the rocky desertification and soil erosion are difficult to control because of the severe destruction of forest and more frequent extreme weather events, such as droughts and floods. Additionally, the well-developed flow system and high permeability conditions in the upper layer of soil in the karst terrain do not maintain sufficient water for vegetation making restoration and reforestation much more difficult than other regions [54]. Previous studies investigating karst regions have confirmed that rainfall intensity is the main driving factor of soil erosion [55,56]. Unfortunately, precipitation intensity and rainfall erosivity in the PRB have enhanced over the past two decades, accounting for the worsening soil erosion [31,32,57]. Given the continuous increase in the sediment load at LZ station, rocky desertification and soil erosion in the Liujiang River Basin are worrisome. Furthermore, Yan and Cai pointed out that because of the high population density and disadvantages of socio-economic circumstances, farmers are forced to overuse rural land [58]. If unprotected, the river ecosystem might be disturbed severely. Thus, environment protection policies with better strategies for the reconstruction of the degraded karst ecosystem and providing adequate job opportunities and methods of green agriculture to release the pressure for the karst terrain are urgently needed.
It should also be noted that river sediment load is possibly influenced by in-channel sediment source sensitive to river bed scour and bank erosion. As implied in the previous study, distinct changes in in-channel sediment source usually occurs in the downstream of a basin because of bank erosion caused by channel widening [59]. By comparison, in-channel sediment source in the upper and mid streams does not change so distinctly. It is interesting and important to see whether and how in-channel sediment source has changed in the Pearl River estuary, where intense human activities are expected; unfortunately, none of the nine hydrological stations are located within the delta, which limits the analysis of in-channel sediment source change. Such analysis is out of the scope of our study and should be taken on in further works.

4.3. Possible Future Changes and Outlooks

The results of the current study indicate that intensive anthropogenic influences have complicated impacts on the river environment. Environmental protection policies, such as water and soil conservation and reforestation, have been carried out extensively over the past few decades. Several studies have shown that the implementation of afforestation and reforestation projects in Southwest China have a significant impact on the growth of vegetation cover and carbon stocks [60]. China has contributed at least 25% of the global green leaf area increase since the early 2000s [61]. Through land-use management, river sediment load is expected to decrease with less sediment supply. The construction of dams and reservoirs are inevitable with the demands of flood control and hydroelectric development in the PRB. After Longtan Reservoir’s operation in 2006, the sediment load in the Pearl River decreased from about 88.0 to 29.2 Mt/y [62]. Large-scale construction of water regulation projects, such as the Datengxia Gorge Water Conservancy Project that is scheduled to open in late 2019, will be another concern for the river sediment and erosion of the Pearl River Delta. Thus, with the implementation of environmental conservation projects and hydrological engineering projects, the sediment load of the Pearl River is likely to decline in the future. In addition, climate change and extreme weather events, including extreme droughts and rainstorms, have played vital roles in the fluvial systems [63]. Recently, extreme droughts, precipitation intensity, and rainfall erosivity have increased considerably in the PRB [30,31,32,64]. These climate changes pose an enormous threat to soil erosion in the basin. Protection against soil erosion in specific regions is necessary, otherwise soil erosion and rocky desertification may continue to aggravate and sediment load will keep increasing, especially in the karst area in southwest China.

5. Conclusions

In this study, variations in runoff and sediment load at nine gauging stations along the Pearl River during the period 1953–2017 were analyzed with the Mann–Kendall test and wavelet analysis. Changing trends, abrupt change points, and periodicities were detected as well, and possible reasons for the findings were discussed. The findings can be summarized as follows:
(1) The annual runoff is stable with only two stations at the upper reach (XLT and QJ stations) showing decreasing trends. Most of the stations did not show obvious abrupt change points in annual runoff, with XLT and QJ stations having abrupt changes in the early 2000s. The annual sediment load displayed a significant decreasing trend, whereas the LZ station in the tributary of the middle Pearl River showed a significant upward trend. Abrupt changes in annual sediment load were between 1992 and 2005, except for the SJ station, which showed no significant trend in annual sediment load. The period of each station shared a dominant 2–4 year or 4–8 year band for both annual runoff and sediment load.
(2) The runoffs at two stations in the upper reach (XLT and QJ stations) decreased after the early 2000s because of slightly decreasing precipitation and the construction of multiple reservoirs, while other stations did not have any trends in annual runoff. Given the intensive anthropogenic influences, most stations detected considerable decreasing trends in annual sediment load since the 1990s or 2000s. However, the SJ station at the North River showed no significant trend due to the water allocation between the West River and North River. The LZ station had a significant increasing trend after 2005 because of the severe rocky desertification in the Liujiang River Basin.
Our study was devoted to providing a scientific and practical reference for water and soil resource management in the PRB, and supporting relevant studies regarding river runoff and sediment load changes in other basins. In particular, the finding of the increased sediment load along the Liujiang River could warn against desertification and soil erosion in other basins featured with similar karst terrains.

Author Contributions

H.Z. and Z.W. investigated and wrote the paper, and W.X. directed the work, and the remaining authors conducted formal analysis.

Funding

This research was funded by [the National Key R&D Program of China] grant number [2018YFC1508200], [the National Natural Science Foundation of China] grant number [51879107, 51709117] And [the Natural Science Foundation of central University-Outstanding Youth Science Fund Project].

Conflicts of Interest

The authors declare no conflict of interest.

References

  1. Chen, L.; Singh, V.P.; Guo, S.L.; Zhou, J.Z.; Zhang, J.H. Copula-based method for multisite monthly daily streamflow simulation. J. Hydrol. 2015, 528, 369–384. [Google Scholar] [CrossRef]
  2. Peckham, S.D. Fluvial landscape models and catchment-scale sediment transport. Glob. Planet Chang. 2003, 39, 31–51. [Google Scholar] [CrossRef]
  3. Walling, D.E.; Fang, D. Recent trends in the suspended sediment loads of the world’s rivers. Glob. Planet Chang. 2003, 39, 111–126. [Google Scholar] [CrossRef]
  4. Williams, M. River sediments. Philos. Trans. A. Math Phys. Eng. Sci. 2012, 370, 2093–2122. [Google Scholar] [CrossRef] [PubMed]
  5. Zhou, Y.L.; Guo, S.L.; Hong, X.J.; Chang, F.J. Systematic impact assessment on inter-basin water transfer projects of the Hanjiang River Basin in China. J. Hydrol. 2017, 553, 584–595. [Google Scholar] [CrossRef]
  6. Cheng, L.; Yun, H.; An, L. Key drivers of changes in sediment loads of rivers. Adv. Sci. Technol. Water Resour. 2017, 37, 1–7. (In Chinese) [Google Scholar]
  7. Fryirs, K. (Dis)Connectivity in catchment sediment cascades: A fresh look at the sediment delivery problem. Earth Surf. Process. Landf. 2013, 38, 30–46. [Google Scholar] [CrossRef]
  8. Walling, D.E. Tracing suspended sediment sources in catchments and river systems. Sci. Total Environ. 2005, 344, 159–184. [Google Scholar] [CrossRef]
  9. Zhao, G.J.; Mu, X.M.; Strehmel, A.; Tian, P. Temporal Variation of Streamflow, Sediment Load and Their Relationship in the Yellow River Basin, China. PLoS ONE 2014, 9, e91048. [Google Scholar] [CrossRef]
  10. Milliman, J.D.; Farnsworth, K.L.; Jones, P.D.; Xu, K.H.; Smith, L.C. Climatic and anthropogenic factors affecting river discharge to the global ocean, 1951–2000. Glob. Planet Chang. 2008, 62, 187–194. [Google Scholar] [CrossRef]
  11. Walling, D.E. Human impact on land-ocean sediment transfer by the world’s rivers. Geomorphology 2006, 79, 192–216. [Google Scholar] [CrossRef]
  12. Syvitski, J.P.M.; Vorosmarty, C.J.; Kettner, A.J.; Green, P. Impact of humans on the flux of terrestrial sediment to the global coastal ocean. Science 2005, 308, 376–380. [Google Scholar] [CrossRef] [PubMed]
  13. Peng, J.; Chen, S.L.; Dong, P. Temporal variation of sediment load in the Yellow River basin, China, and its impacts on the lower reaches and the river delta. Catena 2010, 83, 135–147. [Google Scholar] [CrossRef]
  14. Miao, C.Y.; Ni, J.R.; Borthwick, A.G.L.; Yang, L. A preliminary estimate of human and natural contributions to the changes in water discharge and sediment load in the Yellow River. Glob. Planet Chang. 2011, 76, 196–205. [Google Scholar] [CrossRef] [Green Version]
  15. Yue, X.L.; Mu, X.M.; Zhao, G.J.; Shao, H.B.; Gao, P. Dynamic changes of sediment load in the middle reaches of the Yellow River basin, China and implications for eco-restoration. Ecol. Eng. 2014, 73, 64–72. [Google Scholar] [CrossRef]
  16. Wang, S.A.; Fu, B.J.; Piao, S.L.; Lu, Y.H.; Ciais, P.; Feng, X.M.; Wang, Y.F. Reduced sediment transport in the Yellow River due to anthropogenic changes. Nat. Geosci. 2016, 9, 38–41. [Google Scholar] [CrossRef]
  17. Zuo, D.P.; Xu, Z.X.; Yao, W.Y.; Jin, S.Y.; Xiao, P.Q.; Ran, D.C. Assessing the effects of changes in land use and climate on runoff and sediment yields from a watershed in the Loess Plateau of China. Sci. Total Environ. 2016, 544, 238–250. [Google Scholar] [CrossRef]
  18. Tian, S.M.; Xu, M.Z.; Jiang, E.H.; Wang, G.H.; Hu, H.C.; Liu, X. Temporal variations of runoff and sediment load in the upper Yellow River, China. J. Hydrol. 2019, 568, 46–56. [Google Scholar] [CrossRef]
  19. Yang, S.L.; Zhao, Q.Y.; Belkin, I.M. Temporal variation in the sediment load of the Yangtze river and the influences of human activities. J. Hydrol. 2002, 263, 56–71. [Google Scholar] [CrossRef]
  20. Dai, S.B.; Lu, X.X.; Yang, S.L.; Cai, A.M. A preliminary estimate of human and natural contributions to the decline in sediment flux from the Yangtze River to the East China Sea. Quat. Int. 2008, 186, 43–54. [Google Scholar] [CrossRef]
  21. Li, N.; Wang, L.C.; Zeng, C.F.; Wang, D.; Liu, D.F.; Wu, X.T. Variations of Runoff and Sediment Load in the Middle and Lower Reaches of the Yangtze River, China (1950–2013). PLoS ONE 2016, 11, e0160154. [Google Scholar] [CrossRef] [PubMed]
  22. Yang, H.F.; Yang, S.L.; Xu, K.H.; Milliman, J.D.; Wang, H.; Yang, Z.; Chen, Z.; Zhang, C.Y. Human impacts on sediment in the Yangtze River: A review and new perspectives. Glob. Planet Chang. 2018, 162, 8–17. [Google Scholar] [CrossRef]
  23. Wang, Y.K.; Rhoads, B.L.; Wang, D.; Wu, J.C.; Zhang, X. Impacts of large dams on the complexity of suspended sediment dynamics in the Yangtze River. J. Hydrol. 2018, 558, 184–195. [Google Scholar] [CrossRef]
  24. Wu, X.; Wang, Z.; Zhou, X.; Lai, C.; Lin, W.; Chen, X. Observed changes in precipitation extremes across 11 basins in China during 1961–2013. Int. J. Climatol. 2016, 36, 2866–2885. [Google Scholar] [CrossRef]
  25. Zhang, S.R.; Lu, X.X.; Higgitt, D.L.; Chen, C.T.A.; Han, J.T.; Sun, H.G. Recent changes of water discharge and sediment load in the Zhujiang (Pearl River) Basin, China. Glob. Planet Chang. 2008, 60, 365–380. [Google Scholar] [CrossRef]
  26. Zhang, W.; Mu, S.S.; Zhang, Y.J.; Chen, K.M. Temporal variation of suspended sediment load in the Pearl River due to human activities. Int. J. Sediment Res. 2011, 26, 487–497. [Google Scholar] [CrossRef]
  27. Ministry of Water Resources of the People’s Republic of China. Bulletin of First National Census for Water. 2013. Available online: www.mwr.gov.cn (accessed on 1 January 2013).
  28. Peitong, N.; Ping, W.; Jianyu, L. Study on Variation of Annual Water Discharge and Sediment Load in Pearl River Delta. Pearl River 2016, 37, 19–24. (In Chinese) [Google Scholar]
  29. Wu, X.; Wang, Z.; Guo, S.; Liao, W.; Zeng, Z.; Chen, X. Scenario-based projections of future urban inundation within a coupled hydrodynamic model framework: A case study in Dongguan City, China. J. Hydrol. 2017, 547, 428–442. [Google Scholar] [CrossRef]
  30. Deng, S.; Chen, T.; Yang, N.; Qu, L.; Li, M.; Chen, D. Spatial and temporal distribution of rainfall and drought characteristics across the Pearl River basin. Sci. Total Environ. 2018, 619, 28–41. [Google Scholar] [CrossRef]
  31. Zhang, Q.; Xu, C.Y.; Becker, S.; Zhang, Z.X.; Chen, Y.D.; Coulibaly, M. Trends and abrupt changes of precipitation maxima in the Pearl River basin, China. Atmos. Sci. Lett. 2009, 10, 132–144. [Google Scholar] [CrossRef]
  32. Liu, B.J.; Chen, J.F.; Lu, W.X.; Chen, X.H.; Lian, Y.Q. Spatiotemporal characteristics of precipitation changes in the Pearl River Basin, China. Theor. Appl. Climatol. 2016, 123, 537–550. [Google Scholar] [CrossRef]
  33. Yan, Y.X.; Wang, S.J.; Yan, M.; He, L.; Zhang, L. Spatial variation of scale effects of specific sediment yield in Zhujiang (Pearl River) basin. Quat. Int. 2014, 336, 117–126. [Google Scholar] [CrossRef]
  34. Zhang, Q.; Xu, C.Y.; Chen, X.H.; Lu, X.X. Abrupt changes in the discharge and sediment load of the Pearl River, China. Hydrol. Process. 2012, 26, 1495–1508. [Google Scholar] [CrossRef]
  35. Zhang, Q.; Xu, C.Y.; Chen, Y.Q.D.; Jiang, J.M. Abrupt behaviors of the streamflow of the Pearl River basin and implications for hydrological alterations across the Pearl River Delta, China. J. Hydrol. 2009, 377, 274–283. [Google Scholar] [CrossRef]
  36. Niu, J.; Chen, J. A wavelet perspective on variabilities of hydrological processes in conjunction with geomorphic analysis over the Pearl River basin in South China. J. Hydrol. 2016, 542, 392–409. [Google Scholar] [CrossRef]
  37. Mann, H.B. Nonparametric Tests Against Trend. Econometrica 1945, 13, 245–259. [Google Scholar] [CrossRef]
  38. George Kendall, M. Rank Correlation Methods; Griffin: London, UK, 1975. [Google Scholar]
  39. Kahya, E.; Kalayci, S. Trend analysis of streamflow in Turkey. J. Hydrol. 2004, 289, 128–144. [Google Scholar] [CrossRef]
  40. Olsson, O.; Gassmann, M.; Wegerich, K.; Bauer, M. Identification of the effective water availability from streamflows in the Zerafshan river basin, Central Asia. J. Hydrol. 2010, 390, 190–197. [Google Scholar] [CrossRef]
  41. Panda, D.K.; Kumar, A.; Mohanty, S. Recent trends in sediment load of the tropical (Peninsular) river basins of India. Glob. Planet Chang. 2011, 75, 108–118. [Google Scholar] [CrossRef]
  42. Wilson, D.; Hisdal, H.; Lawrence, D. Has streamflow changed in the Nordic countries?—Recent trends and comparisons to hydrological projections. J. Hydrol. 2010, 394, 334–346. [Google Scholar] [CrossRef]
  43. Libiseller, C.; Grimvall, A. Performance of partial Mann-Kendall tests for trend detection in the presence of covariates. Environmetrics 2002, 13, 71–84. [Google Scholar] [CrossRef]
  44. Yue, S.; Wang, C.Y. Applicability of prewhitening to eliminate the influence of serial correlation on the Mann-Kendall test. Water Resour. Res. 2002, 38. [Google Scholar] [CrossRef]
  45. Mount, N.J.; Tate, N.J.; Sarker, M.H.; Thorne, C.R. Evolutionary, multi-scale analysis of river bank line retreat using continuous wavelet transforms: Jamuna River, Bangladesh. Geomorphology 2013, 183, 82–95. [Google Scholar] [CrossRef]
  46. Sen, A.K. Spectral-temporal characterization of riverflow variability in England and Wales for the period 1865–2002. Hydrol. Process. 2009, 23, 1147–1157. [Google Scholar] [CrossRef]
  47. White, M.A.; Schmidt, J.C.; Topping, D.J. Application of wavelet analysis for monitoring the hydrologic effects of dam operation: Glen Canyon Dam and the Colorado River at Lees Ferry, Arizona. River Res. Appl. 2005, 21, 551–565. [Google Scholar] [CrossRef]
  48. Wu, X.; Guo, S.; Yin, J.; Yang, G.; Zhong, Y.; Liu, D. On the event-based extreme precipitation across China: Time distribution patterns, trends, and return levels. J. Hydrol. 2018, 562, 305–317. [Google Scholar] [CrossRef]
  49. Grinsted, A.; Moore, J.C.; Jevrejeva, S. Application of the cross wavelet transform and wavelet coherence to geophysical time series. Nonlinear Process. Geophys. 2004, 11, 561–566. [Google Scholar] [CrossRef]
  50. Wang, Z.; Li, J.; Lai, C.; Zeng, Z.; Zhong, R.; Chen, X.; Zhou, X.; Wang, M. Does drought in China show a significant decreasing trend from 1961 to 2009? Sci. Total Environ. 2017, 579, 314–324. [Google Scholar] [CrossRef]
  51. Yang, S.L.; Xu, K.H.; Milliman, J.D.; Yang, H.F.; Wu, C.S. Decline of Yangtze River water and sediment discharge: Impact from natural and anthropogenic changes. Sci. Rep. 2015, 5, 12581. [Google Scholar] [CrossRef]
  52. Wu, X.; Li, N.; Wang, L. Characteristics of runoff and sediment discharge in Yangtze river in recent 60 years. J. Sediment Res. 2016, 5, 40–46. (In Chinese) [Google Scholar]
  53. Wang, J.; Yao, S.; Zhou, Y. Review on river sediment resources utilization in China. J. Sediment Res. 2019, 44, 73–80. (In Chinese) [Google Scholar] [CrossRef]
  54. Jiang, Z.C.; Lian, Y.Q.; Qin, X.Q. Rocky desertification in Southwest China: Impacts, causes, and restoration. Earth Sci. Rev. 2014, 132, 1–12. [Google Scholar] [CrossRef]
  55. Dai, Q.; Liu, Z.; Shao, H.; Yang, Z. Karst bare slope soil erosion and soil quality: A simulation case study. Solid Earth 2015, 6, 985–995. [Google Scholar] [CrossRef]
  56. Yan, Y.J.; Dai, Q.H.; Yuan, Y.F.; Peng, X.D.; Zhao, L.S.; Yang, J. Effects of rainfall intensity on runoff and sediment yields on bare slopes in a karst area. SW China. Geoderma 2018, 330, 30–40. [Google Scholar] [CrossRef]
  57. Lai, C.G.; Chen, X.H.; Wang, Z.L.; Wu, X.S.; Zhao, S.W.; Wu, X.Q.; Bai, W.K. Spatio-temporal variation in rainfall erosivity during 1960–2012 in the Pearl River Basin, China. Catena 2016, 137, 382–391. [Google Scholar] [CrossRef]
  58. Yan, X.; Cai, Y.L. Multi-Scale Anthropogenic Driving Forces of Karst Rocky Desertification in Southwest China. Land Degrad. Dev. 2015, 26, 193–200. [Google Scholar] [CrossRef]
  59. Chen, C.; Park, T.; Wang, X.; Piao, S.; Xu, B.; Chaturvedi, R.K.; Fuchs, R.; Brovkin, V.; Ciais, P.; Fensholt, R.; et al. China and India lead in greening of the world through land-use management. Nat. Sustain. 2019, 2, 122–129. [Google Scholar] [CrossRef]
  60. Cai, H.Y.; Yang, X.H.; Wang, K.J.; Xiao, L.L. Is Forest Restoration in the Southwest China Karst Promoted Mainly by Climate Change or Human-Induced Factors? Remote Sens. 2014, 6, 9895–9910. [Google Scholar] [CrossRef] [Green Version]
  61. Tong, X.; Brandt, M.; Yue, Y.; Horion, S.; Wang, K.; Keersmaecker, W.D.; Tian, F.; Schurgers, G.; Xiao, X.; Luo, Y.; et al. Increased vegetation growth and carbon stock in China karst via ecological engineering. Nat. Sustain. 2018, 1, 44–50. [Google Scholar] [CrossRef]
  62. Wu, C.S.; Yang, S.L.; Huang, S.C.; Mu, J.B. Delta changes in the Pearl River estuary and its response to human activities (1954–2008). Quat. Int. 2016, 392, 147–154. [Google Scholar] [CrossRef]
  63. Wu, X.; Guo, S.; Liu, D.; Hong, X.; Liu, Z.; Liu, P.; Chen, H. Characterization of rainstorm modes along the upper mainstream of Yangtze River during 2003–2016. Int. J. Climatol. 2018, 38, 1976–1988. [Google Scholar] [CrossRef]
  64. Wu, X.; Wang, Z.; Zhou, X.; Zeng, Z.; Lai, C.; Chen, X. Variability of annual peak flows in the Beijiang River Basin, South China, and possible underlying causes. Hydrol. Res. 2017, 48, 442–454. [Google Scholar] [CrossRef]
Figure 1. Delineation of the Pearl River Basin (PRB), nine hydrological stations, and the primary hydraulic projects. Symbols ①~⑧ with triangles indicate the Tianshengqiao (I & II), Longtan, Baise, Xijin, Datengxia (under construction), Feilaixia, Xinfengjiang, and Fengshuba reservoirs, respectively.
Sustainability 11 05007 g001
Figure 2. MK test results for the abrupt change analysis in annual runoff for nine stations in the PRB during 1953–2017. The red and blue lines denote the UF and UB curves, respectively. The horizontal dashed lines indicate the 95% confidence level.
Sustainability 11 05007 g002
Figure 3. MK test results for the abrupt change analysis in annual sediment load for nine stations in the PRB during 1953–2017. The red and blue lines denote the UF and UB curves, respectively. The horizontal dashed lines indicate the 95% confidence level.
Sustainability 11 05007 g003
Figure 4. Wavelet analysis of annual runoff for nine stations. The envelope lines in the left panel are the contour lines of energy density that is dimensionless, with deeper colors indicating stronger powers. The right panel of each figure shows the global wavelet spectrum, in which the red dashed line denotes the 95% confidence level, beyond which the period is significant.
Sustainability 11 05007 g004
Figure 5. Wavelet analysis of annual sediment load for nine stations. The envelope lines in the left panel are the contour lines of energy density that is dimensionless, with deeper colors indicating stronger powers. The right panel of each figure shows the global wavelet spectrum, in which the red dashed line denotes the 95% confidence level, beyond which the period is significant.
Sustainability 11 05007 g005aSustainability 11 05007 g005b
Table 1. Basic information on the hydrological records of nine stations in the PRB. Note: Xiaolongtan (XLT), Qianjiang (QJ), Liuzhou (LZ), Dahuangjiangkou (DHJK), Wuzhou (WZ), Nanning (NN), Gaoyao (GY), Shijiao (SJ), and Boluo (BL).
RiverControl StationDrainage Area (104 km2)Runoff Data AvailabilityMean Annual Runoff (109 m3/year)Sediment Data AvailabilityMean Annual Sediment Load (106 tons/year)
Nanpanjiang RiverXLT1.541953–20153.5951964–20154.48
Hongshui RiverQJ12.891954–201564.661954–201535.3
Liujiang RiverLZ4.541954–201539.331955–20154.96
Xunjiang RiverDHJK7.271954–2015169.61954–201550.1
West RiverWZ28.851954–2015201.61954–201555.7
Yujiang RiverNN32.701954–201536.831954–20158.15
West RiverGY35.151957–2015217.31957–201559.6
North RiverSL3.841954–201541.711954–20155.38
East RiverBL2.531954–201523.101954–20152.26
Table 2. Major reservoirs in the PRB.
RiverReservoirNumberNormal Pool Level (m)Storage Capacity (108 m3)Date of Impoundment
NanpanjiangTianshengqiao17801032000
HongshuiheLongtan24002732009
YujiangBaise3228562002
YujiangXijin463141979
WestDatengxia56134Unfinished
NorthFeilaixia652191993
EastXinfengjiang71161401969
EastFengshuba8166191973
Table 3. Trends in annual runoff and sediment load for nine stations in the PRB indicated by the Mann–Kendall (MK) test.
StationLocationAnnual RunoffAnnual Sediment Load
z Statisticsp-ValueTz Statisticsp-ValueT
XLTUpper reach−2.47<0.05−3.09<0.05
QJMiddle reach−1.96<0.05−5.34<0.05
LZMiddle reach0.460.647-4.53<0.05
DHJKMiddle reach0.060.949-−4.33<0.05
WZMiddle reach−0.120.903-−5.44<0.05
NNMiddle reach−0.990.325-−3.20<0.05
GYLower reach−0.120.906-−4.47<0.05
SJLower reach0.520.606-−1.000.3182-
BLLower reach0.230.821-−5.10<0.05
T denotes trend, and ↓/↑/- indicate significant downward/upward/no trend.
Table 4. Results of abrupt change detection in annual runoff and sediment load for nine stations in the PRB.
StationsAbrupt Change Year of Annual RunoffAbrupt Change Year of Annual Sediment Load
XLT20031999
QJ20012003
LZ/2005
DHJK/2001
WZ/1999
NN/2004
GY/1999
SJ//
BL/1992
/ indicates no significant abrupt change in annual runoff or sediment load according to the MK test.
Table 5. Wavelet analysis of periodicities of annual runoff and sediment load at the nine stations in the PRB.
StationsAnnual RunoffAnnual Sediment Load
Data AvailabilityMultiple Time-Scale Periodicity (years)Prominent Periodicity (years)Data AvailabilityMultiple Time-Scale Periodicity (year)Prominent Periodicity (year)
Xiaolongtan1953–20172.6; 10.4; 17.5; 29.52.61964–20172.6; 6.2; 17.5; 29.52.6
Qianjiang1954–20173.1; 7.4; 14.7; 24.83.11954–20173.7; 17.53.7
liuzhou1954–20173.1; 7.4; 20.93.11954–20172.2; 3.7; 7.4; 12.42.2
Dahuangjiangkou1954–20172.6; 3.1; 7.4; 24.82.6; 3.11954–20173.1; 14.73.1
Wuzhou1954–20172.6; 7.4; 20.92.61954–20173.7; 14.73.7
Nanning1954–20172.6; 3.7; 6.2; 14.7; 24.82.6; 3.7; 6.21954–20173.7; 8.8; 24.83.7
Gaoyao1957–20172.6; 7.4; 24.82.61957–20173.1; 8.8; 12.43.1
Shijiao1956–20172.6; 4.4; 10.4; 20.92.6; 4.41975–20172.2; 4.4; 6.2; 14.7; 29.52.2; 4.4
Boluo1954–20172.6; 4.4; 8.8; 20.92.6; 4.41954–20172.2; 7.4; 12.4; 20.92.2

