Abstract
It is crucial to evaluate indoor personal thermal comfort for a comfortable and green thermal environment. At present, the research on individual thermal comfort does not consider its implementation mode. Moreover, the improvement of energy saving efficiency under the premise of increasing human comfort is an urgent problem that needs to be solved. In this paper, we proposed a Building Information Model (BIM) and Artificial Neural Network (ANN) based system to solve this problem. The system consists of two parts including an ANN predictive model considering the Predicted Mean Vote (PMV) index, the persons’ position, and an innovative plugin of BIM to realize dynamic evaluation and energy efficient design. The ANN model has three layers, considering three environment parameters (air temperature, air humidity, and wind speed around the person), three human state parameters (human metabolism rate, clothing thermal resistance, and the body position) and four body parameters (gender, age, height, and weight) as inputs. The plugin provides two functions. One is to provide corresponding personal thermal comfort evaluation results with dynamic changes of parameters returned by Wireless Sensor Networks (WSN). The other one is to provide energy saving optimization suggestions for interior space design by simulating the energy consumption index of different design schemes. In the data test, the Mean Squared Error (MSE) of the established ANN model was about 0.39, while the MSE of traditional PMV model was about 2.1. The system realized the integration of thermal information and a building model, thereby providing guidance for the creation of a comfortable and green indoor environment.
1. Introduction
Thermal comfort is defined as a psychological state in which people express satisfaction towards the thermal environment [1]. The creation of a comfortable indoor thermal environment is attracting more attention because it is advantageous to the health of inhabitants and their working efficiency. In addition, it can also help reduce the energy consumption of buildings. The construction industry consumes nearly 40% of the world’s energy [2], and about 50% of consumption is caused by air conditioning [3]. Adjusting the temperature of air conditioning based on individual thermal comfort can maintain low energy consumption and retain comfort simultaneously [4]. In order to establish a comfortable and green indoor thermal environment, it is necessary to evaluate the individual’s thermal comfort correctly.
1.1. Development of Personalized Thermal Comfort Models
The PMV model and the adaptive model are two main models of evaluating thermal comfort. PMV has been established based on a large number of experiments conducted by Fanger [5] and has become the reference to ISO7730 [6] and the American Society of Heating, Refrigerating and Air Conditioning Engineers (ASHRAE55) [7]. Currently, the ASHRAE55 adaptive model built by Dear and Brager [8] and the European Standards 15251 (EN15251) adaptive model built by Nicol and Humphreys [9] are two main adaptive model standards.
Although it has been successfully applied to international standards, the prediction performance of existing models still needs improvement regarding individual comfort [10,11]. This is because both of the two main models are aggregation models that are mainly applied to predict the average comfort level of large groups. Generally speaking, the thermal comfort level of different individuals varies due to physiological diversity and subjective feelings. In addition, neither of the models can be used to relearn [12] The models cannot be updated according to the comfort characteristics of individual residents in a particular field [13]. As such, the establishment of an individual thermal comfort evaluation system is essential to improve individual comfort and achieve personalized thermal environment management.
Much research has tried to use machine learning to build individual thermal comfort models, and the ANN model is a common one. Liu, et al. [14] established an ANN thermal comfort evaluation model based on the backward propagation algorithm, only with four environment variables as the input values. But the model ignores the differences of individual thermal sensation. Kim et al. [15] used six kinds of machines, including ANN algorithm to establish personal thermal comfort evaluation model, which considered environment data and the behavior of users of Personal Comfort System (PCS) chair as input variables. In the study of Grabe, J. [16], four indoor environmental variables, three variables of current climatic conditions, and two individual variables, building types, as well as body variable, were taken into account in the ANN model built to predict thermal comfort. In a case study based on adaptive database RP-884 [17], when adding the gender and age of the residents, or inputting three variables of current climatic conditions, the predictive accuracy declines. However, the model is superior to PMV in both quality and the information range of prediction, which proves that the ANN has potential in evaluating individual thermal comfort [16].
1.2. The Gap of Present Research
Optimizing the input parameter settings of the ANN thermal comfort model by taking individual differences into account to improve the accuracy of the model in predicting individual thermal comfort is one of the current research gaps. In addition, the above research did not consider ways to realize the real time evaluation of individual thermal comfort, but instead only focused on model optimization.
There are many parameters influencing individual thermal comfort, including environmental parameters (air temperature, humidity, wind speed, average radiation temperature, etc. [18]) and human parameters (metabolic rate, location, dressing, weight, age and health status of the individual) [19]. For example, the movement of people in a room affects their thermal comfort by influencing their average radiation temperature. However, the average radiation temperature is often considered to be nearly the same as the air temperature, thereby neglecting the influence created by the change of an individual’s position. Nevertheless, models that directly consider the average radiation temperature or other special parameters often require special instruments, which greatly weakens the practicability and generalization of the model.
1.3. Research Contributions
BIM provides a platform for the application of the personal thermal comfort evaluation model. It not only provides basic information about buildings such as the component location or material properties, but also serves as a platform for integrating data that affects individual thermal comfort. In addition, WSN, composed of a large number of static or mobile sensors in a self organizing and multi-hop manner, is a great tool for detecting environments and transmitting data in time. It can effectively collect data within the device and is easily installed in existing devices.
This study has three parts of contributions. The first part is to optimize the evaluation model of personal thermal comfort. Besides environment parameters and body parameters, the proposed ANN thermal comfort evaluation model takes the change of human position into consideration, thereby improving the accuracy of predicting thermal comfort.
The second part is to realize the dynamic evaluation of personal thermal comfort. After integrating the building thermal information by using the WSN and BIM, the developed plugin could provide corresponding personal thermal comfort evaluation results with dynamic changes of parameters returned by WSN in the Revit platform. Through the plugin, the proposed ANN evaluation model can be called in BIM software, achieving the storage of data involved personal thermal comfort storage at the same time.
The third part is to provide suggestions on indoor furniture placement to reduce energy consumption. In conclusion, this study optimizes the individual thermal comfort evaluation model, and provides a new way to expand the application of BIM in the green management of an indoor environment.
2. Literature Review
2.1. Personal Thermal Comfort Evaluation Model
More recent attention has focused on machine learning methods to predict personal thermal comfort. Based on the backward propagation algorithm, Liu et al [14] has established an individual neural network evaluation model for thermal comfort. Their model inputs are four environment parameters, including average radiation temperature, air temperature, wind speed, and relative humidity. The results of case study indicated that the evaluation results of the model accorded better with the thermal sensation of subjects compared to PMV, showing that the model could correctly appraise thermal comfort.
Lee et al. [20] used a Bayesian network method to learn individual occupant thermal preference. There are six input variables in the model, including air temperature, air humidity, wind speed, average radiation temperature, clothing thermal resistance, and the human body metabolism rate. By collecting data in office buildings, this model could explain the thermal preferences of office staff.
Four environmental parameters (air temperature, average radiation temperature, wind speed, and steam pressure), and two individual parameters (human metabolic rate and clothing insulation index) were regarded as input variables in Grabe, J’s study [16]. Based on these variables, they built an artificial neural network model for predicting thermal comfort. An example showed that the accuracy of this model outperformed the traditional PMV model under different conditions.
In order to measure the thermal comfort of inhabitants in the built environment, Chaudhuri et al. [21] developed a model, which used human skin temperature and its gradient feature as input variables of the model. Then four kinds of model inputs were compared with a Support Vector Machine (SVM) and Extreme Learning Machine (ELM) classifier. The results of the case study showed that non-normalized skin temperature alone could only accurately estimate about 65% of thermal states, and the predicted thermal state model based on normalized skin features accurately predicted 87% of thermal states.
Kim et al. [15] established six models with six machine learning algorithms including artificial neural network and compared their performances of predicting individual thermal comfort. In the research, the behavior of Personal Comfort System (PCS) chair users and environmental data were considered as input to predict personal thermal preferences. The results showed that various machine learning languages had their own advantages and disadvantages [19].
Although all the above studies have improved the accuracy of thermal comfort prediction models, there are still challenges in practical application. The collection of model input data is a large application barrier of modeling. At least one of the input parameters in the model needs to be collected by special instruments, such as PCS chair and infrared thermal imager. In addition, considering the fact that everyone has different sensitivity to thermal sensation, these thermal comfort models fail to provide adjustment interfaces for setting personal preferences to meet the personalized needs.
2.2. BIM and Thermal Comfort
There are few studies using BIM to analyze the thermal performance of buildings, and less focus on the evaluation of individual thermal comfort.
Mohamed et al. [22] combined WSN with BIM models to monitor the environment. The system developed in their research can measure the temperature and humidity in the subway by installing WSN, and connect the information with the BIM in a spatial way. A simple mathematical model is combined with BIM software to predict the thermal comfort of passengers.
Natephra et al. [23] collected the value of temperature and relative humidity of the building during different times through sensors, and acquired the images describing the temperature and relative humidity. By inputting the collected data into the existing BIM, the 3D or 4D thermal information can be visualized. This visualization helps to analyze elevation heat diffusion and the thermal comfort index. The case study showed that the image from the thermal imager could be visualized in the developed application to help users identify thermal performance defects.
Natephra et al. [24] used visual scripts to extract and map spatial temporal thermal data to BIM. The developed system converts the collected thermal image into numerical surface temperature and integrates the collected environmental data in BIM. By calculating thermal comfort variables such as Mean Radiation Temperature (MRT), it can then evaluate the thermal comfort level of different positions in the building. The practicability of this method in analyzing thermal performance and evaluating thermal comfort was verified in a case study.
The research above focuses on the analysis of building thermal performance. The evaluation of individual thermal comfort in buildings is solely based on the PMV or adaptive model mentioned above, which is mostly appropriate for the thermal comfort of groups. Also, the parameter regulation are simplified in the calculation of thermal comfort in BIM.
3. Research Methods
3.1. The Improved PMV Thermal Comfort Evaluation Model
According to previous works, many factors such as physical factors, physiological factors, and psychological factors affect individual thermal comfort. However, it is difficult to take all these factors into account when evaluating individual thermal comfort.
In the 1960s, Fanger [5] proposed the thermal comfort evaluation equation with factors affecting the feeling of human thermal comfort in consideration. The equation comprehensively considered a variety of factors. The PMV index represents most people’s feelings about hot or cold temperatures in the same environment. The PMV calculation formula is as follows.
In the PMV model, the evaluation index contains two human factors (the type of activity and the clothing type), and four environmental factors (air temperature, air humidity, air velocity and average radiation temperature) [25,26,27,28].
In the calculation of human thermal comfort, the average radiation temperature is often replaced by air temperature, which undoubtedly affects the calculation accuracy. The calculation formula shows that the average radiation temperature is relevant to the angle coefficient between the individual and the walls of the room. The angle coefficient varies with the change of the human body position. In addition, the calculation of angle coefficient involves complex integral formulas. At present, it is commonly calculated by referring to tables and graphs, with difficulty and low accuracy. Therefore, in ISO and other regulations, the average radiation temperature is approximately taken as air temperature, neglecting the influence of the human body position on thermal comfort.
In this paper, when considering the influence of human position changes on thermal comfort, the distance between the person and a fixed device can represent the changing process to some extent. Therefore, this paper intends to add the distance between the three dimensional human position and refrigeration (heat) equipment into the evaluation model of individual thermal comfort, as shown in Formula (6).
where d means the distance between the position of the human three dimensional space and the refrigeration (heat) equipment.
3.2. Construction of Artificial Neural Network Thermal Comfort Evaluation Model
There are many parameters affecting individual thermal comfort, but the specific mechanism of their actions on thermal comfort is still unknown. The process of solving individual thermal comfort with several factors can be understood as a “black box” mapping from the input to output, which is very suitable for ANN. This paper aims at building an individual thermal comfort evaluation model based on a Back Propagation (BP) artificial neural network.
In addition to the location parameters, air humidity and air velocity can be simply obtained by using sensors. They are two input parameters of the neural network model because of the low price and feasibility. Meanwhile, the activity type and clothing type of the person are also considered in this model.
Moreover, studies have shown that women prefer warmer environments than men [29,30]. And there are significant differences in thermal sensation preferences between the young and the old, as well as between persons with different figures [29,30,31]. Therefore, age, gender, height, and weight are also considered in this model.
To sum up, this paper selects air temperature, air humidity, air speed, distance between people and equipment, human activity type, clothing type, gender, age, weight, and height as the inputs of the thermal comfort ANN model, as shown in formula 7. So there are ten neurons in the input layer and only one neuron in the output layer. With the entering of someone’s index value into the network via the input layer, the network operates with the trained weight, and the output layer outputs the value of the person’s thermal comfort.
There is no definite evaluation method for hidden layer nodes at present. The reasonable value range can be calculated according to the empirical Formula (8).
Where k refers to the nodes number in the hidden layer, n represents the nodes number in the input layer, and m represents the nodes number in the output layer. The nodes number in the hidden layer should be determined according to the formula above and simulation results. Since n is 10 and m is 1 in the sample studied in this paper, the value range of nodes number in the hidden layer can be achieved, which is [5,13]. In addition, based on the Kolmogorov’s theorem, a formula considering the number of hidden layer nodes can be further established, which is shown in Formula (9).
k = 2 n + 1
Where n is the number of input layer nodes.When n is 10, k is calculated to be 21. Finally, through comparing the experiments results at different values of n from 5 to 22, and comprehensive consideration of learning time, times and error effect, the number of hidden layer nodes can be achieved, which is 13. The tansig is set as the transferring function. Since the output is one dimensional, the second layer is a single neuron and the transferring function is linear. Therefore, the traingda function is selected as the training function. The function transferring the input into the output is purelin, and the training algorithm adopts the gradient descent algorithm.purelin and.tansig are neural transfer function. Transfer functions calculate a layer’s output from its net input. traingda is a network training function that updates weight and bias values according to gradient descent with adaptive learning rate
Based on the discussion above, the individual thermal evaluation model is established based on the artificial neural net, as is shown in Figure 1.
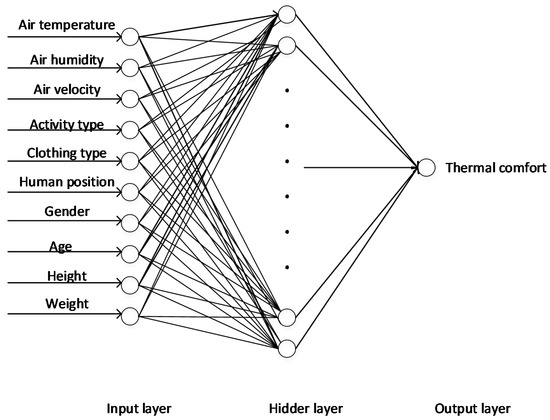
Figure 1.
Structure of an individual thermal comfort evaluation model based on an artificial neural network.
3.3. Model Training
3.3.1. Individual Thermal Comfort Experiment
To verify the framework proposed above, a further experiment case is prepared. The case is a research room of a university in Shanghai, covering an area of about 23 square meters, with three walls and one glass curtain wall. There is no sunlight in the room during the entire day, and an indoor air conditioner is utilized to adjust the temperature and the ventilation. During the experiment, the indoor thermal environment parameters, such as air temperature and wind speed, were changed by opening and closing doors or windows, and other ventilation methods.
The experiment was conducted from July to August in 2018, with 30 participants from a university in Shanghai, and the male and female ratio of the experiment was 1:1. In order to test the human thermal sensation, sensors were installed in the room in advance to collect the data.
When the system reached a stable state, the trial participants in a stable state were invited to enter the room. One hour after entering the laboratory, the trial participants were asked to fill in the first questionnaire about thermal comfort. After that, the indoor environment was changed by means of equipment adjustment, door and window positions being changed, etc., and data collection was conducted every minute by sensors.
There are a wind speed sensor and a humidity and temperature sensor used in this experiment. The wind speed sensor’s measurement range is from 0 to 10m/s with an accuracy of ± (0.01 m/s + 3%). The precision of the instrument fully meets the experimental requirements. The accuracy of the relative humidity sensor is 1% and that of the temperature sensor is 0.1 °C. The sensors were placed at the working height of indoor personnel, about 1.0 m beyond the ground. In addition, the sensors were put in the center of the room so the distance between sensors and each side of the walls was equal. The measured parameters here were taken as the average temperature of the room. The sensor was set to record the current parameters per minute.
The questionnaire for thermal comfort mainly included two parts. One part was about the basic information of trial participants, including height, age, and other physical conditions. The second part was about the parameters of thermal comfort mode, including clothing type, activity type, and thermal comfort feeling. Thermal comfort perception was mainly evaluated by the seven level scale of thermal comfort research proposed by Professor Finger, as is shown in Table 1.

Table 1.
Thermal sensation scale of PMV value.
3.3.2. The Results of Data Collection
Two human parameters can be obtained by checking an empirical table. The metabolic rate of the human body is related to its activity state, while the thermal resistance value of clothing varies according to seasons and thickness of clothing. In general, these two human factors were estimated by looking up relevant experience tables. And relative empirical tables have been developed according to both the ASHRAE standard and ISO standard, as shown in Table 2; Table 3.

Table 2.
Comparison table of human activity and metabolic rate.

Table 3.
Comparison table of human clothing and thermal resistance value.
156 groups of data were collected for the experiment. The collected data were used for the experiment simulation of this paper, among which 100 groups were used for model training and 56 groups were used for the model test. Part of the experimental data is shown in Table 4 (body parameters are not shown in Table 4, Table 5 and Table 6).

Table 4.
Some experimental data.

Table 5.
Partial test results of artificial neural network.

Table 6.
Partial calculation results of PMV model.
3.3.3. Model Training
Due to the physical units of each index being quite different from each other, in order to avoid a great gap between the values of each index, the min-max method is adopted to process the sample data by using dimensionless normalization.
Afterward, the processed data was trained in MATLAB [32] through the network writing training and the test program. During the adjustment process, the number of hidden layer neurons, training times, and the network parameters were finally determined. The training results are shown in Figure 2. After 100 sets of data were looped 10 times, the BP network was successfully trained using only 1 s.
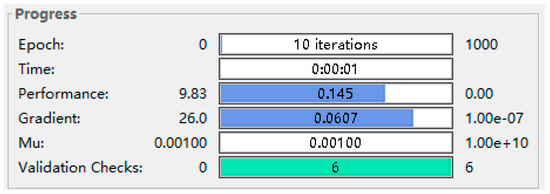
Figure 2.
The result of training the neural network.
After initialization of the BP neural network, the mean squared error of the network met the anticipated requirements through 10 rounds of training. The thermal comfort evaluation model based on BP neural network was finally established. The error rate of network training is shown in Figure 3.
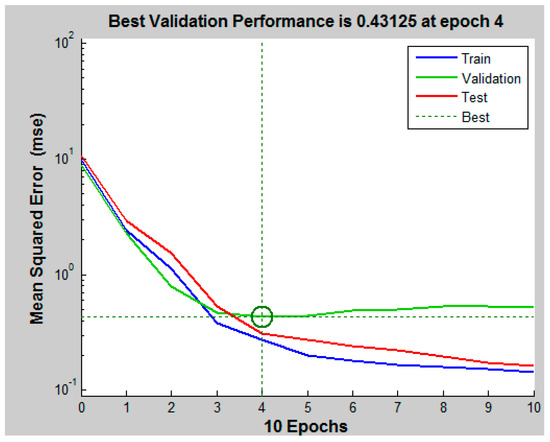
Figure 3.
The error rate of network training.
3.4. Analysis of the Effect of Model Prediction
The trained artificial neural network was used to calculate the corresponding thermal comfort of the remaining 50 groups of data, and the results are shown in Table 5.
The investigated value was obtained from the questionnaire survey above. Predicted value in the table means the value calculated by the trained artificial neural network using parameters in front columns. S1 is the result of subtracting predicted value from investigated value. Figure 4 shows the predicted results of ANN. X axis means the serial number of test data, and Y axis means the value of thermal comfort. The mean error between model output value and survey value is 0.39. We also calculate the same data using the MPV calculation model, and the results are shown in Table 6.
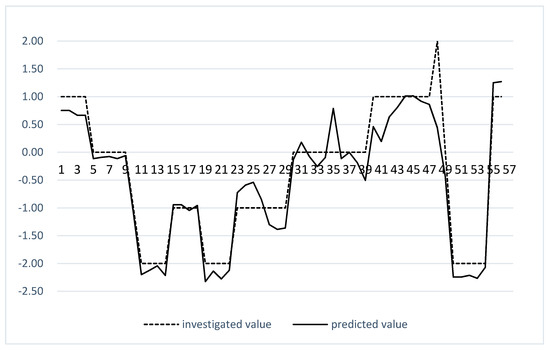
Figure 4.
Predicted results of ANN.
Similar to S1, S2 is also the result of the investigated value minus the predicted value. The data in Table 6 shows that the mean error between the output value of PMV model and the survey value is 2.1. The comparison between the two tables shows that 92.9% of the predicted value of neural network model is more accurate than that calculated by PMV. Among 56 groups of data, only 4 groups of calculated values of PMV model were closer to the experimental ones. Therefore, the trained neural network model is more accurate than MPV when used to predict individual thermal comfort.
4. The Plugin Development in Revit
4.1. Function 1: Evaluation of Personal Thermal Comfort
There is an interface for application development in the Revit software [33], where NET related language programming [34] can be realized to access the model’s graphic and parameter data, modifying elements and so on [35].
4.1.1. The Framework of Evaluation of Personal Thermal Comfort
Secondary development of Revit is utilized for data integration of building thermal environment and building information based on component ID. The developed plugin uses the artificial neural network model to realize an individual thermal comfort evaluation. At the same time, the data about individual thermal comfort levels is stored and provided in a digital format to support further research. The framework of the secondary development plugin is shown in Figure 5.
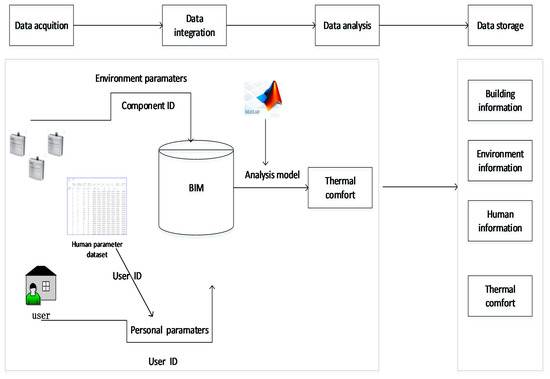
Figure 5.
The framework of secondary development plugin.
In the data integration stage, on one hand, a new sensor family can be built in Revit to show the spatial distribution of the sensor, with which the real location of the sensor will be matched with its position in the BIM through the component ID. And the environment data collected by th sensor is imported into the BIM to correlate with its corresponding measure position. The principle of sensor data matching is shown in Figure 6. On the other hand, body parameters are transferred by user ID, and the data set of the body parameter is stored in Excel in advance, which is correlated one by one with a unique user ID.
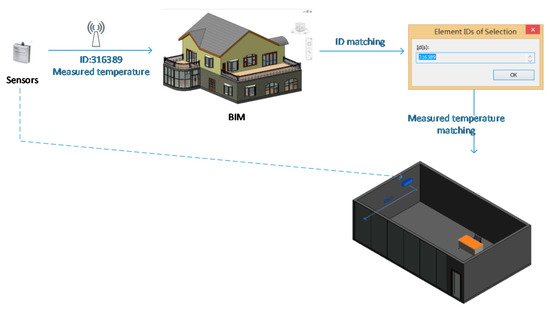
Figure 6.
Model location matching of sensors.
The closer the installation position of the sensor is to the human body, the greater the influence of the measured data on the surrounding environment of the human body will be. Based on such principle, the indoor environment parameters around the user can be calculated by using the spatial position of the sensor and the detected environment data as follows.
For example, it is assumed that the number of indoor temperature sensors is , and the formula for calculating the average air temperature around the human body is shown in Formulas (10)–(12).
where ti represents the temperature measured by the sensor i. ai represents the weight of the measured temperature of each sensors and can be calculated by Formula (12). Si represents the distance between sensor i and the human body, which can be obtained by the three-dimensional coordinates of the two in the BIM through the distance formula. The humidity and wind speed around the person can be calculated using the same principle.
In the stage of model analysis and calculation of thermal comfort, it is assumed that the number of heating or cooling devices in the room is m, and d mentioned in Formula (7) can be calculated by Formula (13).
where di is the distance between heating (cooling) devices i and the human
4.1.2. Implementation of BIM&WSN Based Plugin
BIM was used as a data platform to integrate the real time environmental data collected and transferred by WSN, location data in Revit and other data about human body. Among them, user ID can achieve the association between the human body parameters and the data set. The artificial neural network model established above was used to evaluate individual thermal comfort by using the plugin in BIM.
The entire plugin was implemented using C# language, Excel interface, MATLAB neural network tool and Revit secondary development interface. The data flow is shown in Figure 7.
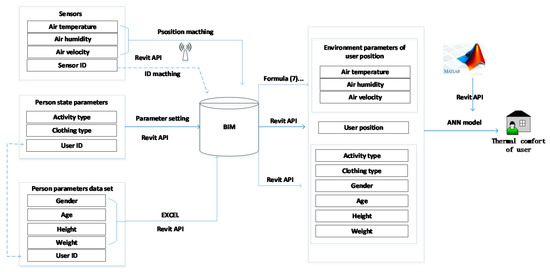
Figure 7.
Data flow of plugin.
Sensor data are transferred to the corresponding software through WSN and can be exported using Microsoft Excel. Through the OLEDB [36] tools of C#, a way to read and write data, and API, the measured data of sensor can be extracted to Revit. After locating the position of sensors in the Revit model based on its ID, the environment parameters around an individual can be calculated through the above mentioned Formulas (7)–(9).
In addition, the person state data including the clothing type and activity type are input as parameters through the window in Revit. Entering the user ID at the same time, the body parameters in the data set can be imported into Revit together by using the associated ID.
The content of the window is designed using the C# language, including setting the parameters of the corresponding relationship between clothing type and clothing thermal resistance, the activity type and human metabolism. The Revit model can be used to determine the distance between the position of human body and the device. The neural network model written in MATLAB is stored in the form of dll. The thermal comfort can be judged by calling the neural network model built in MATLAB and calculating thermal comfort in Revit.
The plugin is realized by C# language and the interface formed in Revit is shown below.
It consists of two parts. The first is user registration, shown as Figure 8. The user needs to input four parameters information, including height, age, gender, weight. After that, the user will receive a unique ID. This ID is one to one correspondence with individual parameters, and all the data will be stored in the person parameter data set.

Figure 8.
User registration.
The second part is called “Thermal comfort” and is located in the Revit additional module external tool (Figure 9). We first click on this plugin to calculate the thermal comfort of the human body.
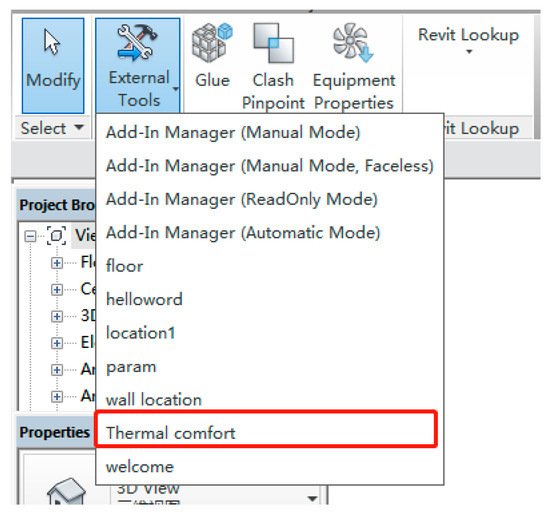
Figure 9.
Selecting the plugin.
After that, the interface will pop up a parameter setting box, as shown in Figure 10. In the box, the appropriate type of human activity and clothing can be selected in a drop down box.
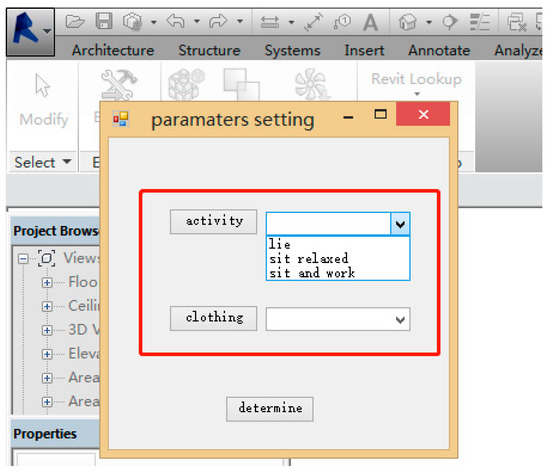
Figure 10.
Parameter settings.
After adding in the settings above, the plugin will now provide a small icon for positioning. The small icon is used to select the position of the individual at this time. Click this chair if the person sits in the chair near the desk. (Figure 11).
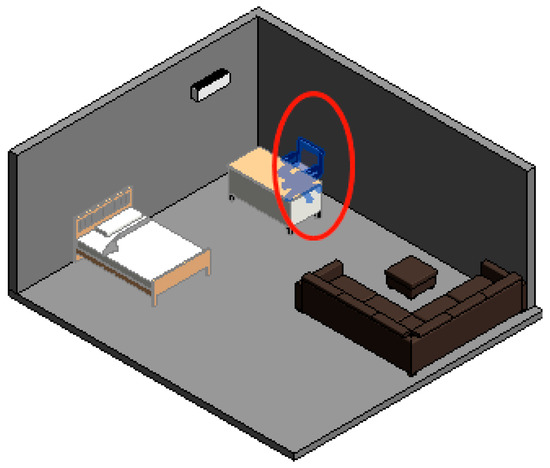
Figure 11.
Determination of the human body’s position.
The plugin calculates thermal comfort automatically according to the input of human state parameters, body parameters, and calculated environment parameters, and the calculation results are displayed in Figure 12. In terms of thermal sensation scale of PMV, the results shown in Figure 12 indicate that individual thermal comfort is moderate at this time. The current indoor thermal environment is comfortable, and there’s no need to change the environmental parameters.

Figure 12.
Calculation results of thermal comfort.
In addition, the plugin will automatically store related parameters and calculation results of thermal comfort in the selected Excel file. During application of the plugin, relevant data is automatically stored and an Excel file is finally exported, as shown in Table 7.

Table 7.
Data storage table.
4.2. Function 2: Optimization of Interior Design
4.2.1. The Calculation of Energy Consumption Index
In the stage of personalized indoor design, most parameters affecting thermal comfort are basically determined, except for the interior arrangement. The position and state of the person in the indoor environment have been basically determined with the placement of furniture. For example, as shown in Figure 13, most of the activity positions and states of individuals in this room can be determined. Position 2 represents a sleeping state, and position 1 represents an eating state. The proportion of time in each state can also be roughly judged.
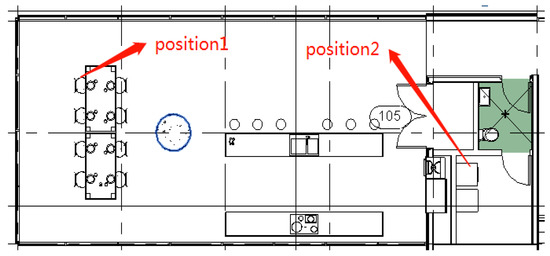
Figure 13.
An example of interior decoration.
The larger the gap between the ideal comfort level and the original comfort level, the more energy needed to change environmental parameters. In this paper, we propose an index C− to judge the energy consumption of a different design scheme based on the latest year’s environmental data. C− is calculated as Formulas (14)–(16). Assuming that the number of positions of the human in the room is m, and the proportion of time in each state is tj.
where Cj represents the personal comfort when human is in the position j.dj is the distance between heating (cooling) devices and the human’s position. And the temperature (Tt), wind speed (vt) and humidity (ϕt) of each day are assumed to be the data of the local weather bureau where user lives. A, G, H and Wʹ can be determined from Figure 8. Icl is confirmed from Table 8 according to the season of the calculated day in the user’s city.
where Cn represents the average personal comfort of a whole day, and tj is the proportion of time in the position j.
where C’ represents the ideal comfort, the value of which is 0. C− is the sum of the difference between the ideal comfort level and Cn of each day for the selected year.

Table 8.
Comparison table of human clothing and season.
Based on the formula, we can calculate C− for different indoor design. Then, we can judge the energy saving effect of the design scheme in terms of W. The greater C− is, the more energy will be consumed to maintain the thermal comfort of user to some degree.
4.2.2. The Implementation of Function 2
BIM has been widely studied in building energy simulation [37,38,39,40,41]. The visualization feature of BIM can provide clear display for people related project [42], and its parametric feature can quickly simulate various schemes with facilitating operation [43]. For the experimental room mentioned in the previous section, this paper applies function 2 of the plugin to optimize its interior design. The steps are as follows.
Step 1: Complete the Creation of Indoor Model
Without changing the number and type of existing components in the room, the position of movable components in the room is changed and a variety of layout schemes are proposed. Part of the layout plan is shown in Figure 14, Figure 15 and Figure 16.
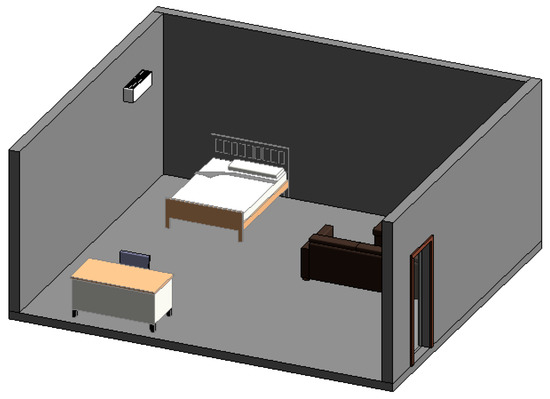
Figure 14.
The first scheme of indoor layout.
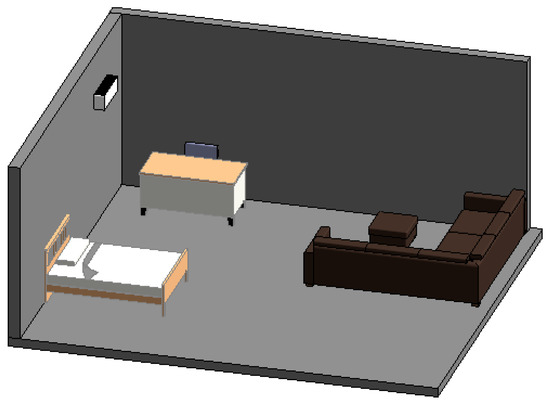
Figure 15.
The second scheme of indoor layout.

Figure 16.
The second function of thermal comfort.
Step 2: Select the possible location and corresponding state of the user, and fill in the proportion of the corresponding state in time.
According to different schemes, the position and the proportion of time in it are selected, as shown in the Figure 17, Figure 18 and Figure 19. As shown in the following figure, in design scheme 1, position 1 is the working position and the working hours account for about 30%. Position 2 is the sleeping position and the hours account for 70%. The time of other positions are too short and can be appropriately ignored.
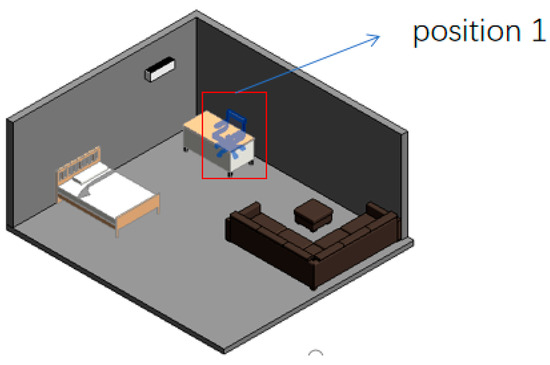
Figure 17.
Pick the first position.
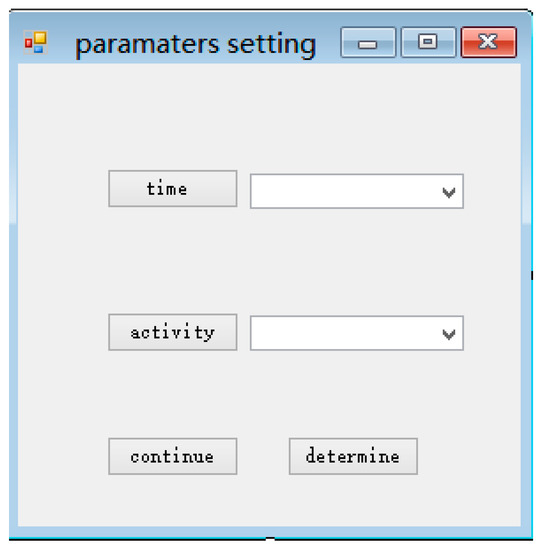
Figure 18.
Select the proportion of time and the corresponding activity state.
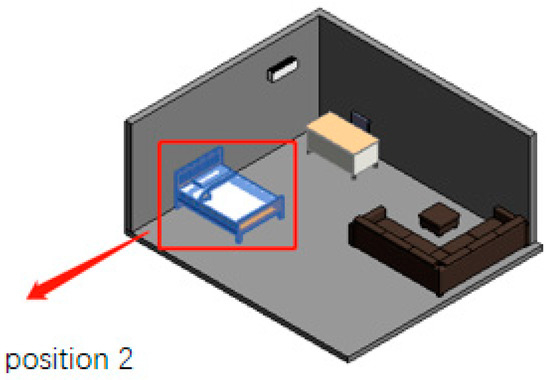
Figure 19.
Pick the second position.
Step 3: Select the city where the user lives and import the environmental information of it.
Select the city where the occupant lives, which in this case is Shanghai, China, as shown in Figure 20. The plugin will automatically fetch the temperature, humidity, and wind speed data of the latest year from the environmental database.
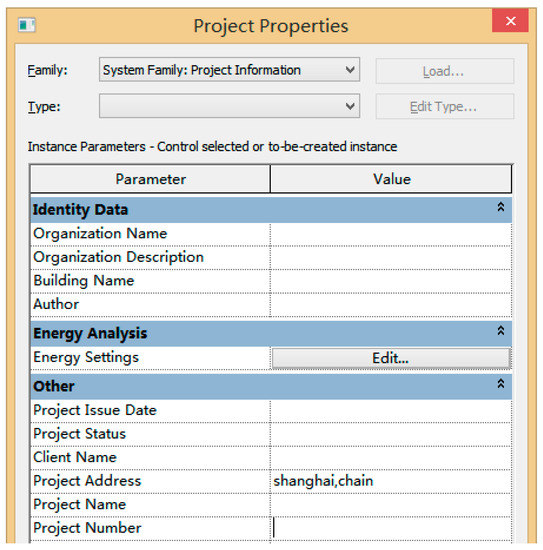
Figure 20.
Fill the project address.
Step 4: Calculate the energy consumption index of this interior design scheme.
According to the calculation method mentioned in the previous section, the plugin will get the energy consumption index corresponding to such a design.
Repeating the above steps, energy consumption indexes of different design schemes can be obtained in Revit. The energy consumption index of scheme 1 is 353.09, while the energy consumption index of scheme 2 is 300.09, as shown in Figure 21; Figure 22. So, when considering the energy consumption of maintaining thermal comfort, the second scheme is better.
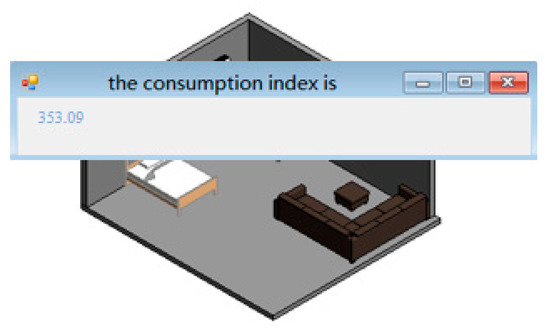
Figure 21.
The calculated value of the first schemes.
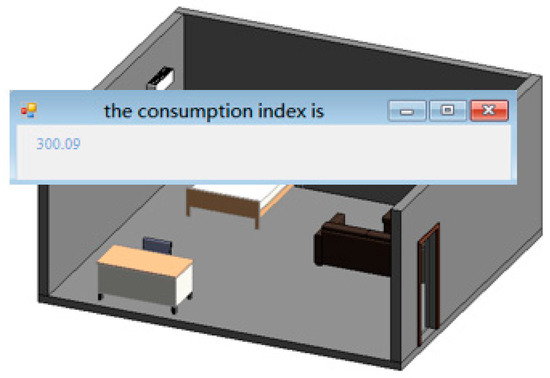
Figure 22.
The calculated value of the second schemes.
5. Conclusions
The accurate evaluation of individual thermal comfort is helpful to improve indoor temperature felt by people in different locations in a room. Two distinct part of research can be done to realize the proposed evaluation process. One is to build an evaluation model for individual thermal comfort based on an artificial neural network; the other is to use C# language to program the Revit secondary development plugin. The conclusions are as follows: (1) When considering the influence of human body position changes on thermal comfort, the artificial neural network model has a higher accuracy than the traditional PMV model in predicting individual thermal comfort; (2) the first function of the plugin in Revit realizes the integration of building heat information and BIM. It can provide corresponding individual thermal comfort according to the changes of human position, environmental parameters, and human parameters; (3) The second function can provide some feasible suggestions for the furniture layout. Designs with low indexes can help users reduce energy consumption to some degree. (4) The recorded varying data of relevant parameters of individual thermal comfort can be recorded to provide a basis for future research.
The deficiencies existing in the research process of this paper are as follows: (1) In the artificial neural network model, only four parameters about personal differences are not taken into account, without considering more parameters; (2) The accuracy of the model was only compared with that of the traditional PMV model, instead of comparing with individual comfort evaluation model from other researchers due to data limitations. (3) This paper failed to provide energy values to maintain the ideal thermal comfort level provided by different schemes. Users are more likely to choose a greener scheme if know the amount of electricity they need to consume or the cost they need to pay in a year. (4) The data assumptions of function 2 do not quite match reality.
In the future, Revit could be used to store relevant data of individual thermal comfort in the actual application process. Based on the thermal comfort database designed in this paper, a more accurate calculation model of individual thermal comfort can be further developed by using data analysis technology.
Author Contributions
Conceptualization, G.M. and Y.L.; Methodology, Y.L.; Formal Analysis, Y.L. and G.M.; Writing—Original Draft Preparation, Y.L.; Writing Review and Editing, S.S. and G.M.; Supervision, G.M.; Funding Acquisition, G.M.
Funding
This research was funded by the National Natural Science Foundation of China (grant number 71671128).
Acknowledgments
The authors wish to acknowledge the supports from the responders of the questionnaires.
Conflicts of Interest
The authors declare no conflict of interest.
Nomenclature
| Symbols | Meaning | unit |
| C | Personal thermal comfort | none |
| M | Human metabolic rate | W/m2 |
| H | The heat produced by metabolism of skin unit area | W/m2 |
| W | Mechanical work done by the human body | |
| P0 | The pressure of water vapor in the air around body | Pa |
| ta | The temperature of the air around the human body | °C |
| tr | The average radiant temperature of a wall in a room | °C |
| fcl | The ratio of surface area of a garment to that of a naked body | (m2 °C)/W, 1clo = 0.155 (m2·°C)/W |
| tcl | Clothing surface temperature | °C |
| hc | Surface heat transfer coefficient | (m2·°C)/W |
| V | The velocity of surrounding air of human body | m/s |
| Icl | Clothing thermal resistance | (m2·°C)/W |
| φ | Relative humidity | none |
| A | The age of human | year |
| G | The gender of human | none |
| H’ | The height of human | cm |
| W’ | The weight of human | kg |
| d | The distance between the position of the human three dimensional space and the refrigeration (heat) equipment | m |
| S1 | S1 is equal to investigated value minus predicted value predicted by the ANN model. | none |
| S2 | S2 is equal to investigated value minus predicted value predicted by the PMV model. | none |
| C’ | C’ represents the ideal comfort, the value of which is 0 | none |
References
- World Energy Council. World Energy Resources 2013 Survey. 2013. Available online: http://www.worldenergy.org (accessed on 05 August 2018).
- U.S. Department of Energy. Buildings Energy Data Book. 2012. Available online: http://buildingsdatabook.eren.doe.gov/DataBooks.aspx (accessed on 15 August 2018).
- Jin, W.J.; Feng, Y.; Zhou, N.; Zhong, X. A Household Electricity Consumption Algorithm with Upper Limit. In Proceedings of the 2014 International Conference on Wireless Communication and Sensor Network, Wuhan, China, 13–14 December 2014; WCSN 2014 Organizing Committee: Beijing, China, 2014; pp. 431–434. [Google Scholar] [CrossRef]
- Ding, Y.; Fu, Q.; Tian, Z.; Li, M.; Zhu, N. Influence of indoor design air parameters on energy consumption of heating and air conditioning. Energy Build. 2013, 56, 78–84. [Google Scholar] [CrossRef]
- Fanger, P. Thermal comfort. Analysis and Applications in Environmental Engineering; Danish Technical Press: Copenhagen, Denmark, 1970; Available online: https://www.researchgate.net/publication/35388098_Thermal_Comfort_Analysis_and_Applications_in_Environment_Engeering (accessed on 20 October 2018).
- ISO. ISO 7730:2005, Ergonomics of the Thermal Environment Analytical Determination and Interpretation of Thermal Comfort Using Calculation of the PMV and PPD Indices and Local Thermal Comfort Criteria; International Standard Organization: Geneva, Switzerland, 2005; Available online: https://www.researchgate.net/publication/306013139_Ergonomics_of_the_thermal_environment_Determination_of_metabolic_rate (accessed on 10 May 2019).
- ANSI/ASHRAE. ANSI/ASHRAE 55–2013: Thermal Environmental Conditions for Human Occupancy, American Society of Heating; Refrigerating and Air Conditioning Engineers: Atlanta, GA, USA, 2013. [Google Scholar]
- Sharma, A.; Tiwari, R. Evaluation of data for developing an adaptive model of thermal comfort and preference. Environmentalist 2007, 27, 73–81. [Google Scholar] [CrossRef]
- Nicol, J.F.; Humphreys, M.A. Adaptive thermal comfort and sustainable thermal standards for buildings. Energy Build. 2002, 34, 563–572. [Google Scholar] [CrossRef]
- Van Hoof, J. Forty years of Fanger’s model of thermal comfort: Comfort for all? Indoor Air 2008, 18, 182–201. [Google Scholar] [CrossRef] [PubMed]
- Auffenberg, F.; Stein, S.; Rogers, A. A personalised thermal comfort model using a Bayesian Network. IJCAI 2015, 2015, 2547–2553. [Google Scholar] [CrossRef]
- Alfano, F.R.D.A.; Palella, B.I.; Riccio, G. The role of measurement accuracy on the thermal environment assessment by means of PMV index. Build. Environ. 2011, 46, 1361–1369. [Google Scholar] [CrossRef]
- Von Grabe, J.; Winter, S. The correlation between PMV and dissatisfaction on the basis of the ASHRAE and the McIntyre scale—Towards an improved concept of dissatisfaction. Indoor Built Environ. 2008, 17, 103–215. [Google Scholar] [CrossRef]
- Liu, W.; Lian, Z.; Zhao, B. A neural network evaluation model for individual thermal comfort. Energy Build. 2007, 39, 1115–1122. [Google Scholar] [CrossRef]
- Kim, J.; Zhou, Y.; Schiavon, S.; Raftery, P.; Brager, G. Personal comfort models: predicting individuals’ thermal preference using occupant heating and cooling behavior and machine learning. Build. Environ. 2018, 129, 96–106. [Google Scholar] [CrossRef]
- Von Grabe, J. Potential of artificial neural networks to predict thermal sensation votes. Appl. Energy. 2016, 161, 412–424. [Google Scholar] [CrossRef]
- De Dear, R. Macquarie. University’s ASHRAE RP-884 Adaptive Model Project–Data Downloader. 2012. Available online: https://sydney.edu.au/architecture/staff/homepage/richard_de_dear/ashrae_rp-884.shtml (accessed on 10 May 2019).
- Farhan, A.A.; Pattipati, K.; Wang, B.; Luh, P. Predicting individual thermal comfort using machine learning algorithms. In Proceedings of the 2015 IEEE International Conference on Automation Science and Engineering (CASE), Gothenburg, Sweden, 24–28 August 2015; pp. 708–713. [Google Scholar] [CrossRef]
- Choi, J.H.; Yeom, D. Study of data driven thermal sensation prediction model as a function of local body skin temperatures in a built environment. Build. Environ. 2017, 121, 130–147. [Google Scholar] [CrossRef]
- Lee, S.; Bilionis, I.; Karava, P.; Tzempelikos, A. A Bayesian approach for probabilistic classification and inference of occupant thermal preferences in office buildings. Build. Environ. 2017, 118, 323–343. [Google Scholar] [CrossRef]
- Chaudhuri, T.; Zhai, D.; Soh, Y.C.; Li, H.; Xie, L. Thermal comfort prediction using normalized skin temperature in a uniform built environment. Energy Build. 2018, 159, 426–440. [Google Scholar] [CrossRef]
- Marzouk, M.; Abdelaty, A. Monitoring thermal comfort in subways using building information modeling. Energy Build. 2014, 252–257. [Google Scholar] [CrossRef]
- Natephra, W.; Motamedi, A.; Yabuki, N.; Fukuda, T.; Michikawa, T. Building Envelope Thermal Performance Analysis using BIM Based 4D Thermal Information Visualization. In Proceedings of the International Conference on Computing in Civil and Building Engineering, Osaka, Japan, 6–8 July 2016. [Google Scholar]
- Natephra, W.; Motamedi, A.; Yabuki, N.; Fukuda, T. Integrating 4D thermal information with BIM for building envelope thermal performance analysis and thermal comfort evaluation in naturally ventilated environments. Build. Environ. 2017, 124, 194–208. [Google Scholar] [CrossRef]
- Nielsen, R.H. Theroy of the Back Propagation Neural Network Proceedings of the IJCNN; IEEE: Piscataway, NJ, USA, 2002. [Google Scholar] [CrossRef]
- ASHRAEASHRAE Fundamentals 2001. Thermal Comfort American Society of Heating; Refrigerating and Air Conditioning Engineers: Atlanta, GA, USA, 2001. [Google Scholar]
- Toftum, J. Human response to combined indoor environment exposures. Energy Build. 2002, 34, 601–606. [Google Scholar] [CrossRef]
- McIntyre, D.A. Indoor Climate; Applied Science Publishers Ltd.: London, UK, 1980. [Google Scholar]
- An, S.K.; Domina, T. Thermal Comfort Difference on Gender under Military Garment System Using Thermal Manikin. AATCC J. Res 2015, 2, 1–5. [Google Scholar] [CrossRef]
- Karjalainen, S. Thermal comfort and gender: A literature review. Indoor Air 2012, 22, 96–109. [Google Scholar] [CrossRef] [PubMed]
- Taylor, N.A.S.; Allsopp, N.K.; Parkes, D.G. Preferred room temperature of young vs. aged males: The influence of thermal sensation, thermal comfort, and affect. J. Gerontol. Ser. A Biol. Sci. Med Sci. 1995, 50, 216–219. [Google Scholar] [CrossRef]
- MATLAB. Available online: https://www.mathworks.com/ (accessed on 3 June 2019).
- Revit. Available online: https://www.autodesk.com.cn/products/revit/overview (accessed on 3 June 2019).
- NET. Related Language Programming. Available online: https://linux.softpedia.com/downloadTag/programming%20language (accessed on 3 June 2019).
- Sinha, S.; Sawhney, A.; Borrmann, A.; Ritter, F. Extracting information from building information models for energy code compliance of building envelope. In Proceedings of the RICS COBRA Conference, New Delhi, India, 10–12 September 2013; Available online: http://mediatum.ub.tum.de/node?id=1164681 (accessed on 22 June 2019).
- OLEDB. Available online: https://visualstudio.microsoft.com/zh hans/vs/support/ (accessed on 3 June 2019).
- Ahn, K.U.; Kim, Y.J.; Park, C.S.; Kim, I.; Lee, K. BIM interface for full vs. semi automated building energy simulation. Energy Build. 2014, 68, 671–678. [Google Scholar] [CrossRef]
- Shadram, F.; Johansson, T.D.; Lu, W.; Schade, J.; Olofsson, T. An integrated BIM based framework for minimizing embodied energy during building design. Energy Build. 2016, 128, 592–604. [Google Scholar] [CrossRef]
- Gerrish, T.; Ruikar, K.; Cook, M.; Johnson, M.; Phillip, M.; Lowry, C. BIM application to building energy performance visualisation and management Challenges and potential. Energy Build. 2017, 144, 218–228. [Google Scholar] [CrossRef]
- Kim, J.U.; Hadadi, O.A.; Kim, H.; Kim, J. Development of A BIM based maintenance decision making framework for the optimization between energy efficiency and investment costs. Sustainability 2018, 10, 2480. [Google Scholar] [CrossRef]
- Liu, S.; Meng, X.; Tam, C. Building information modeling based building design optimization for sustainability. Energy Build. 2015, 105, 139–153. [Google Scholar] [CrossRef]
- Lee, S.; Tae, S.; Roh, S.; Kim, T. Green template for life cycle assessment of buildings based on building information modeling: Focus on embodied environmental impact. Sustainability 2015, 7, 16498–16512. [Google Scholar] [CrossRef]
- Asl, R.M.; Zarrinmehr, S.; Bergin, M.; Yan, W. BPOpt: A framework for BIM based performance optimization. Energy Build. 2015, 108, 401–412. [Google Scholar] [CrossRef]
© 2019 by the authors. Licensee MDPI, Basel, Switzerland. This article is an open access article distributed under the terms and conditions of the Creative Commons Attribution (CC BY) license (http://creativecommons.org/licenses/by/4.0/).