Article

The Numerical Simulation of the Airflow Distribution and Energy Efficiency in Data Centers with Three Types of Aisle Layout

1
Department of Information Management and Information System, Beijing Institute of Petrochemical Technology, Beijing 102617, China
2
College of Liberal Arts, University of Minnesota Twin Cities, Minneapolis, MN 55455, USA
3
College of Science, Univerisity of Idaho, Moscow, ID 83844, USA
4
Beijing Key Laboratory of Fuels Cleaning and Advanced Catalytic Emission Reduction Technology, College of Chemical Engineering, Beijing Institute of Petrochemical Technology, Beijing 102617, China
*
Authors to whom correspondence should be addressed.
Sustainability 2019, 11(18), 4937; https://doi.org/10.3390/su11184937
Submission received: 27 July 2019 / Revised: 2 September 2019 / Accepted: 5 September 2019 / Published: 10 September 2019
(This article belongs to the Section Energy Sustainability)

Abstract

:
The energy consumption of fast-growing data centers is drawing attentions from not only energy organizations and institutions all over the world, but also charity groups, such as Greenpeace, and research shows that the power consumption of air conditioning makes up a large proportion of the electricity cost in data centers. Therefore, more detailed investigations of air conditioning power consumption are warranted. Three types of airflow distributions with different aisle layouts (the open aisle, the closed cold aisle, and the closed hot aisle) were investigated with Computational Fluid Dynamics (CFD) methods in a typical data center of four rows of racks in this study. To evaluate the results of thermal and bypass phenomenon, the temperature increase index (β) and the energy utilization index (ηr) were used. The simulations show that there is a better trend of the β index and ηr index both closed cold aisle and closed hot aisle compared with free open aisle. Especially with high air flow rate, the β index decreases and the ηr index increases considerably. Moreover, the results prove the closed aisles (both closed cold aisle and closed hot aisle) can not only significantly improve the airflow distribution, but also reduce the mixture of cold and heat flow, and therefore improve energy efficiency. In addition, it proves the design of the closed aisles can meet the increasing density of installations and our simulation method could evaluate the cooling capacity easily.

1. Introduction

A huge amount of energy is consumed by data centers every year to meet large-scale integrated circuit computing, data exchanges, information communication, and data-storage [1]. By the end of 2017, in China, the annual electricity consumption of data center is more than 2% of their total social electricity consumption [2]. The whole electricity consumption of China’s data center reached 120 billion kWh, accounting for 1.8% of the total electricity consumption of the whole society [3]. In addition, data centers in U.S. will reach roughly 140 billion kWh annually by 2020, which is the equivalent of 50 large (500 megawatt) power plants [4].
In recent years, the proportion of the energy consumed by data centers has increased rapidly among the total energy uses. Researchers are now paying more attentions on the improvement of energy saving through adjusting the air conditioning in computer rooms, and focusing on the improvement of the thermal environment and energy efficiency. Many methods were proposed, such as hot and cold closed aisle, efficient floor tiles, optimization of temperature set points, heat and humidification controls, airflow thermal performance, and airflow management [5,6,7,8]. Most of all, airflow distribution and management are important factors for the design of cooling systems, and the reasonable layout not only helps to reduce data center local hot spots, but also improves the overall thermal environment and the utilization rate of cooling capacity. In addition, the analysis and evaluation of air distribution of the data center under different forms can help to optimize the suitable form of airflow arrangement, which is a green and low-carbon development path for the current data center.
Several researchers have studied the thermal management of data centers [8,9,10,11,12]. It is critical to design the air distribution to maintain a high-quality thermal environment in data centers and the optimization of airflow arrangement.
In order to reduce the inhomogeneity of airflow and inlet temperature in data centers, the structure of data centers have been studied, such as cold-closed aisles, partially closed aisles, and hot-closed aisles. For experimental techniques, Sundaralingam et al. [13] evaluated the characteristics of three types of cold aisle framework including open aisle, partially opened aisle, and fully closed aisle using experimental methods. Wang et al. [14] studied the influence of cold aisle partition on air rate and velocity. The exhaust air velocity can meet the demand of national standard, and the air velocity across IT devices is larger in the upper zones to ensure enough cooling capacity under the conditions of cold aisle partition. To achieve the criterion of no hot spots, different designs were suggested with a low pressure drop across servers and small velocity of the air in the cold aisle in data centers [15]. The thermal effects of implementing a cold aisle containment system on an open hot aisle/cold aisle arrangement were quantified under three different cabinet thermal load conditions in [16]. A case study showed that the use of cold channel sealing system can save about 22% of the cooling energy compared with the standard hot channel/cold channel layout. Three types of airflow distribution were tested by Nada et al. [17,18], including free open, semi-enclosed (two sides), and fully-enclosed cold aisle. Enclosed cold aisles improve the cooling efficiency of data centers, especially at high electricity density. For a semi-enclosed cold aisle with a raised floor, the recirculation and bypass of airflow around racks were reduced, and the performance of the cooling of data centers for different configurations were improved with about 18%–20% reduction of RTI and SHI and about 8%–18% increase of RCIHI [19]. Yuan et al. [20] presented the airflow profiles within the enclosed cold aisle. In racks, the design of the enclosed cold aisle could decrease the exhaust air temperatures, and increase the heat transfer and distribute the exhaust air, and the cooling efficiency was improved. Wang et al. [21] presented the effects of various enclosed frameworks on the energy efficiency of a data center. Framework with enclosing cold aisle shows a better distribution of temperature and the best overall performance with 99% RCI.
In order to improve the airflow/temperature distribution into racks, Wang et al. [22] presented a drawer-type rack which can increase the effective hot aisle space and reduce the cold aisle space. For traditional data centers, it is proposed that both hot air and cold air containment can improve the predictability and efficiency of cooling system [23]. Compared to cold-aisle containment, the choice of hot aisle containment can save 43% of energy cost annually, and reduce 15% of PUE annually. Pervila and Kangasharju [24] described the experimental results of the cooling technique of cold aisle containment, and showed the separation of airflow influences the temperatures of servers and could reduce the cooling energy consumption with roughly a fifth.
Existing works [5,8,25,26,27,28,29] have validated that the simulation method is the most common effective method to study air-flow distribution and management of data centers. CFD is a commonly-used software for the simulation of fluid dynamics, analyzing and solving problems that involve fluid flows, such as airflow distribution, temperature distribution, and calculations of thermal energy for specific environments and structures. Abdelmaksoud et al. [30] proposed an improved momentum source model for these perforated surfaces, which can improve the CFD results significantly. Experiments taken out by Fulpagare et al. [31] showed that the transient effect of racks are significant and cannot be ignored using CFD model of three racks in a raised floor data center with cold and hot aisle containment. Ham and Jeong [32] compared the simulation results of the thermal performance for two kinds of uncontained and contained aisles using CFD, which showed better performance of thermal management in both frameworks with enclosed aisles, and a greater energy saving with the contained framework. Lv et al. [33] analyzed and evaluated temperature and velocity distribution in different aisle types through CFD simulation method. The environmental temperatures of fully-enclosed cold aisle are greater than that of fully-enclosed hot aisle. Fully-enclosed cold or hot aisle can decrease the short pass of cold air and improve the cooling efficiency. Schaadt et al. [34] studied the effect of full containment, half containment, and no containment layout for hot aisle and cold aisle on the optimal operating parameters in a data center. Nada et al. [35] simulated the cooling efficiency of an enclosed cold aisle. Zhang et al. [36] proposed and simulated three optimization methods of airflow framework using CFD software, and suggested the enclosed cold aisle not only reduces short pass airflow, but also improves the thermal efficiency. In addition, the heat of the air in both sides of the hot aisle can quickly return and improve greatly the cooling performance, resulting in the 0.5~5 °C decrease in temperature. Demetriou et al. [37] showed a bypass branch installed within the CRAC itself would be a preferred approach.
Although there are many experts who have focused on the influencing factors of energy consumption in data centers, research on the cold and hot aisle closed conditions needs to be further improved, especially taking a representative data center as a paradigm to evaluate the impact between uniformity of airflow and energy cost. Moreover, the effect of various parameters on the airflow model of data centers is comprehensive, and there is a lack of detailed discussion and comparison under different conditions. Therefore, it is necessary to fully and clearly interpret and evaluate the three cases of airflow using mathematical simulation method with a typical model.
Three cases of airflow distribution for a data center with four row racks are presented in this study. The airflow arrangement is tested and analyzed. The comparison of these three cases is discussed on performance indexes, including the β index and the ηr index. The distributions of the airflow framework in a typical data center are studied, and the temperature distribution of environment and racks is presented.

2. Methodology

In this paper, a typical data center with a cooling air supplying system is chosen to be characterized as the simulation model, which is used to evaluate the airflow distribution under different cases. The thermal distribution characteristics are provided, and the better operation conditions are given.

2.1. The Model Framework of Data Center

Figure 1 shows a 3D model framework of the data center with free open aisle, which is used to simulate the airflow and thermal distribution under various operating conditions using Fluent software. Three types of aisle including free open aisle, closed cold aisle, and closed hot aisle are illustrated in Figure 2.
In our research, the 3D model of the analyzed data center is built according to its actual size with physical dimensions 12. 0 m × 10.0 m × 3.2 m (See Table 1 for the dimension parameters). According to the specific size, a corresponding mesh density is established with the Gambit software, which has two rows of standard 2U racks arranged in both sides of the aisle. The cold air is supplied from raised floor plenum through vent tiles by two air conditioners, with the flow rate 14.4–21.6 m3/s and exhausted hot air passing through racks returns along the hot aisles to the air conditioners. The data center contains four rows of racks (No. A, B, C, and D) with Ten R520 2U racks (No. Rack 1, Rack 2, Rack 3, Rack 4, …, Rack 10) are arranged for each, and every rack is equipped with 5 chassis (e.g., marked from bottom to top as A1, A2, A3, A4, and A5 for A row). The servers are Lenovo R520 GT containing two processors each. The total power consumption of the whole data center is 48.0 kW at idle state and 72.0 kW at full utilization state. The data center also contains two unit of computer room air conditioning, and this computer room air conditioning chilled air to 15 °C, and then into the raised floor at a flow rate.
In the process of simulation, the model room is isolated, and the influences of heat transfer outside the room are ignored. Adiabatic wall conditions are chosen for the vertical walls, the ceiling, and the floor according to the real situations. The chassis of the heat source is considered as a black box model, which allows no airflow in the servers. However, the loading chassis generates the exhaust thermal amount for exchanging with the airflow through the heat phase interface. It is proved the heat model processing method is feasible and available from results in references [38,39,40].

2.2. Mathematical Model

For the investigation of the design factors in a data center of small scale, commercial Fluent 6.3 software was used as the simulation tool to perform the airflow distribution simulation [5].
Most researchers consider the flow regime in room-level data center belong to the turbulent mix. The detailed discussion can be found in literatures [25,39,41]. Compared to the k-ω, SST, RSM, and RNG k-ε models, the k-ε turbulent model is used to simulate the flow characteristic, which has better performance and results. The relevant equations have been listed as follows.
Some assumed conditions for simulating process are presented in [42,43,44]: the air is regarded as incompressible fluid with uniform heat transfer interface, ignoring radiation influence, air leakage etc.
The continuity equation is given as follows:
ρ t + · ( ρ u ) = 0
where u is the velocity of phase; ρ is density, kg/m3.
The momentum equation is listed as following:
u t + ( u · ) u = 1 ρ P + v 2 u + g 1 ρ τ t
where g stands for vector of gravitational acceleration, m/s2 [38]; v is the kinematic viscosity, N·s/m2; P is the pressure, N/m2; τt is the xyz component of the viscous stress tensor.
The energy equation is given as follows:
ρ c p [ T t + ( u · ) T ] = k 2 T + S
where T is the temperature, K; cp is the specific capacity, J/g.K; k is the thermal transfer coefficient, m2/s; S is the viscous dissipation rate.
In order to solve the Reynolds stress in the turbulent momentum equations, the standard k-ε model is chosen for simulating the liquid phase. Two of these variants are available in Fluent software. The detailed turbulence model can be found in Reference [5], such as the equations of turbulence models, model constants, boundary conditions, initial conditions, and iteration scheme.

2.3. Calculation Method

Most of thermal metrics were proposed to assess the airflow characteristics and thermal efficiency [42,43], but a few additional summary metrics can instantly indicate whether a facility is working well from a thermal/airflow point of view [10,45]. In this study, two kinds of assessment index were used, namely the β index and the energy utilization index ηr, which refer to the literature [5] for details.
The β Index is proposed to evaluate the temperature rising in local rack [46] and this index could be defined as:
β = T i n T r e f T o u t T i n
where Tin is the mean temperature in the inlet, Tout is the mean temperature in the outlet, Tref is the reference cooling temperature. The β index ranges are between 0 and 1. When the β index value is 0, it illustrates no recirculation of airflow. While the β index value is above 1, it means the phenomenon of self-heating.
In order to meet the utilization energy efficiency of airflow, energy utilization index is corrected and its expression is [47]:
η r = T o u t T r e f T o u t + T i n 2 T r e f
where Tout is the air temperature in the outlet, Tin is the air temperature in the inlet and Tref is the air temperature of the cooling in the rack. In Equation (5), the low ηr shows a bad airflow organization, and has a hot air self-circulation between racks.
Therefore, the β index and ηr index are used to evaluate the airflow distribution and energy efficiency.

2.4. Grid Independent and Model Validation

The mesh generation of geometric models has a great influence on the numerical simulation results [41]. With the increase of the number of grids, not only the performance requirements of computer can be improved, but also the computation time also increase. Therefore, in order to improve the accuracy and efficiency of numerical simulation, finding a suitable mesh generation is the foundation of numerical simulation.
A hybrid mesh technique is used in this study. The grid independence was checked using unstructured grids of hexes and quads with 110,560, 218,144, 327,424, 430,941, and 539,425 computational nodes. The difference of β and ηr in the Rack 1 and Rack 2 with the different grid sizes has a better accuracy within 8% in Table 2. According to the simulation procession, a typical grid with 430,941 nodes including around 405,045 hexes and 86,776 quads, in which the minimum volume 4.252 × 10⁻⁷ m3 and the maximum volume 2.34 × 10⁻³ m3 was used in the present work for the data center.
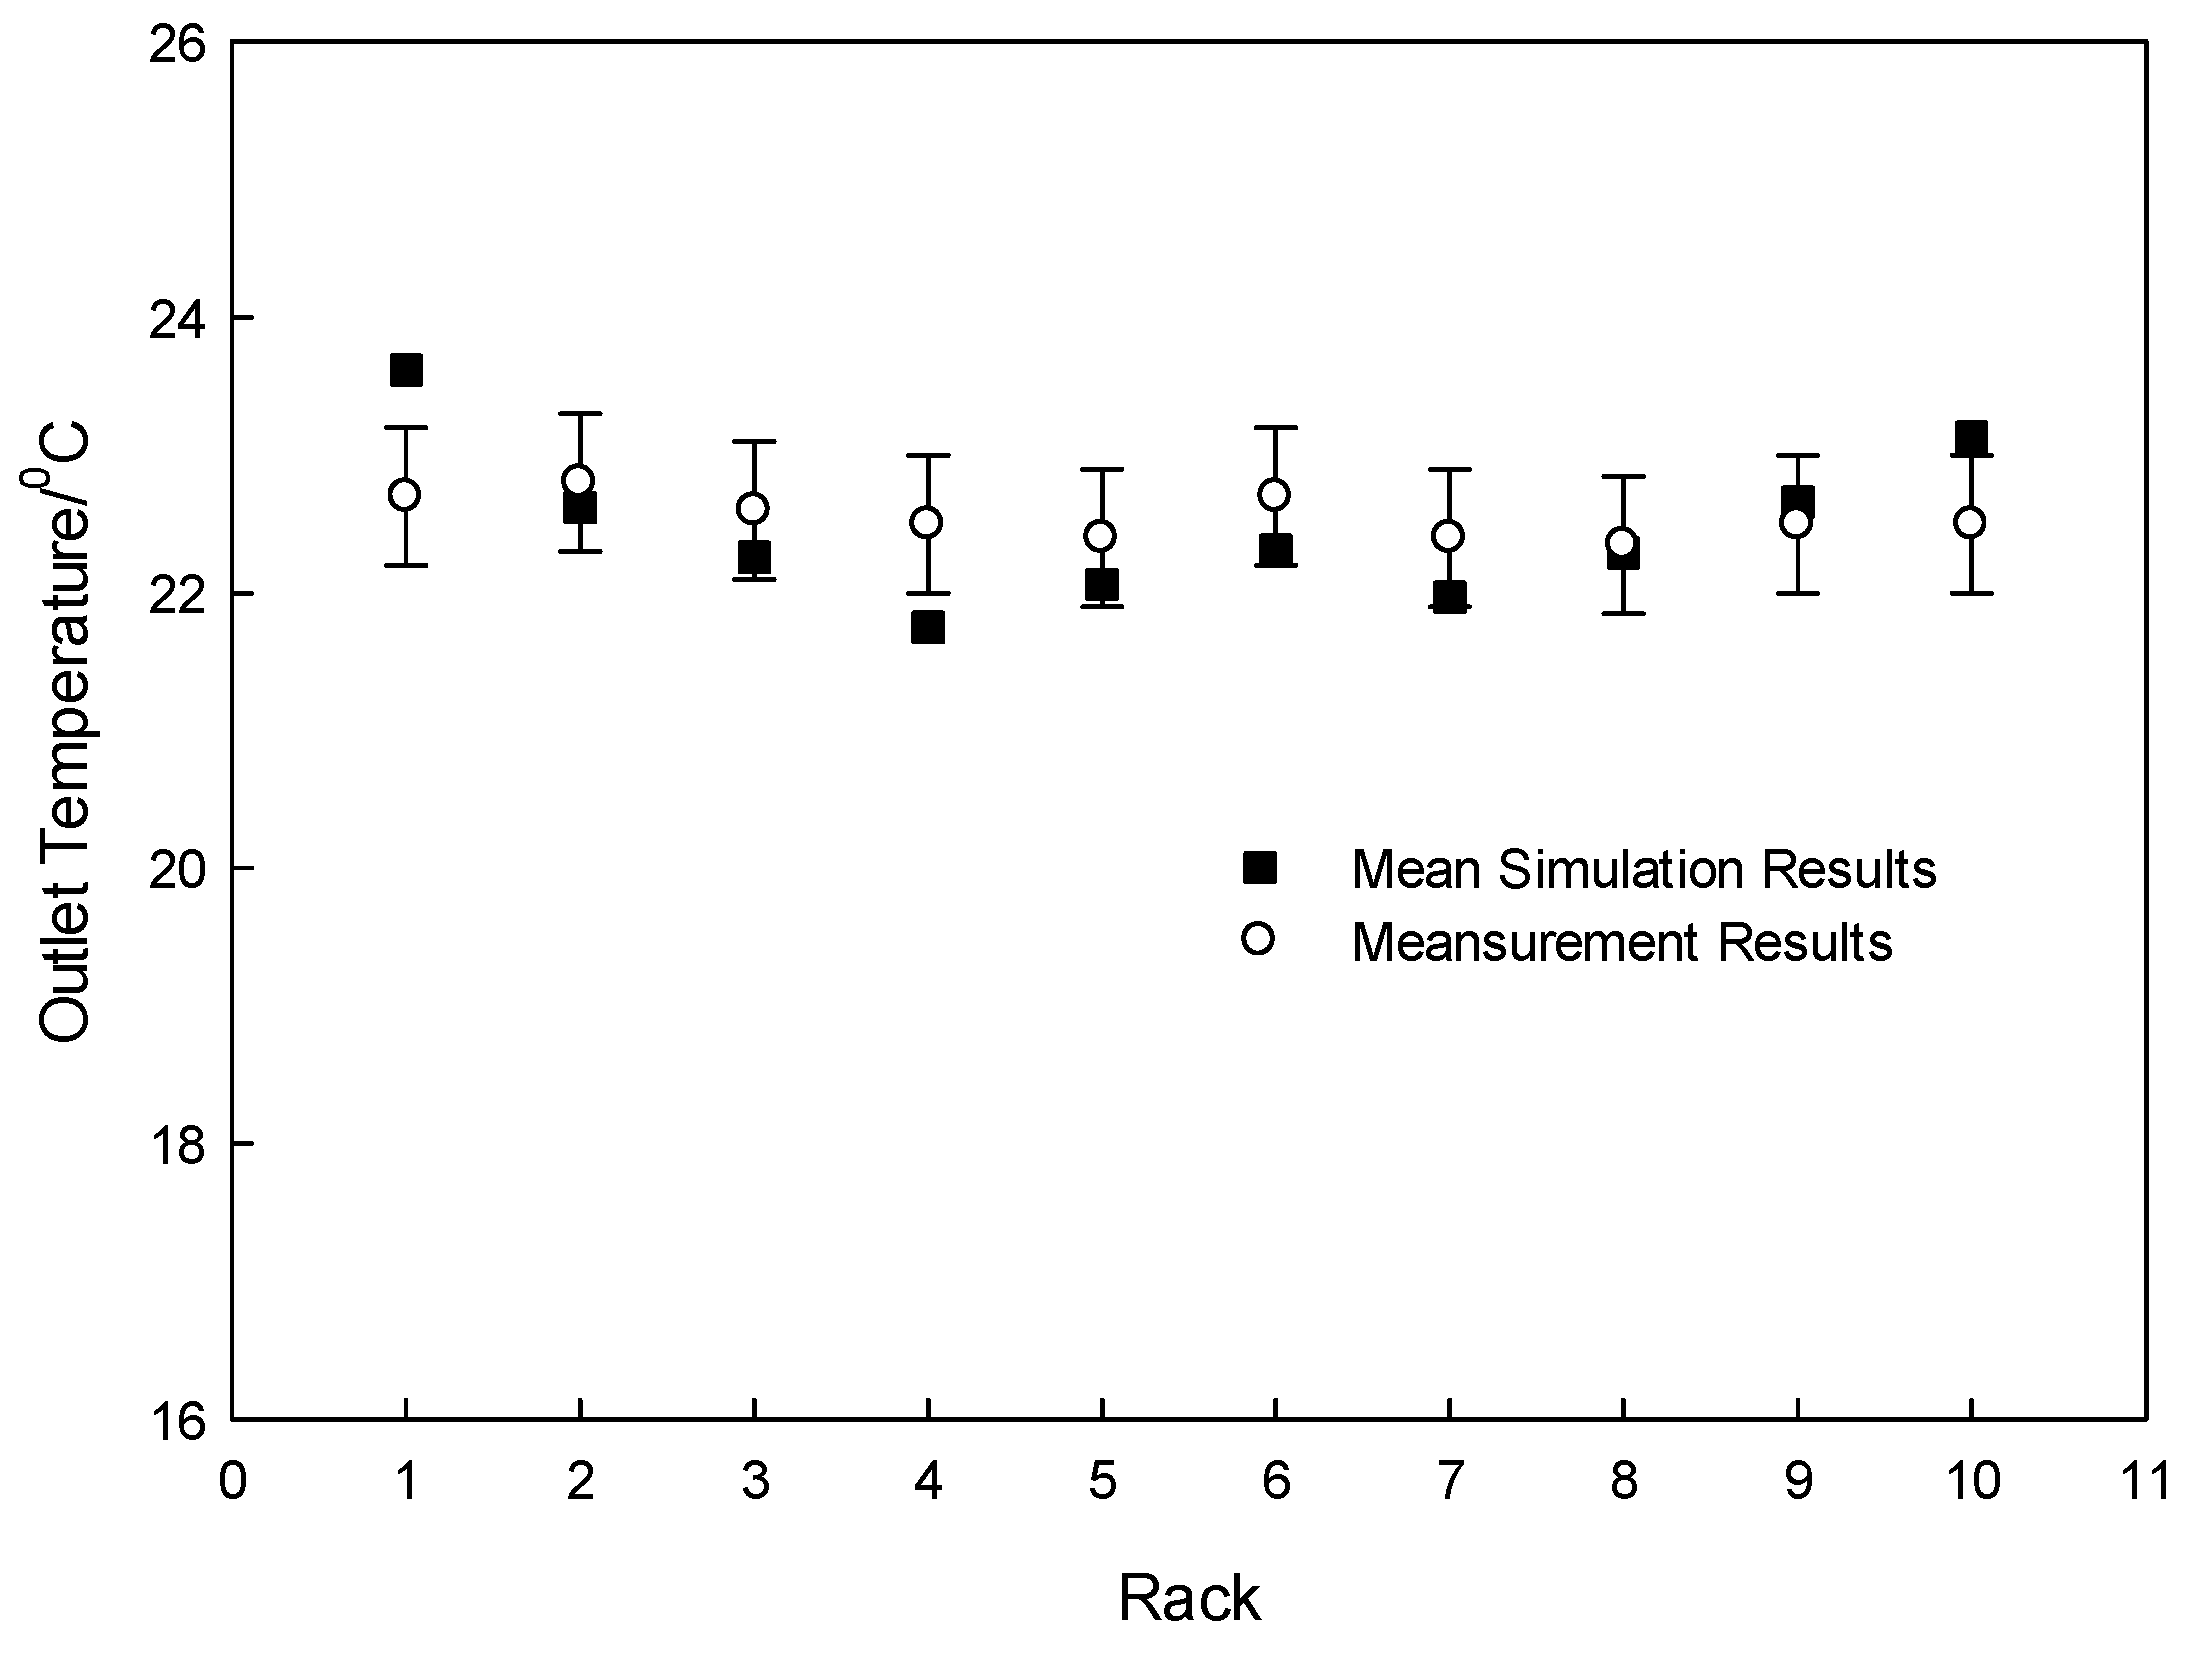
In order to verify the accuracy of grid mesh and CFD model, the exit temperature of Rack1-Rack10 in channel A was measured in an open aisle. In addition, the average simulation temperature at the outlet of A1–A5 from Rack 1 to Rack 10 using on-line thermocouple method (the measuring point is 0.08 m away from the center of each server) was compared according to the simulation results with 430,941 meshing, as shown in Figure 3. From the results, there is a maximum deviation of 0.92 °C temperature difference between the simulation and the measurements, which proved that the model and simulation method are feasible.

3. Results and Discussion

3.1. The Characteristic of Flow and Temperature Distribution

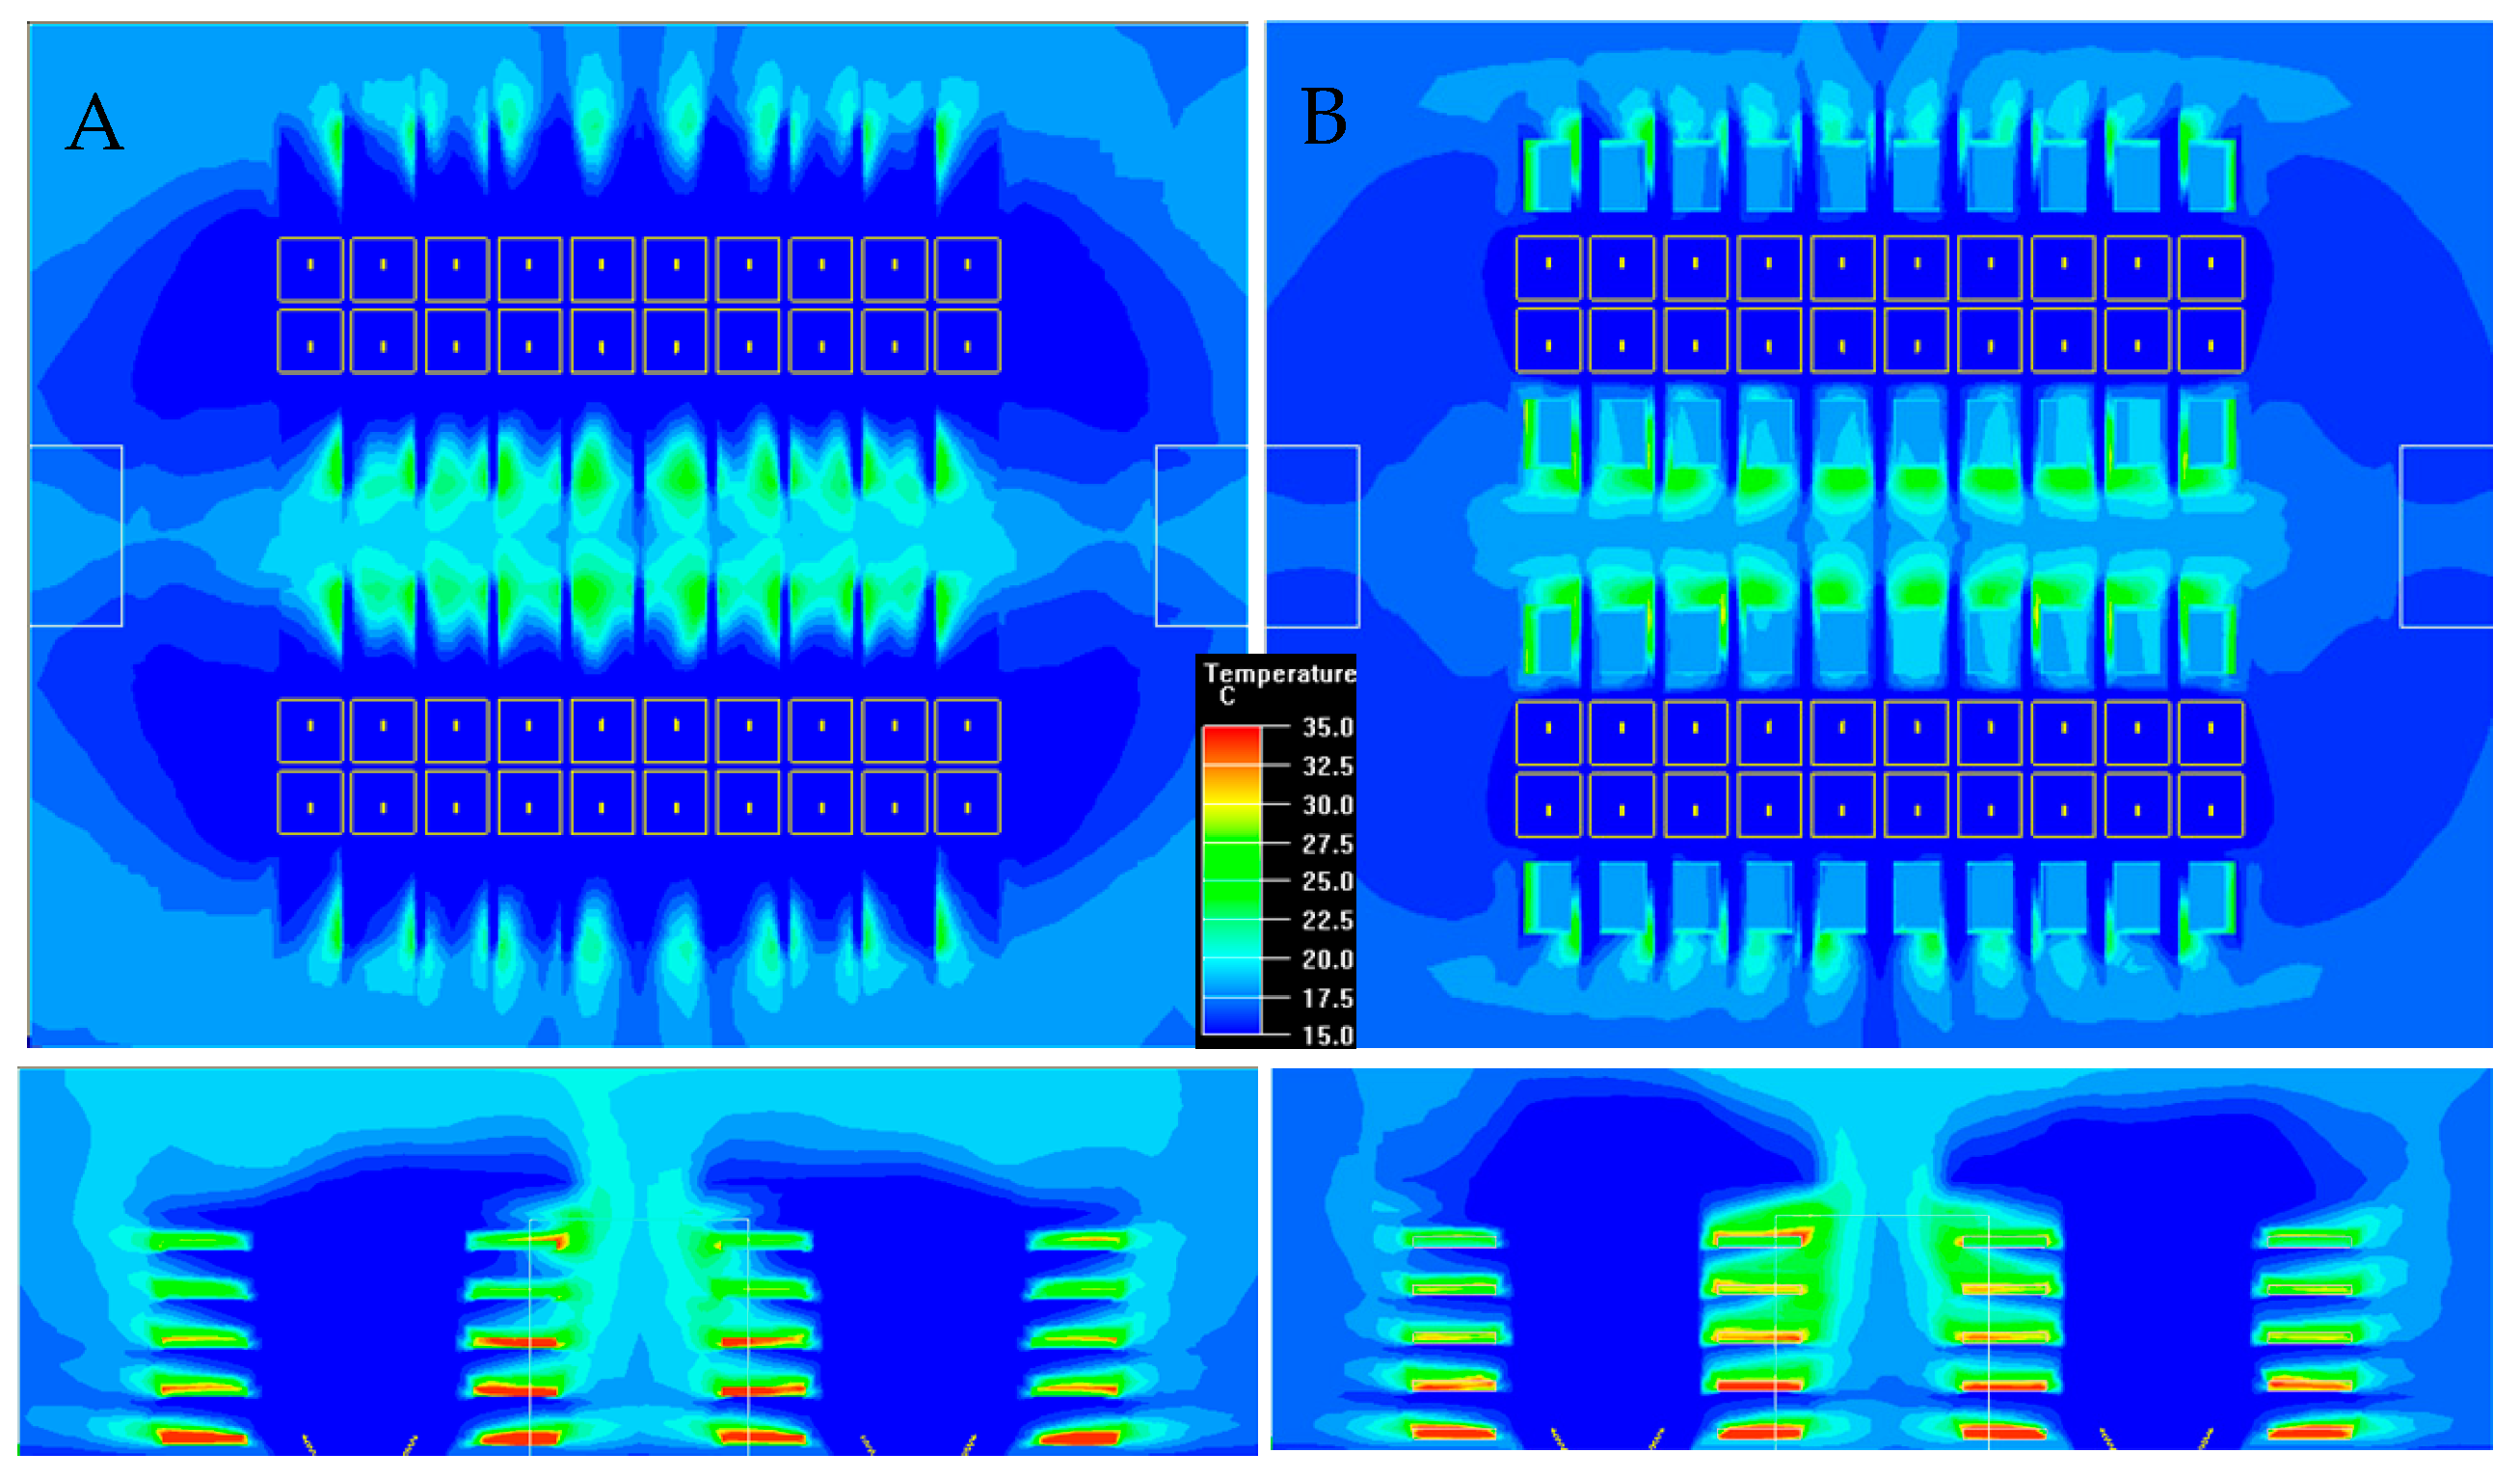
The most important thing in a data center is to ensure the safe and stable operation of equipment [48]. With an open aisle, because airflow causes non-uniformity in air temperature distribution around racks, airflow from the back to the front through the rack is expected. Therefore, to understand the actual conditions of the airflow distribution, heat and temperature distribution of the cabinet under different working conditions, it is necessary to simulate the temperature cloud and the average temperature results of the inlet and outlet surface of the central equipment according to the results of the numerical simulation. The simulation temperature result of free open aisle at XZ plane and YZ plane is shown in Figure 4.
From Figure 4, at the low flow rate, the hot airflow is mainly concentrated in the hot aisle, and the back mixing of airflow is less. The inlet temperature of racks is basically cold air (the blue region around the server is larger). At the high flow rate, the heat flow temperature has a diffusion area, and the mixing temperature is more serious than that of the cold current, which results in the inlet temperature has a tendency to increase.
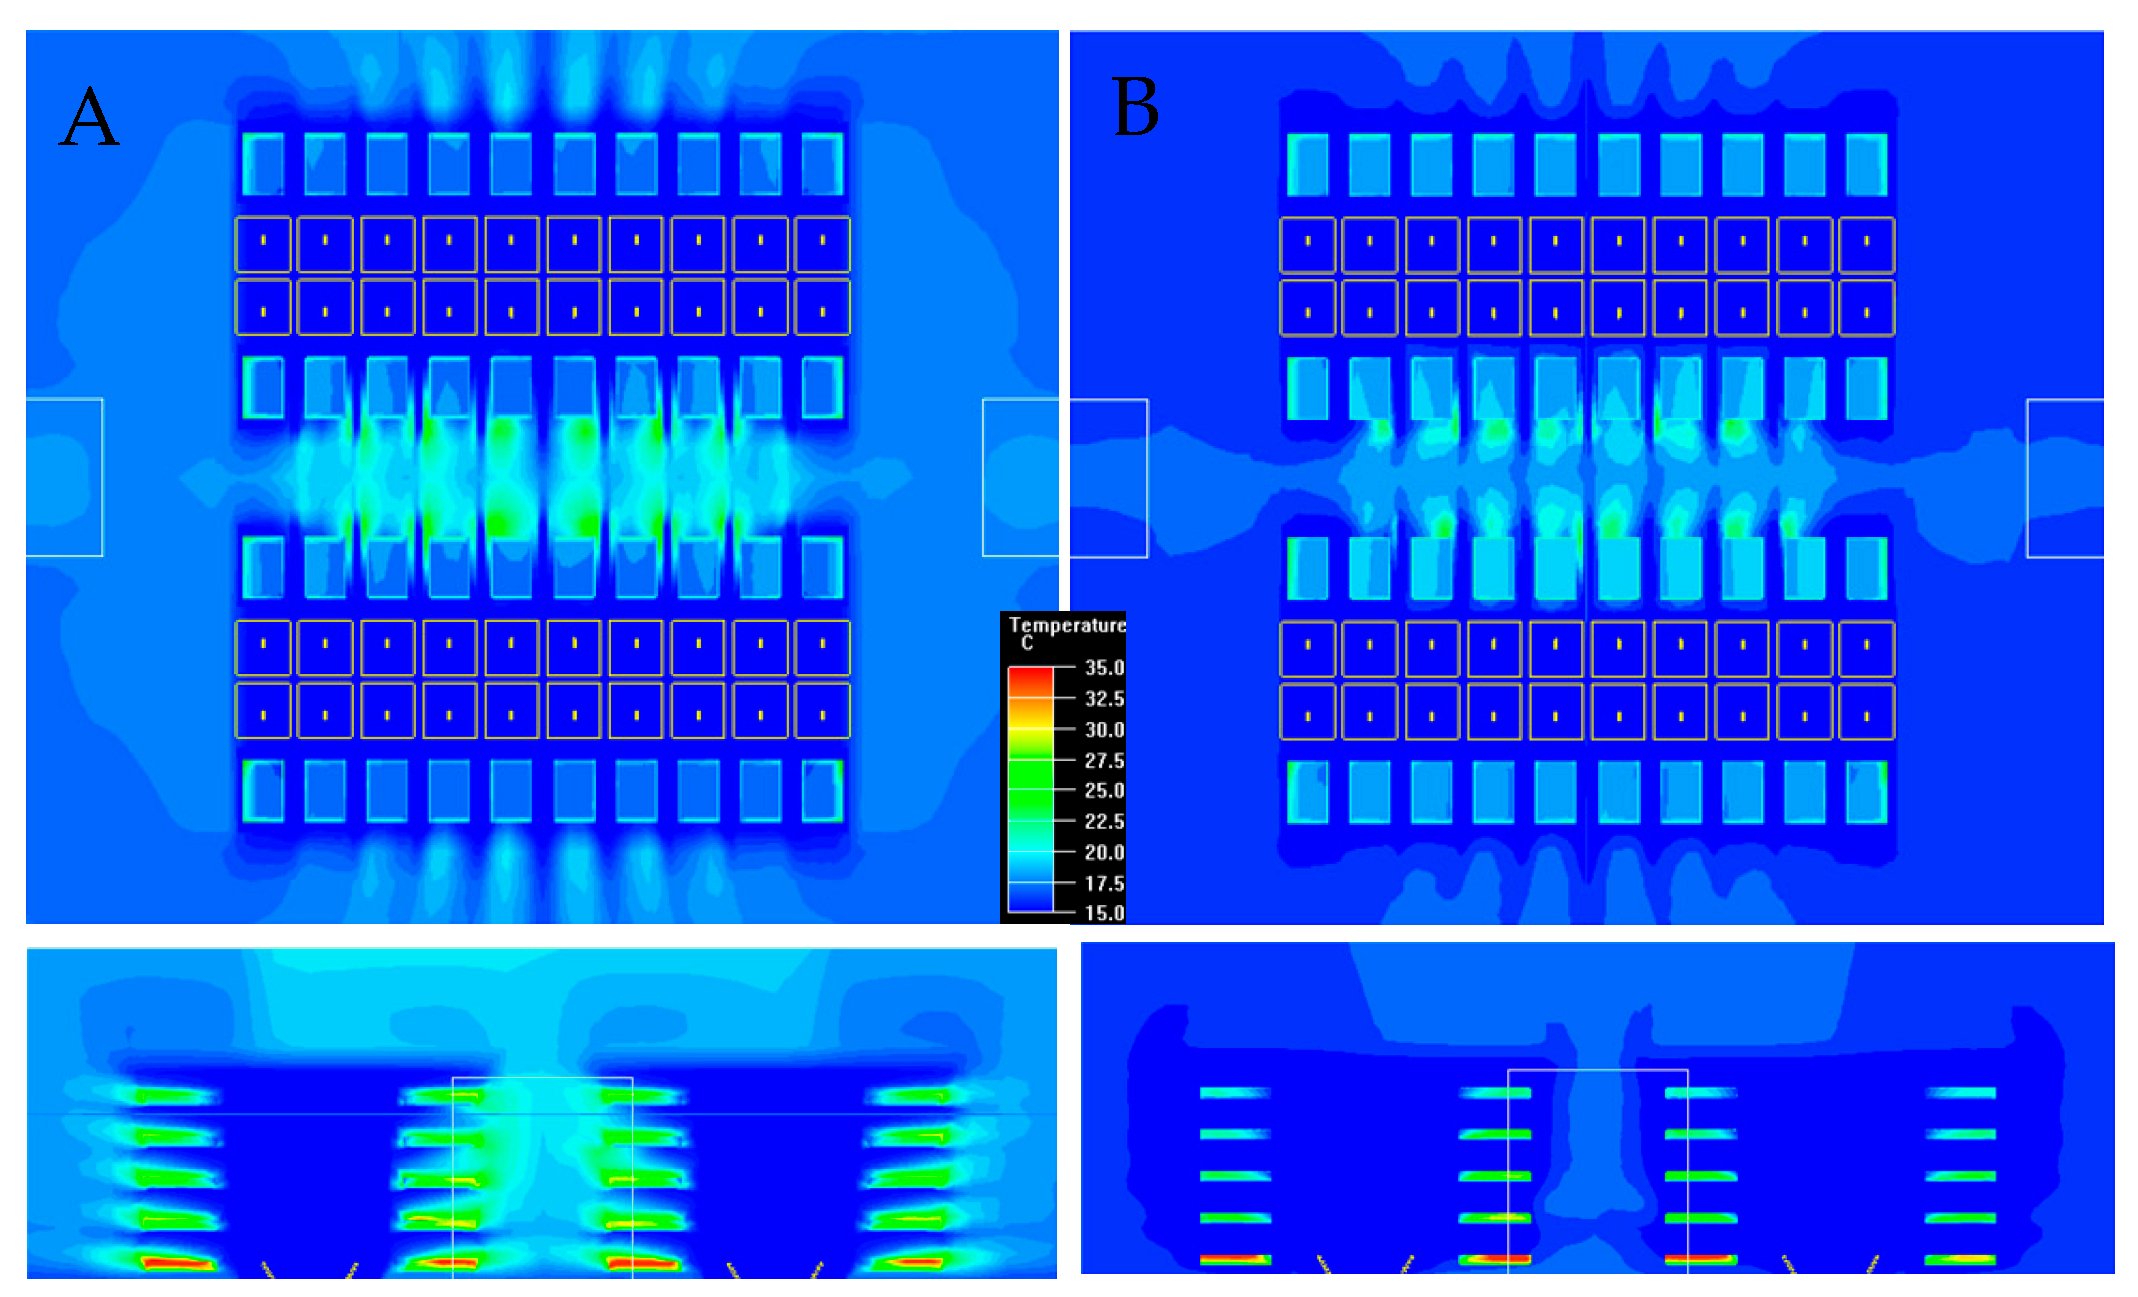
In order to diminish the heterogeneity of airflow and inlet temperature, some new techniques have been widely used in data centers [49]. Two solutions are used to solve the distribution of airflow and temperature, which are the closed cold aisle and closed hot aisle. The simulation temperature result of the closed cold aisle at XZ plane and YZ plane is shown in Figure 5. From Figure 5, it shows that either at the low flow rate or the high flow rate, the cold airflow mainly concentrated in the cold aisle, and the back mixing of airflow is almost none. The inlet temperature of racks is basically cold air (the blue region around the server), and the heat flow is completely separated from the rack, and the mixture of cold and heat flows hardly occurs.
The other methods to solve the problem is the enclosed air pass or the separated air pass on the data center. Figure 6 shows the temperature distribution and flow vector for the three type of aisles. According to the results of the calculated data, the outlet temperature of the servers is not more than 50 °C, and the temperature range is acceptable. Through the analysis of the simulated temperature results of each row, it can be found that the temperature of the lowest server at each rack is the highest, closed to 50 °C, other severs almost have a uniform temperature distribution. It also shows that the servers at the closed hot aisle have a high temperature than other type aisles.
For example, Figure 6B,C, the airflow line drawing from the numerical simulation results can clearly show that the airflow distribution is reasonable. The cold airflow from the floor grid comes into the cabinet to take away the heat from severs at rack, then back from the upper space of the room, and finally back to the air conditioning unit. The flow pattern of the airflow is uniform and the temperature distribution is reasonable. The streamline of the cold airflow is clear, and there is no mismatch between cold and hot air.

3.2. The Energy Efficiency

Non-uniform airflow in open aisles can be reflected in energy efficiency problems. Figure 7 shows the evaluation of energy efficiency, at the low flow rate, the β index is around 0.5, which indicates there is a little air mixture between hot flow and cold flow. Meanwhile, the ηr is between 1.4 and 1.6. Therefore, there is a minimum β Index and a maximum ηr index, namely there is a better and more uniform distribution for airflow and temperature. At the high flow rate, the β value is above 1, which means the circulation of self-heating; the ηr index is closed to 1.0, which shows the circulation of the exhaust air among racks and reflects the local hot spot at racks.
For the closed aisle, the mixing of hot and cold air tends to decrease. Figure 8 shows the estimation of airflow distribution and energy efficiency. Either at low flow rate or high flow rate, the β index and the ηr index have the same tendency. But, at the high flow rate, the two indexes of the middle rack are not very good, and the cold and hot airflow obviously has a mixed phenomenon.
According to the numerical simulation results, the maximum temperature of each severs in the closed cold aisle is given in Figure 9.
First of all, from the overall analysis: The air temperature of each rack was basically stable, the average temperature of the air exit surface of the rack was controlled in the range of 25.0–42 °C. According to the engineering experience, the temperature range was basically in line with the requirements of the temperature control in the industry and the limit requirement of the temperature of 45 °C of the server running equipment. From the analysis and comparison of the spatial dimension of data center, it is found that the average air outlet temperature on two side of rack and the low sever on the rack was relatively high. Especially under the condition of A1 and C1 at row 1 and A1 and C1 at row 10, the local temperature of the location environment was up to 42 °C indicating that this position was a local hot spot. However, compared with free open aisle, the β index and the ηr index of the closed cold aisle show a better trend as seen in Figure 10. Especially for high flow rate, the β index decrease and the ηr index increased significantly, which indicate the distribution of airflow and temperature improved significantly. At the meantime, this proves the closed cold aisle can significantly improve the airflow distribution, reduce the mixture of cold and heat flow, and improve energy efficiency.
In order to evaluate the airflow distribution in date centers, the rack selection at row 1 can fully reflect the flow chart of the machine room. The β index and the ηr index of the closed hot aisle show a better trend as shown in Figure 11. Especially for the high flow rate, the β index decreases and the ηr index increases significantly, which indicates the airflow distribution and temperature distribution improves significantly. In addition, this proves the closed cold aisle can significantly improve the airflow distribution, reduce the mixture of cold and heat flow, and improve energy efficiency. As a result, the design of the closed aisles can successfully support the higher density of servers with more economical application of cold energy.

4. Conclusions

It is particularly important to improve energy efficiency in data centers with the ever-growing volume of big data. Using CFD simulation software, simulation investigations of a confined data room with high density racks have been presented for two kinds of closed aisle and operating conditions in this paper. According to the thermal and bypass phenomena, two kinds of evaluation indexes were used: the β index and the ηr index.
For the free open aisle, the temperature distribution at the low flow rate is more than one at the high flow rate. This point can also be seen from the airflow distribution and efficiency analysis of energy. At the low flow rate, there is some mixture of hot and cold airflow with a low β index and a high ηr index, which shows a better airflow distribution and a more even air distribution. In addition, at the high flow rate, the β value is above 1, which indicates circulation of air and self-heating; the ηr index is close to 1.0, which shows the circulation of the exhaust air among racks and reflects the local hot spot at racks.
For the closed cold aisle, the heat flow is completely separated from the rack, and the mixture of cold and heat flows hardly occurs from temperature cloud, which presented a better airflow distribution and a more uniform air distribution than the free open aisle. The β index and the ηr index have the same tendency with a better value. Moreover, the β index and the ηr index of the closed cold aisle show a better trend, and especially for the high flow rate, the β index decreases and the energy utilization index increases significantly, which indicates the distribution of airflow and temperature improves greatly.
For the closed hot aisle, the outlet temperature of the servers is not more than 50 °C, and almost have a homogeneous temperature distribution. Under the high flow rate, the β index decreases and the ηr index increases meaningfully, resulting in the distribution of the airflow and temperature improves greatly. In addition, the simulation results show the closed hot aisle can considerably improve the airflow distribution, reduce the mixture of cold and heat flow, and improve energy efficiency.
As a result, the closed aisle (closed cold aisle and closed hot aisle) is a better style to improve the airflow distribution, reduce the mixture of cold and heat flow, and increase energy efficiency. In addition, it proves the design of the closed aisles can support the higher density of servers with more economical application of cold energy.

Author Contributions

J.N. and B.J. established the model. J.N., S.N. and X.W. carried out experiment and simulation. J.N. and B.J. prepared the manuscript. X.W. revised manuscript.

Acknowledgments

The work described in this paper is supported by the National Natural Science Foundation of China (91634101), Education Ministry Funding Project for the Development of Liberal Arts and Social Sciences (No.12YJA87001, 15YJAZH052), Beijing Social Science Fund (No.14SHB010), and Beijing the Great Wall Scholar Training Program (No. CIT&TCD20180314). The work is also supported by Development Research Centre of Beijing New Modern Industrial Area.

Conflicts of Interest

The authors declare no conflict of interest.

References

  1. Koomey, J.G. Growth in Data Center Electricity Use 2005 to 2010; Analytics Press: Oakland, CA, USA, 2011. [Google Scholar]
  2. Data Centers Consume 2% of the Country’s Electricity. How to Surrender the “Electric Tiger” in the Cloud? Available online: http://dy.163.com/v2/article/detail/EBFPE4KA05385JEH.html (accessed on 30 March 2019).
  3. The Power Consumption of China’s Data Center Has Exceeded that of the Three Gorges Dam. Available online: https://www.sohu.com/a/207358888_531621 (accessed on 29 November 2017).
  4. Cavanagh, R. A Tectonic Shift in America’s Energy Landscape; Natural Resources Defense Council (NRDC): New York, NY, USA, 2015. [Google Scholar]
  5. Ni, J.; Jin, B.; Zhang, B.; Wang, X. Simulation of airflow distribution and analysis of energy consumption in data centers with a confined space. Sustainability 2017, 9, 664. [Google Scholar] [CrossRef]
  6. Ni, J.; Bai, X. A review of air conditioning energy performance in data centers. Renew. Sustain. Energy Rev. 2017, 67, 625–640. [Google Scholar] [CrossRef]
  7. Wang, W.; Luo, J.; Song, A. Dynamic pricing based energy cost optimization in data center environments. Chin. J. Comput. 2013, 36, 599–612. [Google Scholar] [CrossRef]
  8. Lu, H.; Zhang, Z.; Yang, L. A review on airflow distribution and management in data center. Energy Build. 2018, 179, 264–277. [Google Scholar] [CrossRef]
  9. Alkharabsheh, S.; Fernandes, J.; Gebrehiwot, B.; Agonafer, D.; Ghose, K.; Ortega, A.; Joshi, Y.; Sammakia, B. A Brief overview of recent developments in thermal management in data centers. J. Electron. Packag. 2015, 127, 040801. [Google Scholar] [CrossRef]
  10. Xie, M.X.; Wang, J.; Liu, J.X. Evaluation metrics of thermal management in data centers based on exergy analysis. Appl. Therm. Eng. 2019, 147, 1083–1095. [Google Scholar] [CrossRef]
  11. Athavale, J.; Yoda, M.; Joshi, Y. Comparison of data driven modeling approaches for temperature prediction in data centers. Int. J. Heat Mass Transf. 2019, 135, 1039–1052. [Google Scholar] [CrossRef]
  12. Rong, H.; Zhang, H.; Xiao, S.; Li, C.; Hu, C. Optimizing energy consumption for data centers. Renew. Sustain. Energy Rev. 2016, 58, 674–691. [Google Scholar] [CrossRef]
  13. Sundaralingam, V.; Arghode, V.K.; Joshi, Y.; Phelps, W. Experimental characterization of various cold aisle containment configurations for data Centers. J. Electron. Packag. 2014, 137, 011007. [Google Scholar] [CrossRef]
  14. Wang, N.; Chen, L.; Cai, F.; Deng, P. Experiment and simulation of cold aisle partition impacting on thermal environment of a computer room. Heat. Vent. Air Cond. 2017, 47, 107–112. [Google Scholar]
  15. Gondipalli, S.; Sammakia, B.; Bhopte, S.; Schmidt, R.; Iyengar, M.K.; Murray, B. Optimization of cold aisle isolation designs for a data center with roofs and doors using slits. In Proceedings of the ASME 2009 Interpack Conference Collocated with the ASME 2009 Summer Heat Transfer Conference and the ASME 2009 International Conference on Energy Sustainability, San Francisco, CA, USA, 19–23 July 2009; pp. S174–S175. [Google Scholar]
  16. Muralidharan, B.; Shrivastava, S.K.; Ibrahim, M.; Alkharabsheh, S.A.; Sammakia, B.G. Impact of cold aisle containment on thermal performance of data center. InterPACK 2013, v2. In Proceedings of the ASME 2013 International Technical Conference and Exhibition on Packaging and Integration of Electronic and Photonic Microsystems, Burlingame, CA, USA, 16–18 July 2013. [Google Scholar]
  17. Nada, S.A.; Elfeky, K.E. Experimental investigations of thermal managements solutions in data centers buildings for different arrangements of cold aisles containments. J. Build. Eng. 2016, 5, 41–49. [Google Scholar] [CrossRef]
  18. Nada, S.A.; Said, M.A.; Rady, M.A. CFD investigations of data centers’ thermal performance for different configurations of CRACs units and aisles separation. Alex. Eng. J. 2016, 55, 959–971. [Google Scholar] [CrossRef]
  19. Nada, S.A.; Said, M.A.; Rady, M.A. Numerical investigation and parametric study for thermal and energy management enhancements in data centers’ buildings. Appl. Therm. Eng. 2016, 98, 110–128. [Google Scholar] [CrossRef]
  20. Yuan, X.; Liu, J.; Yang, Y.; Wang, Y.; Yuan, X. Investigation and improvement of air distribution system’s airflow performance in data centers. Procedia Eng. 2017, 205, 2895–2902. [Google Scholar] [CrossRef]
  21. Wang, C.H.; Tsui, Y.Y.; Wang, C.C. On cold-aisle containment of a container data center. Appl. Therm. Eng. 2016, 112, 133–142. [Google Scholar] [CrossRef]
  22. Wang, I.; Tsui, Y.; Wang, C. Improvements of Airflow Distribution in a Container Data Center. Energy Procedia 2015, 75, 1819–1824. [Google Scholar] [CrossRef] [Green Version]
  23. Niemann, J.; Brown, K.; Avelar, V. Impact of Hot and Cold Aisle Containment on Data Center Temperature and Efficiency; White Paper 135; Schneider Electric Data Center Science Center: Omaha, NE, USA, 2011. [Google Scholar]
  24. Pervila, M.; Kangasharju, J. Cold Air Containment. In Proceedings of the 2nd ACM SIGCOMM Workshop on Green Networking (GreenNets ’11), Toronto, ON, Canada, 15–19 August 2011; pp. 7–12. [Google Scholar]
  25. Gao, T.Y.; David, M.; Geer, J.; Schmidt, R.; Sammakia, B. Experimental and numerical dynamic investigation of an energy efficient liquid cooled chiller-less data center test facility. Energy Build. 2015, 91, 83–96. [Google Scholar] [CrossRef]
  26. Cho, J.; Lim, T.; Kim, B.S. Measurements and predictions of the air distribution systems in high compute density (internet) data centers. Energy Build. 2009, 41, 1107–1115. [Google Scholar] [CrossRef]
  27. Zhou, C.; Yang, C.; Wang, C.; Zhang, X. Numerical simulation on a thermal management system for a small data center. Int. J. Heat Mass Transf. 2018, 124, 677–692. [Google Scholar] [CrossRef]
  28. Huang, Z.L.; Dong, K.J.; Sun, Q.; Su, L.; Liu, T.Q. Numerical Simulation and Comparative Analysis of Different Airflow Distributions in Data Centers. Procedia Eng. 2017, 205, 2378–2385. [Google Scholar] [CrossRef]
  29. Hassan, N.M.S.; Khan, M.M.K.; Rasul, M.G. Temperature monitoring and CFD Analysis of Data Centre. Procedia Eng. 2013, 56, 551–559. [Google Scholar] [CrossRef]
  30. Abdelmaksoud, W.A.; Dang, T.Q.; Khalifa, H.E.; Schmidt, R.R. Improved computational fluid dynamics model for open-aisle air-cooled data center simulations. J. Electron. Packag. 2013, 135, 030901-1. [Google Scholar] [CrossRef]
  31. Fulpagare, Y.; Joshi, Y.; Bhargav, A. Transient characterization of data center racks. In Proceedings of the ASME 2016 International Mechanical Engineering Congress and Exposition (IMECE), Phoenix, AZ, USA, 13–17 November 2016. [Google Scholar]
  32. Ham, S.W.; Jeong, J.W. Impact of aisle containment on energy performance of a data center when using an integrated water-side economizer. Appl. Therm. Eng. 2015, 105, 372–384. [Google Scholar] [CrossRef]
  33. Lv, C.; Chen, G.; Liu, Y.; Ye, S. Study on computer room layout and air distribution in small scale data center. Cryogenics 2017, 2017, 61–67. (In Chinese) [Google Scholar]
  34. Schaadt, J.R.H.; Fouladi, K.; Wemhoff, A.P. Load Capacity and thermal efficiency optimization of a research data center using computational modeling. In Proceedings of the ASME 2015 International Technical Conference and Exhibition on Packaging and Integration of Electronic and Photonic Microsystems Collocated with the ASME 2015, International Conference on Nanochannels, Microchannels, and Minichannels, San Francisco, CA, USA, 6–10 July 2015. [Google Scholar]
  35. Nada, S.A.; Elfeky, K.E.; Attia, A.M.A. Experimental investigations of air conditioning solutions in high power density data centers using a scaled physical model. Int. J. Refrig. 2016, 63, 87–99. [Google Scholar] [CrossRef]
  36. Zhang, M.; An, Q.; Long, Z.; Pan, W.; Zhang, H.; Cheng, X. Optimization of airflow organization for a small-scale date center based on the cold aisle closure. Procedia Eng. 2017, 205, 1893–1900. [Google Scholar] [CrossRef]
  37. Demetriou, D.W.; Khalifa, H.E. Optimization of Enclosed Aisle Data Centers Using Bypass Recirculation. J. Electron. Packag. 2012, 134, 020904-1. [Google Scholar] [CrossRef]
  38. Ansys Incorported. ANSYS FLUENT-Solver Release 10.0; Ansys Inc.: Canonsbury, PA, USA, 2005; p. 131. [Google Scholar]
  39. Abanto, J.; Barrero, D.; Reggio, M.; Ozell, B. Airflow modeling in a computer room. Build. Environ. 2004, 39, 1393–1402. [Google Scholar] [CrossRef]
  40. Song, Z. Thermal performace of a contained data center with fan-assisted perforations. Appl. Therm. Eng. 2016, 102, 1175–1184. [Google Scholar] [CrossRef]
  41. Dun, Z.; Qin, Y.; Guan, X. Simulation optimization and evaluation analysis of the data center airflow distribution. Build. Energy Effic. 2015, 43, 27–33. [Google Scholar]
  42. Herrlin, M.K. Rack cooling effectiveness in data centers and telecom central offices: The Rack Cooling Index (RCI). ASHRAE Trans. 2005, 111, 725–731. [Google Scholar]
  43. Herrlin, M.K. Airflow and cooling performance of DC: Two performance metrics. ASHRAE Trans. 2008, 114, 182–187. [Google Scholar]
  44. Sorell, V.; Escalante, S.; Yang, J. Comparison of overhead and underfloor air delivery systems in a data center environment using CFD modeling. ASHRAE Trans. 2005, 111, 756–764. [Google Scholar]
  45. VanGilder, J.; Schmidt, R. Airflow Uniformity through Perforated Tiles in a Raised-Floor Data Center. Paper No. IPACK2005-73375. In Proceedings of the ASME 2005 Pacific Rim Technical Conference and Exhibition on Integration and Packaging of MEMS, NEMS, and Electronic Systems collocated with the ASME 2005 Heat Transfer Summer Conference, San Francisco, CA, USA, 17–22 July 2005. [Google Scholar]
  46. Arghode, V.K.; Kumar, P.; Joshi, Y.; Weiss, T.; Meyer, G. Rack Level Modeling of Air Flow Through Perforated Tile in a Data Center. J. Electron. Packag. 2013, 135, 030902. [Google Scholar] [CrossRef]
  47. Xu, Q. Energy Consumption and Air Distribution Simulation of a Substation Data Room. Master’s Thesis, Zhejiang University, Hangzhou, China, 2015. [Google Scholar]
  48. Seymour, M.J.; Herrlin, M.K. Data center optimization using performance metrics. In Proceedings of the ASME 2015 International Technical Conference and Exhibition on Packaging and Integration of Electronic and Photonic Microsystems, San Francisco, CA, USA, 6–9 July 2015. [Google Scholar]
  49. Beitelmal, A.H. Numerical investigation of data center raised-floor plenum. In Proceedings of the ASME 2015 International Mechanical Engineering Congress and Exposition, Houston, TX, USA, 13–19 November 2015. [Google Scholar]
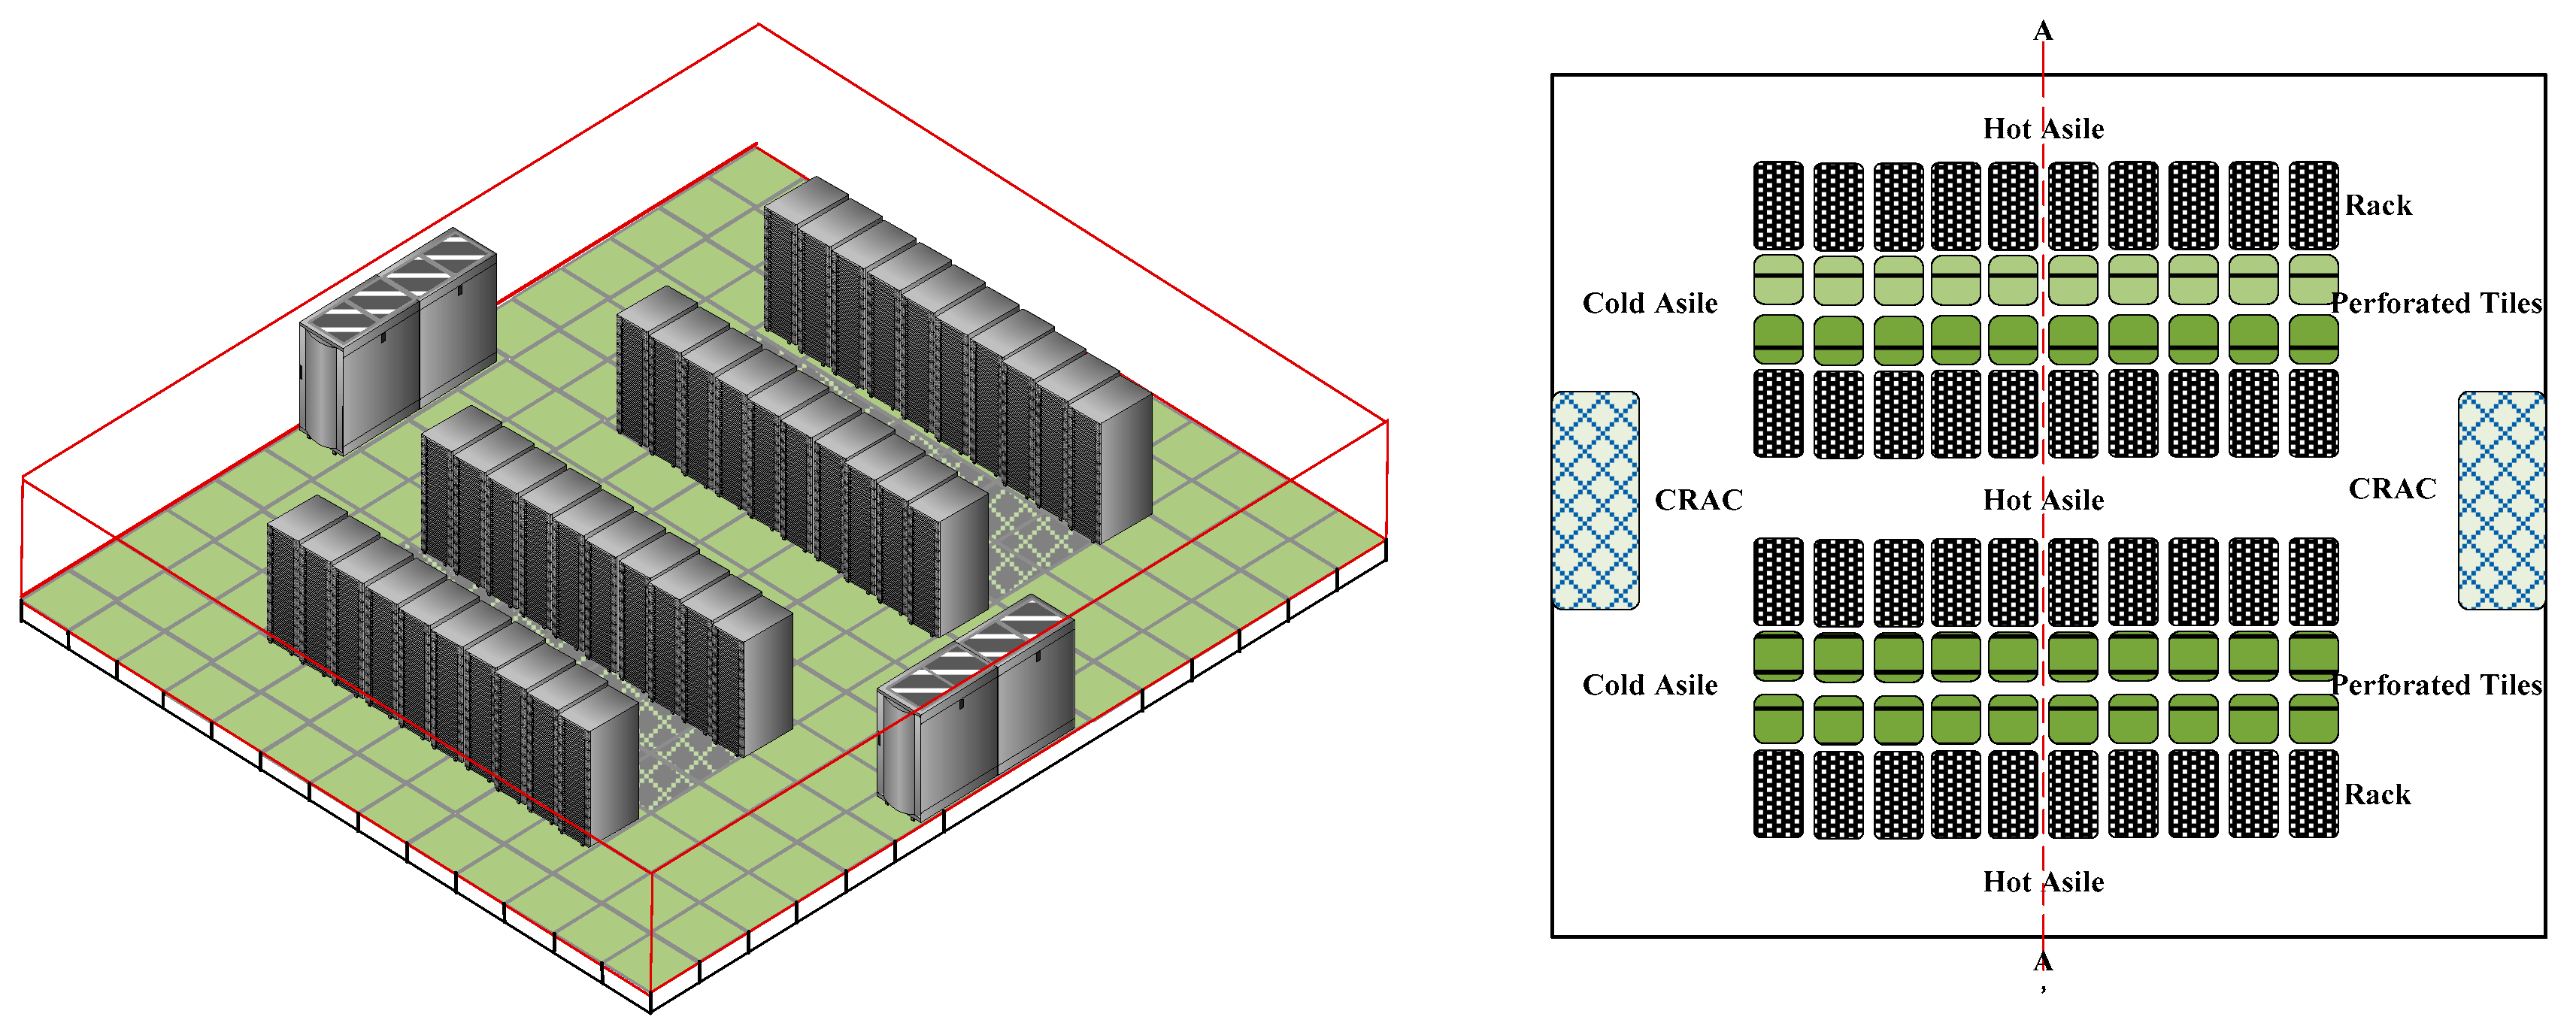
Figure 1. A 3D model framework of the data center with free open aisle.
Sustainability 11 04937 g001
Figure 2. The model of data center with free open aisle, closed cold aisle and closed hot aisle. (a) Free open aisle; (b) closed cold aisle; (c) closed hot aisle.
Sustainability 11 04937 g002
Figure 3. The temperature comparison between the simulation and the measurements at the outlet of Rack.
Sustainability 11 04937 g003
Figure 4. The airflow and temperature distribution for free open aisle with two gas flow rate. (A) Q = 14.4 m3/s; (B) Q = 21.6 m3/s.
Sustainability 11 04937 g004
Figure 5. The airflow and temperature distribution for closed cold aisle with two gas flow rate. (A) Q = 14.4 m3/s; (B) Q = 21.6 m3/s.
Sustainability 11 04937 g005
Figure 6. The temperature cloud and gas velocity vector with three kinds of closed aisle. (A) open aisle; (B) closed cold aisle; (C) closed hot aisle.
Sustainability 11 04937 g006
Figure 7. The β Index and the ηr index of racks at row 2 for free open aisle with two gas flow rate.
Sustainability 11 04937 g007
Figure 8. The β Index and the ηr index of racks at row 2 for closed cold aisle with two gas flow rate.
Sustainability 11 04937 g008
Figure 9. The maximum temperature distribution of severs in the closed cold aisle.
Sustainability 11 04937 g009
Figure 10. Comparison of the β Index and the ηr index with closed cold aisle and free open aisle at two gas flow rate. (A) Q = 14.4 m3/h; (B) Q = 14.4 m3/h; (C) Q = 21.6 m3/h; (D) Q = 21.6 m3/h.
Sustainability 11 04937 g010
Figure 11. Comparison of the β Index and the energy utilization index with closed hot aisle and free open aisle at two gas flow rate. (A) Q = 14.4 m3/h; (B) Q = 14.4 m3/h; (C) Q = 21.6 m3/h; (D) Q = 21.6 m3/h.
Sustainability 11 04937 g011
Table 1. The model framework size and device parameters.
Length/mWidth/mHeight/m
Simulation of data center12.010.003.20
Chassis0.6830.4480.0875
Air conditioner0.7650.5601.940
Table 2. The influence of grid size on performance indexes.
Mesh (Nodes)Temperature of Wind °CRack 1Rack 2
βηrβηr
110,56017.830.171.750.201.71
218,14417.990.241.600.271.65
327,42418.010.301.610.301.64
430,94117.950.311.620.311.64
539,43517.950.321.600.291.63