Projections and Recommendations for Energy Structure and Industrial Structure Development in China through 2030: A System Dynamics Model

Abstract
1. Introduction
2. Literature Review
3. Methods and Data
3.1. Objectives and Requirements of Modeling
3.2. Brief Introductin to the System Dynamics
3.3. Logical Framework of the E&I-SD Model
3.4. Data Source
4. The E&I-SD Model Description and Validation Test
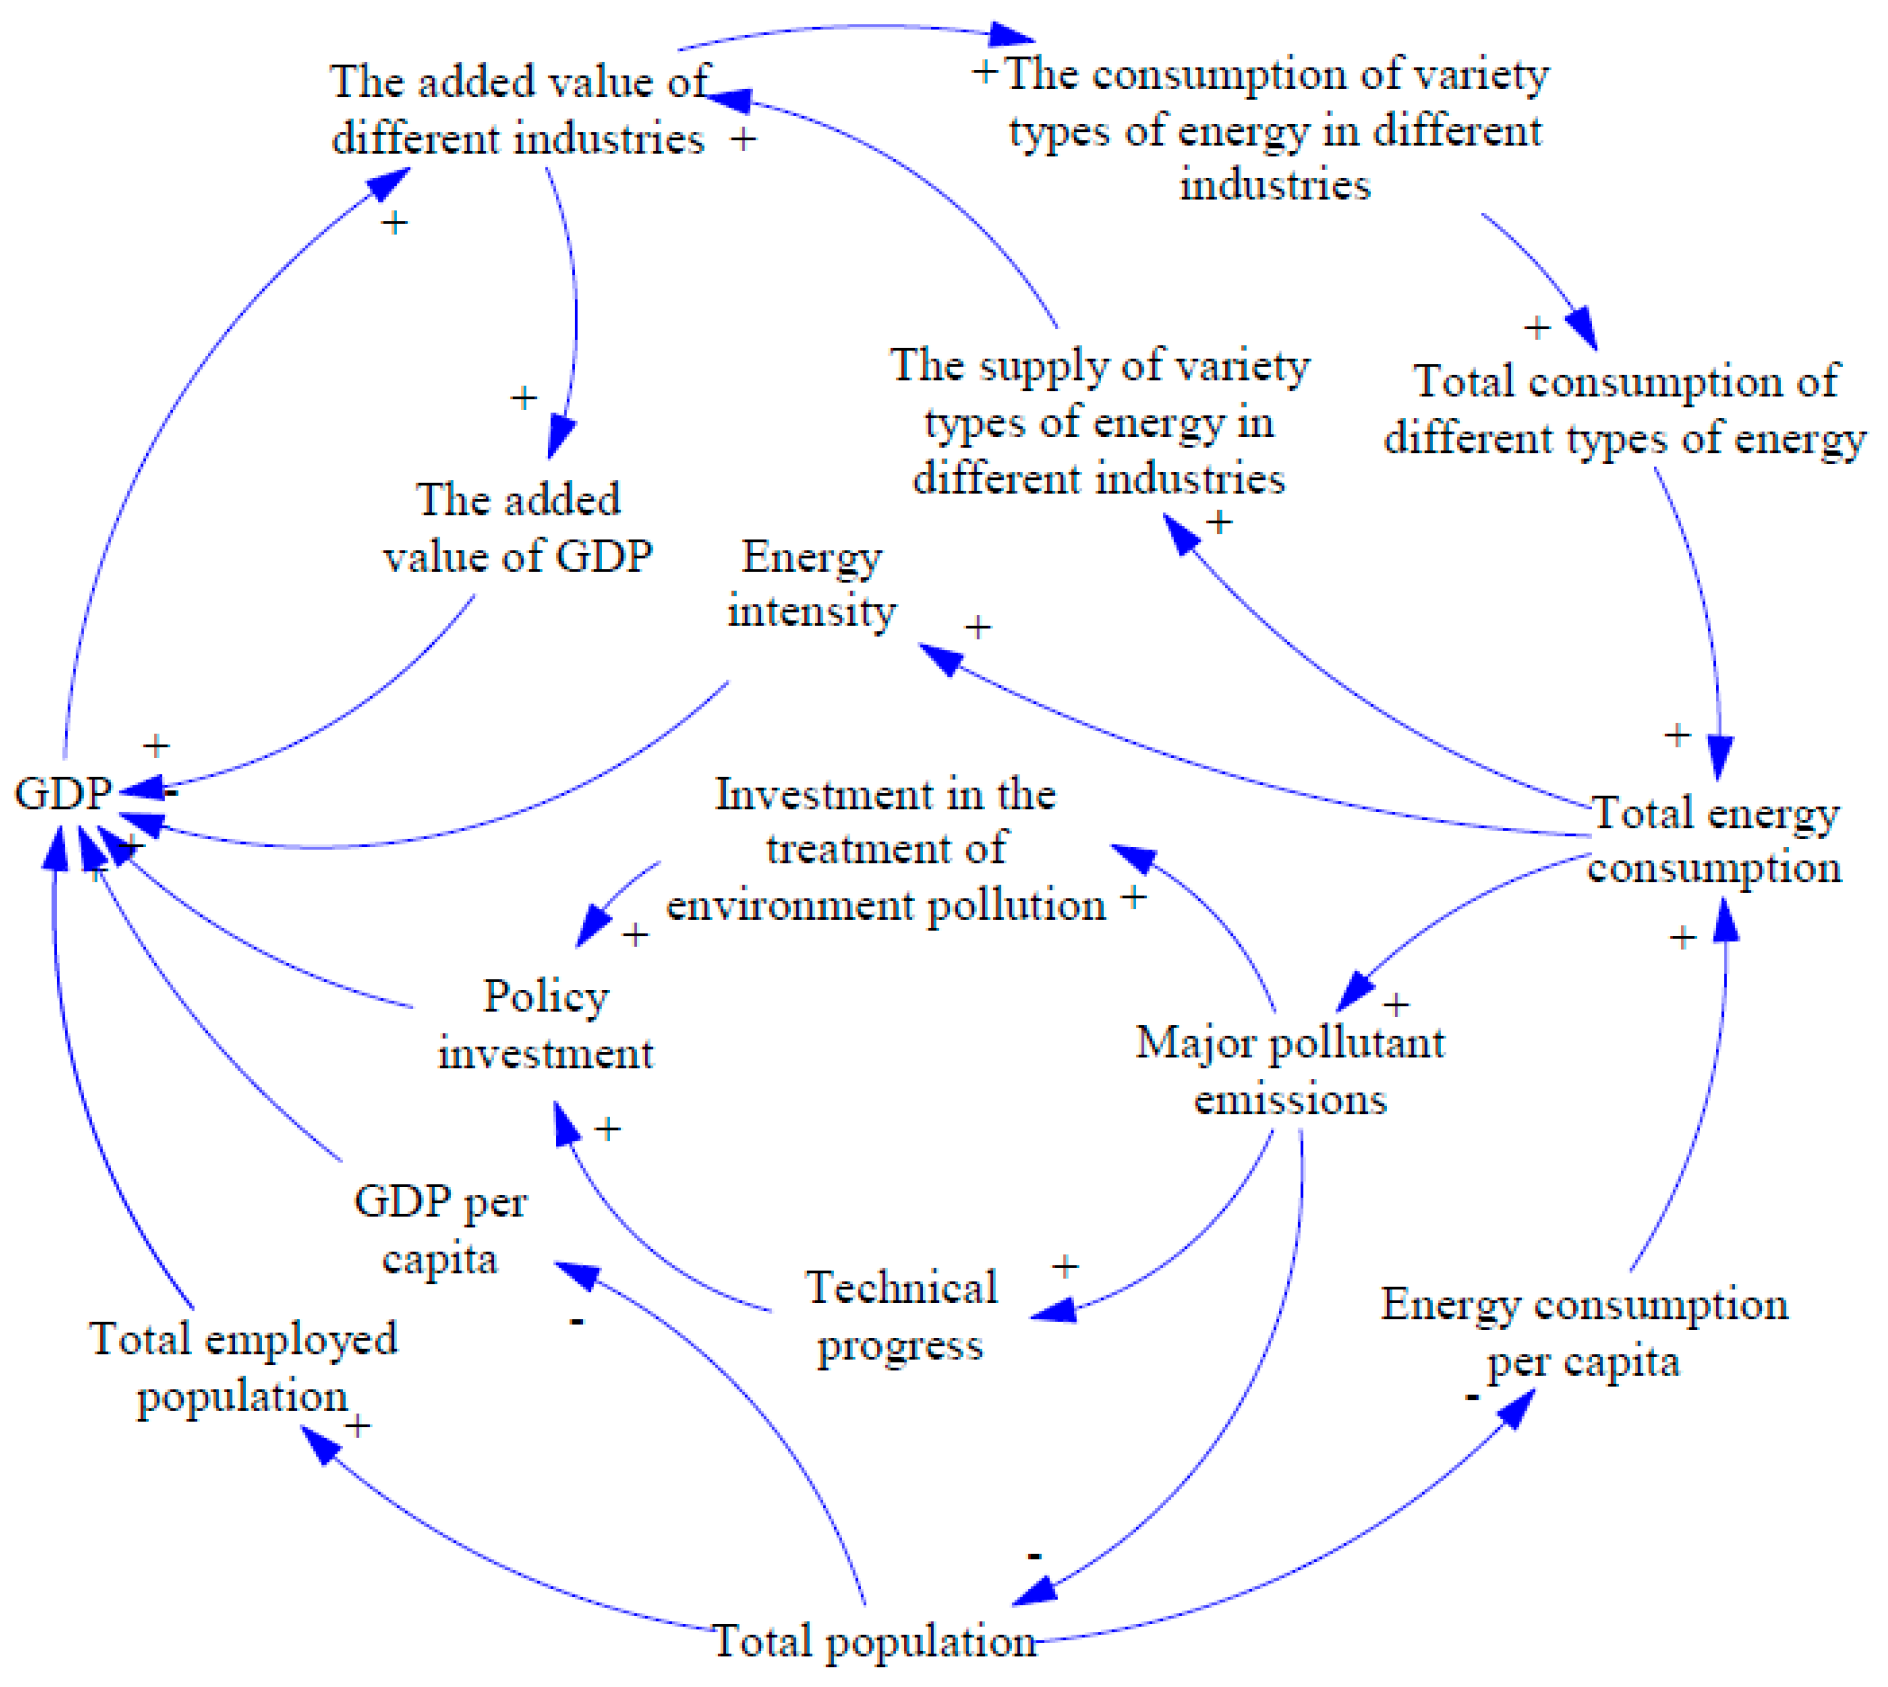
4.1. Causal Loop Framework
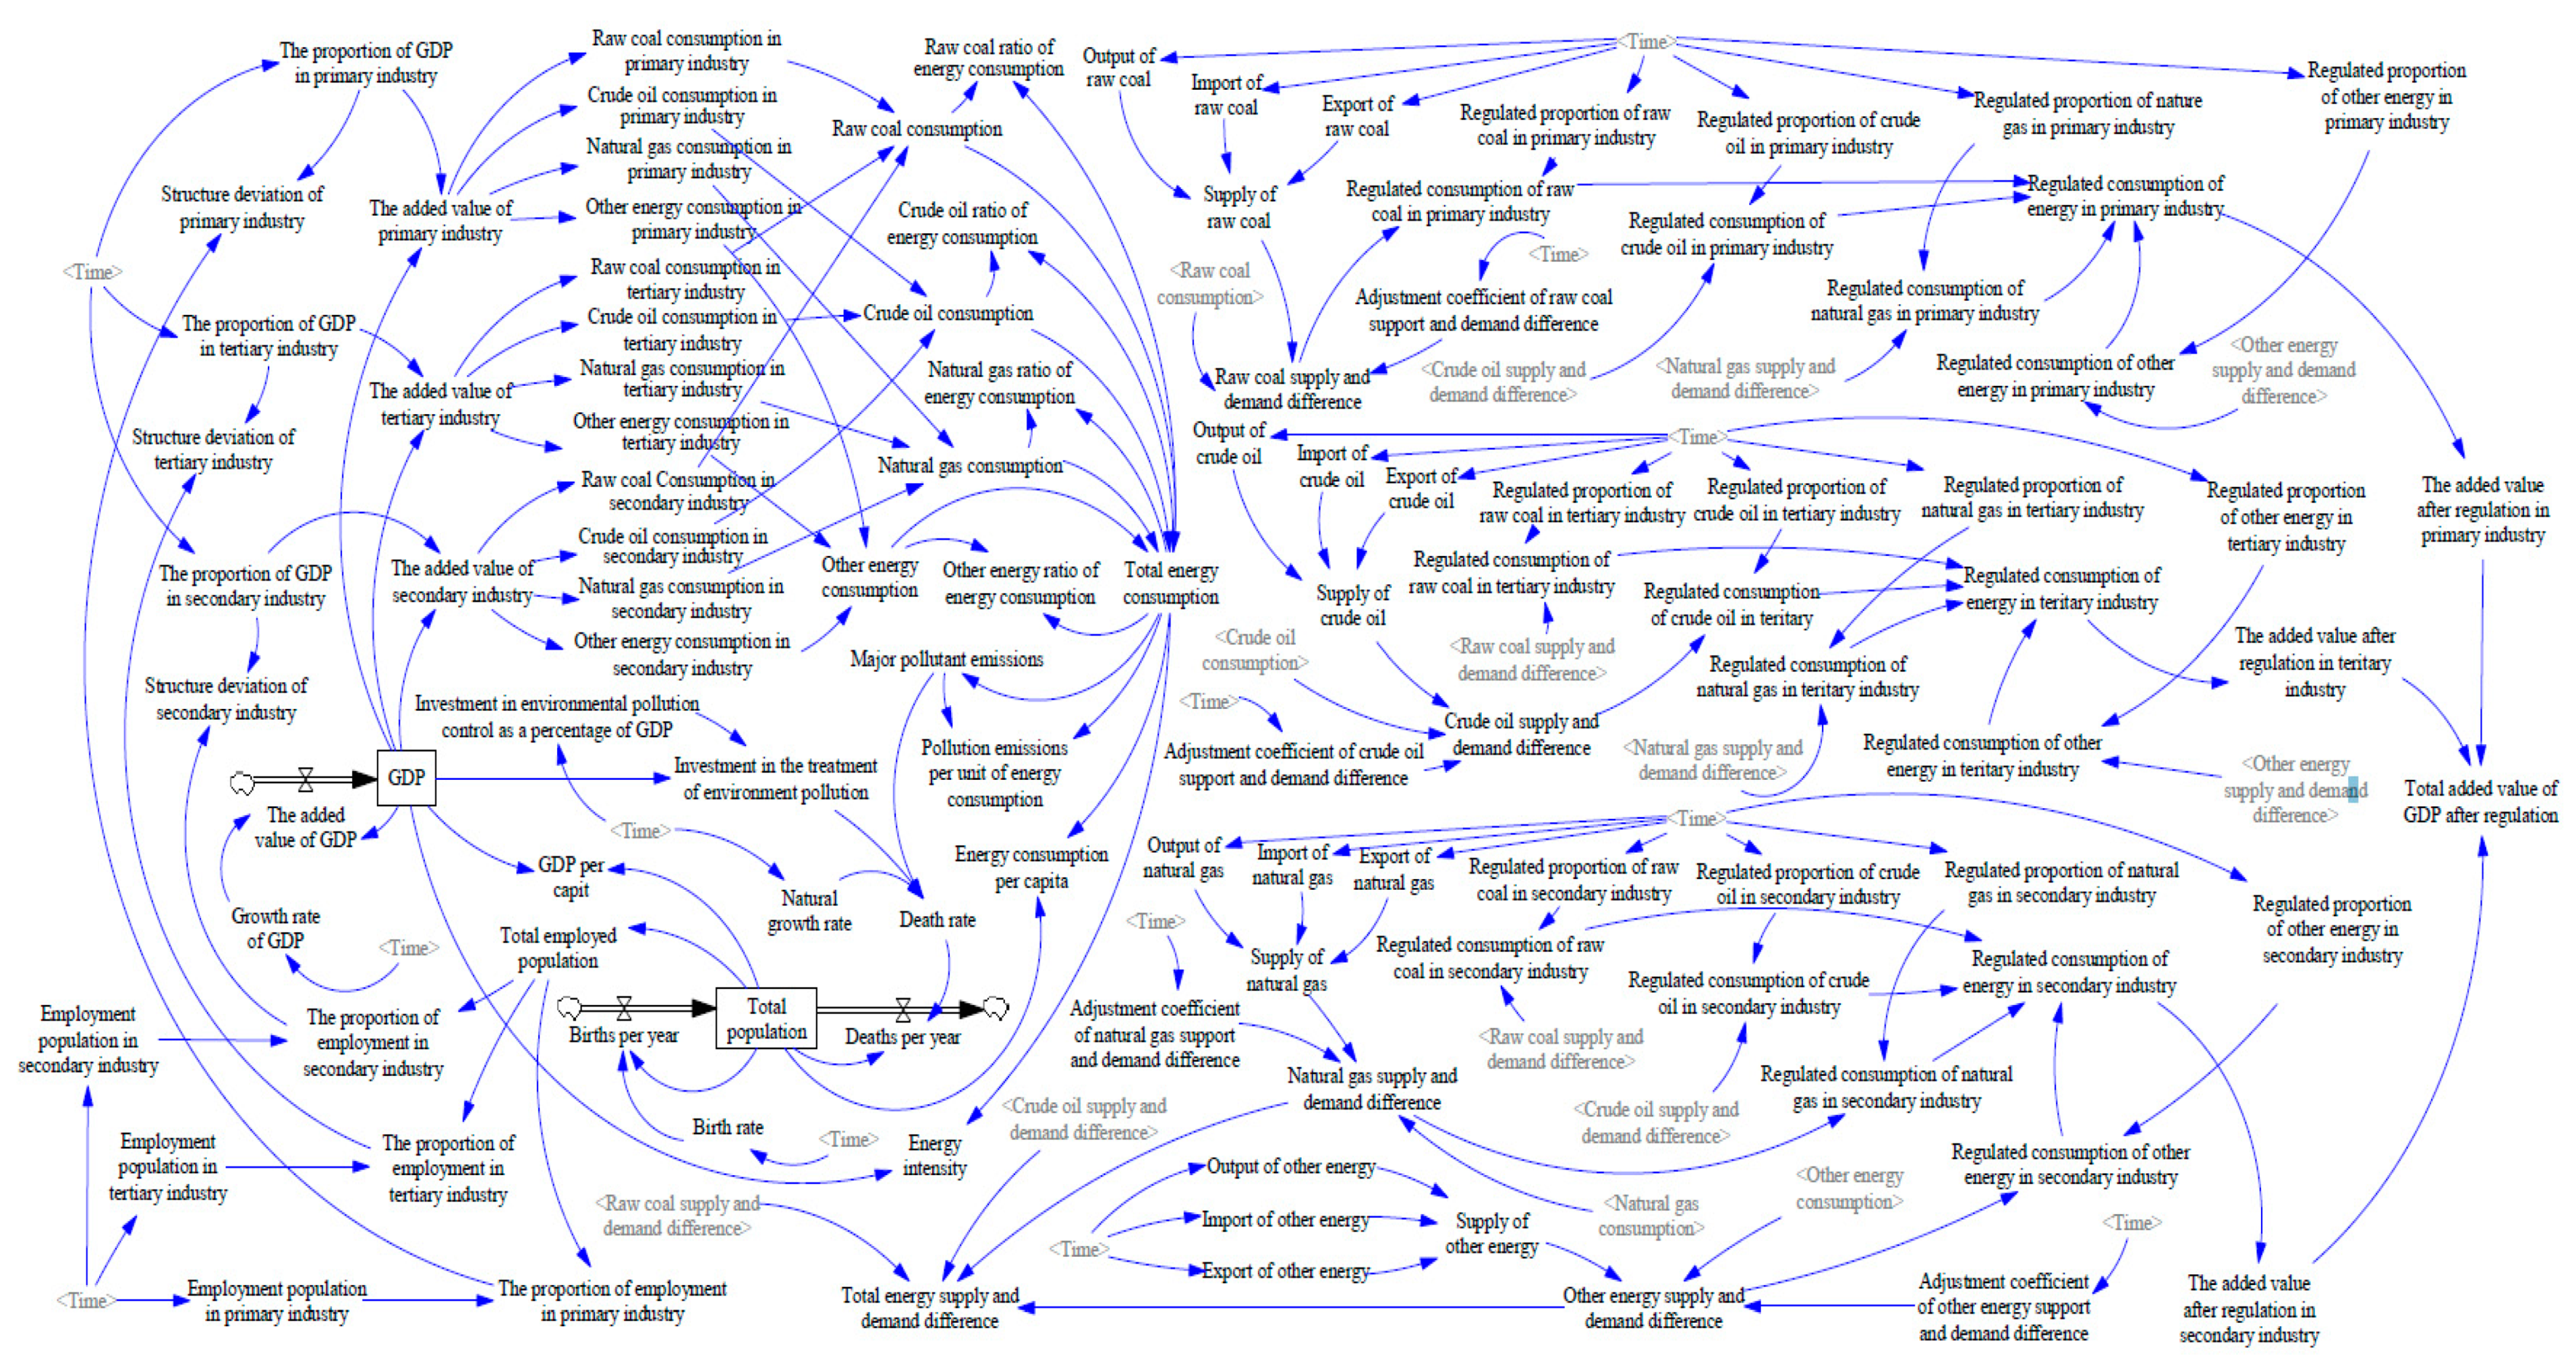
4.2. Stock Flow Diagram
4.3. Hypotheses and Boundaries of the E&I-SD Model
- (1)
- Since the data of each variable and parameter were known only through 2016, we chose to project the 2016 standard values as constant from 2016 to 2030. The variables for the three economic sectors (primary, secondary, and tertiary) included variables such as the following:
- The proportion of GDP;
- Output of different forms of primary energy, Import of different forms of primary energy, Export of different forms of primary energy;
- Regulated proportion of different forms of primary energy;
- Natural growth rate, employment population;
- Investment in the treatment of environment pollution.
- (2)
- The data concerning environmental pollution were too extensive to include in its entirety. The data included pollution of wastewater, waste gas, and solid waste as well as noise, light, and radiation pollution. Since the units of measurement of each type of pollutant were not uniform, and the degree of correlation was very small, for this model, we chose to represent pollution by the total amount of wastewater.
4.4. Validation Test of the E&I-SD Model
4.4.1. Direct Structure Test
4.4.2. Structure-Oriented Behavior Test
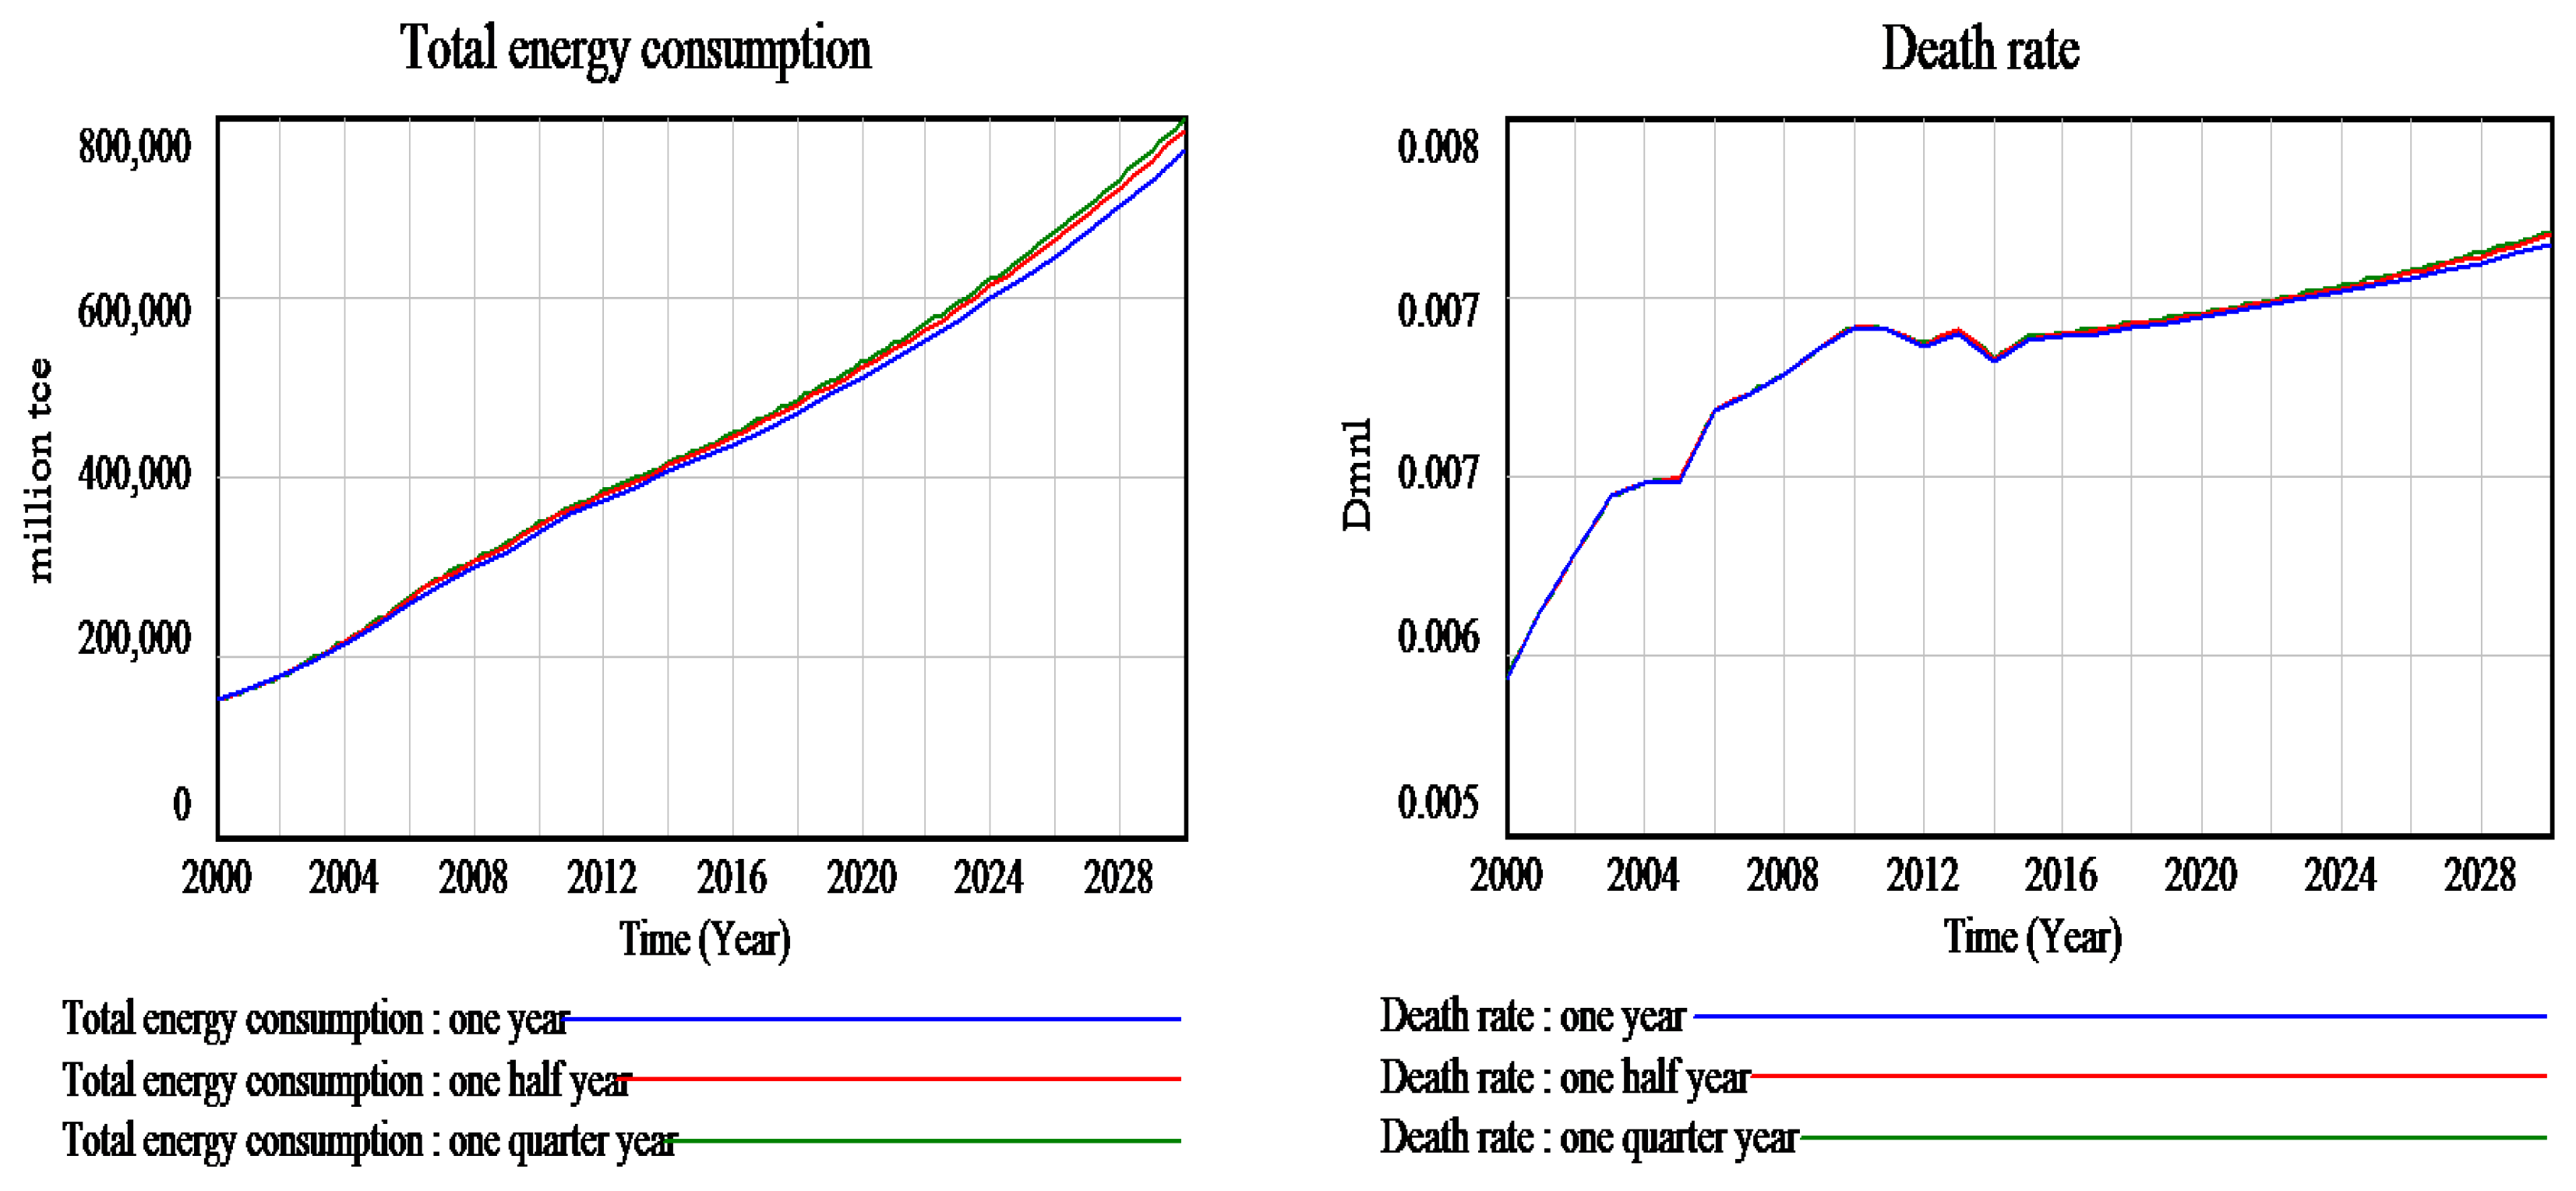
4.4.3. Behavior Pattern Test
5. The Model Applications and the Result Analysis
6. Recommendations and Conclusions
- (1)
- The E&I-SD model’s forecast showed that China’s primary energy consumption of raw coal and crude oil is on a sharp uptrend. Effective short- and long-term policy measures to replace fossil fuels with clean energy should be proposed and implemented across economic sectors. First, efforts to optimize China’s energy structure should start by reducing the percentage of raw coal in energy consumption, simultaneously increasing the proportion of natural gas and other primary energy sources. However, it is unrealistic to expect China to substitute low carbon energy sources for fossil fuels quickly. Second, the utilization efficiency of raw coal should be appraised further. In the short term, policies should aim to accelerate the popularity and application of technologies such as pithead power, clean coal, and coal-based polygeneration. In addition, it is necessary to increase investment in the innovation and utilization of new energy technologies, improve the utilization rate of terminal energy, and achieve the effective replacement of fossil fuels with clean energy over the medium and long term.
- (2)
- Mid- and long-term plans for managing the development of various economic sectors should be based on technological progress in China. The research groundwork can be accomplished through further adjustment and improvement of the E&I-SD model. Based on the simulation results, policies could be proposed for the healthy development of China’s energy structure and industrial structure, along with energy management planning suitable for China’s development.
- (3)
- A market-oriented pricing mechanism for energy should be established in China as soon as possible. The Chinese government’s intervention in energy prices, along with the oil companies’ monopoly of the energy market, have led to the non-marketization of energy prices. Currently, energy prices fail to reflect energy scarcity, and also seriously hinder the coordinated development of energy structure and the economic structure. Therefore, one of the most effective ways to promote the coordinated development of the energy structure and industrial structure would be by strengthening the regulation and control of the energy pricing system. A sound pricing system can inhibit the increase of total energy consumption. This conclusion is consistent with the work of Wang [46].
- (4)
- The optimization of China’s industrial structure relies mainly on the steady development of the primary industries, improvement and upgrading of the secondary industries, and promotion of the tertiary industries. Currently, the secondary industries participate in international industrial specialization, while the tertiary sector remains oriented toward the domestic market in China. Most of the production that requires high energy consumption comes from the secondary industries. The increasing amount of activity in secondary industries will become the main reason for a rise in energy intensity in China. For China’s secondary industries to maintain their share of the international markets, they should accelerate the rate at which they upgrade their output from low value-added to high value-added products. In addition, China should encourage elimination of the backward production capacity associated with high energy consumption and serious pollution, and promote the development of advanced manufacturing industries and emerging sectors of strategic importance.
Author Contributions
Funding
Acknowledgments
Conflicts of Interest
Appendix A

| No. | System | Equation | Unit |
|---|---|---|---|
| 1 | Parameter | INITIAL TIME = 2000 | Year |
| 2 | Parameter | FINAL TIME = 2030 | Year |
| 3 | Parameter | Time step = 1 | Year |
| 4 | Economy | GDP = INTEGER (The added value of GDP, 100280.1) | 100 million yuan |
| 5 | Economy | The added value of GDP = GDP × Growth rate of GDP | 100 million yuan |
| 6 | Economy | The proportion of GDP in tertiary industry = WITH LOOKUP ((Time,[(2000,0)(2030,1)],(2000,0.398),(2001,0.412),(2002,0.422),(2003,0.42),(2004,0.412),(2005,0.413),(2006,0.418),(2007,0.429),(2008,0.428),(2009,0.443),(2010,0.441),(2011,0.442),(2012,0.453),(2013,0.467),(2014,0.478),(2015,0.502),(2016,0.502),(2017,0.502),(2018,0.502),(2019,0.502),(2020,0.502),(2021,0.502),(2022,0.502),(2023,0.502),(2024,0.502),(2025,0.502),(2026,0.502),(2027,0.502),(2028,0.502),(2029,0.502),(2030,0.502)) | Dmnl |
| 7 | Economy | The added value of secondary industry = GDP × The proportion of GDP in secondary industry | 100 million yuan |
| 8 | Economy | GDP per capita=GDP/Total population | 100 million yuan/10000 persons |
| 9 | Energy | Raw coal consumption in primary industry = 0.372699 × The added value of primary industry − 2920.026 | 10,000 tce |
| 10 | Energy | Crude oil consumption in secondary industry = 0.082784 × The added value of secondary industry + 12785.54 | 10,000 tce |
| 11 | Energy | Natural gas consumption in secondary industry = 0.064632 × The added value of secondary industry − 600.3673 | 10,000 tce |
| 12 | Energy | Other energy consumption in secondary industry = 0.091 × The added value of secondary industry | 10,000 tce |
| 13 | Energy | Raw coal consumption in tertiary industry = 0.165659 × The added value of tertiary industry + 20593.55 | 10,000 tce |
| 14 | Energy | Crude oil consumption in tertiary industry = 0.229194 × The added value of tertiary industry + 7904.51 | 10,000 tce |
| 15 | Energy | Natural gas consumption = Natural gas consumption in primary industry + Natural gas consumption in secondary industry + Natural gas consumption in tertiary industry | 10,000 tce |
| 16 | Energy | Total energy consumption = Raw coal consumption + Crude oil consumption + Natural gas consumption + Other energy consumption | 10,000 tce |
| 17 | Energy | Natural gas ratio of energy consumption = Natural gas consumption/Total energy consumption | 10,000 tce |
| 18 | Energy | Other energy ratio of energy consumption = Other energy consumption/Total energy consumption | 10,000 tce |
| 19 | Energy | Energy consumption per capita = Total energy consumption/Total population | 10,000 tce /10,000 persons |
| 20 | Energy | Energy intensity = Total energy consumption/GDP | 10,000 tce /100 million yuan |
| 21 | Energy | Supply of raw coal = Output of raw coal + Import of raw coal − Export of raw coal | 10,000 tce |
| 22 | Energy | Supply of other energy = Output of other energy + Import of other energy − Export of other energy | 10,000 tce |
| 23 | Energy | Total energy supply and demand difference = Raw coal supply and demand difference + Crude oil supply and demand difference + Natural gas supply and demand difference + Other energy supply and demand difference | 10,000 tce |
| 24 | Energy | Natural gas supply and demand difference = Supply of natural gas − Natural gas consumption | 10,000 tce |
| 25 | Energy | Other energy supply and demand difference = Supply of other energy − Other energy consumption | 10,000 tce |
| 26 | Energy | Regulated consumption of energy in teritary industry = Regulated consumption of raw coal in tertiary industry + Regulated consumption of crude oil in teritary industry + Regulated consumption of natural gas in teritary industry + Regulated consumption of other energy in teritary industry | 10,000 tce |
| 27 | Energy | Regulated consumption of crude oil in primary industry = Crude oil supply and demand difference × Regulated proportion of crude oil in primary industry | 10,000 tce |
| 28 | Energy | Regulated consumption of natural gas in primary industry = Natural gas supply and demand difference × Regulated proportion of nature gas in primary industry | 10,000 tce |
| 29 | Energy | Regulated consumption of crude oil in secondary industry = Crude oil supply and demand difference × Regulated proportion of crude oil in secondary industry | 10,000 tce |
| 30 | Energy | Regulated consumption of natural gas in teritary industry = Natural gas supply and demand difference × Regulated proportion of natural gas in tertiary industry | 10,000 tce |
| 31 | Economy | The added value after regulation in primary industry = 2.81367 × Regulated consumption of energy in primary industry | 100 million yuan |
| 32 | Economy | The added value after regulation in secondary industry = 0.559261 × Regulated consumption of energy in secondary industry | 100 million yuan |
| 33 | Economy | The added value after regulation in teritary industry = 1.331794 × Regulated consumption of energy in teritary industry | 100 million yuan |
| 34 | Economy | Total added value of GDP after regulation = The added value after regulation in primary industry + The added value after regulation in secondary industry + The added value after regulation in teritary industry | 100 million yuan |
| 35 | Energy | Output of raw coal = WITH LOOKUP (Time, [(2000,0) − (2030,300000)],(2000,101009),(2001,107045),(2002,114307),(2003,135052),(2004,158116),(2005,177304),(2006,189881),(2007,205446),(2008,213024),(2009,219564),(2010,237839),(2011,264574),(2012,267464),(2013,270507),(2014,266230),(2015,260801),(2016,260800),(2017,260800),(2018,260800),(2019,260800),(2020,260800),(2021,260800),(2022,260800),(2023,260800),(2024,260800),(2025,260800),(2026,260800),(2027,260800),(2028,260800),(2029,260800),(2030,260800)) | 10,000 tce |
| 36 | Energy | Output of crude oil = WITH LOOKUP (Time, (2000,0) − (2030,40000)],(2000,23299.6),(2001,23368),(2002,23900.4),(2003,24183.3),(2004,25141.5),(2005,25984.3),(2006,26359.4),(2007,26687.8),(2008,27088.2),(2009,27106.7),(2010,28891.1),(2011,29074.1),(2012,29718.3),(2013,29944.2),(2014,30253.4),(2015,30682.5),(2016,30680),(2017,30680),(2018,30680),(2019,30680),(2020,30680),(2021,30680),(2022,30680),(2023,30680),(2024,30680),(2025,30680),(2026,30680),(2027,30680),(2028,30680),(2029,30680),(2030,30680)) | 10,000 tce |
| 37 | Energy | Import of crude oil = WITH LOOKUP (Time, [(2000,0) − (2030,60000)],(2000,13603.8),(2001,12653),(2002,14248.8),(2003,18516.3),(2004,24320.2),(2005,24043.4),(2006,27175.1),(2007,29401.3),(2008,32151.3),(2009,35918.3),(2010,40908.6),(2011,43943.7),(2012,46124.8),(2013,47754.3),(2014,50693.3),(2015,55573.3),(2016,55570),(2017,55570),(2018,55570),(2019,55570),(2020,55570),(2021,55570),(2022,55570),(2023,55570),(2024,55570),(2025,55570),(2026,55570),(2027,55570),(2028,55570),(2029,55570),(2030,55570)) | 10,000 tce |
| 38 | Energy | Export of crude oil = WITH LOOKUP (Time, [(2000,0) − (2030,8000)],(2000,2933.64),(2001,2719.57),(2002,2849.2),(2003,3350.98),(2004,2712.32),(2005,3539.46),(2006,3094.74),(2007,3139.38),(2008,3496.08),(2009,4757.34),(2010,4804.85),(2011,4707.05),(2012,4400.77),(2013,4924.6),(2014,4993.02),(2015,6288.28),(2016,6288),(2017,6288),(2018,6288),(2019,6288),(2020,6288),(2021,6288),(2022,6288),(2023,6288),(2024,6288),(2025,6288),(2026,6288),(2027,6288),(2028,6288),(2029,6288),(2030,6288)) | 10,000 tce |
| 39 | Population | Natural growth rate = WITH LOOKUP ((Time, [(2000,0) − (2030,0.01)],(2000,0.0076),(2001,0.007),(2002,0.0065),(2003,0.006),(2004,0.0059),(2005,0.0059),(2006,0.0053),(2007,0.0052),(2008,0.0051),(2009,0.0049),(2010,0.0048),(2011,0.0048),(2012,0.005),(2013,0.0049),(2014,0.0052),(2015,0.005),(2016,0.005),(2017,0.005),(2018,0.005),(2019,0.005),(2020,0.005),(2021,0.005),(2022,0.005),(2023,0.005),(2024,0.005),(2025,0.005),(2025,0.005),(2026,0.005),(2027,0.005),(2028,0.005),(2029,0.005),(2030,0.005)) | Dmnl |
| 40 | Population | Death rate = −0.45369 × Natural growth rate + 0.0000000303 × Investment in the treatment of environment pollution + 0.000000000031 × Major pollutant emissions + 0.008951 | Dmnl |
| 41 | Population | Deaths per year = Total population × Death rate | 10,000 persons |
| 42 | Population | Birth rate=WITH LOOKUP ((Time,[(2000,0) − (2030,0.1)],(2000,0.014),(2001,0.0134),(2002,0.0129),(2003,0.0124),(2004,0.0123),(2005,0.0124),(2006,0.0121),(2007,0.0121),(2008,0.0121),(2009,0.012),(2010,0.0119),(2011,0.0119),(2012,0.0121),(2013,0.0121),(2014,0.0124),(2015,0.0121),(2016,0.0121),(2017,0.0121),(2018,0.0121),(2019,0.0121),(2020,0.0121),(2021,0.0121),(2022,0.0121),(2023,0.0121),(2024,0.0121),(2025,0.0121),(2026,0.0121),(2027,0.0121),(2028,0.0121),(2029,0.0121),(2030,0.0121)) | Dmnl |
| 43 | Population | Births per year = Total population × Birth rate | 10,000 persons |
| 44 | Population | Total population = INTEGER (Births per year − Deaths per year,126743) | 10,000 persons |
| 45 | Employment | Total employed population = 0.487541 × Total population + 10700.22 | 10,000 persons |
| 46 | Employment | The proportion of employment in tertiary industry = Employment population in tertiary industry/Total employed population | Dmnl |
| 47 | Employment | Employment population in secondary industry = WITH LOOKUP (Time, ([(2000,0) − (2030,30000)],(2000,16219),(2001,16234),(2002,15682),(2003,15927),(2004,16709),(2005,17766),(2006,18894),(2007,20186),(2008,20553),(2009,21080),(2010,21842),(2011,22544),(2012,23241),(2012,23241),(2013,23170),(2013,23170),(2014,23099),(2014,23099),(2015,22693),(2016,22690),(2017,22690),(2018,22690),(2019,22690),(2020,22690),(2021,22690),(2022,22690),(2023,22690),(2024,22690),(2025,22690),(2026,22690),(2027,22690),(2028,22690),(2029,22690),(2030,22690)) | 10,000 persons |
| 48 | Employment | Structure deviation of tertiary industry = The proportion of GDP in tertiary industry/The proportion of employment in tertiary industry − 1 | Dmnl |
| 49 | Environment | Investment in environmental pollution control as a percentage of GDP = WITH LOOKUP (Time,(2000,0) − (2030,0.1)],(2000,0.0101),(2001,0.01),(2002,0.0112),(2003,0.0118),(2004,0.0118),(2005,0.0127),(2006,0.0117),(2007,0.0125),(2008,0.0155),(2009,0.0151),(2010,0.0184),(2011,0.0145),(2012,0.0153),(2013,0.0152),(2014,0.0149),(2015,0.0128),(2016,0.0128),(2017,0.0128),(2018,0.0128),(2019,0.0128),(2020,0.0128),(2021,0.0128),(2022,0.0128),(2023,0.0128),(2024,0.0128),(2025,0.0128),(2026,0.0128),(2027,0.0128),(2028,0.0128),(2029,0.0128),(2030,0.0128)) | Dmnl |
| 50 | Environment | Investment in the treatment of environment pollution = GDP × Investment in Environmental Pollution Control as a Percentage of GDP | 100 million yuan |
| 51 | Environment | Major pollutant emissions = 13.61567 × Total energy consumption + 1622315 | 10,000 tons |
| 52 | Environment | Pollution emissions per unit of energy consumption = Major pollutant emissions/Total energy consumption | 10,000 tons /10,000 tce |
| Variable | Total Energy Consumption | Raw Coal Consumption in the Secondary Industry | Crude oil Consumption in the Secondary Industry | Investment in the Treatment of Environment Pollution | ||||||||
| Unit | 10000 tce | 10000 tce | 10000 tce | 100 million yuan | ||||||||
| Year | Simulation Value | Statistical Data | Deviation | Simulation Value | Statistical Data | Deviation | Simulation Value | Statistical Data | Deviation | Simulation Value | Statistical Data | Deviation |
| 2000 | 150948 | 140993 | 6.59% | 78530.6 | 74466.31 | 5.18% | 16562.7 | 15312.67 | 7.55% | 1012.83 | 1014.9 | −0.20% |
| 2001 | 161846 | 148264 | 8.39% | 85915.5 | 79039.68 | 8.00% | 16813.3 | 15472.36 | 7.98% | 1086.03 | 1084.541 | 0.14% |
| 2002 | 175353 | 161935 | 7.65% | 95391.8 | 86439.30 | 9.38% | 17150.4 | 16708.70 | 2.58% | 1327.03 | 1331.77 | −0.36% |
| 2003 | 194054 | 189269 | 2.47% | 109844 | 104821.98 | 4.57% | 17705.5 | 17982.76 | −1.57% | 1537.93 | 1545.259 | −0.48% |
| 2004 | 211681 | 220738 | −4.28% | 122412 | 126164.23 | −3.07% | 18238 | 19979.27 | −9.55% | 1693.25 | 1695.182 | −0.11% |
| 2005 | 233654 | 250835 | −7.35% | 138495 | 150119.20 | −8.39% | 19005.2 | 19299.72 | −1.55% | 2030.15 | 2040.028 | −0.49% |
| 2006 | 257287 | 275134 | −6.94% | 154396 | 166705.73 | −7.97% | 19884.5 | 20549.21 | −3.34% | 2107.81 | 2109.241 | −0.07% |
| 2007 | 281530 | 299271 | −6.30% | 168184 | 184709.24 | −9.83% | 20773.4 | 21491.25 | −3.46% | 2571.71 | 2582.762 | −0.43% |
| 2008 | 299656 | 306455 | −2.27% | 178656 | 189942.49 | −6.32% | 21548.2 | 21110.99 | 2.03% | 3498.24 | 3491.141 | 0.20% |
| 2009 | 316187 | 321336 | −1.63% | 186153 | 201183.74 | −8.07% | 22167.5 | 22692.05 | −2.37% | 3728.31 | 3723.37 | 0.13% |
| 2010 | 337881 | 343601 | −1.69% | 197944 | 204946.71 | −3.54% | 23275 | 27064.43 | −16.28% | 5024.67 | 5040.05 | −0.31% |
| 2011 | 357172 | 370163 | −3.64% | 207083 | 223614.55 | −7.98% | 24271.5 | 26498.75 | −9.18% | 4335.82 | 4355.176 | −0.45% |
| 2012 | 372495 | 381515 | −2.42% | 212133 | 224590.46 | −5.87% | 24885 | 26132.19 | −5.01% | 4936.45 | 4934.669 | 0.04% |
| 2013 | 388097 | 394794 | −1.73% | 216477 | 228222.25 | −5.43% | 25454.5 | 26381.25 | −3.64% | 5286.71 | 5285.642 | 0.02% |
| 2014 | 403797 | 400299 | 0.87% | 221054 | 226571.00 | −2.50% | 26101.2 | 27454.14 | −5.18% | 5560.68 | 5554.47 | 0.11% |
| 2015 | 418015 | 402164 | 3.79% | 222346 | 220300.92 | 0.92% | 26293.4 | 28609.74 | −8.81% | 5106.56 | 5104.19 | 0.05% |
| Variable | Raw Coal Consumption | Crude Oil Consumption | Natural Gas Consumption | Other Energy Consumption | ||||||||
| Unit | 10000 tce | 10000 tce | 10000 tce | 10000 tce | ||||||||
| Year | Simulation Value | Statistical Data | Deviation | Simulation Value | Statistical Data | Deviation | Simulation Value | Statistical Data | Deviation | Simulation Value | Statistical Data | Deviation |
| 2000 | 108310 | 100810 | 6.92% | 35074.1 | 32287.4 | 7.95% | 2107.36 | 3242.8 | −53.88% | 5315.34 | 4652.8 | 12.47% |
| 2001 | 116668 | 106009 | 9.14% | 36478.3 | 32914.6 | 9.77% | 2771.66 | 3706.6 | −33.73% | 5790.77 | 5634.0 | 2.71% |
| 2002 | 127222 | 116269 | 8.61% | 38074.9 | 35625.7 | 6.43% | 3544.64 | 3886.4 | −9.64% | 6379.74 | 6153.5 | 3.55% |
| 2003 | 142561 | 138545 | 2.82% | 39743.2 | 39557.2 | 0.47% | 4437.31 | 4542.5 | −2.37% | 7182.67 | 6624.4 | 7.77% |
| 2004 | 156778 | 161580 | −3.06% | 41525.2 | 45913.5 | −10.57% | 5281.74 | 5297.7 | −0.30% | 7988.14 | 7946.6 | 0.52% |
| 2005 | 174017 | 189130 | −8.68% | 43876.8 | 46655.3 | −6.33% | 6548.55 | 6270.9 | 4.24% | 9105.06 | 8779.2 | 3.58% |
| 2006 | 191662 | 207726 | −8.38% | 46939.1 | 50074.4 | −6.68% | 8134.89 | 7703.8 | 5.30% | 10449.6 | 9629.7 | 7.85% |
| 2007 | 208376 | 226249 | −8.58% | 51004.8 | 52671.7 | −3.27% | 10086.9 | 9277.4 | 8.03% | 11978.8 | 11073.0 | 7.56% |
| 2008 | 220996 | 229841 | −4.00% | 53893.5 | 53323.2 | 1.06% | 11502.5 | 10725.9 | 6.75% | 13199.1 | 12564.7 | 4.81% |
| 2009 | 230965 | 240681 | −4.21% | 57536.9 | 55269.8 | 3.94% | 13225.2 | 11889.4 | 10.10% | 14403.7 | 13496.1 | 6.30% |
| 2010 | 245236 | 249798 | −1.86% | 61349.4 | 62879.0 | −2.49% | 15162.5 | 14431.2 | 4.82% | 16091.2 | 16492.8 | −2.50% |
| 2011 | 257127 | 271700 | −5.67% | 65250.8 | 65148.7 | 0.16% | 17080.9 | 17767.8 | −4.02% | 17692 | 15546.8 | 12.12% |
| 2012 | 265322 | 275454 | −3.82% | 69290.7 | 68291.2 | 1.44% | 18918.2 | 19457.3 | −2.85% | 18961.9 | 18312.7 | 3.42% |
| 2013 | 273113 | 281488 | −3.07% | 73788.8 | 71062.9 | 3.69% | 20941.4 | 22108.5 | −5.57% | 20269.8 | 20134.5 | 0.67% |
| 2014 | 280937 | 279409 | 0.54% | 78253.9 | 74055.3 | 5.37% | 22994.5 | 24017.9 | −4.45% | 21642.8 | 22817.0 | −5.43% |
| 2015 | 286430 | 273874 | 4.38% | 83614.6 | 78824.1 | 5.73% | 25265.6 | 24934.2 | 1.31% | 22749.2 | 24532.0 | −7.84% |
| Variable | Death Rate | Total Population | Total Employed Population | Major Pollutant Emissions | ||||||||
| Unit | Dmnl | 10000 persons | 10000 persons | 10000 tons | ||||||||
| Year | Simulation Value | Statistical Data | Deviation | Simulation Value | Statistical Data | Deviation | Simulation Value | Statistical Data | Deviation | Simulation Value | Statistical Data | Deviation |
| 2000 | 0.0056 | 0.0065 | −14.21% | 126743 | 126743 | 0.00% | 72492.6 | 72085 | 0.56% | 3.67 × 10⁶ | − | − |
| 2001 | 0.0059 | 0.0064 | −8.49% | 127801 | 127627 | 0.14% | 73008.4 | 72797 | 0.29% | 3.82 × 10⁶ | − | − |
| 2002 | 0.0062 | 0.0064 | −3.95% | 128756 | 128453 | 0.24% | 73474 | 73280 | 0.26% | 4.01 × 10⁶ | − | − |
| 2003 | 0.0064 | 0.0064 | 0.12% | 129622 | 129227 | 0.30% | 73896.2 | 73736 | 0.22% | 4.26 × 10⁶ | − | − |
| 2004 | 0.0065 | 0.0064 | 0.70% | 130398 | 129988 | 0.31% | 74274.6 | 74264 | 0.01% | 4.50 × 10⁶ | 4824094 | −7.14% |
| 2005 | 0.0065 | 0.0065 | −0.39% | 131158 | 130756 | 0.31% | 74645.1 | 74647 | 0.00% | 4.80 × 10⁶ | 5245089 | −9.23% |
| 2006 | 0.0068 | 0.0068 | −0.60% | 131933 | 131448 | 0.37% | 75022.9 | 74978 | 0.06% | 5.12 × 10⁶ | 5144802 | −0.40% |
| 2007 | 0.0068 | 0.0069 | −1.33% | 132636 | 132129 | 0.38% | 75365.7 | 75321 | 0.06% | 5.45 × 10⁶ | 5568494 | −2.08% |
| 2008 | 0.0069 | 0.0071 | −2.02% | 133333 | 132802 | 0.40% | 75705.5 | 75564 | 0.19% | 5.70 × 10⁶ | 5716801 | −0.26% |
| 2009 | 0.0070 | 0.0071 | −0.79% | 134023 | 133450 | 0.43% | 76041.9 | 75828 | 0.28% | 5.93 × 10⁶ | 5890877 | 0.62% |
| 2010 | 0.0071 | 0.0071 | 0.12% | 134689 | 134091 | 0.44% | 76366.6 | 76105 | 0.34% | 6.22 × 10⁶ | 6172562 | 0.82% |
| 2011 | 0.0071 | 0.0071 | −0.48% | 135333 | 134735 | 0.44% | 76680.6 | 76420 | 0.34% | 6.49 × 10⁶ | 6591922 | −1.62% |
| 2012 | 0.0070 | 0.0072 | −1.57% | 135981 | 135404 | 0.42% | 76996.5 | 76704 | 0.38% | 6.70 × 10⁶ | 6847612 | −2.27% |
| 2013 | 0.0071 | 0.0072 | −0.81% | 136669 | 136072 | 0.44% | 77331.9 | 76977 | 0.46% | 6.91 × 10⁶ | 6954433 | −0.67% |
| 2014 | 0.0070 | 0.0072 | −2.56% | 137352 | 136782 | 0.41% | 77664.9 | 77253 | 0.53% | 7.12 × 10⁶ | 7161751 | −0.55% |
| 2015 | 0.0071 | 0.0071 | −0.65% | 138096 | 137462 | 0.46% | 78027.7 | 77451 | 0.74% | 7.32 × 10⁶ | 7353227 | −0.51% |
References
- The 13th Five Year Plan for the National Economic and Social Development of the People’s Republic of China. In Standing Committee of the National People’s Congress; Central Compilation and Translation Press: Beijing, China, 2016.
- Decisiveness, Building a Well-Off Society in an All-Round Way and Seizing The Great Victory Of Socialism with Chinese Characteristics. In The New Era-Report on the 19th National Congress of the Communist Party of China[R]; People’s Publishing House: Beijing, China, 2017.
- Kraft, J.; Kraft, A. Relationship between energy and GNP. J. Energy Financ. Dev. 1978, 32, 401–403. [Google Scholar]
- Meadows, D.H.; Meadows, D.L.; Behbens, J. The Limits to Growth: A Report for the Club of Rome’s Project on the Predicament of Mand; Universe Press: New York, NY, USA, 1972. [Google Scholar]
- Smil, V.; Kuz, T. Energy/GDP relationships—The elastic snaps. Energy Policy 1977, 5, 162–164. [Google Scholar] [CrossRef]
- Soytas, U.; Sari, R. Energy consumption and GDP: Causality relationship in G-7 countries and emerging markets. Energy Econ. 2003, 25, 33–37. [Google Scholar] [CrossRef]
- Fotis, P.; Karkalakos, S.; Asteriou, D. The relationship between energy demand and real GDP growth rate: The role of price asymmetries and spatial externalities within 34 countries across the globe. Energy Econ. 2017, 66, 69–84. [Google Scholar] [CrossRef]
- Nachane, D.M.; Nadkarni, R.M.; Karnik, A.V. Co-Integration and Causality Testing of the Energy GDP Relationship: A Cross-Country Study. Appl. Econ. 1988, 20, 1511–1531. [Google Scholar] [CrossRef]
- Mi, Z.F.; Pan, S.Y.; Yu, H.; Wei, Y.M. Potential impacts of industrial structure on energy consumption and CO2 emission: A case study of Beijing. J. Clean. Prod. 2015, 103, 455–462. [Google Scholar] [CrossRef]
- Han, Z.Y.; Fan, Y.; Jiao, J.L.; Yan, J.S.; Wei, Y.M. Energy structure, marginal efficiency and substitution rate: An empirical study of China. Energy 2007, 32, 935–942. [Google Scholar] [CrossRef]
- Tiba, S.; Omri, A. Literature survey on the relationships between energy, environment and economic growth. Renew. Sustain. Energy Rev. 2017, 69, 1129–1146. [Google Scholar] [CrossRef]
- Zaman, K.; Abdullah, A.; Khan, A.; Nasir, M.R.B.; Hamzah, T.A.A.T.; Hussain, S. Dynamic linkages among energy consumption, environment, health and wealth in BRICS countries: Green growth key to sustainable development. Renew. Sustain. Energy Rev. 2016, 56, 1263–1271. [Google Scholar] [CrossRef]
- Feng, Y.Y.; Chen, S.Q.; Zhang, L.X. System dynamics modeling for urban energy consumption and CO2 emissions: A case study of Beijing, China. Ecol. Model. 2013, 252, 44–52. [Google Scholar] [CrossRef]
- Ansari, N.; Seifi, A. A system dynamics model for analyzing energy consumption and CO2 emission in Iranian cement industry under various production and export scenarios. Energy Policy 2013, 58, 75–89. [Google Scholar] [CrossRef]
- Shahiduzzaman, M.; Alam, K. Cointegration and causal relationships between energy consumption and output: Assessing the evidence from Australia. Energy Econ. 2012, 34, 2182–2188. [Google Scholar] [CrossRef]
- Han, S.; Zhang, B.S.; Tang, X.; Qi, S.; Meng, F.Y. Study on the driving factors in China’s Energy Intensity Change—Based on LMDI Decomposition Technique. Mod. Econ. Sci. 2016, 38, 89–98,127. [Google Scholar]
- González, P.F.; Landajo, M.; Presno, M.J. Multilevel LMDI decomposition of changes in aggregate energy consumption. A cross country analysis in the EU-27. Energy Policy 2014, 68, 576–584. [Google Scholar]
- Carmona, M.; Feria, J.; Golpe, A.; Iglesias, J. Consumption in the US reconsidered. Evidence across sources and economic sectors. Renew. Sustain. Energy Rev. 2017, 77, 1055–1068. [Google Scholar] [CrossRef]
- Paul, S.; Bhattacharya, R.N. Causality between energy consumption and economic growth in India: A note on conflicting results. Energy Econ. 2004, 26, 977–983. [Google Scholar] [CrossRef]
- Davis, M.; Ahiduzzaman, M.; Kumar, A. Mapping Canadian energy flow from primary fuel to end use. Energy Convers. Manag. 2018, 156, 178–191. [Google Scholar] [CrossRef]
- Subramanyam, V.; Paramshivan, D.; Kumar, A.; Mondal, M.A.H. Using Sankey diagrams to map energy flow from primary fuel to end use. Energy Convers. Manag. 2015, 91, 342–352. [Google Scholar] [CrossRef]
- Shahbaz, M.; Hoang, T.H.V.; Mahalik, M.K.; Roubaud, D. Energy Consumption, Financial Development and Economic Growth in India: New Evidence from a Nonlinear and Asymmetric Analysis. Energy Econ. 2017, 66, 199–212. [Google Scholar] [CrossRef]
- Bildirici, M.E.; Bakirtas, T. The relationship among oil, natural gas and coal consumption and economic growth in BRICTS (Brazil, Russian, India, China, Turkey and South Africa) countries. Energy 2014, 65, 134–144. [Google Scholar] [CrossRef]
- Bilgen, S. Structure and environmental impact of global energy consumption. Renew. Sustain. Energy Rev. 2014, 38, 890–902. [Google Scholar] [CrossRef]
- Ding, Q.; Cai, W.; Wang, C. The relationships between household consumption activities and energy consumption in China—An input-output analysis from the lifestyle perspective. Appl. Energy 2017, 207, 520–532. [Google Scholar] [CrossRef]
- Feng, T.W.; Sun, L.Y.; Zhang, Y. The relationship between energy consumption structure, economic structure and energy intensity in China. Energy Policy 2009, 37, 5475–5483. [Google Scholar] [CrossRef]
- Schäfer, A.; Kyle, P.; Pietzcker, R. Exploring the use of dynamic linear panel data models for evaluating energy/economy/environment models-an application for the transportation sector. Clim. Chang. 2016, 136, 141–154. [Google Scholar] [CrossRef]
- Suzuki, S.; Nijkamp, P. An evaluation of energy-environment-economic efficiency for EU, APEC and ASEAN countries: Design of a Target-Oriented DFM model with fixed factors in Data Envelopment Analysis. Energy Policy 2016, 88, 100–112. [Google Scholar] [CrossRef]
- Taghavee, V.M.; Aloo, A.S.; Shirazi, J.K. Energy, Environment, and Economy Interactions in Iran with Cointegrated and ECM Simultaneous Model. Procedia Econ. Financ. 2016, 33, 414–424. [Google Scholar] [CrossRef]
- Liu, G.Y.; Yang, Z.F.; Fath, B.D.; Shi, L.; Ulgiati, S. Time and space model of urban pollution migration: Economy-energy-environment nexus network. Appl. Energy 2017, 186, 96–114. [Google Scholar] [CrossRef]
- Forrester, J.W. Industrial Dynamics. J. Oper. Res. Soc. 1997, 48, 1037–1041. [Google Scholar] [CrossRef]
- Forrester, J.W. Industrial dynamics: A major breakthrough for decision makers. Harv. Bus. Rev. 1958, 36, 37–66. [Google Scholar]
- Forrester, J.W. Industrial Dynamics; MIT Press: Cambridge, MA, USA, 1961. [Google Scholar]
- Wang, Q.F. System Dynamics, Revised Edition; Tsinghua University Press: Beijing, China, 1994. [Google Scholar]
- Qudrat Ullah, H.; Seong, B.S. How to do structural validity of a system dynamics type simulation model: The case of an energy policy model. Energy Policy 2010, 38, 2216–2224. [Google Scholar] [CrossRef]
- National Bureau of Statistics. China’s Statistical Yearbook 2015; Statistical Publishing House: Beijing, China, 2016. [Google Scholar]
- National Bureau of Statistics. China’s Energy Statistical Yearbook 2016; Statistical Publishing House: Beijing, China, 2016. [Google Scholar]
- Barlas, Y. Formal aspects of model validity and validation in system dynamics. Syst. Dyn. Rev. 1996, 12, 1–28. [Google Scholar] [CrossRef]
- Yu, Z.M. The Research on Sustainable Development of Coal Industry Based on System Dynamics; Wuhan University of Technology: Wuhan, China, 2012; Volume 11, p. 61. [Google Scholar]
- Du, J. System Dynamics Simulation of the Economy-Energy-Environment 3e System in Chengdu; Chendu University of Technology: Chengdu, China, 2014; Volume 6, p. 37. [Google Scholar]
- Forrester, J.W.; Senge, P.M. Test for building confidence in system dynamics models. In System Dynamics Group Alfred P; Sloan School of Management Massachusetts Institute of Technology Cambridge: Cambridge, MA, USA, 1979; Volume D-2926-7, pp. 1–36. [Google Scholar]
- Zhu, J.; Liu, X.M.; Chu, Z.P. Scenario Analysis on Energy Demand and CO2 Emission of Low Carbon City. China Popul. Resour. Environ. 2015, 25, 48–55. [Google Scholar]
- Kuznets, S. Modern Economic Growth: Rate, Structure, and Spread; Yale University Press: New Haven, CT, USA, 1966. [Google Scholar]
- Özokcu, S.; Özdemir, Ö. Economic growth, energy, and environmental Kuznets curve. Renew. Sustain. Energy Rev. 2017, 72, 639–647. [Google Scholar] [CrossRef]
- Pablo-Romero, M.D.P.; Jesús, J.D. Economic growth and energy consumption: The energy-environmental Kuznets curve for Latin America and the Caribbean. Renew. Sustain. Energy Rev. 2016, 60, 1343–1350. [Google Scholar] [CrossRef]
- Wang, X.Y.; Cheng, J.H.; Yi, X.H. Coordination Analysis and Countermeasures of Industrial Structure and Energy Consumption Structure; Social Science Edition; Wuhan University of Technology: Wuhan, China, 2013; Volume 26, pp. 201–208. [Google Scholar]


| Type | Typical Feedback Loops |
|---|---|
| Positive | GDP―(+) the added value of different industries―(+) the consumption of variety types of energy in different industries―(+) total consumption of different types of energy―(+)total energy consumption―(+) major pollutant emissions―(+) Investment in the treatment of environment pollution―(+) policy investment―(+) GDP |
| GDP―(+) the added value of different industries―(+)the consumption of variety types of energy in different industries―(+) total consumption of different types of energy―(+) total energy consumption―(+) major pollutant emissions―(+) technical progress―(+) policy investment―(+) GDP | |
| Negative | GDP―(+) the added value of different industries―(+) the consumption of variety types of energy in different industries―(+) total consumption of different types of energy―(+) total energy consumption―(+) major pollutant emissions―(-)total population―(-) total employed population―(-) GDP |
| The added value of different industries―(+) the consumption of variety types of energy in different industries―(+) total consumption of different types of energy―(+) total energy consumption―(-) energy security―(+) the supply of variety types of energy in different industries―(+) the added value of different industries |
| Indicator | Total Added Value of GDP after Regulation | Energy Consumption per Capita | GDP per Capita | Pollution Emissions per Unit of Energy Consumption |
|---|---|---|---|---|
| unit | 100 million yuan | 10,000 tce/million capita | 100 million yuan/million capita | 10,000 tons/million tce |
| 2020 | 287.536 | 3.59944 | 3.93371 | 16.7992 |
| 2025 | 639.574 | 4.27966 | 5.35941 | 16.2288 |
| 2030 | 1,106.050 | 5.13482 | 7.30722 | 15.7428 |
© 2019 by the authors. Licensee MDPI, Basel, Switzerland. This article is an open access article distributed under the terms and conditions of the Creative Commons Attribution (CC BY) license (http://creativecommons.org/licenses/by/4.0/).
Share and Cite
Han, S.; Lin, C.; Zhang, B.; Farnoosh, A. Projections and Recommendations for Energy Structure and Industrial Structure Development in China through 2030: A System Dynamics Model. Sustainability 2019, 11, 4901. https://doi.org/10.3390/su11184901
Han S, Lin C, Zhang B, Farnoosh A. Projections and Recommendations for Energy Structure and Industrial Structure Development in China through 2030: A System Dynamics Model. Sustainability. 2019; 11(18):4901. https://doi.org/10.3390/su11184901
Chicago/Turabian StyleHan, Song, Changqing Lin, Baosheng Zhang, and Arash Farnoosh. 2019. "Projections and Recommendations for Energy Structure and Industrial Structure Development in China through 2030: A System Dynamics Model" Sustainability 11, no. 18: 4901. https://doi.org/10.3390/su11184901
APA StyleHan, S., Lin, C., Zhang, B., & Farnoosh, A. (2019). Projections and Recommendations for Energy Structure and Industrial Structure Development in China through 2030: A System Dynamics Model. Sustainability, 11(18), 4901. https://doi.org/10.3390/su11184901