Article

CO2 Flux Characteristics of Different Plant Communities in a Subtropical Urban Ecosystem

1
School of Environmental and Geographical Sciences (SEGS), Shanghai Normal University, Shanghai 200234, China
2
Research Center of Urban Ecology and Environment, Shanghai Normal University, Shanghai 200234, China
3
Department of Environmental Science, College of Biology and the Environment, Nanjing Forestry University, Nanjing 210037, China
4
Collaborative Innovation Center of Sustainable Forestry in Southern China of Jiangsu Province, Nanjing Forestry University, Nanjing 210037, China
*
Author to whom correspondence should be addressed.
Sustainability 2019, 11(18), 4879; https://doi.org/10.3390/su11184879
Submission received: 3 July 2019 / Revised: 31 August 2019 / Accepted: 2 September 2019 / Published: 6 September 2019

Abstract

:
Shanghai, China, is a city that is relatively representative of various cities in China due to its geographical location and socio-economic dynamics. The role of urban vegetation in the carbon cycle of urban developments in these types of cities is now being studied. We focus on identifying which urban plant community types have a greater influence on CO2 flux in cities, thus providing a scientific basis for low-carbon urban greening. Based on the eddy covariance (EC) observation system, ART Footprint Tool, plant inventory, and ecological community classification, we show that the CO2 flux characteristics of different plant communities vary temporally. The carbon sink duration during summer was the longest (up to 10 h) and the carbon sink duration was the shortest during winter (7.5 h). In addition, we discovered that the CO2 flux contribution rates of different plant community types are distinct. The annual average CO2 contribution rates of the Cinnamomum camphora-Trachycarpus fortunei community and the Metasequoia glyptostroboides+Sabina chinensis community are 11.88% and 0.93%, respectively. The CO2 flux contribution rate of the same plant community differs according to season. The CO2 contribution rate of the Cinnamomum camphora-Trachycarpus fortunei community exhibits local maxima during winter and summer, with a maximum difference of 11.16%. In contrast, the Metasequoia glyptostroboides+Sabina chinensis community has a CO2 contribution rate of 0.35% during the same period. In general, summer is the season with the lowest CO2 flux contribution rate of plant communities, and winter is the season with the highest CO2 flux contribution rate. However, the Cinnamomum camphora+Salix babylonica community and the Cinnamomum camphora+Sabina chinensis community present the opposite pattern. Finally, the diurnal variation characteristics of CO2 flux in different communities have the same trend, but the peak values differ significantly. Overall, daily CO2 flux peak value of the Metasequoia glyptostroboides community and the Cinnamomum camphora-Trachycarpus fortunei community indicate that these two plant communities exhibit a strong capacity for CO2 absorption in the study area. According to these research results, urban greening efforts in subtropical climates can increase the green space covered by the Cinnamomum camphora-Trachycarpus fortunei and the Metasequoia glyptostroboides community types when urban greening, so as to appropriately reduce the CO2 emitted into the atmosphere.

1. Introduction

Human activities are the main source of urban CO2. Since the industrial revolution, the rapid increase of CO2 concentrations in the atmosphere has been demonstrated by scientists from different fields. Global changes caused by the increase of greenhouse gas concentrations such as CO2 have drawn worldwide attention due to the frequent occurrence of extreme weather and the acceleration of global warming in recent years. The atmospheric carbon cycle is a key link affecting the global climate. Therefore, the need for further carbon flux research is increasingly urgent [1,2,3].
The eddy covariance (EC) method is widely used to observe CO2 flux because it can directly measure the CO2 flux over defined areas [4,5]. The micro-meteorological technology of the EC has the advantage of monitoring the average flux of the entire upwind area, with a length scale of about 10–1000 times the measured height [6]. Currently, EC is the only standard measurement method that can directly measure the exchange of CO2 between an ecosystem and the atmosphere. Although the monitoring system was first used in natural ecosystems such as grasslands, cropland, and forests [7,8,9,10], EC is now increasingly being used in cities [11,12].
Emissions of greenhouse gases (GHG) such as carbon dioxide and CH4 (methane) contribute to global warming, and more than 70% of global greenhouse gases are emitted by cities [13]. Research indicates that urban areas with abundant vegetation are often carbon sinks [14,15,16,17,18]. Trees, lawns, and green roofs in a city can reduce carbon dioxide in the atmosphere via daytime photosynthesis, and these green spaces can directly absorb and store carbon in the form of stems, branches, or roots [19]. Hence, studying CO2 fluxes is an important step to fundamentally reduce urban CO2 emissions and solve environmental problems [20].
The majority of studies of CO2 fluxes have concentrated on the seasonal changes of single vegetation-type ecosystems [7,8,9,10]. Measuring the CO2 flux of urban vegetation still has many challenges such as the complexity of urban environments, the difficulty of determining soil CO2 flux and the discrepancies of photosynthesis rates among trees [21,22,23]. The application of the EC method to the CO2 exchange between the atmosphere and the surface in urban ecosystems can be used to better understand the dynamic characteristics and influencing factors of carbon in cities.
Research on vegetation and CO2 flux has mainly focused on the driving factors of CO2 flux and the influence of vegetation on CO2 flux [24,25]. However, few studies have illustrated the effects of different vegetation communities on CO2 flux and identified the plant communities that influence these fluxes. For instance, Coutts and Velasco indicate that cities with mild winters like Melbourne generally exhibit smaller seasonal differences, but a less positive summer flux can still be observed [19,26]. Velasco compared seasonal CO2 fluxes that originated from different wind sectors in Helsinki and demonstrated the potential of urban vegetation for mitigating CO2 concentrations during different seasons [27]. Bergeron and Strachan reported that the EC measurements from mid-latitude cities reveal that total CO2 fluxes in heavily vegetated areas typically reach minima at midday and during the growing season [11]. Additionally, measurements taken in Beijing revealed lower CO2 fluxes from the direction of residential housing and vegetation [28]. Similarly, a wind sector analysis in Montreal reported higher CO2 uptake in the same directions as cemetery locations [11].
Therefore, this paper will explore the impact of different urban plant communities on CO2 flux to better explain the relationship between vegetation, CO2, and related climate change mechanisms, to provide reference data for building green garden cities, and to offer a practical theoretical basis for the emission and absorption of CO2 in subtropical cities. This study has the following specific objectives: (1) Determine which plant community type contributes the most to CO2 flux and (2) determine which plant community type is more effective in reducing urban CO2 emissions.
The CO2 flux footprint characteristics of urban ecosystems have become the issue of most concern for researchers due to the heterogeneity of their land surfaces [29]. Therefore, this study will analyze the characteristics of CO2 flux footprints of different vegetation types via the Kormann and Meixner model (ART Footprint Tool), and it will obtain the characteristics of community types that are more effective in absorbing CO2.

2. Method

2.1. Site Description

The study area is located in Fengxian University Park, Shanghai, on the southeast coast of Fengxian District, Shanghai, on the north shore of Hangzhou Bay. The research area centers around the EC instrumentation site (30°50′32.26″ N, 121°30′38.96″ E), as shown in Figure 1. The area belongs to the mid-latitude temperate zone and exhibits a subtropical monsoon climate. The prevailing wind in summer is the southeast wind, and the temperature is hot and rainy. The prevailing wind in winter is the northwest wind, and there is little rain at low temperature. The annual average temperature is 15 °C, the annual total precipitation is approximately 1200 mm, and the annual average relative humidity is 82%. The frost-free period is approximately 200 d [30]. Within 1 km of the EC instrumentation, the terrain is relatively flat, student dormitory and restaurant buildings are located to the west and south of the EC instrumentation, and there is a large subtropical evergreen broad-leaved forest dominated by camphor trees. School-related buildings, recreational areas, and libraries are on the east side with main roads on the north side [31]. The schedule of teachers and students in Chinese university is generally 8:00–11:00 a.m., 13:00–17:00 p.m., and 18:00–21:30 p.m.
The study area has different plant vegetation communities that are principally composed of the Cinnamomum camphora community, the Metasequoia glyptostroboides community, the Salix babylonica community, and the Cinnamomum camphora+Metasequoia glyptostroboides community. A total of 126 woody plant species were recorded in these communities, and 54 families and 99 genera were categorized according to the classification and naming principles of “China Vegetation” [32]. A total of six representative plant communities were selected for comparative analysis. The distributions of the Cinnamomum camphora-Trachycarpus fortunei community, the Metasequoia glyptostroboides community, the Metasequoia glyptostroboides+Sabina chinensis community, the Cinnamomum camphora+Salix babylonica community, the Cinnamomum camphora+Sabina chinensis community, and the Cinnamomum camphora+Chimonanthus praecox community are shown in Figure 1.

2.2. Instrumentation and Data Quality Control

The EC system was located in a tower 20 m above the ground and its flux observation system is composed of a Cr3000 (Campbell Scientific Instruments, Logan, UT, USA) flux data logger as well as a Li7500 (LICOR, Inc. Lincoln, NE, USA) open-path CO2/H2O communication device. The system also includes the Gill 3D ultrasonic anemometer (Gill Instruments, Lymington, UK). The Cr3000 device continuously collects data throughout the day and night with real-time data at 10 Hz and online average data 30 min intervals.
We used flux data from 1 October 2016, to 30 September 2017, and EddyPro 5.1.1 (Eddy Covariance Software) software was used to perform tilt correction on the original 10Hz data, frequency response correction, and WPL correction. The 30 min interval data included various flux information and data quality control indicators [22]. After completing EddyPro data processing and taking into account the effects of weather and man-made and instrumental factors, we screened the half-hour flux data. We omitted (1) missing data; (2) data with a quality control value of “2”; (3) data collected one hour before and after precipitation; (4) data with 10% Hz raw data missing more than 10% every half hour; and (5) data collected at night with friction wind speed less than 0.15 m/s. The missing and rejection rate for CO2 flux data was 39% from 1 November 2016, to 31 October 2017. The mean diurnal variation (MDV) method is used for interpolation. This method replaces missing or rejected data points with the average of values collected at the same time on adjacent days. The interpolation period of the daytime flux data is 7 days and for the night it is 14 days [33].

2.3. Calculation of the Footprint Function

Selecting the location of the flux observation points and determining the effective range of instrument monitoring is the basis for studying and accurately analyzing regional carbon fluxes. The Kljun flux source region calculation model is a novel algorithm developed by Kljun et al. based on scale (dimension) analysis. This model is mainly used to calculate the crosswind integral function of the flux footprint. According to Kljun et al. [34], the crosswind integral footprint function mainly depends on various parameters including x, Z m , h (boundary layer height), u*, and σw (standard deviation of vertical wind speed pulsation). These parameters can be obtained by EddyPro software. From the dimensional analysis (Π theorem), it is possible to reconstruct the dimensionless parameter groups, e.g., Π   1   =   Z m f i y ,   Π   2   =   x / Z m ,   Π   3   =   h / Z m ,   and   Π   4   =   σ w / u * as these reconstructed quantities can be used to obtain the function Π 1 = f ( Π 2 , Π 3 , Π 4 ) , that is, a dimensionless crosswind integral footprint function as a dimensionless upwind distance function. Using the above dimensionless parameter group, we can obtain the following formulae:
X * = ( σ w u * ) α 1 x z m
F * = ( σ w u * ) α 2 ( 1 z m h ) 1 z m f y ¯
where α 1 and α 2 are variables to optimize the parameters. We then use the results of the more reliable complex three-dimensional Lagrangian footprint model LPDM-B to test and determine the optimization parameters and the fitting parameters calculated by the following flux footprint parameterization formula. The numbers a, b, c and d are the optimization parameters and the fitting parameters (related to the roughness Z 0 ):
F * = a ( X * + d c ) b exp { b ( 1 X * + d c ) }
Kljun provides an online tool (http://footprint.kljun.net/index.php) that uses this method to calculate footprint distribution. The footprint function f y ¯ of the crosswind integral is calculated as a function of the upwind distance x . The upwind distance x max at which the f y ¯ peak appears can be output as needed as well as the flux at the distance x R that adopt different percentages (R) of the f y ¯ value.

2.4. ART-Footprint Model

The ART-footprint model combines land use information and eddy correlation data to calculate the contribution rate of CO2 flux in a certain area using the footprint density function. The first step is to determine the two-dimensional footprint density function φ(x, y) based on the analytical model of Kormann and Meixner (2001) and then to define the calculated footprint function using five parameters: A, B, C, D, and E:
F ( 0 , 0 , z m ) = 0 F 0 ( x , y , 0 ) ϕ ( x , y , z m ) d x d y
ϕ ( x , y )   =   D x y · C · e x p ( B x ) · x A    
where D x y describes the Gaussian crosswind distribution, parameters A–C describe the crosswind distribution, and D and E specify the crosswind distribution [6]. In the second step, the parameters required for the operation of the model are: Observation time (t), friction velocity (u*), the Obukhov length (L), the standard deviation of the lateral wind (σv), wind direction (dir) and effective dynamic height ( Z m ). In addition to the effective dynamic height ( Z m ) parameter, all other parameters can be obtained from the half-hour data output from the EddyPro.
Z m can be obtained by the following formula:
Z m   =   Z d
  d   =   2 3 Z h  
where, Z is the height of the EC instrument, 20 m; d is the zero plane displacement; and Z h is the average height of the underlying surface. The value of Zm can be calculated according to the actual data.
The ART-footprint Tool calculates the flux contribution rate over the specified area. The specified area must be a quadrilateral, and all the inner angles of the quadrilateral are required to be less than 180°. Based on the coordinates of the EC tower, the coordinates of the four vertices of the quadrilateral are determined by the land use in the study area. When calculating the flux contribution rate, we used Equation (1) to select 200 downwind points and 100 grid points for use as crosswind points. Next, the carbon flux contribution information in the grid is rotated to the wind direction. The carbon flux contribution data of all the grid points in the specified quadrilateral are superimposed to finally calculate the carbon flux contribution ratio in the region of interest [6].

3. Results

3.1. Wind Direction Characteristics and Effective Contribution Area of CO2

The wind direction is directly linked to the distribution of CO2 flux and its source area (Figure 2b). According to the wind rose chart, southeast is the main wind direction of the study area during 2016–2017, and the wind speed is mostly concentrated in the range of 3.5–4 m·s−1. After statistical analysis of the 30 min dataset using Origin 8.6, the CO2 flux values are mainly concentrated in the range of −5 μmol·m−2·s−1 to 5 μmol·m−2·s−1, and the peak value is 29.90 μmol·m−2·s−1. The distribution of CO2 flux tends to be in the northeast-southeast direction. Selecting the location of the flux observation point and determining the effective range of instrument monitoring are the basis for studying and accurately analyzing the regional carbon flux and the distribution characteristics of the farthest point of the CO2 flux footprint (Figure 2b). The farthest point of the CO2 flux footprint is consistent with the wind direction distribution, and the farthest points are mainly distributed in the ESE-SSE and the N-WNW directions. The farthest points are concentrated within 300 m from the flux tower, and the probability of occurrence in this range is as high as 78.22%. The maximum farthest point is approximately 1381 m southeast of the flux tower position. This places the point in a residential area with a dense population.

3.2. CO2 Flux Characteristics

The CO2 dynamics in the study area were spatially heterogeneous and temporally variable (Figure 3). In different seasons, the CO2 flux showed different characteristics due to the presence of urban vegetation. The CO2 flux exhibited high variation during the research period from November 2016 to October 2017, with a maximum of 29.90 μmol·m−2·s−1 and an average annual value of 0.6 μmol·m−2·s−1. The diurnal variation trend of CO2 flux in different seasons is generally the same (Figure 3), but the time at which the CO2 flux dips below 0 (carbon sink) differs in summer. Due to the photosynthetic period of plants, carbon sequestration is the longest in the summer. In the summer, carbon sequestration lasts approximately 10 h from ~6:30 in the morning to ~16:30 in the afternoon. The most negative carbon flux during the summer was −9.07 μmol·m−2·s−1. The photosynthesis intensity of plants is relatively weak during the winter, and the winter experiences the shortest period of negative carbon flux. Carbon sequestration in winter lasts from 8:00 am to 15:30 pm (7.5 h), and the most negative carbon flux during winter was −8.36 μmol·m−2·s−1. The carbon sink durations in spring and autumn are approximately the same: From 7:00 in the morning to approximately 16:00 in the afternoon (9 h), and the most negative carbon flux was 7.29 μmol·m−2·s−1 for spring and 7.15 μmol·m−2·s−1 for autumn.

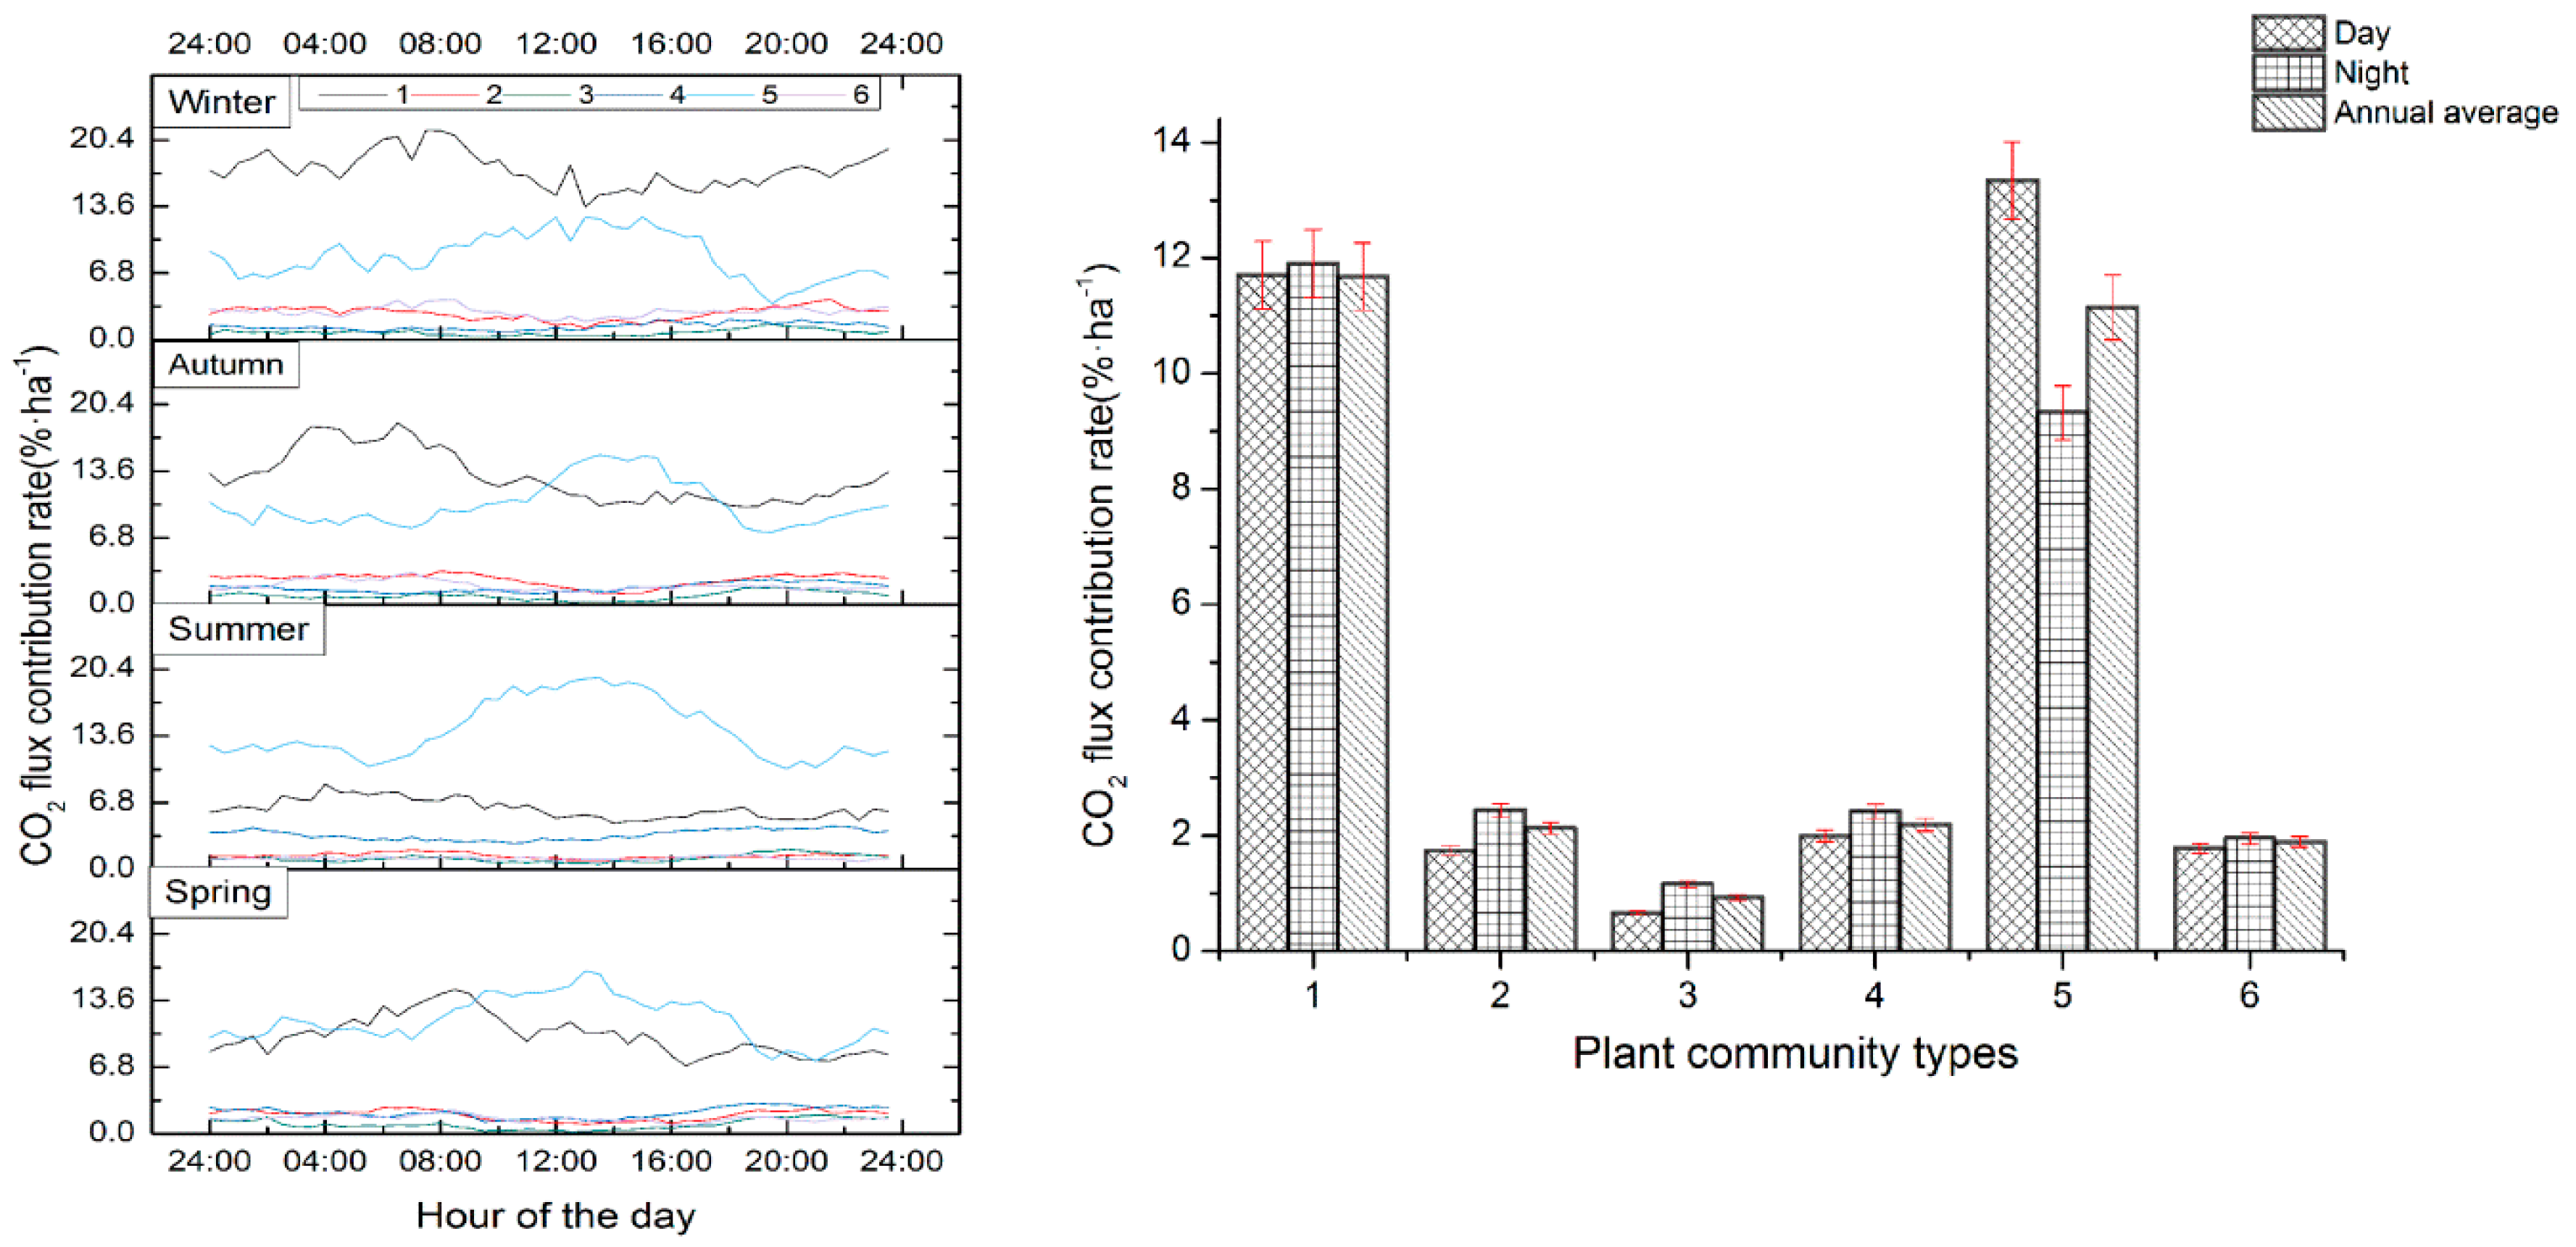
3.3. Annual Average CO2 Flux Contribution Rate of Different Vegetation Communities

The annual average CO2 flux contribution rates of different plant communities are significantly distinct (Figure 4). The annual average CO2 flux of the Cinnamomum camphora-Trachycarpus fortunei community has the highest contribution rate at 11.88%, followed by the Cinnamomum camphora+Sabina chinensis community, with an annual average CO2 flux contribution rate of 11.15%. The annual average CO2 contribution rates of the other four communities are relatively low. The contribution rate of daily CO2 flux in different plant communities also shows great differences according to seasons. The most obvious difference manifests in the trends for the Cinnamomum camphora-Trachycarpus fortunei community and the Cinnamomum camphora+Sabina chinensis community whose contribution rates show the same trend only at night but opposite trends for daytime. The community with the highest CO2 flux contribution rate is the Cinnamomum camphora+Sabina chinensis community which ranges up to 13.34%. The CO2 flux contribution rate of this community was significantly higher during the day than that during the night. In contrast, the CO2 flux contribution rates of other communities are slightly higher at night than during the daytime.

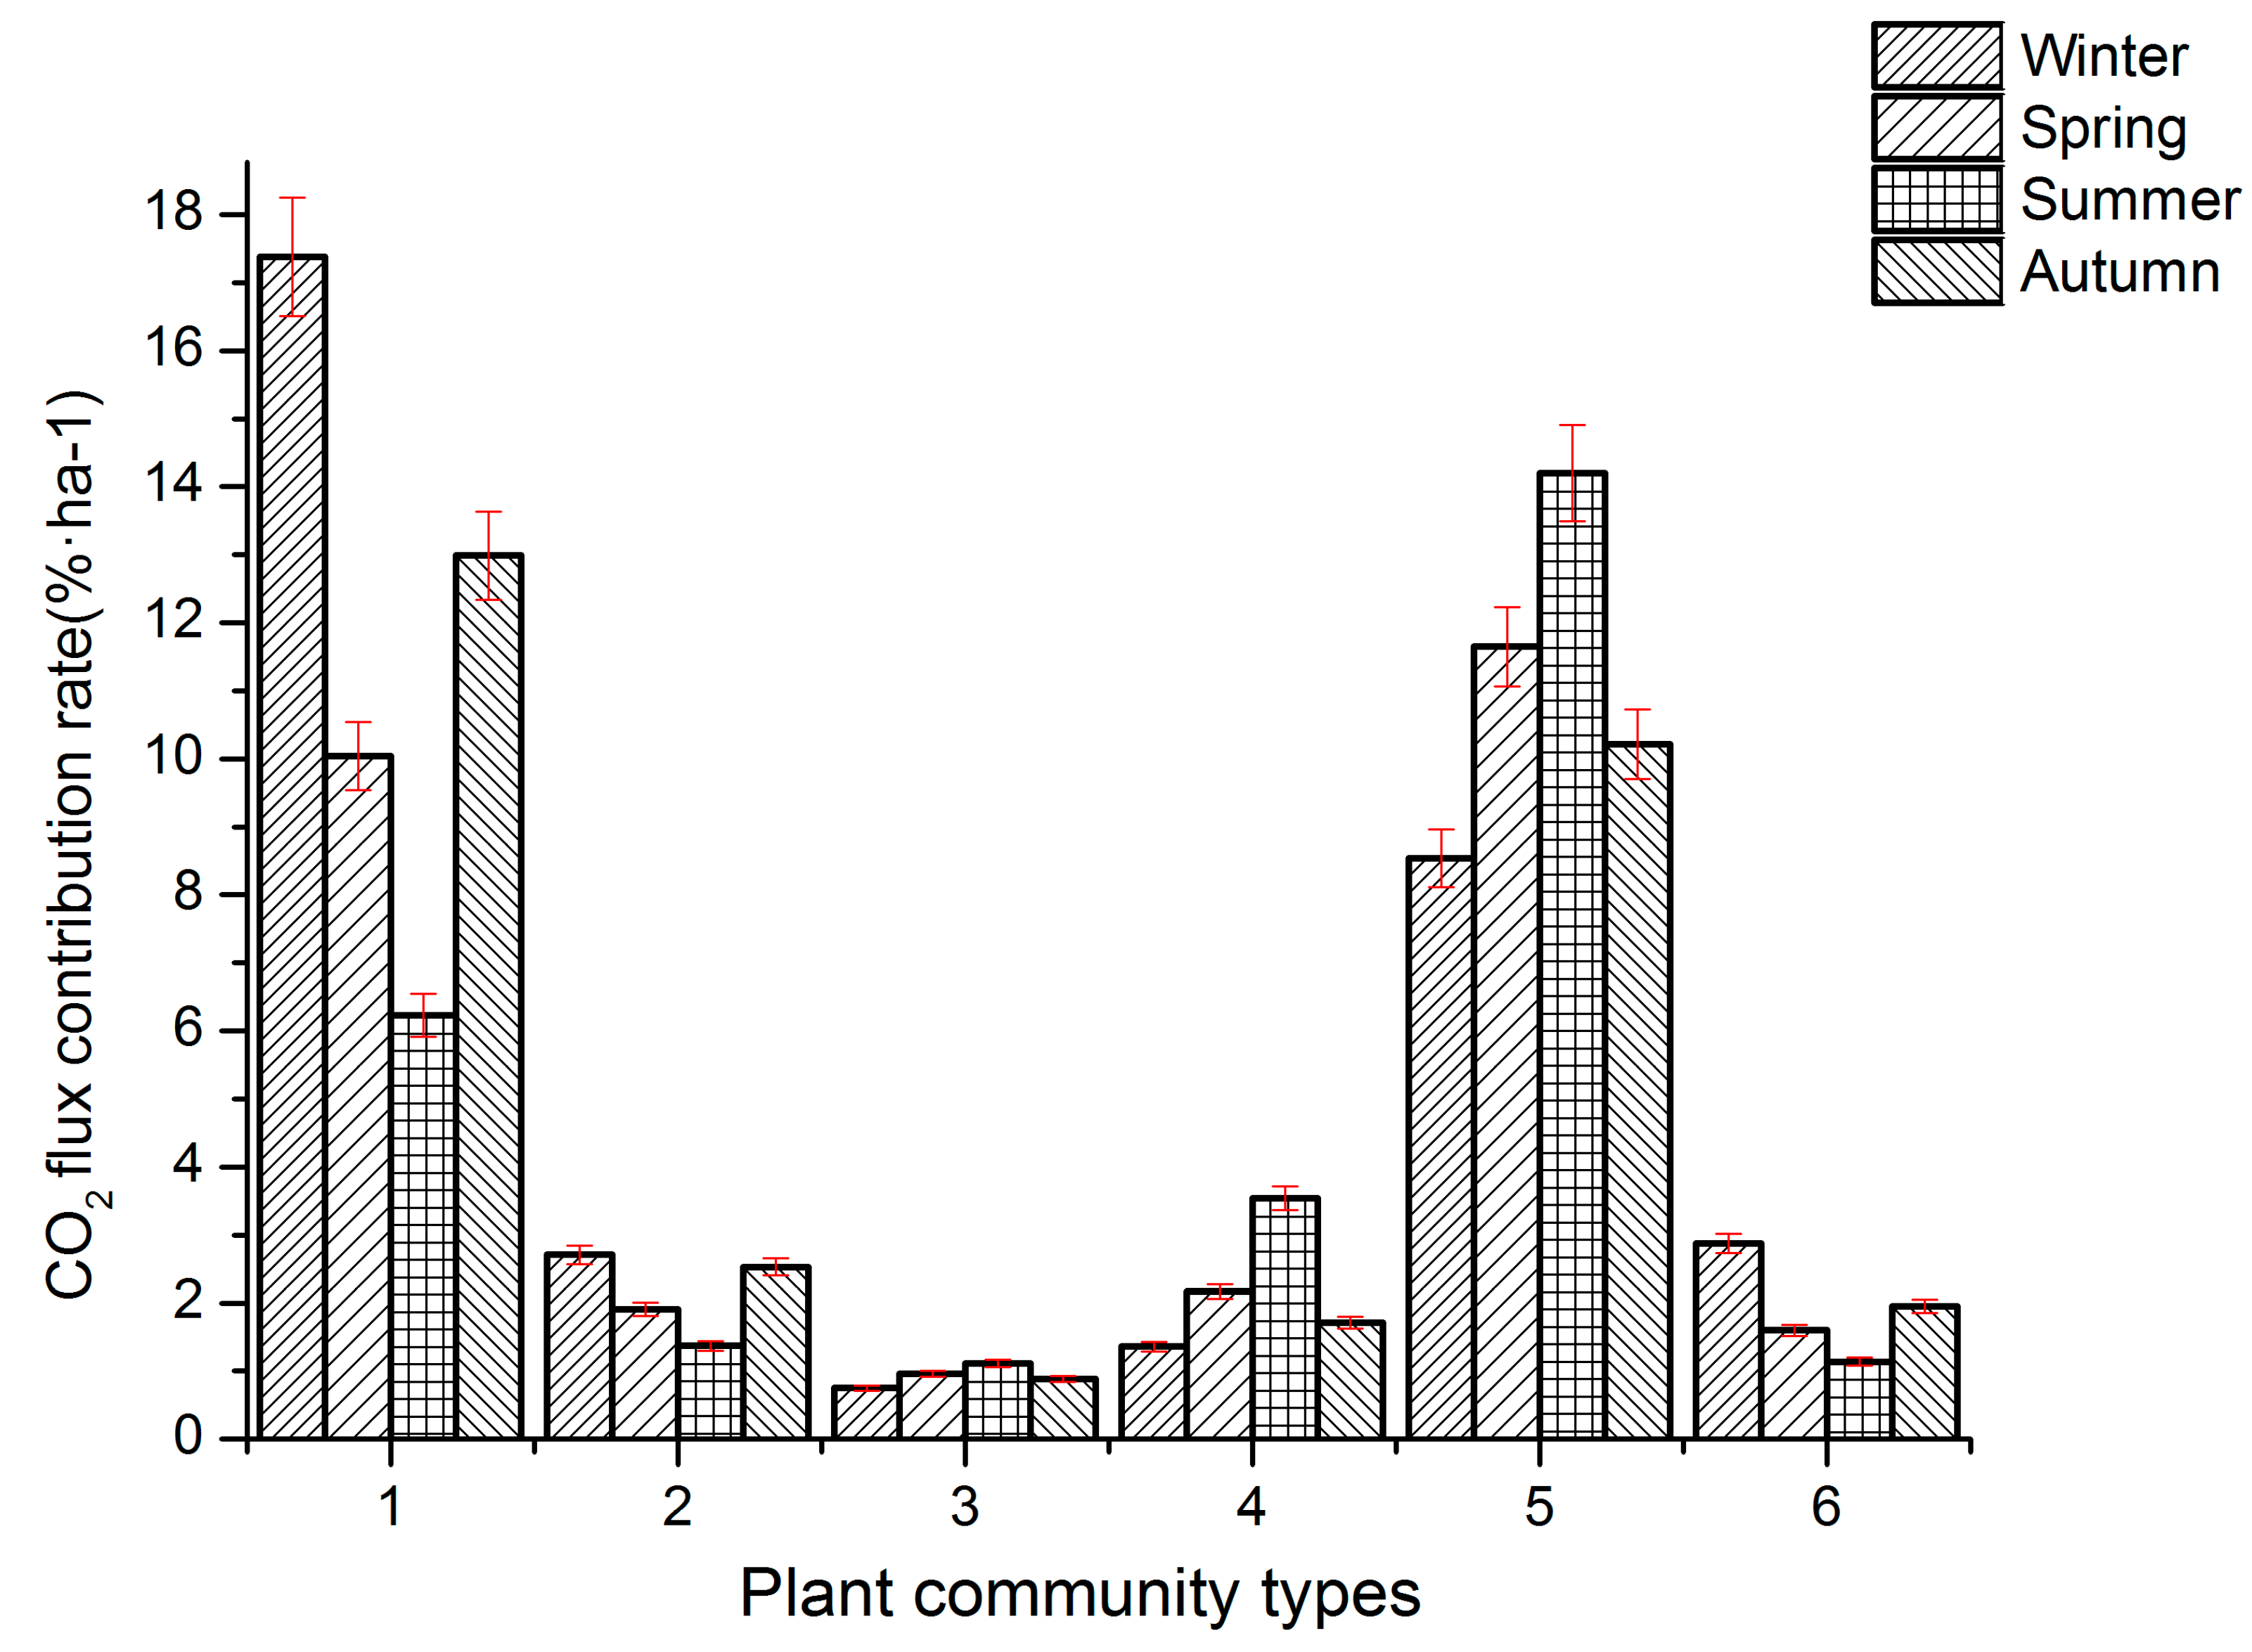
3.4. Seasonal Contribution Rates of CO2 Flux in Different Plant Communities

Studies have shown that the growth characteristics of vegetation change with climate change, and the carbon sequestration capacity of vegetation varies from season to season [35]. The flux contribution rate of ecosystems shares these characteristics. Therefore, the CO2 contribution rate of various plant communities in different seasons will be analyzed and compared. The results are shown in Figure 5. The results show that the CO2 flux contribution rate of different plant communities varies significantly according to season. The contributions of the Cinnamomum camphora-Trachycarpus fortunei community and the Cinnamomum camphora+Sabina chinensis community to the CO2 flux were much higher than the contributions of other communities regardless of the season. The Cinnamomum camphora-Trachycarpus fortunei community and the Cinnamomum camphora+Sabina chinensis community exhibited contribution rates of 17.38% and 14.20%, respectively. The results illustrate that the same plant community can contribute to CO2 flux at different rates depending on the season. For the Cinnamomum camphora-Trachycarpus fortunei community, the contribution rate was 17.38% in winter and 6.23% in summer, which is the largest discrepancy between the maximum and minimum contribution rates. The other three plant communities made small contributions to the CO2 flux regardless of the season.

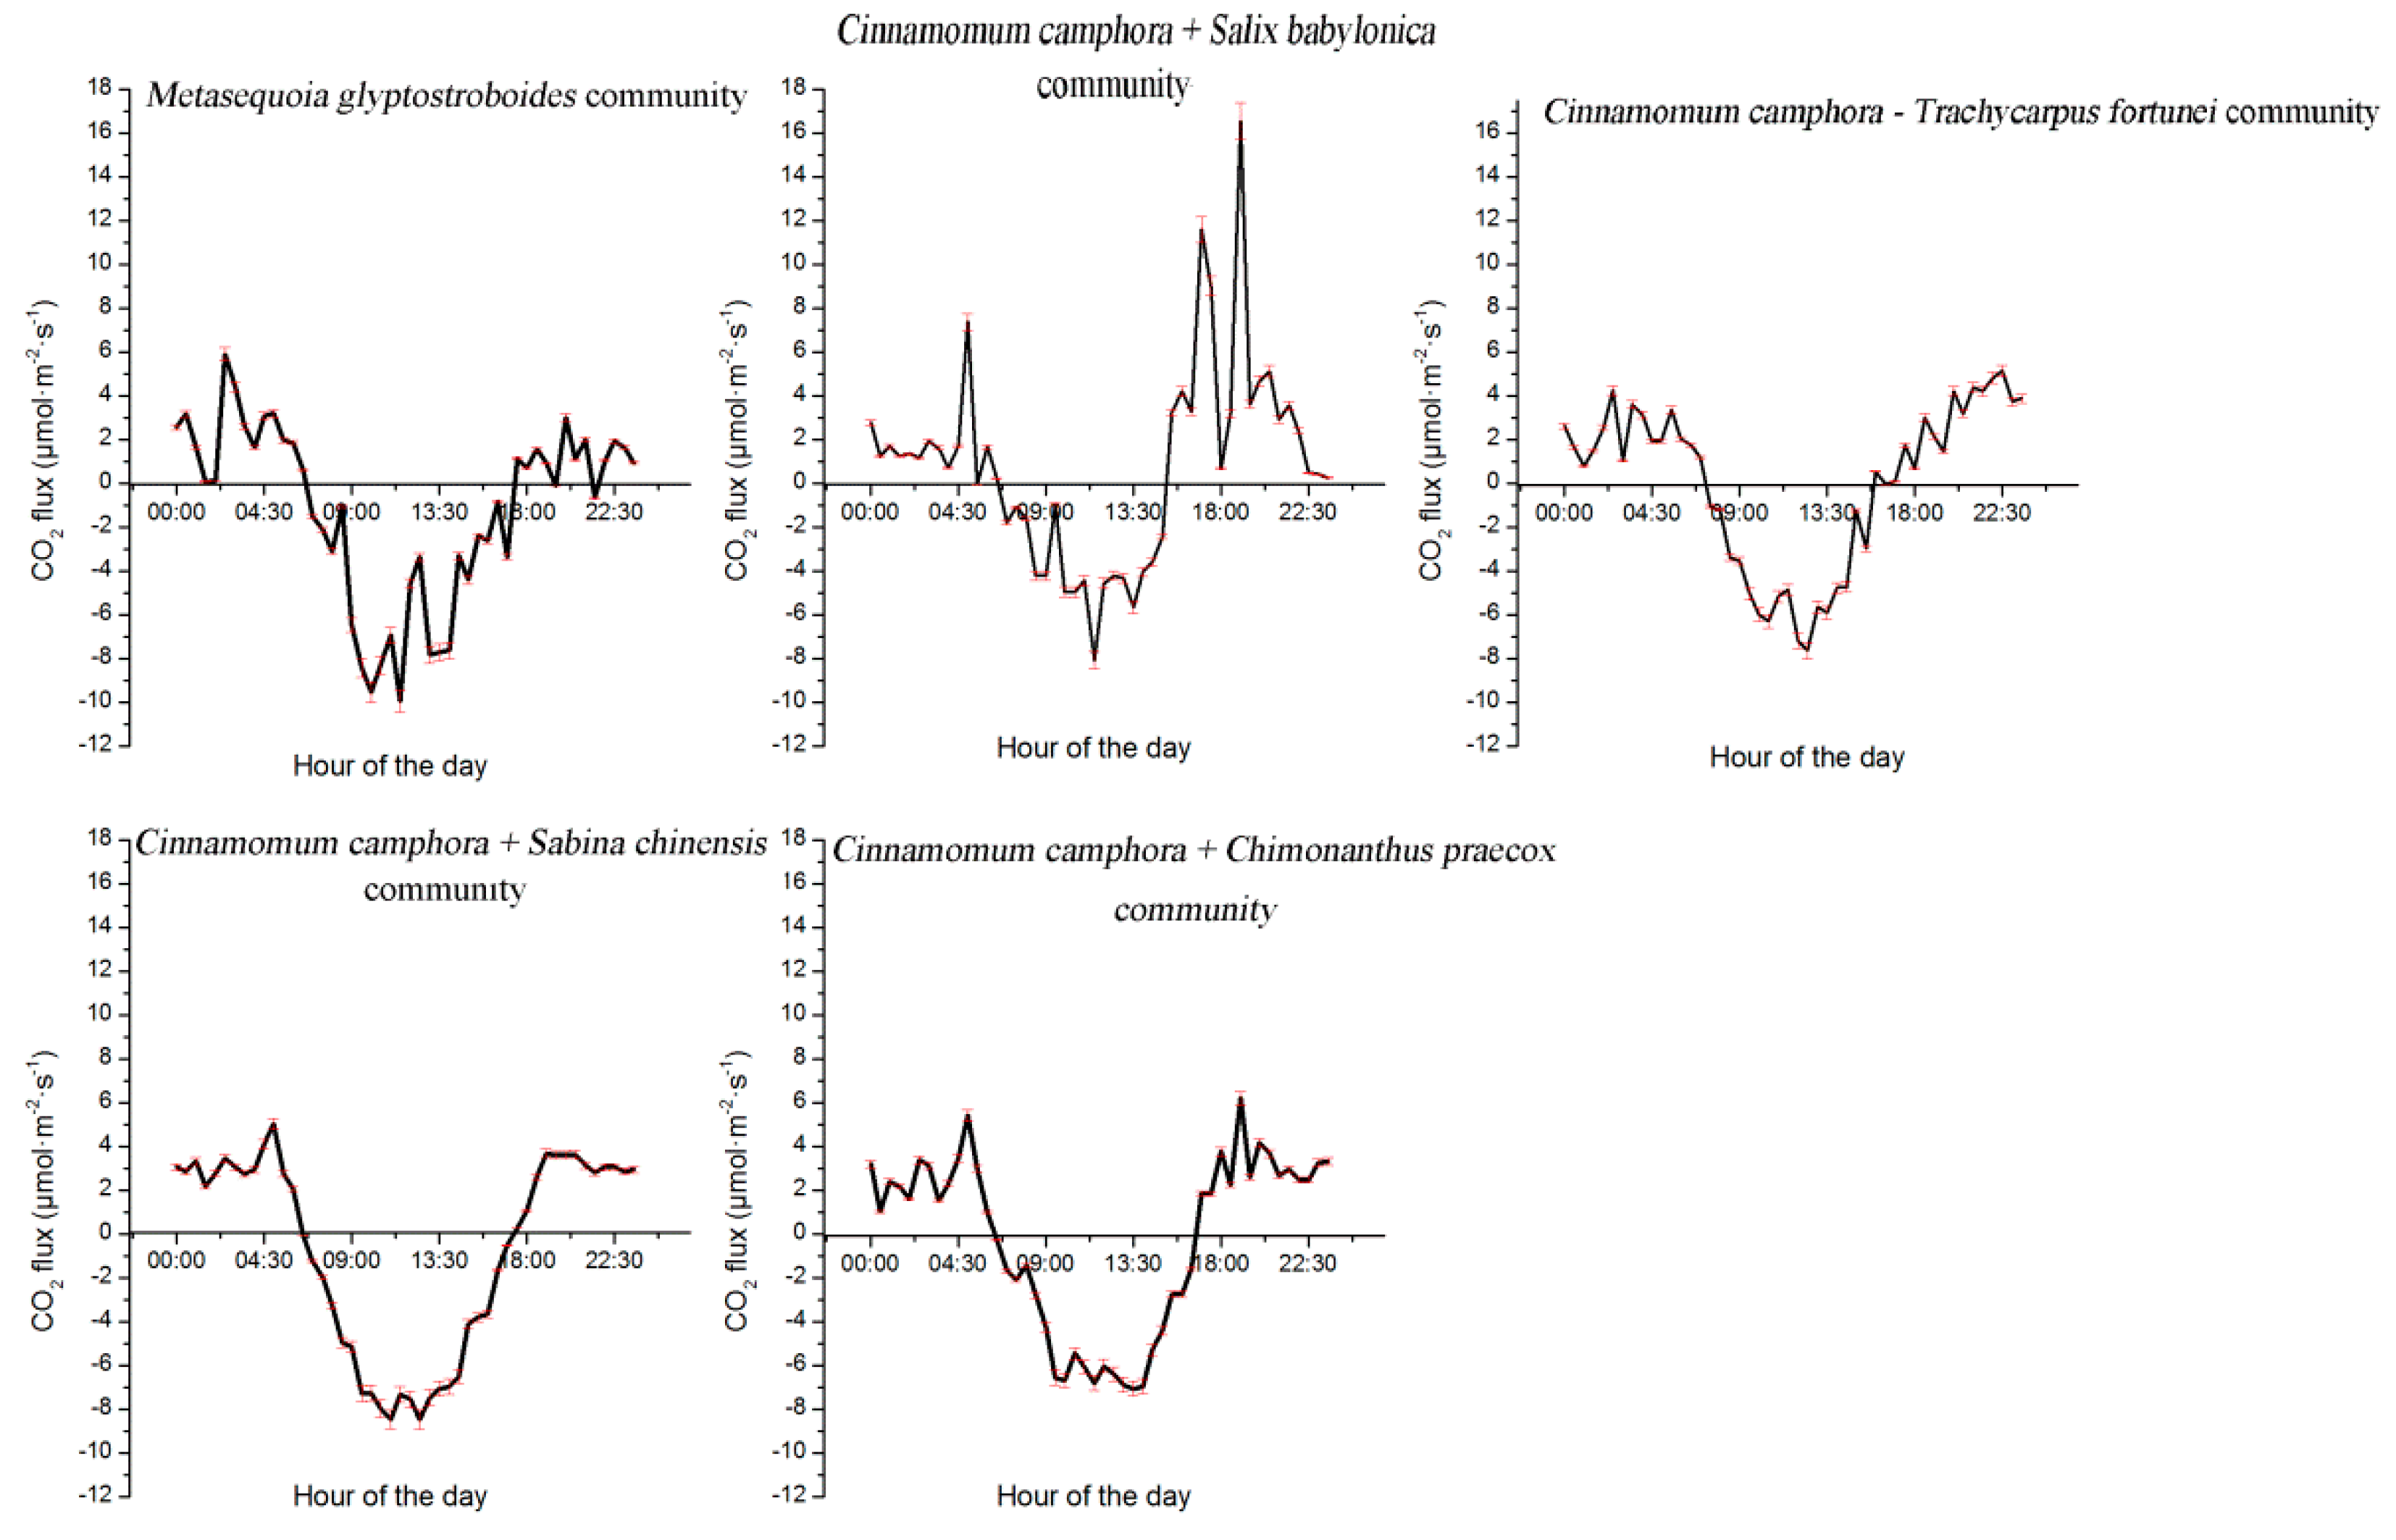
3.5. Variation Characteristics of CO2 Flux in Different Plant Communities

The variable photosynthetic ability of different plant communities implies that CO2 fluxes will differ between communities. Figure 4 and Figure 5 show that the contribution rates and CO2 fluxes differ between plant communities. Daily variation in CO2 flux for the different plant communities was determined by combining the CO2 flux footprint distribution data with a 90% contribution rate and the reported plant cover conditions. The data were processed and analyzed to obtain the results shown in Figure 6. The CO2 captured by the Sabina chinensis+Metasequoia glyptostroboides community was negligible. We therefore only analyzed the daily variation characteristics of CO2 flux for five plant communities.
Similar to the contribution rate, the CO2 flux of various plant communities differs in their dynamic changes, and peak values. The Cinnamomum camphora-Chimonanthus praecox community and the Cinnamomum camphora+Sabina chinensis community are dominated by the tree species Cinnamomum camphora, and most of the plants in these communities are evergreens. The daily variation dynamics of these two communities are roughly the same, but they differ in the value of their extrema. The diurnal variation of CO2 flux in the Cinnamomum camphora-Chimonanthus praecox community had a maximum flux of 6.21 μmol·m−2·s−1, and a minimum value of −7.05 μmol·m−2·s−1. The maximum value for the Cinnamomum camphora+Sabina chinensis community was 5.03 μmol·m−2·s−1, and the minimum value was −8.46 μmol·m−2·s−1. The diurnal variation of CO2 flux for the Metasequoia glyptostroboides community had a maximum value of 5.91 μmol·m−2·s−1 and a minimum value of −9.93 μmol·m−2·s−1 during the day. The maximum CO2 flux in one day was 16.55 μmol·m−2·s−1 at 19:00, and the minimum value was −8.07 μmol·m−2·s−1 at 11:30. The Cinnamomum camphora-Trachycarpus fortunei community is the community closest to the EC tower. Its dynamic characteristics can be used to explain the changes in CO2 fluxes of communities with similar composition, and it is very representative. In the daily dynamic change of this community, the maximum value is 5.15 μmol·m−2·s−1, and the minimum value is −7.61 μmol·m−2·s−1 at 12:30.

4. Discussion

This paper presents the characteristics of CO2 flux and the contribution of different plant community types to the CO2 flux in the city of Shanghai, China. To a certain extent, the results we obtained can represent the CO2 flux and the characteristics of CO2 flux contribution rates for vegetation in subtropical cities in China. The CO2 flux in this study is mainly distributed in the northeast-southeast direction, which is consistent with the findings of Gong and Guo [29,30,36].
The unique physiological characteristics of plants in certain ecosystems cause them to adopt different roles during different temporal periods. During the day, the photosynthetic intensity of plants is much higher than the respiratory intensity [37]. This photosynthetic activity acts as a carbon sink that absorbs CO2 in the ecosystem. During the night, plants in our study ecosystem respire but do not photosynthesize, and during this period, the plants act as a carbon source as CO2 is released into the ecosystem. The Cinnamomum camphora-Trachycarpus fortunei community and the Cinnamomum camphora+Sabina chinensis community always exhibited the highest contribution rates. This is mainly because Cinnamomum camphora leaves have a strong dust-repelling effect [38]. The stoma of a leaf will open when the temperature is too high, but the presence of dust on leaves will lower the amount of gas exchange at the leaf hole, resulting in a low CO2 contribution rate. At the same time, Trachycarpus fortunei is a tropical plant. Although it has been domesticated, excessively high and low temperatures will affect its growth and metabolism [39]. These effects will impact the flux contribution rate of the whole community. The CO2 flux contribution rates in these two communities are much higher than that of other communities, because these two communities have more diverse and abundant adult trees than other plant communities. These two communities are also the closest to the flux tower with trees that are densely spaced (Figure 1). The Cinnamomum camphora+Sabina chinensis community is located next to the canteen and rebuilding area, and the CO2 released by human activities and machines may flow into the plant community (Figure 1). The contribution to CO2 flux in this area is 2.21% higher than the average value. This means that the Cinnamomum camphora+Sabina chinensis community absorbs more carbon than it emits. This community absorbs the CO2 produced by its own community, and it also absorbs ambient CO2 introduced into the ecosystem.
Our results also show that the CO2 flux contribution rate of a plant community can differ between seasons. The Cinnamomum camphora-Trachycarpus fortunei community can best reflect the changes in plant growth phenology. In this community, the CO2 flux contribution rate was highest in winter and lowest in summer. This is because Cinnamomum camphora is a heliophilous evergreen tree species, and the respiration of plants in winter is more prominent. Therefore, the amount of CO2 released is higher than the amount absorbed, which makes the CO2 flux increase. The respiration of vegetation in summer is equivalent to the photosynthesis intensity, which can be seen from the CO2 flux contribution rate of the communities during the day and night (Section 3.3). The Metasequoia glyptostroboides community and the Cinnamomum camphora-Chimonanthus praecox community also exhibit the same seasonal changes as the Cinnamomum camphora-Trachycarpus fortunei community. The seasonal changes in the CO2 contribution rate for the Metasequoia glyptostroboides+Sabina chinensis community, the Cinnamomum camphora+Salix babylonica community, and the Cinnamomum camphora+Sabina chinensis community are different from those of the other three plant communities. For these communities, the largest contribution rates occur doing the summer, while the smallest rates occur in winter. The reason for this pattern is that summer is the best period for the growth of heliophilous and thermophilic plants such as Salix babylonica and Sabina chinensis, and this raises the contribution rate of CO2 flux.
Last, the CO2 flux in different plant community types in our study area has diverse characteristics of dynamic changes. The daily variation dynamics are roughly the same for plant communities that are primarily composed of evergreens with Cinnamomum camphora as the dominant species. These communities exhibit large discrepancies between extrema. The peak value between the minimum and maximum in Metasequoia glyptostroboides community is the largest. This community is proximate to a playground with a 400 m running track (Figure 1). There is a large flow of people in this area, providing material for photosynthesis in the Metasequoia glyptostroboides community during the day. The Cinnamomum camphora+Salix babylonica community only occupies the student dormitory and the public canteen, so the dynamic changes and peaks of community change follow the cycle of human activities (Figure 1). The absolute value of the peak during the day is significantly higher than the absolute value of the peak at night, indicating that the Cinnamomum camphora-Trachycarpus fortunei community can absorb the CO2 emitted by the plant community, as well as ambient CO2 present in the atmosphere. By comparing and analyzing the dynamic changes of daily CO2 flux in each plant community, we can clearly judge that the Metasequoia glyptostroboides community, the Cinnamomum camphora-Trachycarpus fortunei community and the Cinnamomum camphora+Sabina chinensis community have a good effect on CO2 absorption.
By comparing the contribution rate of the impervious layer calculated in previous studies with our study results, we can determine that the contribution of the impervious layer to the CO2 flux is smaller than the maximum contribution of plant communities (i.e., 17.25%) [29]. In Guo’s article, she calculated the CO2 flux contribution rate of different buildings in our study area. She concluded that the contribution rate of the canteen and student dormitory are high at 7.4% and 7.45%, respectively [29]. Although there are studies on the CO2 characteristics of different vegetation types, the research has not been conducted in the same geographical environment. For example, Chai Wei et al. studied the CO2 flux dynamics and its limiting factors in alpine shrub-meadow and steppe-meadow on the Qinghai-Xizang Plateau, and they selected data from two regions, the Haibei Shrub Meadow and Dangxiong Alpine Meadow, for analysis and comparison [40]. The analysis and comparison of different plant communities in the same study area in this paper can reduce the impact of different underlying surfaces, and no prior studies have adopted this approach. However, the difference in CO2 flux footprint distribution in different wind directions will have a certain impact on the results [41,42]. Furthermore, the footprint data in different wind sectors also influence our data analysis because the quantity of the data may vary. Researchers can use the results of our study to consider the carbon response of different tree species instead of calculating the biomass of trees via the allometric growth model to estimate the carbon storage for a certain period of time. Of course additional time series will be needed to produce more accurate results. However, our results will be useful within a certain error range. Our results suggest that city departments should incorporate more Cinnamomum camphora-Trachycarpus fortunei communities and Metasequoia glyptostroboides communities during green space planning. Incorporating adult Sabina chinensis can also help reduce CO2 in the atmosphere. But, in any ecosystem, the form of CO2 emissions from vegetation into the atmosphere also includes the decay of fallen leaves, broken branches, herbs, etc. The amount of CO2 produced by these emission forms should be included in the future carbon cycle research. The research results of this paper can provide a scientific basis for future studies of CO2 flux characteristics of different plants and provide a reference for urban low-carbon greening projects.

Author Contributions

Conceptualization, K.Z. and Y.G.; methodology, K.Z. and M.Z.; software, K.Z. and Y.G.; validation, K.Z., Y.G. and M.Z.; formal analysis, K.Z.; investigation, K.Z. and Y.G.; resources, K.Z. and H.F.; data curation, K.Z. and H.F.; writing—original draft preparation, K.Z.; writing—review and editing, K.Z. and M.Z.; visualization, K.Z. and Y.G.; supervision, M.Z.; project administration, M.Z.; funding acquisition, M.Z., please turn to the CRediT taxonomy for the term explanation.

Funding

This research was funded by the National Natural Science Foundation of China, grant number 31100354 and the APC was funded by National Natural Science Foundation of China.

Acknowledgments

We thank Jiemin Wang from the Northwest Institute of Eco-Environment and Resources, Chinese Academy of Sciences for the guidance on the use of footprint models.

Conflicts of Interest

The authors declare no conflicts of interest

References

  1. Velasco, E.; Perrusquia, R.; Jiménez, E.; Hernández, F.; Camacho, P.; Rodríguez, S.; Retama, A.; Molina, L.T. Sources and sinks of carbon dioxide in a neighborhood of Mexico City. Atmos. Environ. 2014, 97, 226–238. [Google Scholar] [CrossRef]
  2. Lal, R. Urban Ecosystems and Climate Change; Springer: Dordrecht, The Netherlands, 2012; pp. 3–19. [Google Scholar]
  3. Wang, Z.; Wang, Y. Carbon flux dynamics and its environmental controlling factors in a desert steppe. Acta Ecol. Sin. 2011, 31, 49–54. [Google Scholar] [CrossRef]
  4. Baldocchi, D. ‘Breathing’ of the terrestrial biosphere: Lessons learned from a global network of carbon dioxide flux measurement systems. Aust. J. Bot. 2008, 56, 1–26. [Google Scholar] [CrossRef]
  5. Rodda, S.; Thumaty, K.; Jha, C.; Dadhwal, V. Seasonal Variations of Carbon Dioxide, Water Vapor and Energy Fluxes in Tropical Indian Mangroves. Forests 2016, 7, 35. [Google Scholar] [CrossRef]
  6. Neftel, A.; Spirig, C.; Ammann, C. Application and test of a simple tool for operational footprint evaluations. Environ. Pollut. 2008, 152, 644–652. [Google Scholar] [CrossRef] [PubMed]
  7. Du, Q.; Liu, H.; Xu, L. Evaluating of simulated carbon flux phenology over a cropland ecosystem in a semiarid area of China with SiBcrop. Int. J. Biometeorol. 2017, 61, 247–258. [Google Scholar] [CrossRef] [PubMed]
  8. Gahagan, A.; Giardina, C.P.; King, J.S.; Binkley, D.; Pregitzer, K.S.; Burton, A.J. Carbon fluxes, storage and harvest removals through 60 years of stand development in red pine plantations and mixed hardwood stands in Northern Michigan, USA. For. Ecol. Manag. 2015, 337, 88–97. [Google Scholar] [CrossRef]
  9. Hammerle, A.; Haslwanter, A.; Schmitt, M.; Bahn, M.; Tappeiner, U.; Cernusca, A.; Wohlfahrt, G. Eddy covariance measurements of carbon dioxide, latent and sensible energy fluxes above a meadow on a mountain slope. Bound. Layer Meteorol. 2007, 122, 397–416. [Google Scholar] [CrossRef] [PubMed]
  10. Dou, X.; Yang, Y. Modeling and Predicting Carbon and Water Fluxes Using Data-Driven Techniques in a Forest Ecosystem. Forests 2017, 8, 498. [Google Scholar] [CrossRef]
  11. Bergeron, O.; Strachan, I.B. CO2 sources and sinks in urban and suburban areas of a northern mid-latitude city. Atmos. Environ. 2011, 45, 1564–1573. [Google Scholar] [CrossRef]
  12. Ramamurthy, P.; Pardyjak, E.R. Toward understanding the behavior of carbon dioxide and surface energy fluxes in the urbanized semi-arid Salt Lake Valley, Utah, USA. Atmos. Environ. 2011, 45, 73–84. [Google Scholar] [CrossRef]
  13. Khatib, H. IEA World Energy Outlook 2011—A comment. Energy Policy 2012, 48, 737–743. [Google Scholar] [CrossRef]
  14. Bellucco, V.; Marras, S.; Grimmond, C.S.B.; Järvi, L.; Sirca, C.; Spano, D. Modelling the biogenic CO2 exchange in urban and non-urban ecosystems through the assessment of light-response curve parameters. Agric. For. Meteorol. 2017, 236, 113–122. [Google Scholar] [CrossRef]
  15. Ward, H.C.; Evans, J.G.; Grimmond, C.S.B. Multi-season eddy covariance observations of energy, water and carbon fluxes over a suburban area in Swindon, UK. Atmos. Chem. Phys. 2013, 13, 4645–4666. [Google Scholar] [CrossRef] [Green Version]
  16. Christen, A.; Coops, N.C.; Crawford, B.R.; Kellett, R.; Liss, K.N.; Olchovski, I.; Tooke, T.R.; van der Laan, M.; Voogt, J.A. Validation of modeled carbon-dioxide emissions from an urban neighborhood with direct eddy-covariance measurements. Atmos. Environ. 2011, 45, 6057–6069. [Google Scholar] [CrossRef]
  17. Crawford, B.; Grimmond, C.S.B.; Christen, A. Five years of carbon dioxide fluxes measurements in a highly vegetated suburban area. Atmos. Environ. 2011, 45, 896–905. [Google Scholar] [CrossRef]
  18. Grimmond, C.S.B.; King, T.S.; Cropley, F.D.; Nowak, D.J.; Souch, C. Local-scale fluxes of carbon dioxide in urban environments: Methodological challenges and results from Chicago. Environ. Pollut. 2002, 116, S243–S254. [Google Scholar] [CrossRef]
  19. Velasco, E.; Roth, M. Cities as Net Sources of CO2: Review of Atmospheric CO2 Exchange in Urban Environments Measured by Eddy Covariance Technique. Geogr. Compass 2010, 4, 1238–1259. [Google Scholar] [CrossRef]
  20. Gu, L.; Zhou, Y.; Mei, T.; Zhou, G.; Xu, L. Carbon Footprint Analysis of Bamboo Scrimber Flooring—Implications for Carbon Sequestration of Bamboo Forests and Its Products. Forests 2019, 10, 51. [Google Scholar] [CrossRef]
  21. Christen, A. Atmospheric measurement techniques to quantify greenhouse gas emissions from cities. Urban Clim. 2014, 10, 241–260. [Google Scholar] [CrossRef]
  22. Weissert, L.F.; Salmond, J.A.; Schwendenmann, L. A review of the current progress in quantifying the potential of urban forests to mitigate urban CO2 emissions. Urban Clim. 2014, 8, 100–125. [Google Scholar] [CrossRef]
  23. Grimmond, C.S.B.; Christen, A. Flux measurements in urban ecosystems. FluxLetter 2012, 5, 1–8. [Google Scholar]
  24. Velasco, E.; Roth, M.; Norford, L.; Molina, L.T. Does urban vegetation enhance carbon sequestration? Landsc. Urban Plan. 2016, 148, 99–107. [Google Scholar] [CrossRef]
  25. Velasco, E.; Roth, M.; Tan, S.H.; Quak, M.; Nabarro, S.D.A.; Norford, L. The role of vegetation in the CO2 flux from a tropical urban neighbourhood. Atmos. Chem. Phys. 2013, 13, 10185–10202. [Google Scholar] [CrossRef]
  26. Coutts, A.M.; Beringer, J.; Tapper, N.J. Characteristics influencing the variability of urban CO2 fluxes in Melbourne, Australia. Atmos. Environ. 2007, 41, 51–62. [Google Scholar] [CrossRef]
  27. Vesala, T.; Järvi, L.; Launiainen, S.; Sogachev, A.; Rannik, U.; Mammarella, I.; Siivola, E.; Keronen, P.; Rinne, J.; Riikonen, A.; et al. Surface—Atmosphere interactions over complex urban terrain in Helsinki, Finland. Tellus Ser. B-Chem. Phys. Meteorol. 2008, 60B, 188–199. [Google Scholar] [CrossRef]
  28. Song, T.; Wang, Y. Carbon dioxide fluxes from an urban area in Beijing. Atmos. Res. 2012, 106, 139–149. [Google Scholar] [CrossRef]
  29. Guo, Z.J.; Gong, Y.; Zhang, K.D.; Zhang, L.P.; He, Y.; Xu, L.; Zhao, M. CO2 flux footprints of impervious layer on complex land surface: A case study at the Fengxian College Park, Shanghai. Acta Sci. Circumstantiae 2018, 38, 772–779. [Google Scholar]
  30. Gong, Y.; Zhao, M.; Yao, X.; Guo, Z.J.; He, Y.; Zhang, L.P. Analysis and comparison of carbon flux contribution zones in urban ecological system based on Hsieh and Kljun models. J. Environ. Eng. Technol. 2017, 7, 225–231. [Google Scholar]
  31. Zhang, K.D.; Gong, Y.; Guo, Z.J.; Wei, Y.Y.; Yao, G.F.; Xu, L.; Zhao, M. Flux source area and CO2 flux characteristics of subtropical urban ecosystem in 2011 and 2016: A case study of Shanghai Fengxian University City. J. Shanghai Norm. Univ. (Nat. Sci.) 2018, 47, 458–465. [Google Scholar]
  32. Wu, Z.Y. China Vegetation; Science Press: Beijing, China, 1980; ISBN 9787030024220. [Google Scholar]
  33. Liu, Y.F.; Song, X.; Yu, G.R.; Sun, X.M.; Wen, X.F.; Chen, Y.R. Seasonal variation of CO2 flux and its environmental factors in evergreen coniferous plantation. Sci. China (Ser. D Earth Sci.) 2005, 48, 123–132. [Google Scholar]
  34. Kljun, N.; Calanca, P.; Rotach, M.W.; Schmid, H.P. A simple parameterisationfor flux footprint predictions. Bound. Layer Meteorol. 2004, 112, 503–523. [Google Scholar] [CrossRef]
  35. Gu, L.; Post, W.M.; Baldocchi, D.D.; Black, T.A.; Suyker, A.E.; Verma, S.B.; Vesala, T.; Wofsy, S.C. Characterizing the Seasonal Dynamics of Plant Community Photosynthesis Across a Range of Vegetation Types; Springer: New York, NY, USA, 2009; pp. 35–58. [Google Scholar]
  36. Gong, Y. A Study on Spatial Differentiation of Carbon Flux Based on Footprint Model: A Case Study of Fengxian University City in Shanghai. Master’s Thesis, Shanghai Normal University, Shanghai, China, 2017. [Google Scholar]
  37. Pan, R.Z. Plant Physiology, 6th ed.; Higher Education Press: Beijing, China, 2008; ISBN 7040239744. [Google Scholar]
  38. Zhang, C.H. Ecological habits and cultivation techniques of camphor. Mod. Agric. Technol. 2012, 195–222. [Google Scholar] [CrossRef]
  39. Fu, R.S.; Huang, X.L.; Luo, W.X.; Chen, S.L.; Huang, Q.P. Ecological habits and reproduction of foliage plants in palm family. Fujian J. Agric. Sci. 1999, 14, 80–84. [Google Scholar]
  40. Chai, X.; Li, Y.N.; Duan, C.; Zhang, T.; Zong, N.; Shi, P.L.; He, Y.T.; Zhang, X.Z. CO2 flux dynamics and its limiting factors in the alpine shrub-meadow and steppe-meadow on the Qinghai-Xizang Plateau. Chin. J. Plant Ecol. 2018, 42, 6–19. [Google Scholar]
  41. Gong, Y.; Guo, Z.J.; Zhang, K.D.; Xu, L.; Wei, Y.Y.; Zhao, M. Impact of vegetation on CO2 flux of a subtropical urban ecosystem. Acta Ecol. Sin. 2019, 39, 530–541. [Google Scholar]
  42. Gong, Y.; Zhao, M.; Yao, X.; Guo, Z.J.; He, Y.; Zhang, L.P.; Lin, W.P. Study on carbon flux characteristics of the underlying surface of urban ecosystem-a case study of Shanghai Fengxian University City. Resour. Environ. Yangtze Basin 2017, 26, 91–99. [Google Scholar]
Figure 1. The location of the study area, land use map of the research area, and plant community distribution: (1) Cinnamomum camphora-Trachycarpus fortunei community distribution, (2) Metasequoia glyptostroboides community distribution, (3) Metasequoia glyptostroboides+Sabina chinensis community distribution, (4) Cinnamomum camphora+Salix babylonica community distribution, (5) Cinnamomum camphora+Sabina chinensis community distribution, (6) Cinnamomum camphora+Chimonanthus praecox community distribution.
Sustainability 11 04879 g001
Figure 2. (a) Wind rose of the study area and (b) distribution of CO2 flux farthest from the eddy covariance station.
Sustainability 11 04879 g002
Figure 3. The dynamics of CO2 flux in the study area from November 2016 to October 2017.
Sustainability 11 04879 g003
Figure 4. The CO2 flux contribution rate of (1) the Cinnamomum camphora-Trachycarpus fortunei community, (2) the Metasequoia glyptostroboides community, (3) the Metasequoia glyptostroboides+Sabina chinensis community, (4) the Cinnamomum camphora+Salix babylonica community, (5) the Cinnamomum camphora+Sabina chinensis community, (6) the Cinnamomum camphora+Chimonanthus praecox community.
Sustainability 11 04879 g004
Figure 5. The CO2 flux contribution rate of different plant communities in different seasons (1) the Cinnamomum camphora-Trachycarpus fortunei community, (2) the Metasequoia glyptostroboides community, (3) the Metasequoia glyptostroboides+Sabina chinensis community, (4) the Cinnamomum camphora+Salix babylonica community, (5) the Cinnamomum camphora+Sabina chinensis community, (6) the Cinnamomum camphora+Chimonanthus praecox community.
Sustainability 11 04879 g005
Figure 6. Diurnal dynamics of CO2 fluxes in different plant communities.
Sustainability 11 04879 g006

