Sustainable Development of Urban Green Areas for Quality of Life Improvement—Argument for Increased Citizen Participation
Abstract
1. Introduction
2. The Need for Sustainable Urban Transformation
3. Citizens’ Participation in Decision-Making Process for Urban Sustainable Development
- Governments and their representatives make available all the information needed for the citizen to get informed about the latest policies. This form implies only a passive involvement of the citizen who just acknowledges the changes and whatever is important to them, but has no chance to switch to an active role in the decision-making process;
- Beyond just being informed, citizens’ have the opportunity to share with their representatives their feedback on different policies and decisions;
- Genuine citizens’ involvement implies creating the setting for collaboration and partnership with the government and its representatives, a setting where citizens practically engage in the decision- and policy-making process.
4. The Role of Parks in Quality of Life Improvement
5. QoL–Definition, Dimensions, Measurement
- Material living conditions (income, consumption and material conditions);
- Productive or main activity (quantity and quality of employment and other main activities);
- Physical and/or mental health (health outcome indicators and determinants);
- Education (population’s educational completion, skills, participation in life-long learning and opportunities for education);
- Leisure and social interactions;
- Safety—economic and physical (job retention or loss, health problems, aging, global financial and economic crisis, violence and/or crime);
- Governance and basic rights (trust in institutions and public services; discrimination and equal opportunities and active citizenship);
- Natural and living environment (air and water accessibility, noise pollution);
- Overall experience of life (life satisfaction—cognitive appreciation; affect—a person’s feelings or emotional states, both positive and negative; and eudaemonic—a sense of having meaning and purpose in one’s life, or good psychological functioning).
6. Park Visitors Survey
6.1. Research Methodology
- Degree of perceived association between QoL dimensions and park visit;
- Mental associations made with parks by their visitors (the first thing that comes to their mind when thinking about a specific park);
- Visiting parks habits (frequency and duration of the visit);
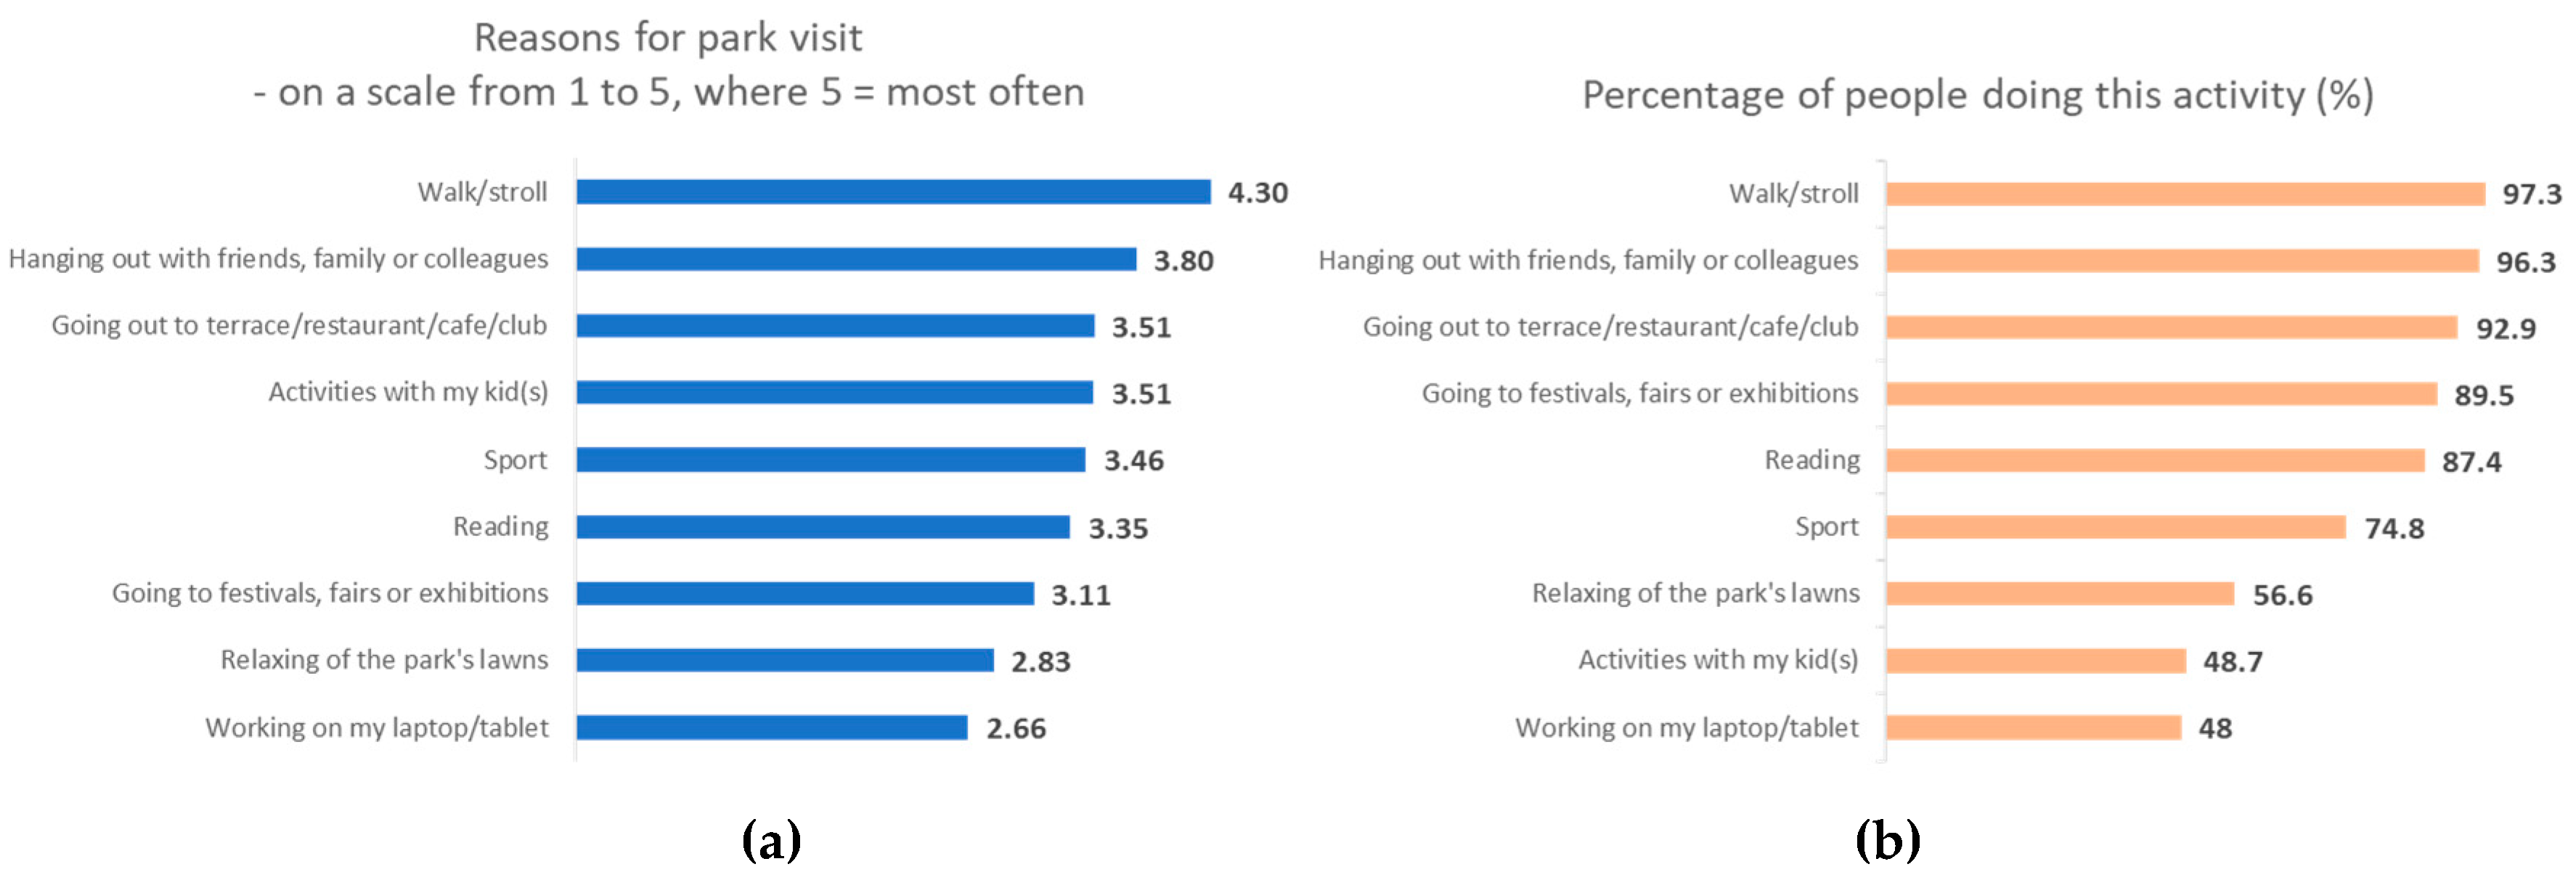
- Reasons to visit parks;
- Factors that will lead to an increased frequency of park visits.
6.2. Research Results
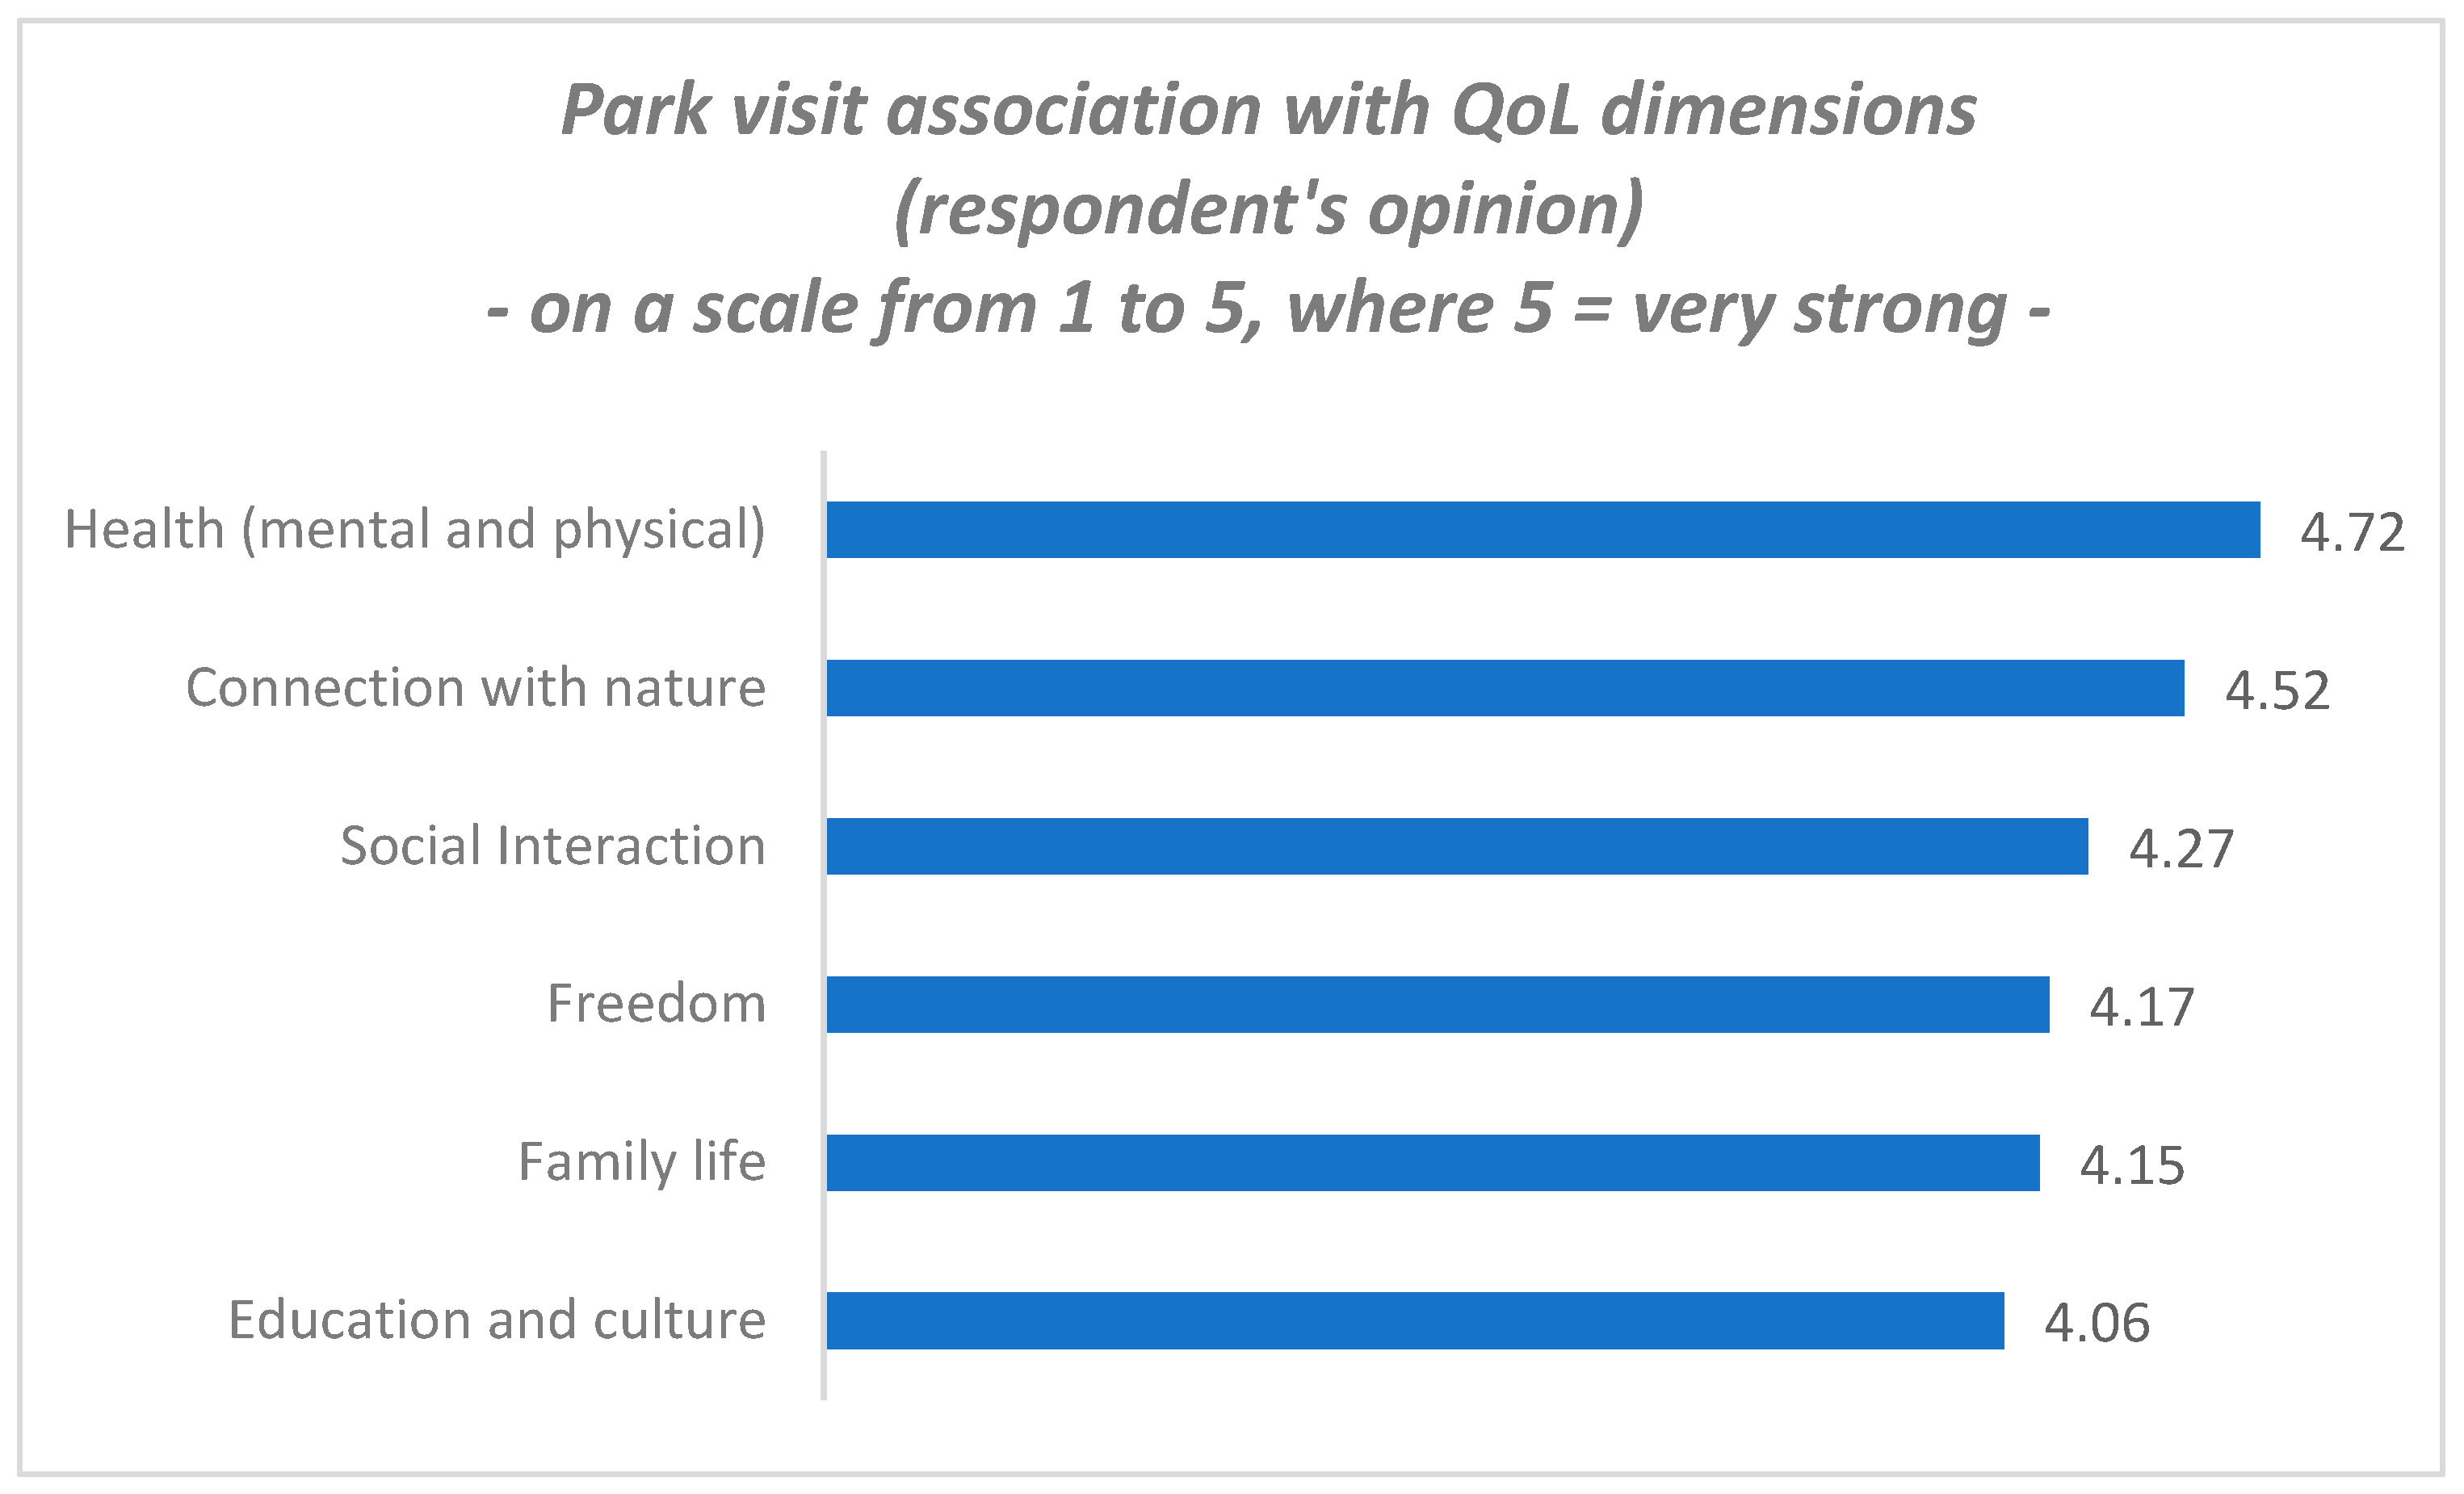
- Very strong association with health and nature;
- Strong association with social interaction, freedom, family life, as well as education and culture.
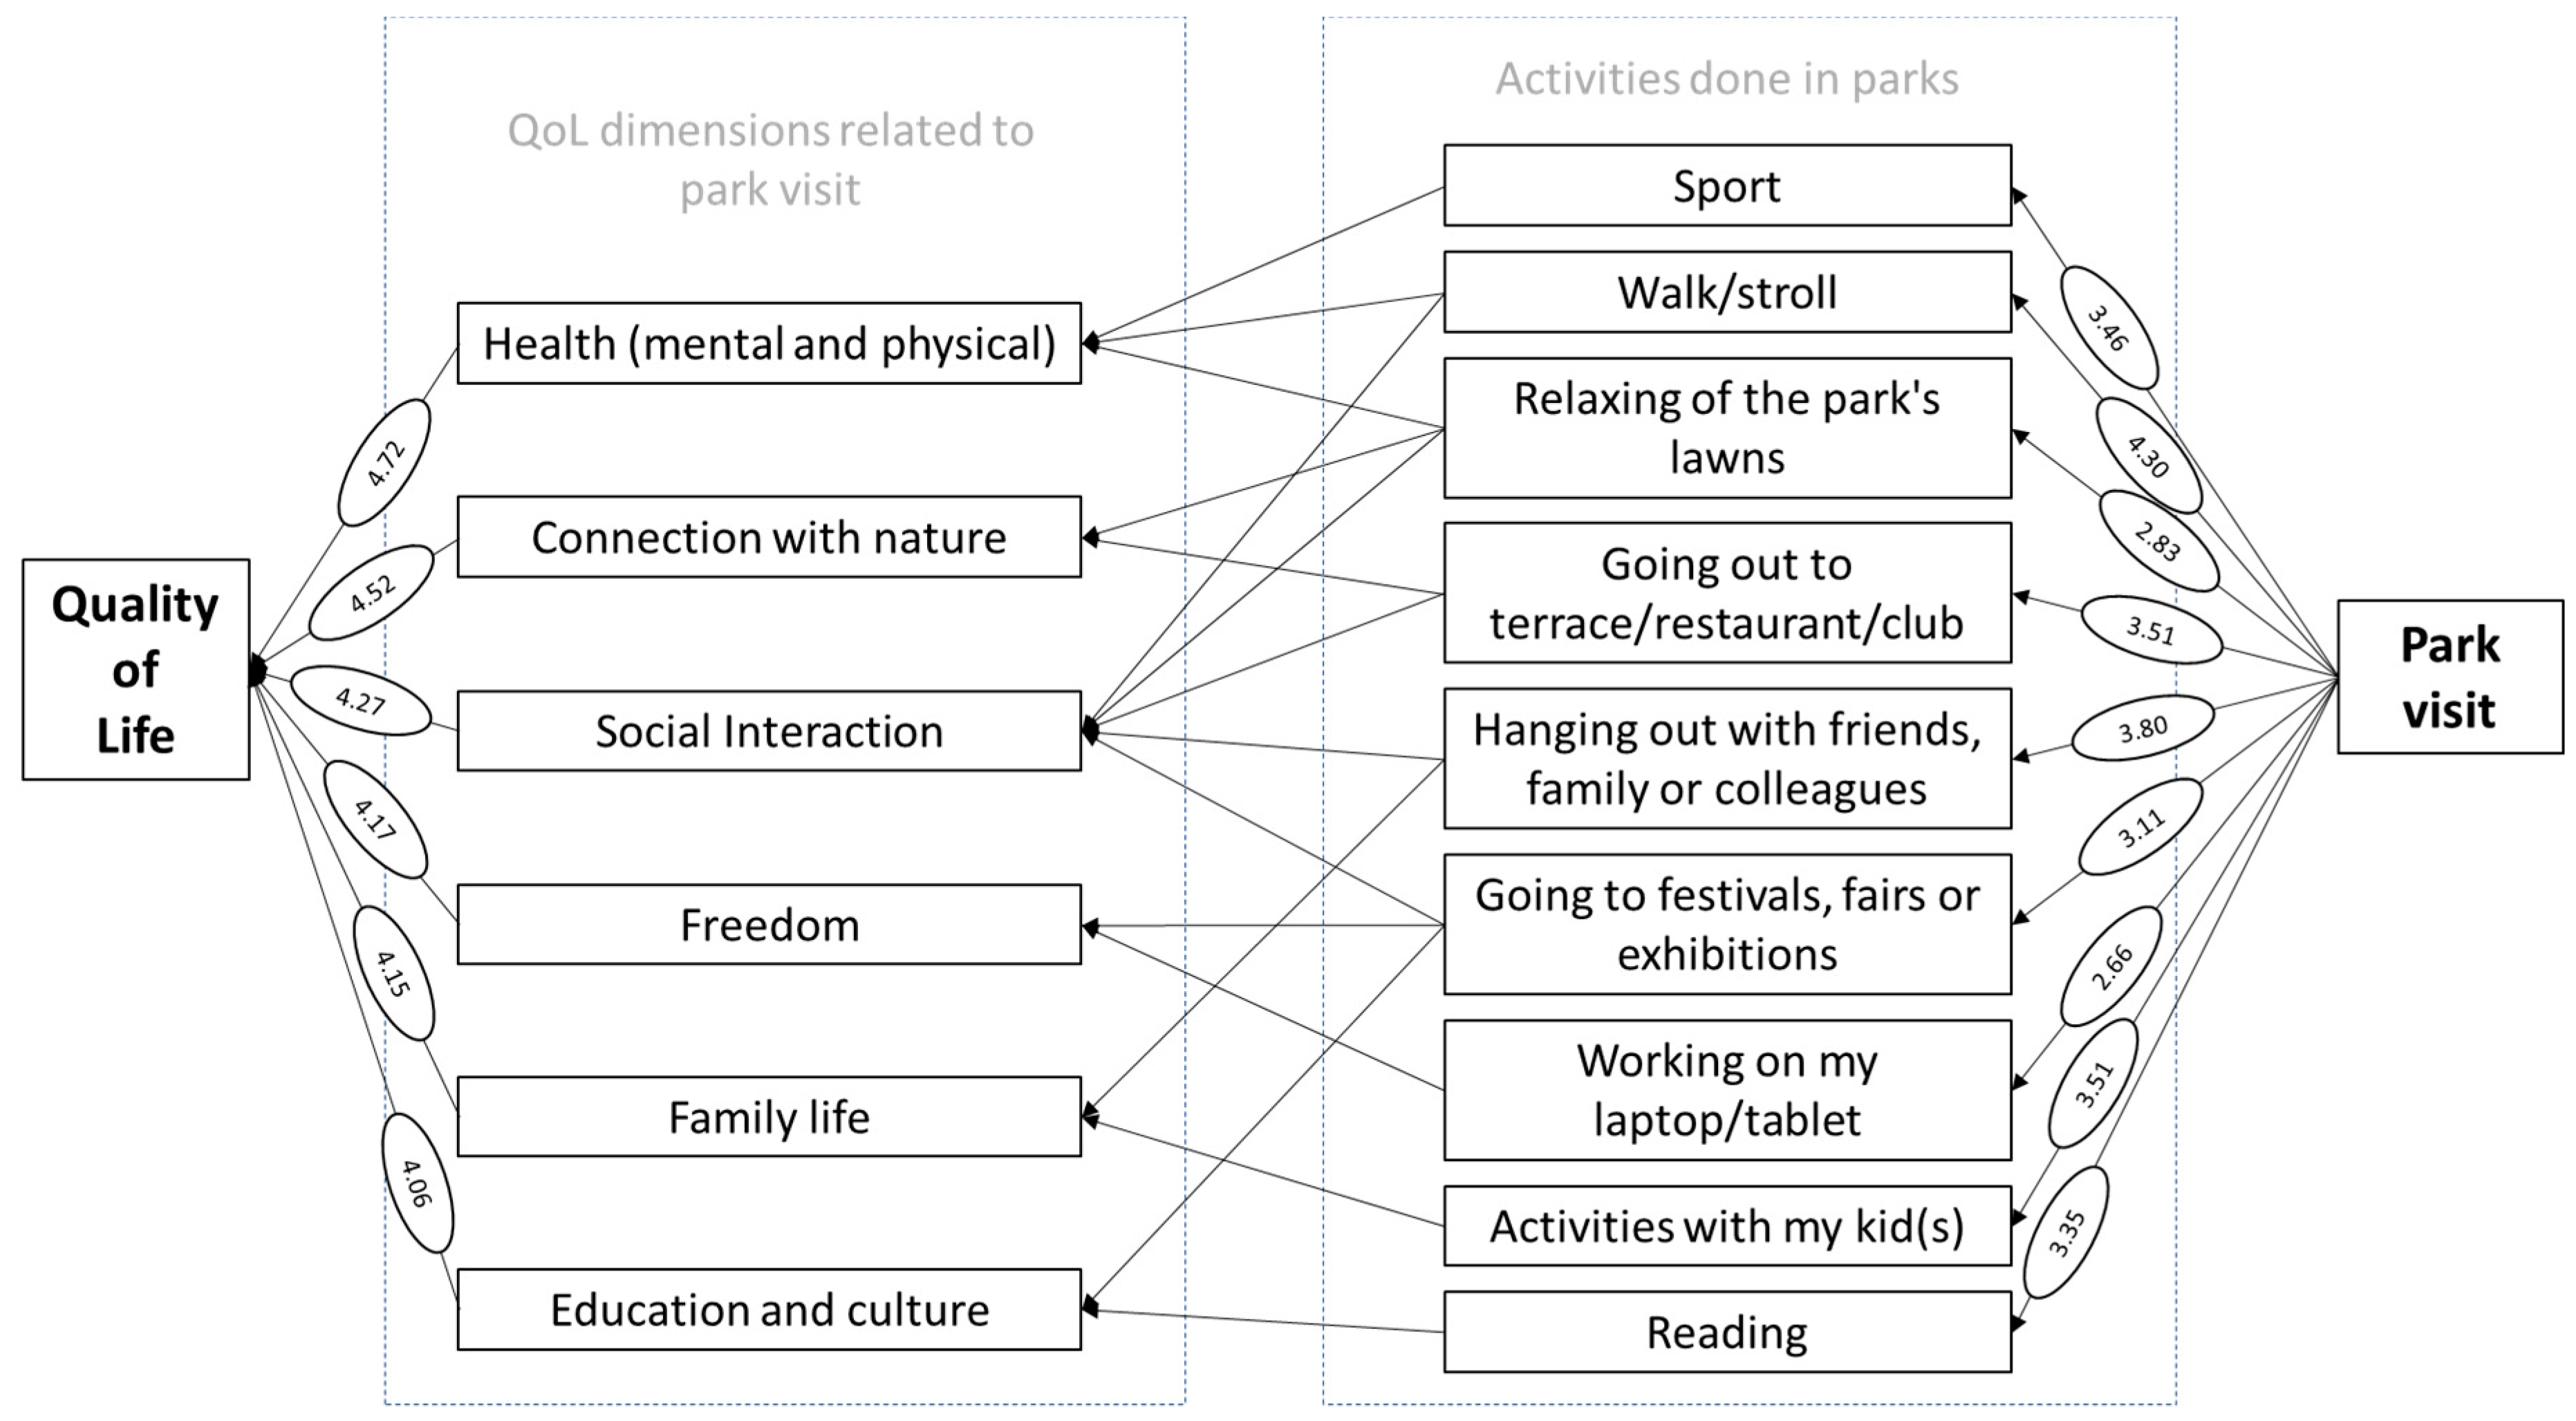
- Health (mental and physical)—sport, walk/stroll and relaxing on park’s lawns
- Connection with nature—relaxing on park’s lawns and going out to terrace/restaurant/club
- Social interaction—walk/stroll, relaxing on park’s lawns, going out to terrace/restaurant/club, hanging out with friends, family or colleagues and going to festivals, fairs or exhibitions
- Freedom—going to festivals, fairs or exhibitions and working on my laptop/tablet
- Family life—hanging out with friends, family or colleagues and activities with my kid(s)
- Education and culture—going to festivals, fairs or exhibitions and reading.
7. Public Policy Recommendations
8. Conclusions, Practical Implications and Future Research Directions
Author Contributions
Funding
Conflicts of Interest
References
- Waters, J. Accessible cities: From urban density to multidimensional accessibility. In Rethinking Sustainable Cities: Accessible, Green and Fair; Simon, D., Ed.; Bristol University Press & Policy Press: Bristol, UK, 2016. [Google Scholar]
- Haaland, C.; Konijnendijk van den Bosch, C. Challenges and strategies for urban green-space planning in cities undergoing densification: A review. Urban For. Urban Green. 2015, 14, 760–771. [Google Scholar] [CrossRef]
- Wagner, F.; Andreas, M. A culture of sustainability. RCC Perspect. 2012, 8, 57–72. [Google Scholar]
- Lawrence, R.J. Deciphering interdisciplinary and transdisciplinary contributions. Transdiscipl. J. Eng. Sci. 2010, 1, 125–130. [Google Scholar] [CrossRef] [PubMed]
- Mederely, P.; Novacek, P.; Topercer, J. Sustainable development assessment: Quality and sustainability of life indicators at global, national and regional level. Foresight 2003, 5, 42–49. [Google Scholar] [CrossRef]
- Mohtadi, T. The complementarity of improving quality of life and reducing environmental footprints in urban spaces: The argument for ‘hedonistic sustainability’. Consilience 2016, 16, 14–28. [Google Scholar]
- Herasymchuk, Z.V.; Averkyna, M.F. Theoretical and methodological foundations for maintaining of sustainable development of cities and metropolitan agglomerations. Natsional’nyi Hirnychyi Universytet. Naukovyi Visnyk 2014, 5, 134–141. [Google Scholar]
- Lepage, A. The quality of life as attribute of sustainability. TQM J. 2009, 21, 105–115. [Google Scholar] [CrossRef]
- Huang, W.L.; Fenney, M.K. Citizen participation in local government decision making: The role of manager motivation. Rev. Public Pers. Adm. 2015, 36, 188–209. [Google Scholar] [CrossRef]
- Font, J.; Wojcieszak, M.; Navarro, C.J. Particpation, representation and expertise: Citizen preferences for political decision-making processes. Polit. Stud. 2015, 63, 153–172. [Google Scholar] [CrossRef]
- Haruța, C.; Radu, B. Citizen participation in the decision-making process at local and county levels in the Romanian public institutions. Transylv. Rev. Adm. Sci. 2010, 30, 76–92. [Google Scholar]
- Irvin, R.A.; Stansbury, J. Citizen participation in decision making: Is it worth the effort? Public Adm. Rev. 2004, 64, 55–65. [Google Scholar] [CrossRef]
- Van Eijk, C. Growing access to local decision-making? Explaining variation among Dutch municipalities in the institutional measures to promote citizen participation. J. Urban Aff. 2013, 36, 256–275. [Google Scholar] [CrossRef]
- Jurlina Alibegovic, D.; Slijepcevic, S. Attitudes towards citizen participation in the local decision-making process: A comparative analysis. Društvena Istraživanja 2018, 27, 155–175. [Google Scholar] [CrossRef]
- Godbey, G.; Kraus, R. Citizen participation in urban recreation decision-making. Community Dev. J. 1973, 8, 155–160. [Google Scholar] [CrossRef]
- Sousa Gomes, M.C.; Luis Rocha Pinto, M.; Gomes dos Santos, G. Quality of life: A reappraisal. Int. J. Sociol. Soc. Policy 2010, 30, 559–580. [Google Scholar] [CrossRef]
- Eng, T.Y.; Niininen, O. An integrative approach to diagnosing service quality of public parks. J. Serv. Mark. 2005, 19, 70–80. [Google Scholar] [CrossRef]
- Mani, M.; Hosseini, S.M.; Ramayah, T. Parks as business opportunities and development strategies. Bus. Strategy Ser. 2012, 13, 96–101. [Google Scholar] [CrossRef]
- Beck, H. Linking the quality of public spaces to quality of life. J. Place Manag. Dev. 2009, 2, 240–248. [Google Scholar] [CrossRef]
- Buteau-Duitschaever, W.C.; McCucheon, B.; Eagles, P.F.J.; Havitz, M.E.; Glover, T.D. Park visitors’ perceptions of governance: A comparison between Ontario and British Columbia provincial parks management models. Tour. Rev. 2010, 65, 31–50. [Google Scholar] [CrossRef]
- Raphael, D. Defining quality of life: Eleven debates concerning its measurement. In Quality of Life in Health Promotion and Rehabilitation: Conceptual Approaches, Issues, and Applications; Renwick, R., Brown, I., Nagler, M., Eds.; Sage Publications: Thousand Oaks, CA, USA, 1996. [Google Scholar]
- Cummins, R. Objective and subjective quality of life: An interactive model. Soc. Indic. Res. 2000, 52, 55–72. [Google Scholar] [CrossRef]
- Marginean, I. Quality of Life in Romania; Editura Expert: Bucureşti, Romania, 2004. [Google Scholar]
- An Integrative Approach to Quality of Life Measurement, Research, and Policy. Available online: http://sapiens.revues.org/index169.html (accessed on 21 June 2019).
- Quality of Life Indicators—Overall Experience of Life. Available online: https://ec.europa.eu/eurostat/statistics-explained/index.php?title=Quality_of_life_indicators_-_overall_experience_of_life#Overall_life_satisfaction_in_the_context_of_quality_of_life (accessed on 2 May 2019).
- Constantinescu, M. The economic crisis—Implications on methods and instruments used in quality of life studies. Theor. Appl. Econ. 2012, XVIII, 125–134. [Google Scholar]
- Report by the Commission on the Measurement of Economic Performance and Social Progress. Available online: https://ec.europa.eu/eurostat/documents/118025/118123/Fitoussi+Commission+report (accessed on 4 May 2019).
- Quality of Life Indicators—Measuring Quality of Life. Available online: https://ec.europa.eu/eurostat/statistics-explained/index.php/Quality_of_life_indicators_-_measuring_quality_of_life#Framework_for_measuring_quality_of_life (accessed on 2 May 2019).
- European Quality of Life Survey. 2016. Available online: https://www.eurofound.europa.eu/surveys/european-quality-of-life-surveys/european-quality-of-life-survey-2016 (accessed on 4 May 2019).
- OECD Better Life Index. Available online: http://www.oecdbetterlifeindex.org/#/11111111111 (accessed on 4 May 2019).
- The Global Liveability Index. Available online: https://www.eiu.com/topic/liveability (accessed on 29 August 2019).
- Quality of Living City Ranking. Available online: https://mobilityexchange.mercer.com/Insights/quality-of-living-rankings (accessed on 29 August 2019).
- Krason, S.M. A “Better Life Index” that Ignores What Makes for a Better Life. Available online: https://www.crisismagazine.com/2014/better-life-index-ignores-makes-better-life (accessed on 24 August 2019).
- Quality of Life Survey: Top 25 Cities. 2019. Available online: https://monocle.com/film/affairs/quality-of-life-survey-top-25-cities-2019/ (accessed on 29 August 2019).
- National Institute of Statistics. The Usually Resident Population on 1st January 2018 down 120.7 Thousand Persons. Available online: http://www.insse.ro/cms/sites/default/files/com_presa/com_pdf/poprez_ian2018e.pdf (accessed on 24 August 2019).
- Best Practice in Strategic Park Management: Towards an Integrated Park Management Model. Available online: https://sustain.pata.org/wp-content/uploads/2014/12/Inglis_ParkMgtModel.pdf (accessed on 29 May 2019).


| Cultural Facilities | Public Transport | Recycling Facilities | Banking Facilities | Recreational Areas | Groceries | |
|---|---|---|---|---|---|---|
| Highest Proportion | Romania (55%) | Finland (36%) | Romania (41%) | Romania (38%) | Romania (29%) | Portugal (15%) |
| Hungary (53%) | France (35%) | Bulgaria (34%) | Hungary (27%) | Portugal (21%) | Czech Republic (15%) | |
| Portugal (49%) | Portugal (31%) | Croatia (30%) | Croatia (24%) | Malta (21%) | Slovenia (14%) | |
| Lowest Proportion | Netherlands (20%) | Netherlands (14%) | Lithuania (8%) | Cyprus (11%) | Finland (4%) | Slovakia (4%) |
| Cyprus (20%) | Slovakia (13%) | Sweden (7%) | Germany (10%) | Sweden (3%) | Bulgaria (4%) | |
| Denmark (19%) | Luxembourg (11%) | Malta (6%) | Luxembourg (9%) | Denmark (3%) | Denmark (2%) |
| QoL Dimensions | Mean | Std. Deviation | Coef. of Variation |
|---|---|---|---|
| Health (mental and physical) | 4.72 | 0.57 | 0.1 |
| Connection with Nature | 4.52 | 0.76 | 0.2 |
| Social Interaction | 4.27 | 0.83 | 0.2 |
| Freedom | 4.17 | 0.98 | 0.2 |
| Family Life | 4.15 | 0.96 | 0.2 |
| Education and Culture | 4.06 | 1.01 | 0.2 |
| Mental Association | Percent |
|---|---|
| Green/lake/nature | 23.1% |
| History/tradition | 12.4% |
| Relaxation/entertainment/fun | 11.6% |
| Quietness | 7.4% |
| Walking/strolling | 4.6% |
| QoL Dimensions Associated with Park Visit | Frequency of Park Visit | Correlation between Frequency of Park Visit and QoL Dimension | |||||
|---|---|---|---|---|---|---|---|
| Daily | 2–3 times/week | 1/week | 2–3 times/month | 1/month | Less than 1/month | ||
| Health (Mental and Physical) | 89.1% | 75.4% | 74.5% | 81.6% | 74.1% | 72.7% | Pearson Correlation 0.157 |
| Significance (two-tailed) 0.029 | |||||||
| N 1200 | |||||||
| Social Interaction | 61.3% | 48.4% | 51.3% | 50.4% | 33.8% | 35.5% | Pearson Correlation 0.237 |
| Significance (two-tailed) 0.000 | |||||||
| N 1200 | |||||||
| Education and Culture | 49.6% | 51.4% | 39.6% | 41.1% | 31.7% | 22.7% | Pearson Correlation 0.261 |
| Significance (two-tailed) 0.000 | |||||||
| N 1200 | |||||||
| Family Life | 50.7% | 50.4% | 40.3% | 41.7% | 39.9% | 32.7% | Pearson Correlation 0.215 |
| Significance (two-tailed) 0.049 | |||||||
| N 1200 | |||||||
| Freedom | 61.0% | 55.1% | 44.0% | 50.4% | 29.7% | 28.2% | Pearson Correlation 0.366 |
| Significance (two-tailed) 0.049 | |||||||
| N 1200 | |||||||
| Connection with Nature | 76.5% | 64.7% | 61.5% | 70.0% | 61.2% | 64.5% | Pearson Correlation 0.119 |
| Significance (two-tailed) 0.043 | |||||||
| N 1200 | |||||||
| QoL Dimensions Associated with Park Visit | Visit Duration | Correlation between Visit Duration and QoL Dimension | |||
|---|---|---|---|---|---|
| More than 3 h | 2–3 h | 1–2 h | Less than 1 h | ||
| Health (Mental and Physical) | 84.7% | 81.4% | 62.3% | 86.4% | Pearson Correlation 0.272 |
| Significance (two-tailed) 0.000 | |||||
| N 1200 | |||||
| Social Interaction | 61.1% | 45.3% | 39.2% | 50.0% | Pearson Correlation 0.248 |
| Significance (two-tailed) 0.000 | |||||
| N 1200 | |||||
| Education and Culture | 53.2% | 44.3% | 28.8% | 47.7% | Pearson Correlation 0.157 |
| Significance (two-tailed) 0.049 | |||||
| N 1200 | |||||
| Family Life | 50.6% | 49.8% | 31.0% | 36.4% | Pearson Correlation 0.264 |
| Significance (two-tailed) 0.000 | |||||
| N 1200 | |||||
| Freedom | 59.6% | 46.8% | 36.4% | 47.7% | Pearson Correlation 0.289 |
| Significance (two-tailed) 0.000 | |||||
| N 1200 | |||||
| Connection with Nature | 70.2% | 73.3% | 49.0% | 68.2% | Pearson Correlation 0.195 |
| Significance (two-tailed) 0.000 | |||||
| N 1200 | |||||
| Factors | Percent |
|---|---|
| If the park was cleaner | 16.5% |
| More concerts/shows/competitions | 16.2% |
| More new activities/attractions/new venues | 10.5% |
| More vegetation | 4.1% |
| More quiet places in the park | 3.9% |
| If my friends and family will meet me here | 3.2% |
| More sports dedicated places | 3.0% |
© 2019 by the authors. Licensee MDPI, Basel, Switzerland. This article is an open access article distributed under the terms and conditions of the Creative Commons Attribution (CC BY) license (http://creativecommons.org/licenses/by/4.0/).
Share and Cite
Constantinescu, M.; Orîndaru, A.; Căescu, Ș.-C.; Pachițanu, A. Sustainable Development of Urban Green Areas for Quality of Life Improvement—Argument for Increased Citizen Participation. Sustainability 2019, 11, 4868. https://doi.org/10.3390/su11184868
Constantinescu M, Orîndaru A, Căescu Ș-C, Pachițanu A. Sustainable Development of Urban Green Areas for Quality of Life Improvement—Argument for Increased Citizen Participation. Sustainability. 2019; 11(18):4868. https://doi.org/10.3390/su11184868
Chicago/Turabian StyleConstantinescu, Mihaela, Andreea Orîndaru, Ștefan-Claudiu Căescu, and Andreea Pachițanu. 2019. "Sustainable Development of Urban Green Areas for Quality of Life Improvement—Argument for Increased Citizen Participation" Sustainability 11, no. 18: 4868. https://doi.org/10.3390/su11184868
APA StyleConstantinescu, M., Orîndaru, A., Căescu, Ș.-C., & Pachițanu, A. (2019). Sustainable Development of Urban Green Areas for Quality of Life Improvement—Argument for Increased Citizen Participation. Sustainability, 11(18), 4868. https://doi.org/10.3390/su11184868


