1. Introduction
Reviewing the previous work conducted locally and globally, household energy consumption attracts considerable attention [
1]. The fact of the matter is that the growing consumption of energy sources is believed to be one of the considerable causes of environmental changes [
2]. Referring to the United Nations Environment Program in 2016, households consume 40% of the primary energy (i.e., based on natural resources) in the world; hence, they are responsible for one-third of related global greenhouse gas (GHG) emissions [
3,
4]. In addition, energy as a determinant factor for the growing Iranian economy is mainly derived from natural resources [
5]. Comparing the energy consumption from 2010–2013, it was observed that the average rate of energy use in Iran is about 169 kg of oil (equivalent to per 1000 United States dollars (USD) gross domestic product (GDP)), while this rate in the world is 133.85 kg of oil. Furthermore, the study conducted by Farajzadeh and Nematollahi [
6] showed that the rate of energy intensity in Iran is 1.5 times higher than the average rate in developed countries. In other words, as the prevailing evidence shows that energy consumption in Iran is responsible for 2% of global CO
2 emissions [
7], Iran is transitioning to a consuming country. This is simply due to the fact that the demand for energy is growing in Iran, such that even energy-efficient systems in producing sectors fail to prevent such a rapid shift.
Iran, as one of the top 10 countries for carbon dioxide (CO
2) emissions, is facing a fast rate of urbanization and a trend of migration from rural settlements to urban areas [
8], leading to the ratio of urban settlements going from more than one-third (33.73%) to about three-quarters (74.34%) from 1960 to 2017, respectively [
9]. Industrialization and social–political transformation are considered the main causes of this rapid shift in settlement distribution. This high rate of urbanization in 58 years suggests that the increasing amount of energy demand, especially in urban parts of country, should be considered as a main factor of energy consumption for future plans. In recent years, in Iran, there was a clear shift from oil products to natural gas and, now, around three-quarters of national energy consumption is covered by this sector. Notably, the pattern of energy consumption in Iran is not the same as that defined by the environmental Kuznets curve, i.e., an increase in income is likely to be accompanied by an increase in energy consumption. This growing trend in energy consumption by developed and developing nations could be because of entertainment devices and information technology [
10] and an improvement in the standard of living [
11].
To date, a plethora of research was devoted to the investigation of factors impacting the increased energy consumption from both supply and demand perspectives [
12,
13]. From the supply aspect, a variation in energy consumption can be associated with the consumption pattern, energy efficiency, production system, and consumption rate. Analysis of the household deals with the investigation of the role of behavioral pattern [
13], climate [
14], socio-demographic and cultural [
15], and socio-economic [
16] factors in the energy consumption pattern of households. In addition, the association between energy consumption and behavioral pattern, cultural differences, and demographic changes like aging was addressed in the study conducted by Muller and Yan [
17]. It was proven that the energy consumption of the households is highly influenced by socio-economic characteristics and climate [
18].
Knowing the key elements that impact energy consumption is very significant [
19]. To gain a better understanding of household energy choice and consumption patterns in an area, it is required to integrate energy sources used by households to meet their energy demands and needs. A number of techniques were developed to model an origin for the explanation of household energy consumption. In this regard, the modeling origin for the explanation of household energy consumption is the “energy ladder” model. It models the correlation between the increase in household income and its fuel choices for energy consumption [
17]. The determining hypothesis of the energy ladder theory refers to the fact that household energy source choices can be categorized as the least and the most technologically advanced energy sources either in an ascending or descending manner. However, the energy ladder model was vigorously challenged in recent years by researchers [
20,
21,
22]. In Iran, such a hypothesis rules household energy source choices since the farther they go financially, the more sophisticated energy sources they choose. However, there are certain drawbacks associated with the use of the energy ladder model in Iran; due to the betterment of household income, it does not necessarily move from a particular kind of energy source toward an ideal source. In other words, household energy choices cannot be put in a linear continuum whereby the lowest end includes dung, crop residue, and fuelwood, and the highest end is made up of liquefied petroleum gas (LPG) and electricity. Unlike the “energy ladder” model, the “energy services” model does not believe in a linear developmental path in household energy source choices. It is believed that “energy services” refer to the benefits of a particular energy source that facilitate the welfare of human beings [
23]. Being an exclusivist model, the energy ladder model only emphasizes the determining role of household income in the energy source choices. While it needs to be acknowledged that household income does play a key part in the energy source choices, it also needs to be heeded that other factors also affect household energy source choices.
On the other hand, much of the literature on energy use by households only emphasized the importance of effective factors on the consumption side [
13,
14,
15,
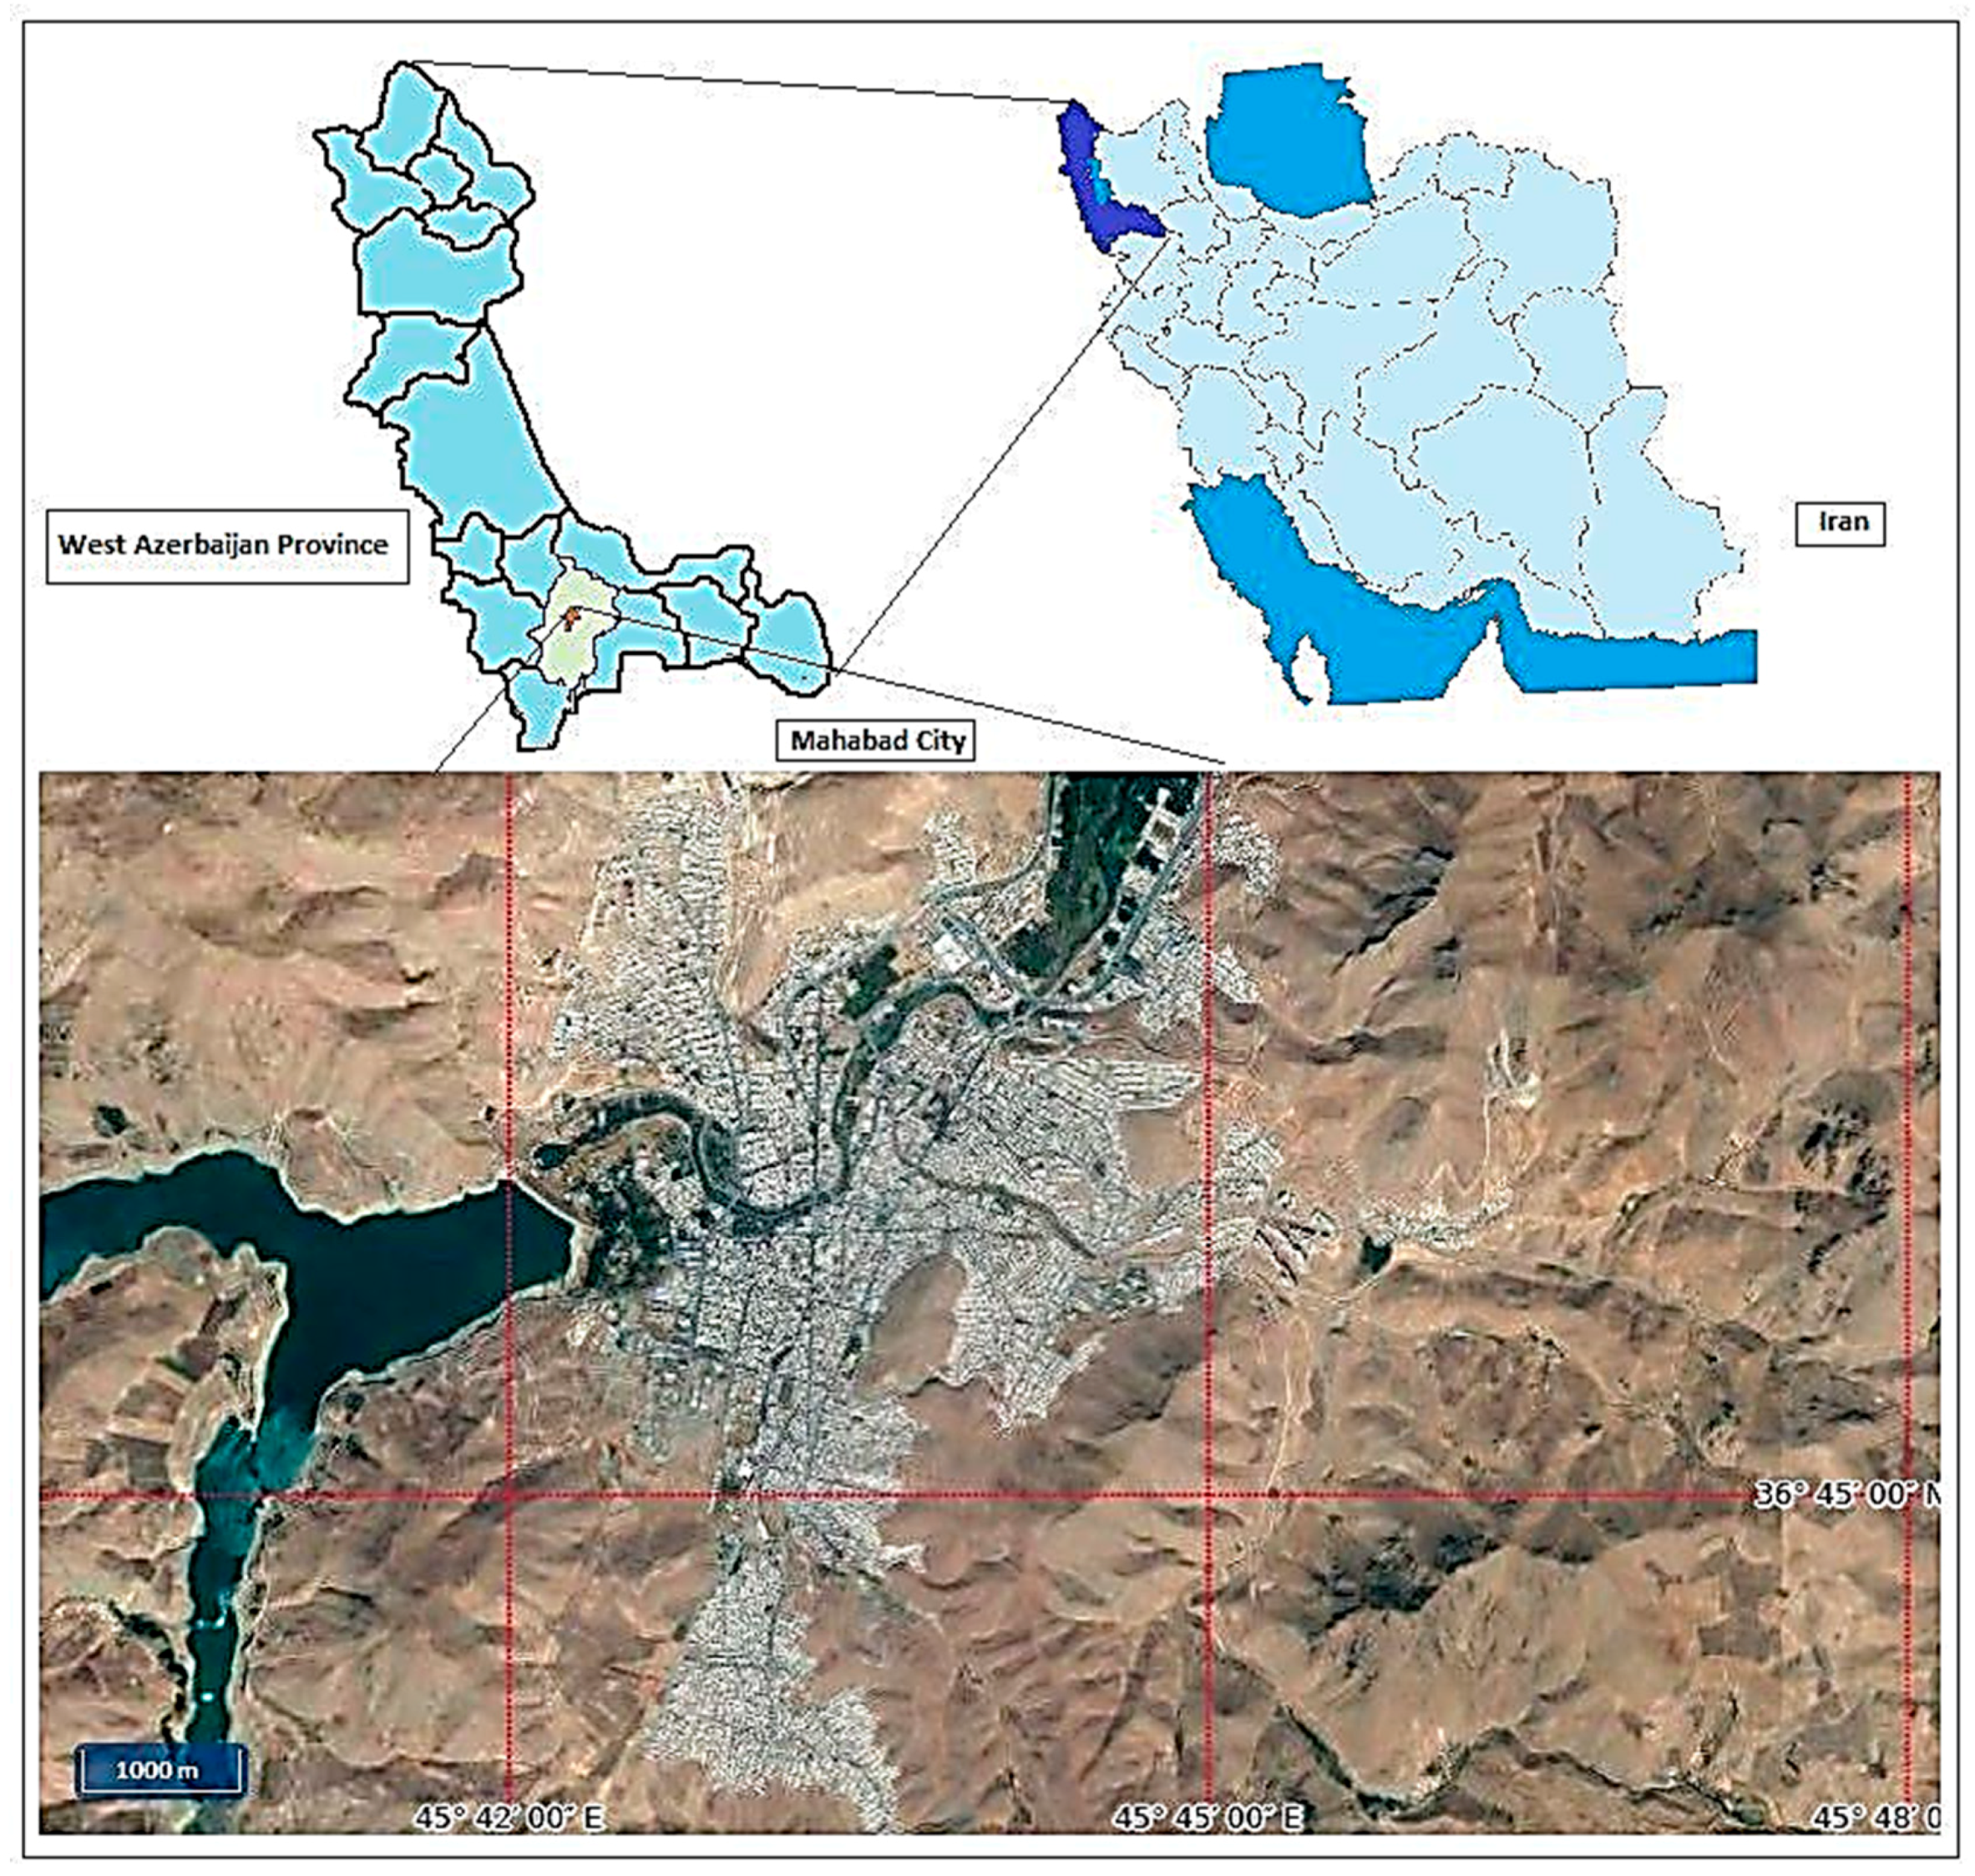
17], and determinants of variation in energy choice in households were mainly neglected in this regard. Therefore, the best method to adopt for this investigation is to address the issues in relation to all aspects of household energy use in terms of both choice and consumption. Regarding the above gap in the respective literature, this study aims to empirically identify the dominant pattern of energy choice and consumption in households from Mahabad city (
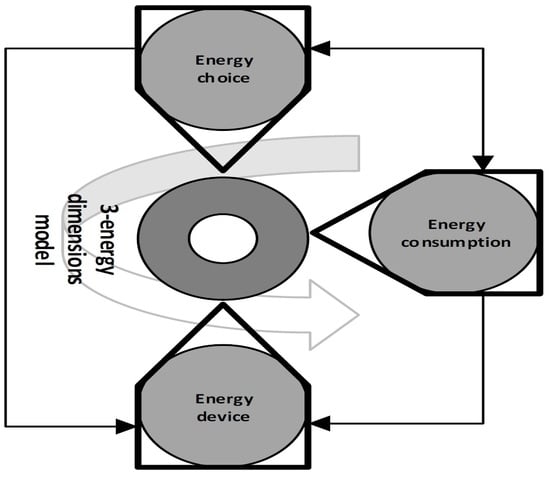
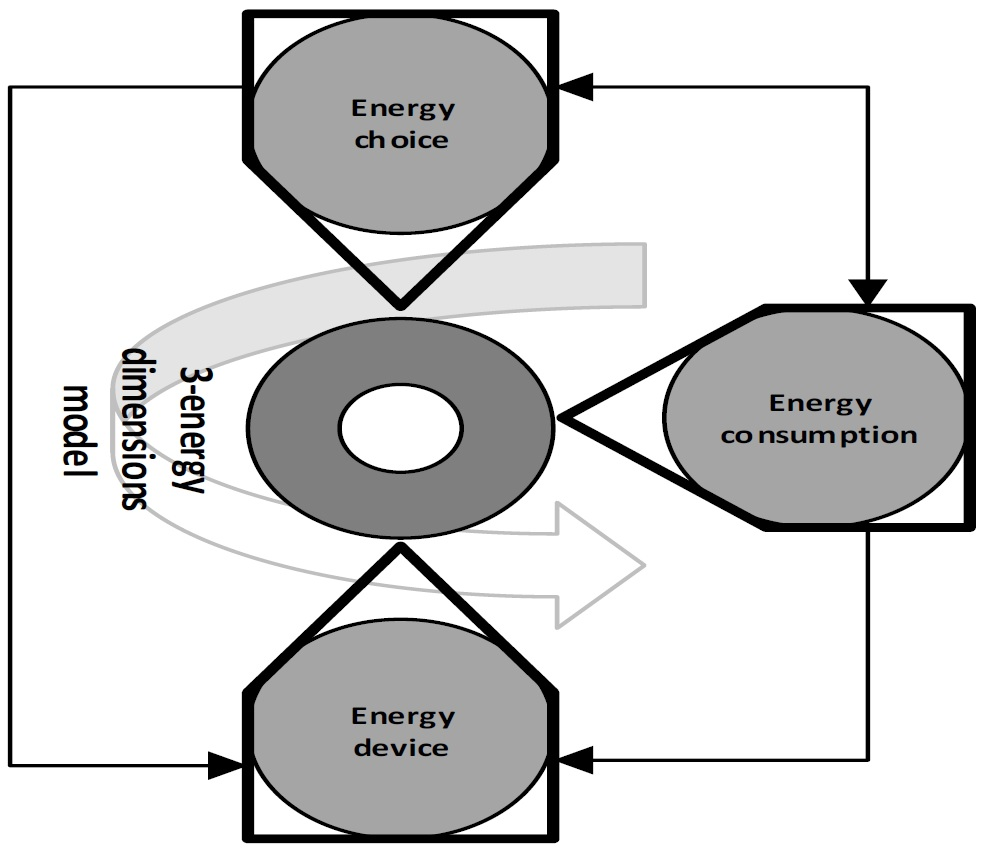
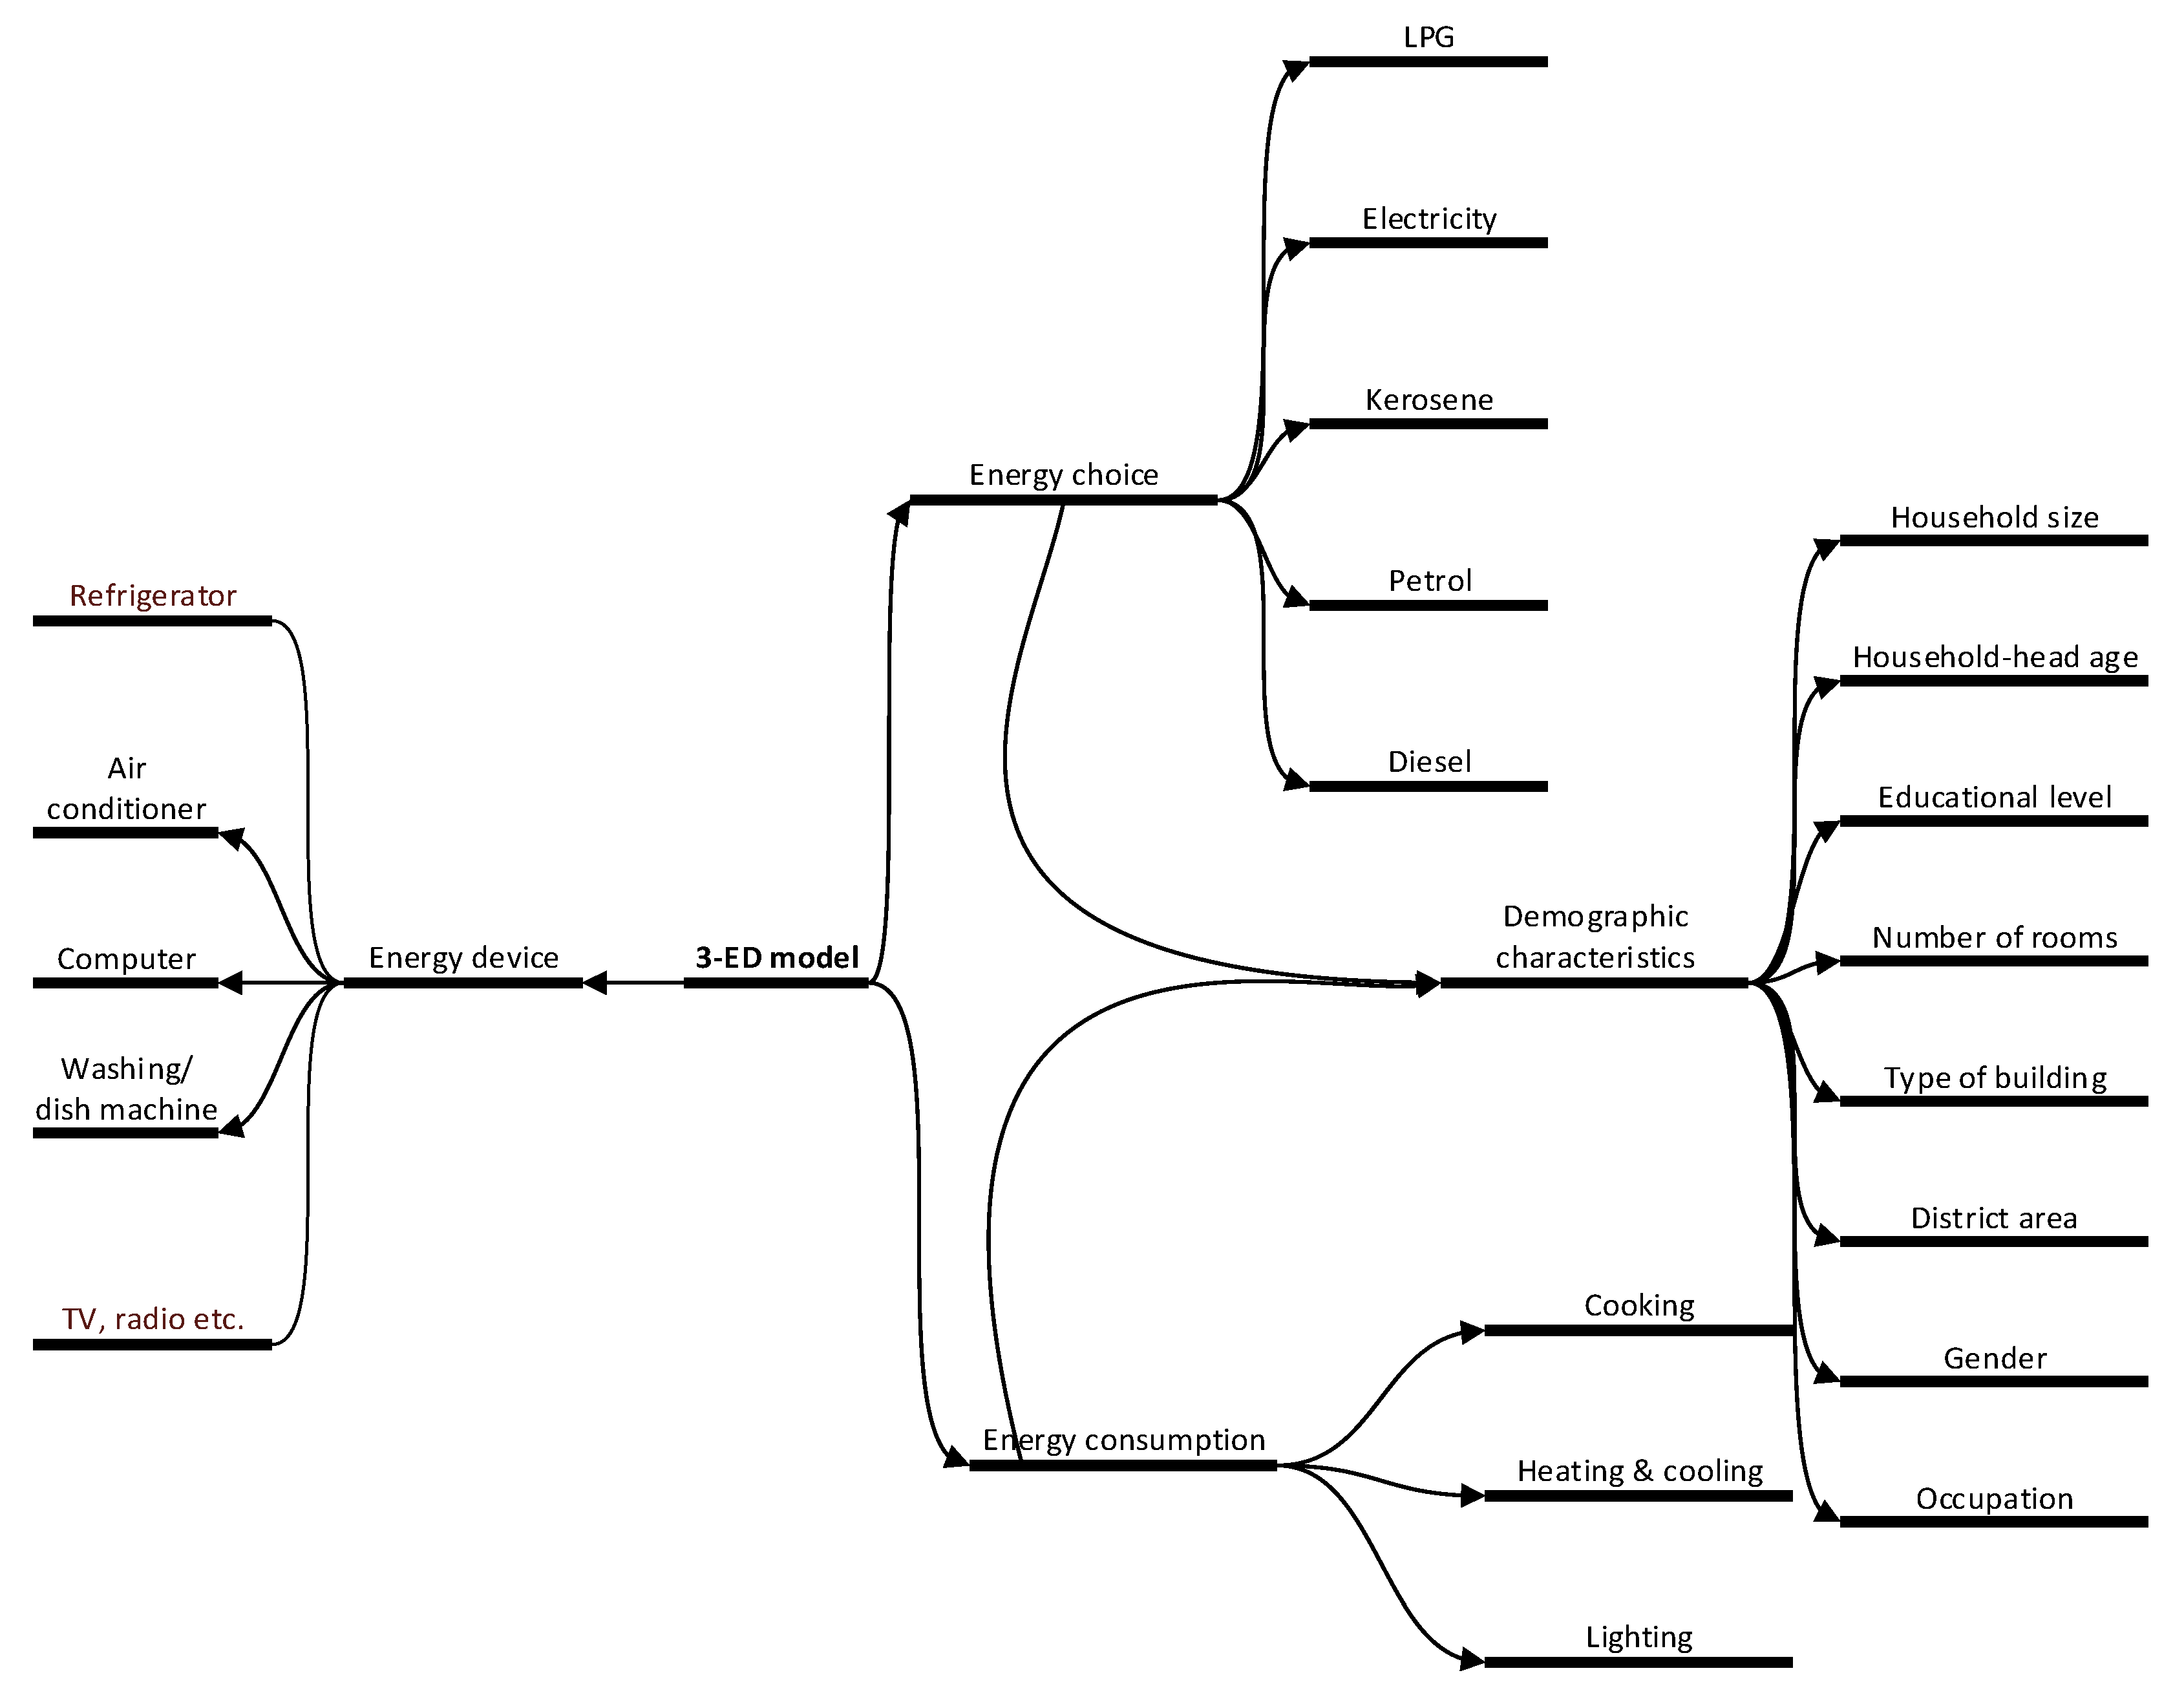
Figure 1), northwest Iran. To this aim, it considers the changes that the pattern of energy choice and consumption may steadily undergo, and it adopts a three-energy dimension (3-ED) model [
12], incorporating energy choice, energy consumption, and energy device.
What we know about energy consumption by households is largely based upon empirical studies that investigated how this dynamic phenomenon can be impacted by a variety of factors, e.g., household size, gender, age, educational level, appliance ownership, home characteristics, and government policy variables [
13,
14,
15,
17]. However, determinates of variation were not adequately studied to provide comprehensive insight into the consumption pattern. Therefore, the remarks outlined above shed light on the fact that the energy consumption is influenced by a variety of factors, making it difficult to capture a clear image of household energy consumption. To this end, a plethora of causal elements, e.g., the type of energy consumed by households, income, building condition, aging, and change in family structure, need to be comprehensively analyzed. The present study revolved around the following key question: How can changes in building conditions (e.g., distribution of the number of rooms) and demographic characteristics lead to variations in energy consumption in households?
Considering the fact that the residential sector accounts for nearly one-third of total carbon emissions and two-fifths of total energy consumption in Iran [
6], a study in this field is deemed to be of great importance. As a case study, the important factors in selecting Mahabad city were its locational advantage in terms of the Iraq and Turkey borders and its role as a political and cultural center in northwest of Iran. Overall, using the 3-ED model, the current research centers on the use of appliances for the purpose of cooking, space lighting, heating, and cooling to recognize factors overshadowing the changes in household energy choice and consumption, in addition to the demographic features of the households. It is also possible that the findings of this study might be applicable to other areas in most developing countries, especially in Asia. What stands out in this regard is that the given pattern of energy choice and consumption by households makes a major contribution to reduce GHG emissions.
3. Results
3.1. Demographic Characteristics of Respondents
As shown in
Table 1, the educational level of respondents in the densely populated urban areas included 8.6% illiterate, 28.1% with a high-school degree, 24.9% with a diploma, 27.5% with an associate’s or bachelor’s degree, and 10.9% with a master’s or PhD degree. In the moderately populated urban areas, the educational level pattern was as follows: 14.3% illiterate, 30.1% with a high-school degree, 22.4% with a diploma, 26.4% with an associate’s or bachelor’s degree, and 6.9% with a master’s or PhD degree. In the thinly populated urban areas, this pattern changed to 13.7% illiterate, 30.9% with a high-school degree, 24.5% with a diploma, 27% with an associate’s or bachelor’s degree, and 3.9% with a master’s or PhD degree. The educational level of respondents in the easily accessible rural areas included 38.3% illiterate, 52.5% with a high-school degree, 4.9% with a diploma, 3.8% with an associate’s or bachelor’s degree, and 0.5% with a master’s or PhD degree. For respondents in remote rural areas, this pattern was 45.9% illiterate, 47.5% with a high-school degree, 4.9% with a diploma, 1.6% with an associate’s or bachelor’s degree, and 0.0% with a master’s or PhD degree. The distribution pattern of respondents’ (heads of household) educational level largely indicates that the densely populated urban areas and remote rural areas had the highest and the lowest levels of literacy, respectively.
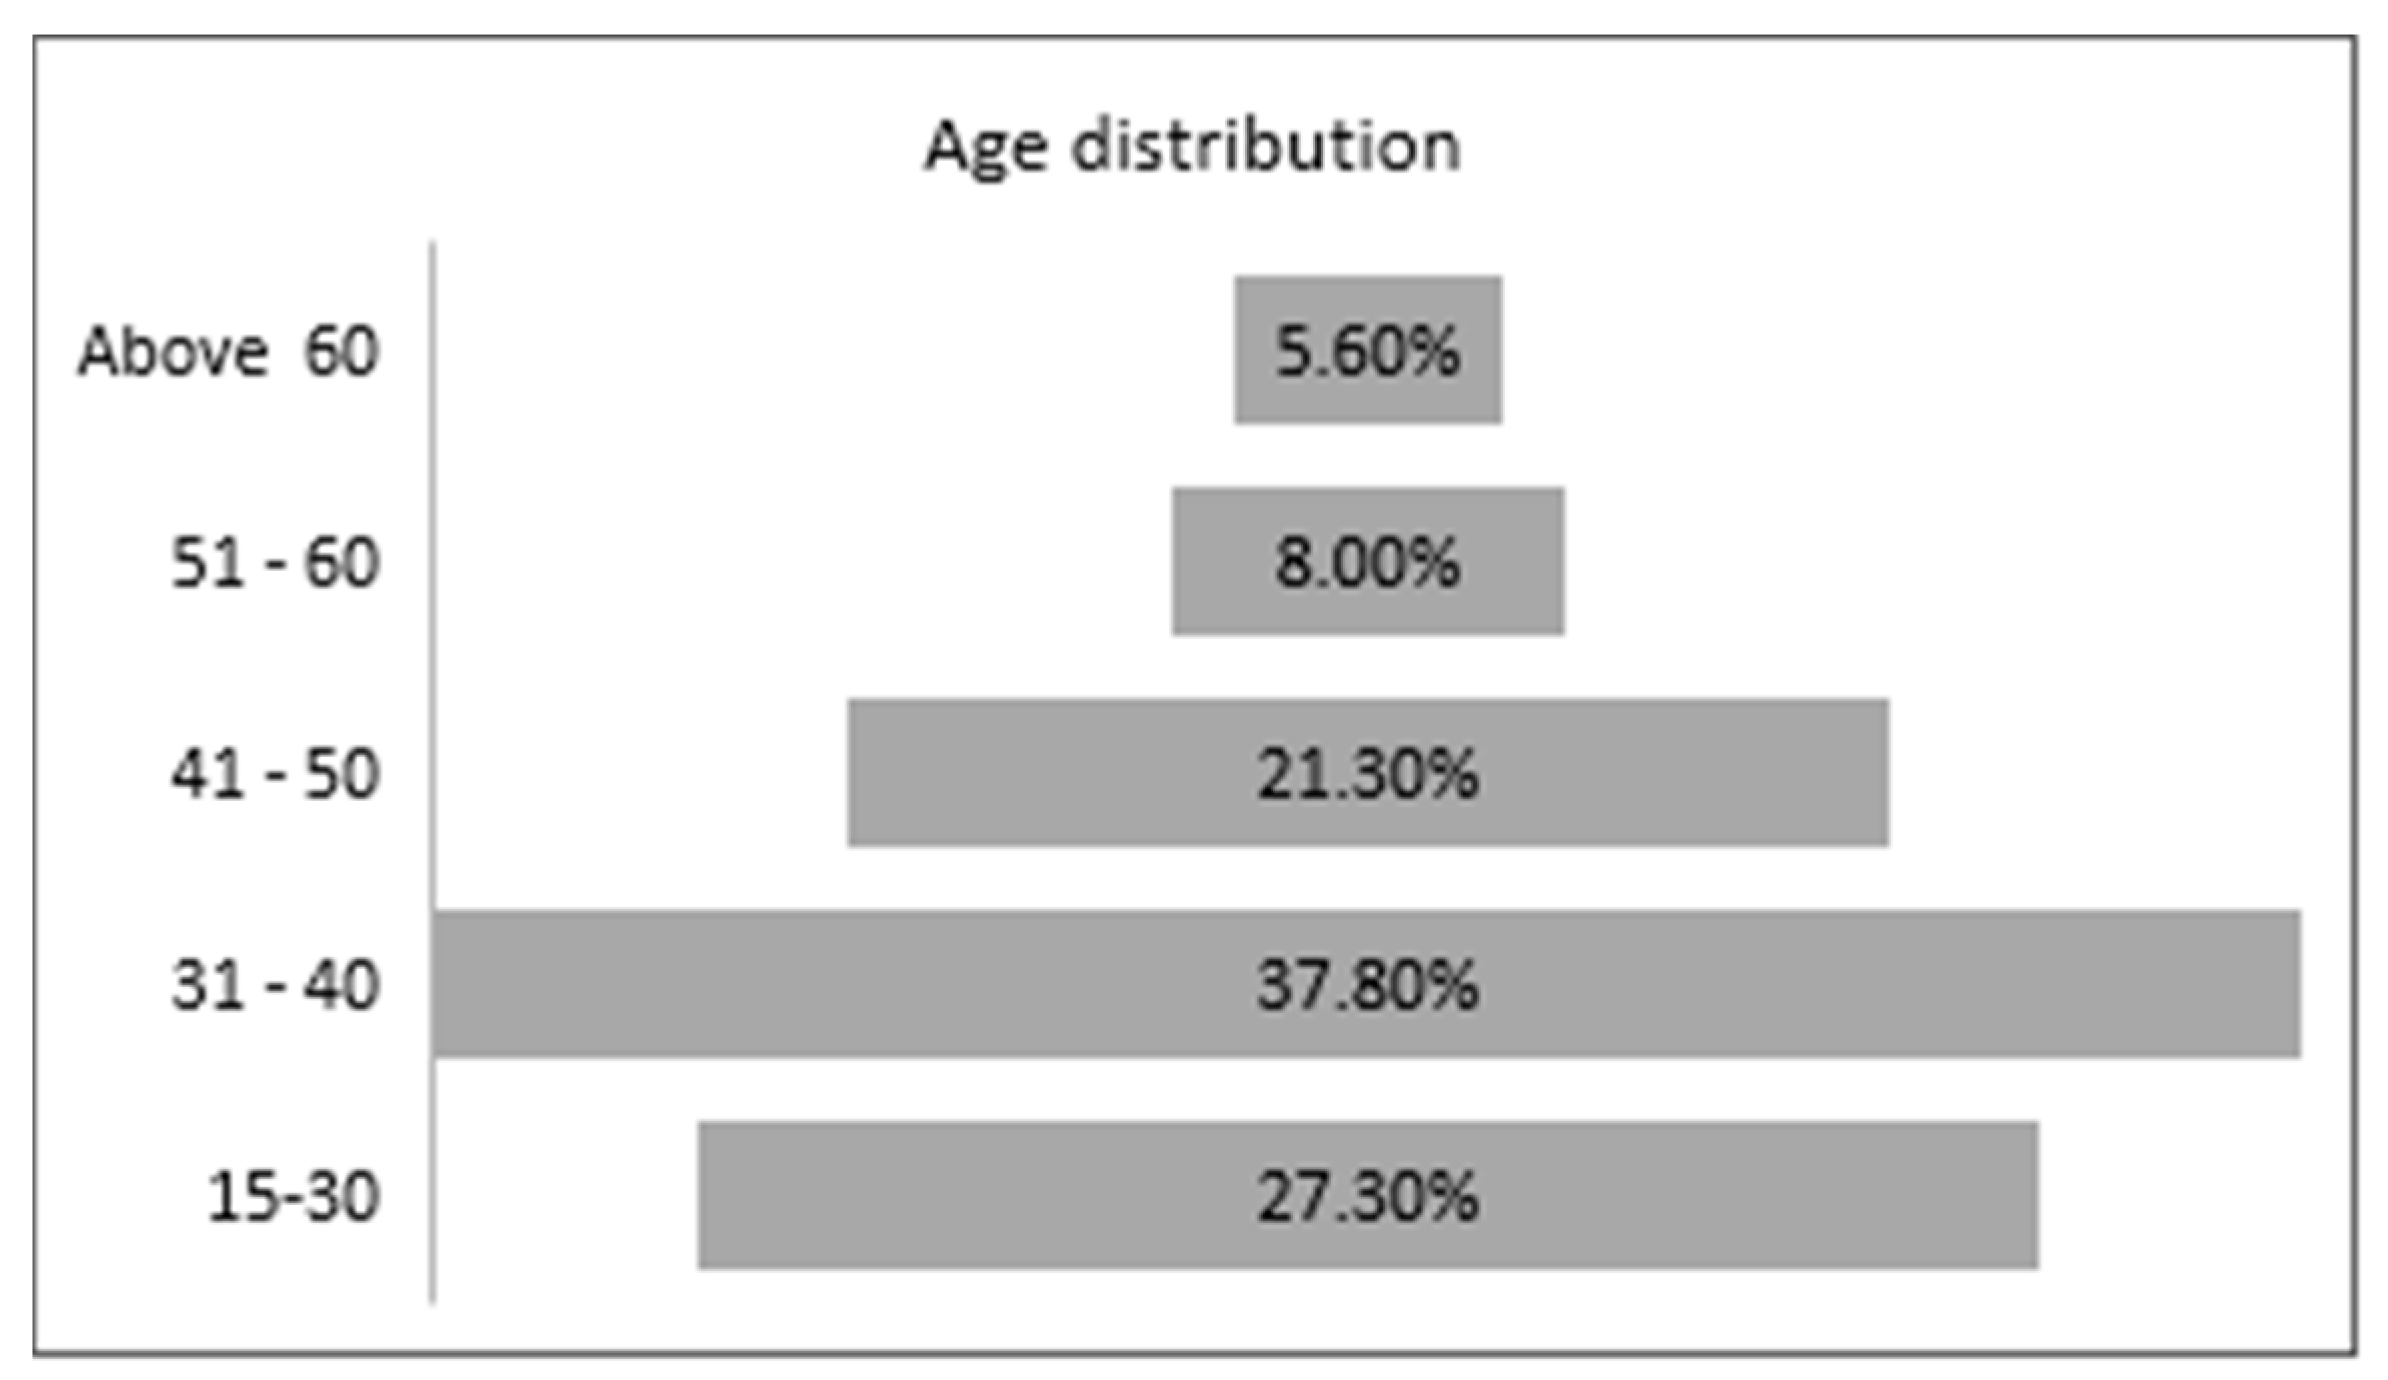
Most of the respondents had an average age of 31–40 years (37.8%). The smallest age group (5.6%) belonged to the respondents over 60. Meanwhile, people aged 15–30 years, 41–50 years, and 51–60 years accounted for 27.3%, 21.3%, and 8% of the statistical population, respectively (
Figure 3).
Table 2 indicates that employment had the highest rate in the densely populated urban areas and the lowest rate in the rural areas. According to the results, agriculture and the public sector constituted a great proportion of the occupation group, while the lowest percentage belonged to the retiree sector.
The results (
Table 3) indicate that, in the densely populated urban areas, moderately populated urban areas, thinly populated urban areas, easily accessible villages, and remote villages, the home-ownership status in the residential units was respectively 72.7% owners and 27.3% tenants, 68.9% owners and 31.1% tenants, 78.3% owners and 21.7% tenants, 68.9% owners and 31.1% tenants, 98.3% owners and 1.7% tenants, and 100% owners. In total, 75.6% of the respondents were owners, and 24.4% of them were tenants.
The population and household size in Iran show a negative growth. Based on selected findings of the 2016 national population and housing census by the Statistical Center of Iran (SCI), the household size was approximately 3.40 [
24]. The average household size in the sample was 4.19. This clear distance refers to traditional, cultural, and developing differences between Mahabad and Iranian metropoles. Based on the results, the floor space and the number of rooms for housing units were highly affected by the household size.
Table 4 reveals that the average number of rooms for housing units was one room for 16.1%, two rooms for 53.4%, three rooms for 23.6%, and four rooms or more for 6.8% of houses. For the moderately populated urban areas, this pattern was one room for 20.8%, two rooms for 53.4%, three rooms for 19.9%, and four rooms or more for 5.9% of houses. In the thinly populated urban areas, the pattern was one room for 15.7%, two rooms for 57.8%, three rooms for 21.7%, and four rooms or more for 4.8% of houses. In easily accessible villages, the pattern was one room for 36.7%, two rooms for 51.4%, three rooms for 9.2%, and four rooms or more for 2.8% of houses. In the remote villages, the pattern was one room for 0.0%, two rooms for 40%, three rooms for 53.3%, and four or more rooms for 6.7% of the houses. Overall, 20.7% of the houses had one room, 53.1% had two rooms, 20.6% had three rooms, and 5.6% had four rooms or more.
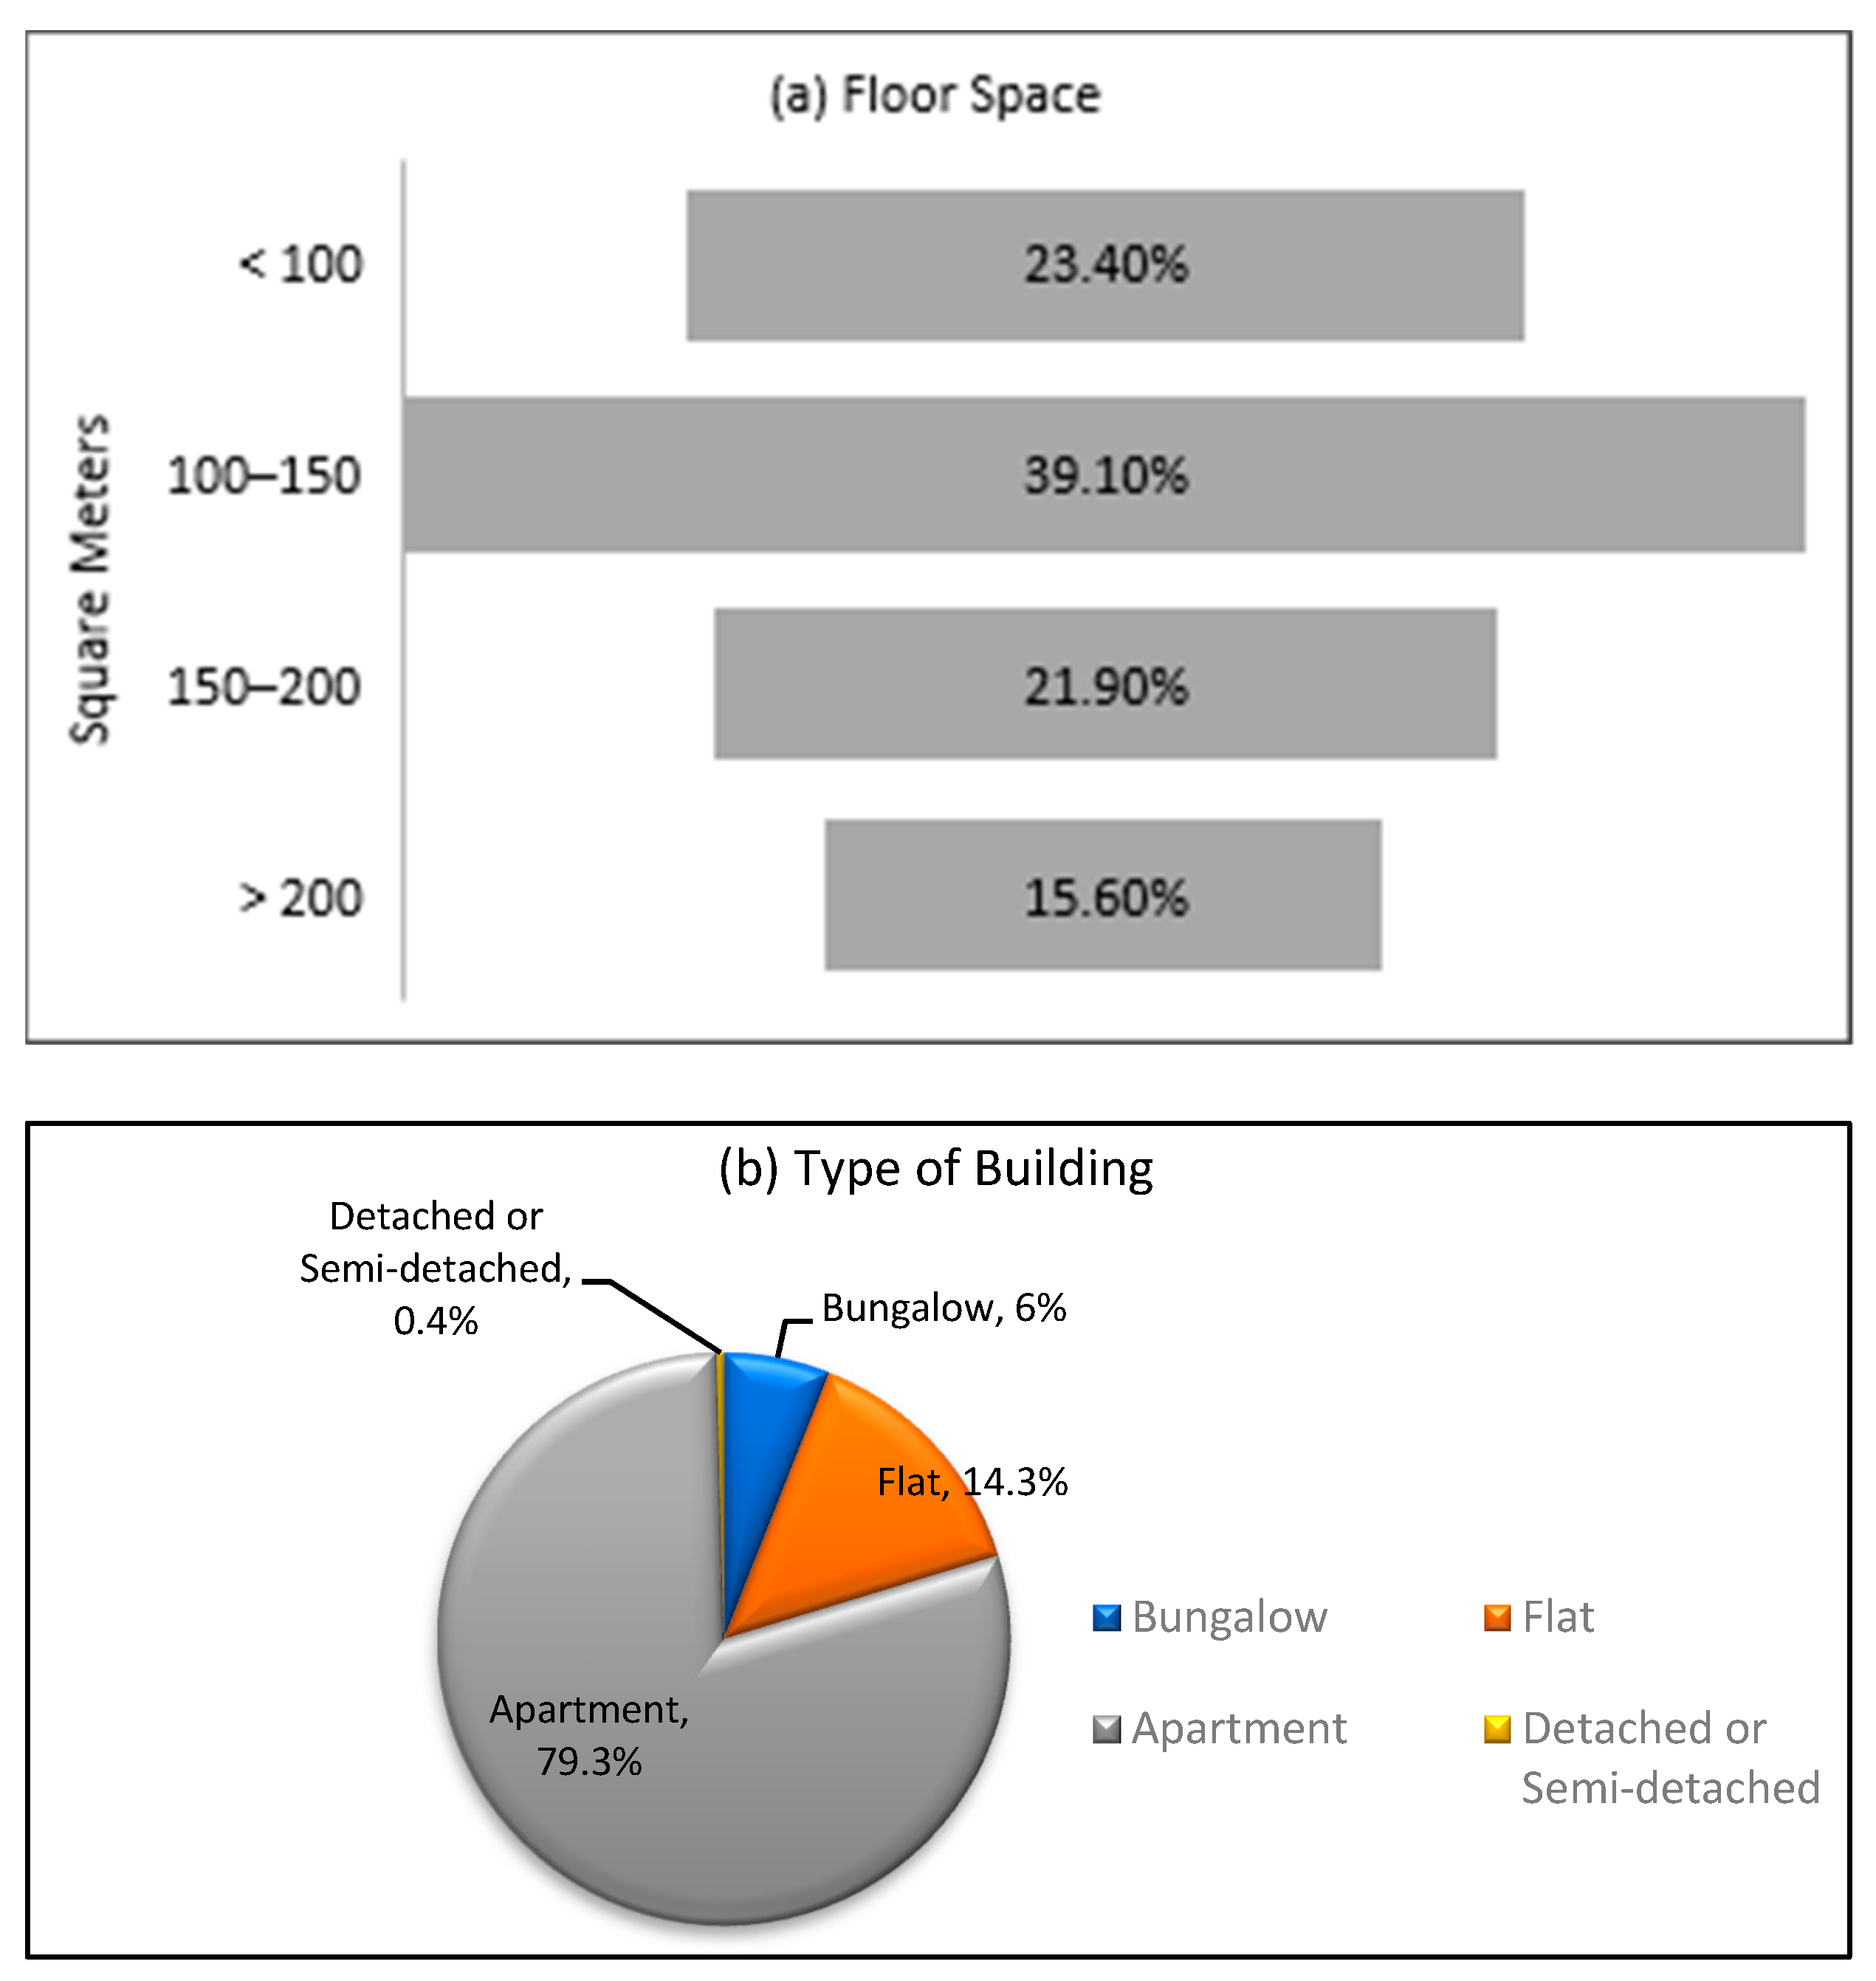
Also, the floor spaces of the dwelling units were calculated (
Figure 4). This research designated a particular question to calculate the floor space of dwelling units. According to the results, most houses (39.1%) had a floor space of 100–150 square meters, while only a limited number of houses (15.6%) had a floor space of more than 200 square meters. The remaining houses had a floor space of either 150–200 square meters (21.9%) or less than 100 square meters (23.4%). Of the total number of residential units surveyed, 6% were bungalows, 14.30% were flats, 79.30% were apartment units, and 0.4% were detached or semi-detached residential units.
3.2. Per Capita Household Energy Choice and Consumption
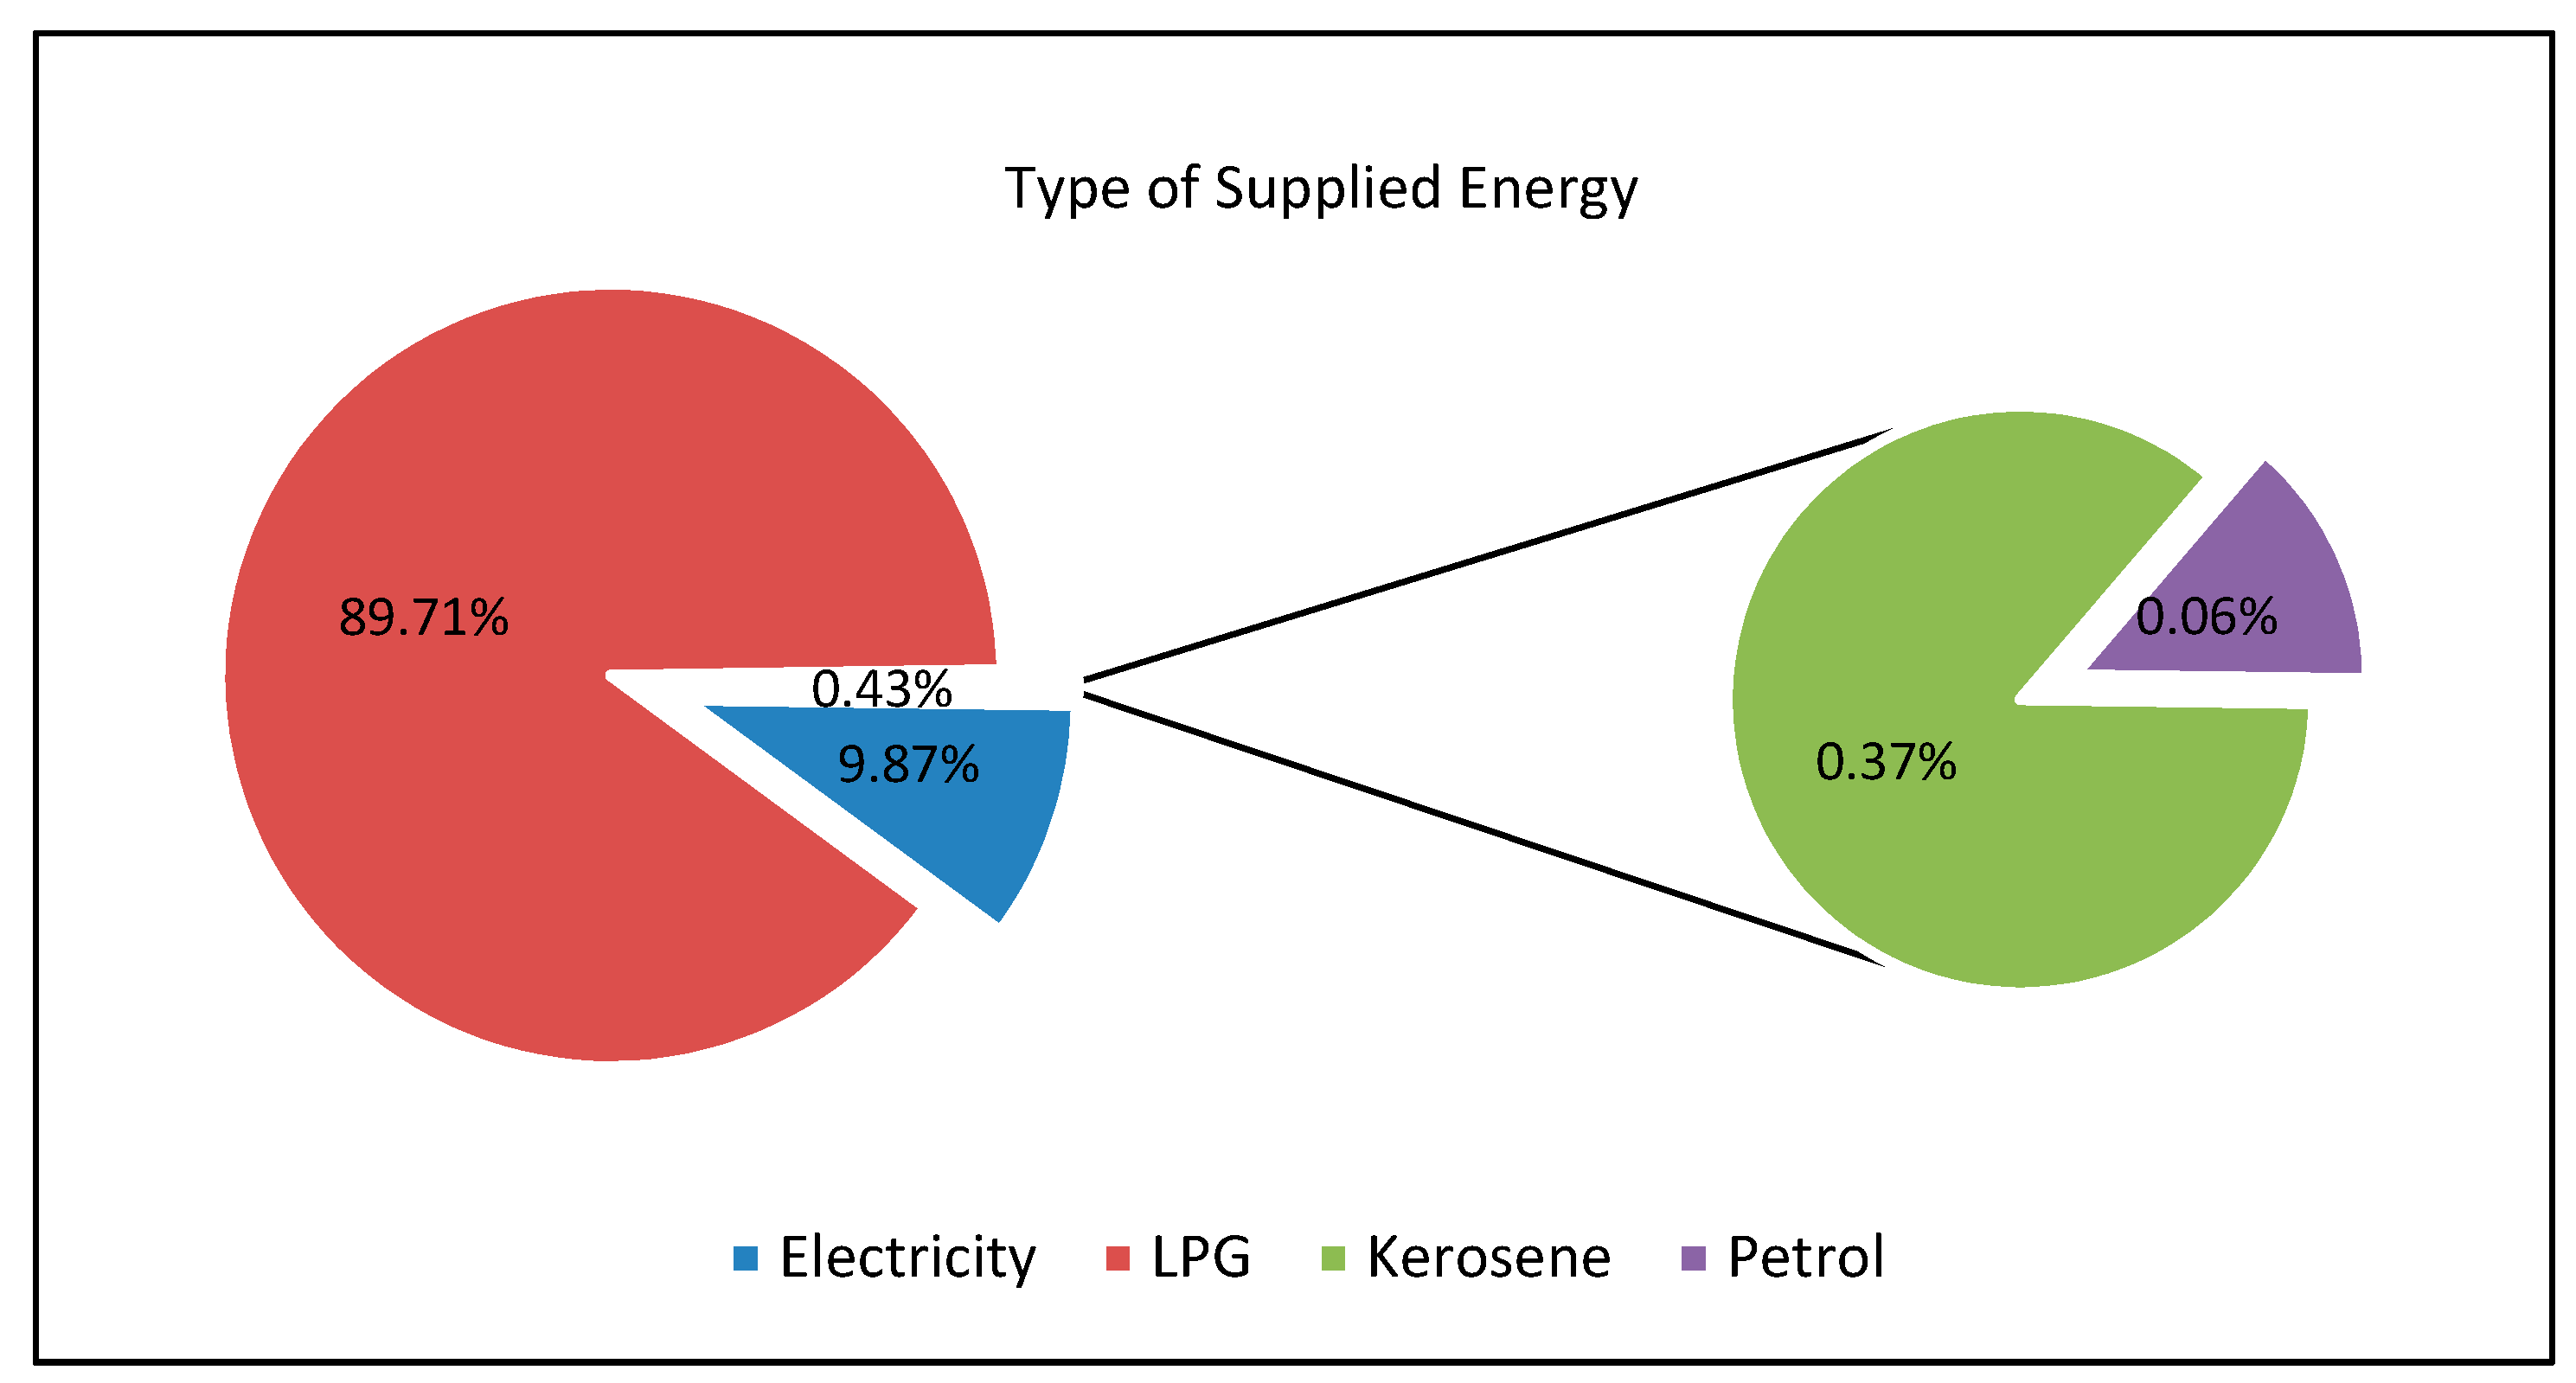
As shown in
Figure 5, households spent approximately 89.71% on LPG, 9.87% on electricity, 0.43% on kerosene/petrol per month. The high percentage of LPG expenses for power generators in residential units of Mahabad city can be attributed to the supply facilities that recently associated with the grid in Iran. In addition, insufficient power generated by power plants considerably reduced the power supply in Iran over recent decades, such that the amount of electricity supplied to over 80 million people (i.e., 2722 kWh per capita) was less than 79,033 MW at the time of the study [
24]. The ascending trend of demand and the descending trend of supply caused many problems including frequent outages, load shedding, and even power outages for a couple of days in some areas. Under these conditions and as demonstrated in
Figure 5, households may think that they pay for services they never receive. In spite of such an unfavorable supply, electricity stands in the second position of household costs. However, a few months before the survey began, the electricity tariffs increased in Iran.
Considering the market price, the present study estimated the monthly costs of household electricity consumed for a variety of usages including cooking, electric appliances, and cooling. As mentioned earlier, LPG was the energy source upon which the highest portion of household expenditure was spent (89.71%) in 2016, totally portraying the actual condition. The consumption rates for higher-, middle-, and lower-income households were 6690.086 MJ, 5233.371 MJ, and 3045.579 MJ, respectively. According to the results, the average electricity consumption for higher-, middle, and lower-income households was measured to be roughly 736.051 MJ, 575.781 MJ, and 335.078 MJ, respectively. Concerning kerosene, the energy consumption for higher-, middle-, and lower-income households was estimated to be 27.592 MJ, 21.584 MJ, and 12.561 MJ, respectively. The consumption rate of other fuels (e.g., petrol and diesel) in higher-, middle-, and lower-income households was measured to be 42.53 MJ, 4.679 MJ, and 0.028 MJ, respectively. The given variation is due to the fact that Mahabad city is a semi-urban area where the majority of households tend to use LPG as their major energy source. Most of the urban settlements in Iran have access to LPG as the main energy source, although it is not same for the rural areas. thus, urban apartment dwellers usually choose LPG for its cheap price and general use.
As reported by the International Energy Agency [
25] and World Data [
26], the total energy consumption per capita for all energy sources in Iran was 9799.2 MJ (2722 kWh) in 2016. Among all fuels, LPG had the highest share, subsequently leading to higher carbon emissions in Mahabad city. A point that should be clarified is that the estimated household monthly expenses on energy in this study differ from those presented by the Iran Power Holding Company due to the fact that the latter merely relies on the mere quantification, while the former is based on comprehensive analyses.
3.3. The Expenditure-to-Income Ratio
In an attempt to compare the expenditure-to-income ratio among the three income groups, a cross-tabulation was applied. As presented in
Table 5, energy costs for more than 35% of households from each income group accounted for ≤5% to <10% of their income per month. Put another way, lower-, middle-, and higher-income households spent respectively 37.46%, 36.28%, and 35.95% on energy consumption. As the table shows, more than 33% of households from each income group devoted less than 5% of their income to energy consumption per month. Middle-income and higher-income households with 36.01%, and 33.71, respectively, had a lower rate compared to lower-income households (36.66%). The pattern observed in the ≤10% to <15% and ≥15 categories appears to be relatively consistent. According to
Table 5, as income augments, the total energy consumption increases as well. As observed, the highest rate is devoted to higher-income households ( ≤10% to <15% (17.98%) and ≥15 (12.35%)), followed by middle and lower-income households with respectively ≤10% to <15% (16.34%) and ≥15 (11.37%), and ≤10% to <15% (14.55%) and ≥15 (11.05%).
The results of the chi-square test reveal that the total household expenditure on energy was significantly related to income. Such a result is considerably important for a country like Iran where LPG, electricity, kerosene, and petrol as modern energy sources impose considerable costs upon households, such that approximately 81.5% of lower-income households spent over 10% of their monthly income on energy. The high price of energy may hinder the use of such fuel sources among a wide range of households. Previous studies also reported that such an ascending trend of energy prices may mostly put pressure upon low-income families that struggle to meet their energy needs. According to the SCI [
24], an average household spent 3.15% on energy source per week, while middle-income and low-income households devoted respectively 3.95% and 2.87% of their income to energy expenses, indicating that they could not afford their energy expenditure. Considering the prevailing condition in Iran where a minimum wage of less than
$200 USD is paid to workers, it can be implied that Iranian households feel extra pressure, particularly in urban areas where households predominantly use fossil fuels. As reported by the SCI [
24], Iranian urban households spent approximately 8.5% on fuel/light irrespective of energy used for transportation. The findings revealed that the household expenses on energy accounted for ≤5% to <10% of monthly income in 37.74% of lower-income families. Energy subsidies can also impact the energy costs for households. In Iran, the government eliminated subsidies on electricity and LPG, while kerosene and petrol are still partially subsidized. IEA [
25] reported that energy subsidy removal would augment energy expenses for 20% of both high-income and low-income households by 2–8% and 2–16%, respectively.
3.4. Logistic Regression Results of Factors Affecting Household Choice of Energy
As mentioned earlier, participants are generally divided into two groups: users and non-users.
Table 6 summarily represents the data associated with the fuel choices of the groups under scrutiny which were estimated through the logit regression analysis. The attempt was made to recognize the factors affecting the fuel choice of a household. A point worth mentioning is that there may be a wide range of factors overshadowing such a choice because households pick out different ways to respond to their energy needs. Three energy sources that households in Mahabad city predominantly selected for heating, cooling, and cooking were LPG, electricity, and kerosene.
According to the findings, the income (β = 12463.247, t = 2.634, significance (sig) = 0.002), household size (β = 15910.680, t = 2.412, sig = 0.002), and residential district (β = 12052.649, t = 2.617, sig = 0.005) were statistically determining factors influencing the use of LPG and electricity for cooking in the population under study. As implied from the beta coefficient’s sign, other factors such as education (β = −35226.7, t = −5.347, sig = 0.053), occupation (β = −8562.283, t = −1.282, sig = 0.228), and age (β = −10263.719, t = −2.514, sig = 0.008) had an indirect relationship with the choice of LPG and electricity, e.g., a higher educational level may lead to the use of LPG and electricity as the preferred choice (
Table A1,
Appendix A). This simply means that households with a higher educational level are likely to choose modern fuels rather than traditional ones. These results are in agreement with previous research reporting a positive relationship between income and fuel choice [
27,
28].
However, unlike that proposed by “energy ladder” hypothesis, higher-income households fail to necessarily avoid traditional fuels, such that middle- and higher-income households tend to use a combination of traditional and modern fuels. For instance, households with the mentioned levels of income in Mahabad city occasionally used LPG for cooking. Traditional fuels had a lower share in energy demand, whereas they failed to be avoided by higher-income households. These results are in line with the findings obtained from studies on preferred fuel among rural households in China [
29,
30] and urban households in India [
31,
32]. They reported that higher-income households are more likely to use LPG rather than kerosene. Other factors, such as age, household size, occupation, and gender, failed to have a significant impact on the use of LPG. However, the negative coefficients of age and household size indicate that they had an indirect relationship with the adoption of LPG as an energy source. In other words, the use of LPG is more likely in small-sized and young adult-headed households.
The results of the analysis conducted on the fuel choice of the sample under scrutiny in Mahabad city highlight that households tend to use a variety of fuels rather than only modern fuels as an alternative for traditional ones. As revealed, the use of LPG and electricity had an insignificant relationship with the occupation. Occupation of the head of household was considered a dummy variable (1 if the head of household is self-employed, 2 otherwise). The positive sign simply implies that self-employed heads of household were more likely to use LPG as a fuel source.
3.5. Logistic Regression Results of Factors Affecting Household Energy Consumption
As mentioned earlier, it was assumed that there is a significant correlation between the household demographics and energy use. Therefore, the energy sources under scrutiny were analyzed in terms of the household rate of consumption (
Table 7). The results reveal that household demographics had a significant impact on LPG consumption (β = −33,870.6, t = −5.427, sig = 0.000) and electricity consumption (β = −10,860.719, t = −2.617, sig = 0.009), as demonstrated in
Table 7. Therefore, the hypothesis suggesting a significant correlation between household demographics and LPG consumption was confirmed. The results are consistent with the findings presented by the previous researches [
6,
17]. Considering the fact that the present study mainly aimed to recognize those household demographics significantly impacting the energy consumption, the independent variables were carefully scrutinized. The standardized beta coefficients (β) shed light on the fact that income was the most significant household demographic characteristic influencing the energy consumption, followed by the number of household appliances. However, the household size and the number of rooms also played roles in this regard, albeit to a lesser extent.
The results show that there was a direct relationship between LPG consumption and household size. This straightforwardly means that the smaller the size of a household is, the lower the consumption of LPG is. Put another way, a unit reduction in the household size accounted for approximately 14% (β = 0.139, t = 4.235, sig = 0.000) variation in LPG consumption. This is mostly due to the fact that LPG is a rather expensive fuel source which is rarely affordable for larger-sized households tending to choose cheaper alternatives. Moreover, considering that a gas-operated oven/stove as the common cooking appliance fails to fit large pots mainly used by most women in Iran, attention is likely drawn to other energy sources.
Moreover, the results suggest that the head-of-household age was not related to the LPG consumption; gender, on the other hand, played a determinant role in this case. Gender was considered a dummy variable (1 for male, 2 otherwise). Results showed that gender was positively related to LPG consumption, such that male-headed households tended to have higher LPG consumption. However, as cooking is considered a female task in Iran, men are rarely expected to do the cooking. In cases that such a task is assigned to men, they are likely to use LPG. Women, on the other hand, use a variety of fuels considering various factors including availability and cost. Therefore, male-headed households are more likely to use LPG.
The results highlight that “gender” was a determinant variable, as there was a statistically significant relationship with electricity consumption. Gender was considered a dummy variable (1 for male, 2 otherwise). This negative relationship implies that an increased number of male-headed households may lead to reduced electricity consumption in Iran. Male-headed households consume lower electricity, indicating the prominent role of women in highly energy-consuming tasks, i.e., cooking.
It was also noted that there is a direct relationship between the size of the household and the rate of electricity consumption. Similarly, Peng et al. [
33] reported such an association, i.e., a larger size of household leads to a higher rate of electricity consumption. In the case that other variables remained constant, household size led to nearly 15% (β = 0.145, t = 4.352, sig = 0.000) variation in the energy consumption.
As found, there was an inverse relationship between electricity consumption and the head-of-household age. This implies that young adult-headed households are more likely to have higher electricity consumption. The results show that, in the case that other variables remained constant, a reduction in the head-of-household age led to nearly 50% variation in the electricity consumption.
Income was another variable having a noticeable impact on the LPG and electricity consumption, respectively accounting for approximately 37% (β = 0.366, t = 0.725, sig = 0.469) and 53% (β = 0.533, t = 1.459, sig = 0.145) variation, provided that the other variables remained constant. According to the findings, the positive relationship between the income and electricity (and also LPG) consumption was highly associated with appliance ownership. That is to say, higher-income households had a higher chance of purchasing more home appliances, subsequently resulting in higher energy consumption. The limited consumption of energy sources in lower-income households was attributed to the financial difficulty faced by families in buying such a fuel source [
34] due to the deregulation of the downstream sector in recent years.
4. Discussion
During the past two decades, an augmentation in the combined use of LPG and electricity for heating led to a fixed rate of total residential energy consumption per capita in Iran [
35]. The household size and the floor space of buildings were proven to be significantly related to energy consumption [
36]. This is in line with the study conducted by Bendar et al. [
37] who investigated that space heating consumes about 55% of all energy consumption in the United States. Taking 2000–2015, for instance, an increase in floor space from 100 to 140 square meters was accompanied by a rise in appliance ownership and energy consumption in Iran. Meanwhile, the size of households declined from 5.12 in 1986 to 3.40 in 2016 [
24]. The augmented consumption of electricity during the respective period was mostly due to the increased use of air conditioning, whether from the point of view of conditioned space or from that of consumption hours. The growth of population at an average annual rate of 1.24% in Iran [
24] was another determining factor that resulted in higher residential energy consumption per capita during the period at issue.
The findings revealed a significant relationship between household demographics and LPG consumption. Unlike other independent variables affecting the consumption rate of LPG by households, age failed to have a significant role in this regard. As observed, there was a direct relationship between income and electricity consumption. That is to say, the higher the income of a household is, the higher the electricity consumption is. Therefore, middle- and higher-income households were more likely to use electricity as an energy source compared to their lower-income counterparts, because they mostly preferred LPG to this end in 2016. In other words, in Mahabad city, LPG is a widely used energy source in households. However, unlike that posited by the “energy ladder” model, higher-income households fail to necessarily avoid traditional fuels. The presupposition is that the rate of electricity consumption varies between low- and higher-income households. The former, in general, tend to use traditional fuels; contrariwise, the latter prefer to consume modern fuels. Returning to the obtained results, this presupposition failed to be true in the area under study due to the fact that the merging of two types of fuels was the prominent pattern observed in households with higher income; however, other fuels had a lower share.
Moreover, the findings indicate that households in Mahabad city mostly used LPG and electricity to meet their energy requirements in 2016. Hereby, the “energy ladder” hypothesis was questioned on the basis of some conflicting findings in Iran. The key problem with the energy ladder is that increasing the household income leads to abandoning a fuel choice and its consumption in favor of a modern energy source. However, results from this study highlighted other factors affecting the choice and consumption of fuels rather than income. Similar to the energy services model [
23], the 3-ED model refers to the benefits of utilizing a particular energy source. The nature of these services is multi-variegated and, therefore, one service and benefit can result in the realization of other benefits and services. In rural areas of developing countries like Iran, biomass energy sources are used for producing energy spent on heating, cooking, and lighting. It needs to be mentioned that the energy services can be categorized in sectors. This means that the energy services of the household, transportation, commercial, and industrial sectors differ considerably. In addition, urban energy services are categorized into high, medium, and low categories. Households with low incomes, which are categorized in the low category, use a higher amount of energy without being given a sufficient number of services. The sufficient number of services available for households is categorized into medium and high. In Mahabad city, cooking, heating and cooling, lighting, radio, television, computer, and refrigeration are the domains where the highest numbers of energy services materialize. LPG, electricity, kerosene, and petrol were the energy source choices of the middle class in the study area in 2016. These choices had a higher number of energy services. These energy sources were spent on cooking, hot water, heating, lighting, and entertainment. The reason why these households used more energy is that they possessed more affluent and luxuriant appliances such as heated swimming pools, air conditioners, and multiple kitchens. This is not the case when it comes to households with low incomes. Low-income households economize their energy consumption so that they can manage their limited budgets. Unlike the upper class, low-income households cannot spend energy extravagantly. Loveday et al. [
38] exemplified the contrast between these two opposing attitudes toward energy consumption. While an upper-class household prefers to fix the thermostat on a very high degree in winter, a household with low income prefers to wear more clothes. The latter does not have the privilege of preferring the convenient choice, which is to heat the house with more energy. Interestingly, a factor may have a prominent role in one fuel source but an insignificant role in another. The findings reveal that, depending on the
R2 coefficients (a measure of the dependent variable that can be determined by the independent ones), the model predictability may differ.
5. Conclusions
The present study was designed to determine the effect of factors on the household energy choice and consumption in Mahabad city. Relying on a different perspective, the present study dealt with a variety of energy sources widely used by households, namely, LPG, electricity, and kerosene for cooking, heating and cooling, lighting, and home appliances. Energy sources may vary in different ways; their adoption was also affected by a number of factors, including household size, gender and age of the head of household, educational level, and income group. Before drawing inferences of the results obtained, the normality test was applied to avoid skewness. Returning to the aims posed at the beginning of this study, the logistic regression analysis results revealed that income, household size, and residential district (urban and rural areas) were the major factors that influenced the choice of fuels used in meeting the household demands and needs. The lack of a direct relationship between head-of-household age and household energy choice and consumption adds further caution regarding the generalizability of these findings. Furthermore, the results showed that, in the case of other variables remaining constant, income may lead to variation in LPG and electricity consumption. Moreover, the findings indicated that income had the most significant impact on LPG and electricity consumption, resulting from the fact that a plethora of households using these energy sources belong to the middle- and higher-income strata in the region under study.
Apart from the household income, the price and availability of energy sources impacted households’ tendency to change their preference toward energy switching. Utility bills in Iran have their own defined table, where increased use leads to a higher fuel price in increments. However, around three-quarters of respondents spent less than 10% of their income on energy consumption, and there was no considerable difference between low-, middle- or high-income groups. In addition, this study produced results which corroborate the findings of a great deal of previous studies on household energy consumption. In a study conducted in Portugal by Wiesmann et al. [
19], it was reported that residential energy consumption was affected by the level of income, the condition of the building, and appliance ownership. Similarly, this study confirmed the findings of Muller and Yan [
17] which found that household size, building type, and the number of rooms had the most significant effects on energy consumption. In addition, this study was devoted to an area with a different consumption pattern relative to other parts, and the impact of factors mainly neglected in a large number of previous studies was considered. What stands out in this regard is that the given pattern of energy choice and consumption by households plays a great role in reducing GHG emissions. Hence, this knowledge could facilitate policies that enhance energy supply and consumption.


 ,
, 

