1. Introduction
Over the last few decades, various simulation models have been developed to study crowd evacuation dynamics in normal and emergency situations, including the agent-based model, cellular automaton model, social-force mode, game theory model, and so on. Agent-based models have a unique set of behavioral rules, which allow for modeling heterogeneous populations (e.g., different preferred walking speeds for elderly and disabled people) [
1,
2,
3,
4]. Cellular automaton models typically simulate the homogeneous population of adults in buildings; that is, each cell is occupied by a single adult [
5,
6,
7,
8]. The social force model, treating all kinds of pedestrians as force-driven particles, has been used for the evacuation problem of pedestrians [
9,
10,
11,
12]. Game theory model applies the game rules of pedestrians in various industries to deal with the interaction between limited types of pedestrians [
13,
14,
15,
16]. Research achievements available in models provide much helpful advice for guiding safe evacuation.
High-rise buildings are increasingly popular in modern cities, but the research on safety management of high-rise building is inadequate. High-rise buildings usually include more complex architectural structures and hold more people than single-story buildings [
17]. The uncertainties in the accessibility of building environment and excessive evacuation distance can easily lead to congestion and stampedes [
18]. As a result, it is difficult to model the evacuation of high-rise buildings [
19].
Empirical research and simulation experiments have been conducted, and various factors affecting safety evacuation of high-layer buildings have been analyzed to improve the efficiency of evacuation and reduce casualties [
20,
21,
22]. Different simulation models have been proposed to evaluate the effectiveness of evacuation strategies for high-layer buildings [
23,
24,
25,
26,
27,
28]. A review of pedestrian behavior and model studies from high-layer building evacuations revealed the evacuation effects of stairs and elevators [
29,
30]. A time model has been applied to analyze the impact on the breadth of entrance on the evacuation speed [
31]. A control volume model assumes that each person is an independent particle, and forms a virtual closed surface by connecting people at the exit waiting to evacuate, which is used to simulate the dynamic behavior of evacuees and calculate the evacuation times of a multi-storey building [
32]. Although these models can be used to simulate the pedestrian evacuation of high architecture in certain kinds of emergencies, it is still challenging to make a precise modeling of the evacuation process.
Membrane computing is a branch of natural computing, which is enlightened by the organization, the function, and the structure of cells in organs and tissues [
33]. It provides novel computational models called P systems. The majority of P systems have been proven to be computationally universal [
34,
35,
36]. Numerous PSPACE (Polynomial Space) problems and NP-hard (Non-Deterministic Polynomial-hard) problems have been solved by P systems on a polynomial timeline [
37,
38,
39]. Furthermore, P systems have provided nondeterministic frameworks and distributed parallel for computing or optimizing [
40,
41,
42] that have been applied in various aspects of engineering [
43,
44]. At present, certain types of P systems have been used as modeling notation for ecosystems [
45] and pedestrian behavior [
46]. Readers can find circumstantial evaluations of miscellaneous P systems in the literatures [
47] and [
48].
A novel bio-inspired simulation technique called the intelligence decision P system (IDPS) was proposed to describe the evacuation process, considering the similarity between pedestrian movement behavior and cell migration process [
49]. The cell migration process is explained in
Figure 1. First, cells adhere to the substrate and sense the concentration gradient of the signal molecules. Second, the cell membrane protrudes in the forward direction. Then, the pseudopodium adheres. Finally, the pseudopodium in the back contracts to lift the back of the adhesion and moves forward. The IDPS was enlightened by the cell migration process. Unlike traditional P systems, cells in IDPS have the characteristics of intelligent decision-making and are movable. Guided by external signals and migration rules, cells move toward their destinations in a two-dimensional space. At each step of the cell’s walk, a deliberate decision is made to perform the next action until the termination signal appears.
In IDPS, pedestrians can choose evacuation routes and move to the destination according to their own migration mechanisms. They can communicate with their neighbors during the evacuation process and adjust their behaviors according to the surrounding environment. In this study, five factors (density threshold, interaction probability, walking speed, population distribution, and stair width) which may affect pedestrian evacuation of high-rise buildings, were analyzed in the framework of IDPS. Compared to the previous work mentioned above, IDPS has its own special interaction mechanism, decision-making mechanism, and moving mechanism, all of which can accurately simulate the real-time status of each person in succession. The main works and contributions can be summarized as follows: (1) The IDPS model was applied to simulate the crowd evacuation process of high architecture combining individual intelligence with swarm intelligence. During the moving process, cells perceived the environment, obtained knowledge, and made decisions according to their inherent rules. At the same time, they interacted with their neighbors and adjusted their behaviors. This model described the evacuation process as realistically as possible to contribute to crowd evacuation management and architectural design. (2) The factors that influence the total evacuation time, namely the density threshold, the interaction probability, the walking speed, the population distribution, and the stair width, were analyzed in this study, proving that both the density threshold and the interaction probability can be used to improve the load balance at staircases and exits. The evacuees’ perceptions of the environment guided them to the staircase with fewer people. For the exit or staircase that was out of sight, evacuees obtained information primarily from their neighbors to form a proper knowledge base.
In the remainder of this paper, some necessary preliminaries are noted in
Section 2 with respect to the formal definition of the IDPS model. In
Section 3, the implemented method of simulating crowd evacuation of high architecture is detailed. In
Section 4, the experiments are described, and the results are summarized. The conclusions are given in the last section.
2. Intelligence Decision P System for Evacuation of High-Rise Buildings
An intelligence decision P system with , is described to simulate the evacuation process of high-rise buildings in this section. The IDPS consists of cells labeled with ; all of these cells are placed in the environment, and the environment is marked with . is the alphabet set of objects. is the set of objects in the environment at the beginning of simulation, and each has an arbitrary number of copies; the environment is defined as the place of cell movement. It records the current location of each cell and contains a number of signal objects that affect cell movement. is the state of cell at step , where is the real-time location of cell ; refers to the speed; denotes the knowledge base. means the initial state of cell . are strings over , describing knowledge bases placed in cells respectively at the beginning of the simulation. are a set of rules which guide the evolution of cells. denotes the target set of living cells. is the starting signal and is the termination signal for cell movement.
Once the initial signal is emitted, cells will move to the target location under the direction of in the environment. Meanwhile, cells are required to determine the next action to be performed at each step, i.e., velocity and direction. They stop moving when arriving at destinations or when a termination signal appears within the current situation. A configuration of IDPS is defined by the multiple groups of objects in the system. indicate the status of all cells in the environment at step . The configuration of the next system is determined by the rule applied to the previous system. All calculations start with the initial configuration and continue. The system stops evolving when all cells stop moving. The experimental results are achieved by calculating the number of cells passing through the specified exit.
2.1. Update the Knowledge Base
Cells can make decisions based on information from their own knowledge base. The initial knowledge base of cells is set according to their types, initial positions, etc. For the sake of simplicity, it is assumed that the evacuees are students or teachers in this study; therefore, they know all exit locations at the beginning and belong to only one type. Evacuees obtain information to renew their knowledge base in two ways.
(1) Evacuees communicate with their neighbors with a certain possibility. They share the best evacuation route for the current location with each other and update knowledge base with the following rules:
where
is the best and available evacuation information when evacuee
interacts with other evacuees. If evacuee
and other evacuees whose evacuation direction is more than 120 degrees at a distance less than 1m are interacting with a probability
, then evacuee
acquires new information
and then updates the knowledge base
to
; otherwise, the original knowledge base
is maintained.
(2) Evacuees perceive their surroundings, collect the crowd density values at each exit, and update their knowledge base. Crowd density can be calculated with the following rules:
where
is the maximum number of people that can be accommodated near the exit and
is the actual number of people standing near the exit. The evacuees update their knowledge base using the following rules:
where
is the latest density value,
is the density value stored in the database.
The threshold of the evacuees’ density is a very important parameter to help choose the proper staircase or exit. If the crowd density near an exit exceeds the threshold, evacuees cannot move to that exit in the next step. If the crowd density values for more than one exit are all smaller than the threshold, evacuees will incline to choose the exit with the nearest distance.
Evacuees update their knowledge base by perceiving their surroundings or communicating with their neighbors. If information obtained in two different ways is different, the evacuees will choose the one they observed and ignore the other one obtained from their neighbors.
Evacuees can obtain the best running scheme according to the knowledge base. Depending on the current position and knowledge base, cell
is able to get a number of evacuation schemes at step
.
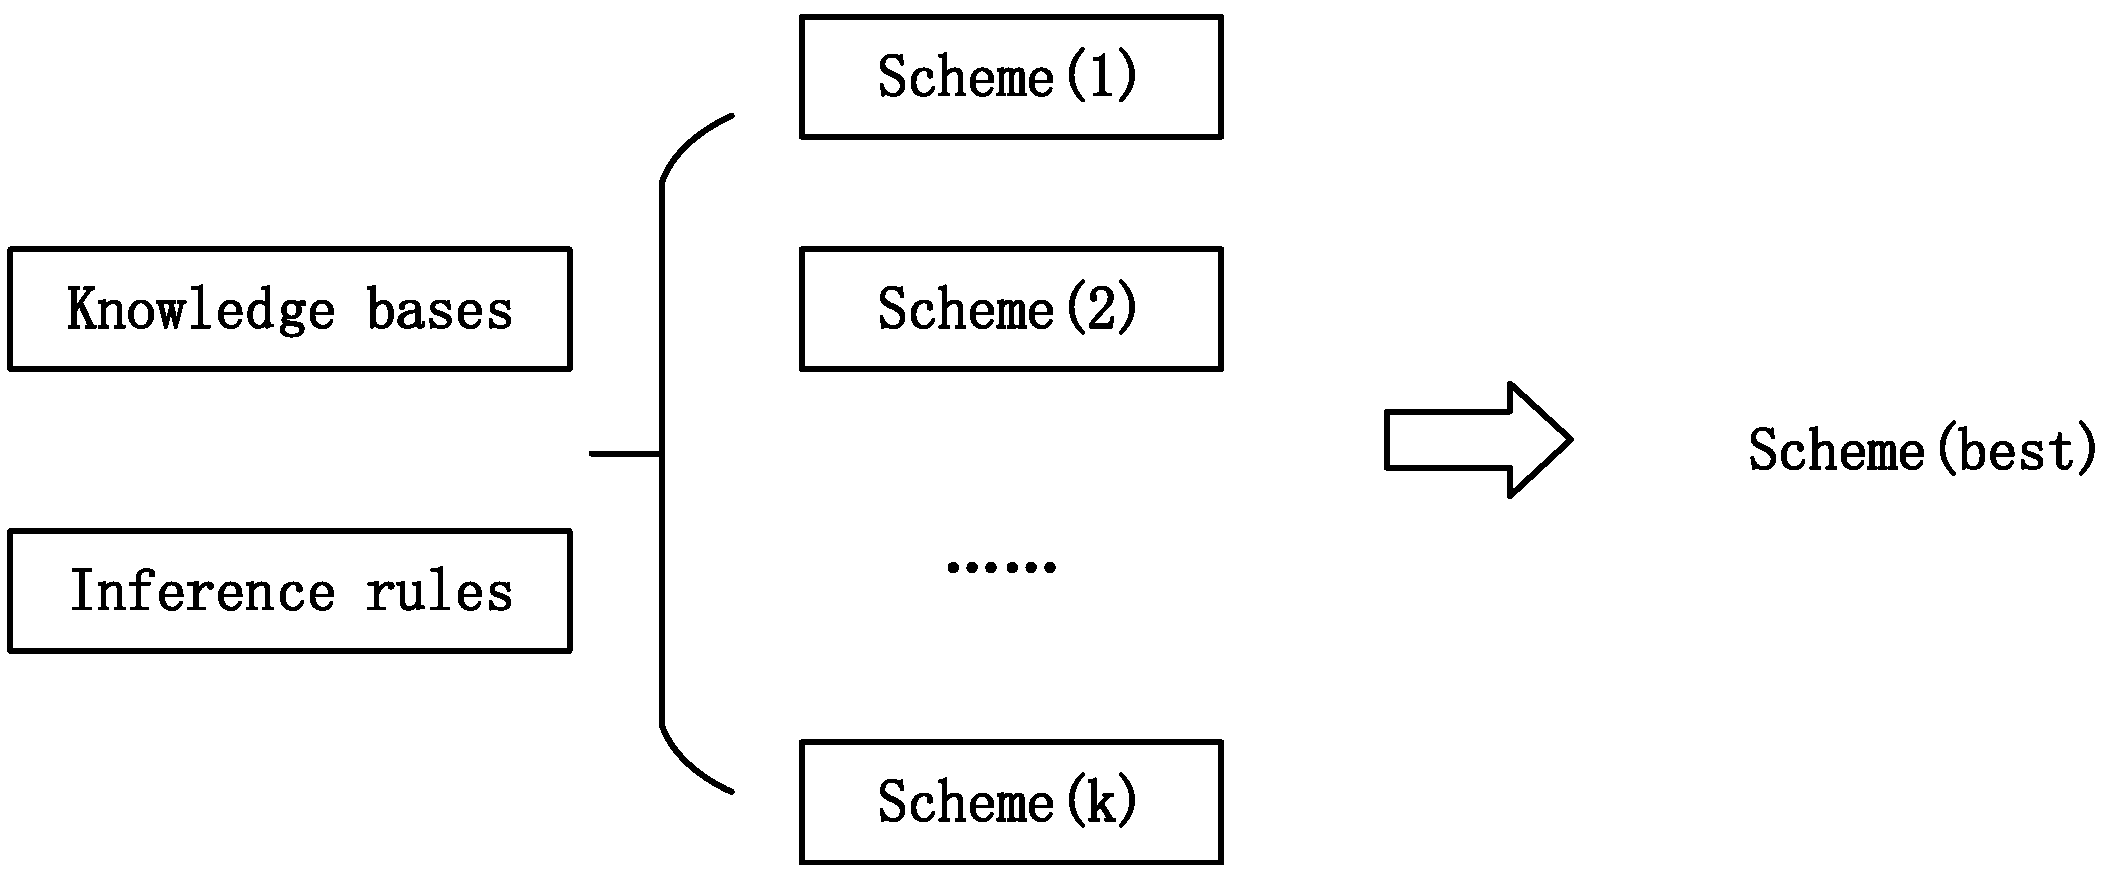
The best running plan
is chosen according to a specific requirement (see
Figure 2), e.g., minimizing the path length from the current location to the specified location.
Priority rules need to be added to these rules for decision-making.
2.2. Behavior Adjustment Mechanism
Evacuees make decisions about the best running scheme according to their own knowledge base, and calculate the expected speeds and moving directions in the next step by using rules
. However, evacuees cannot move as envisioned in some emergencies. To avoid collisions, pedestrians try to move at a distance from the surrounding static obstacles and other evacuees. Once the best escape route to the expected exit is blocked, evacuees will attempt to bypass the obstacles or change routes. The workable speed and motion direction are adjusted using rules
, where
represents obstacles. Cell
updates its location in view of the current location and velocity.
where
is the location of cell
at step
and
is velocity and motion direction of cell
at step
.
2.3. The Speed of Evacuees
Usually, the walking speed of pedestrians on stairs is in the interval
, while the speed of pedestrians moving on each floor is in the interval
[
18]. Subsequently, the velocity can be normalized by using the following equation:
where the
is the actual speed in the range of
. After normalization, the speed of pedestrians on stairs is in the interval
, and the speed of pedestrians moving on each floor is in the interval
. When evacuee meets obstacles (a wall or other evacuees) that s/he cannot bypass, then the walking speed becomes
at that time.
3. Simulation Results and Discussions
All the algorithms are implemented by using NetLogo. Experiments are run on an Intel (R) Core (TM) i5–2520M CPU with a 4 GB RAM PC. The factors that influence the total evacuation time, such as crowd densities, interaction probabilities, walking speeds, and the numbers of evacuees at each level, were analyzed. The effect of staircase width was also tested, with offering useful suggestions for the design of building structure.
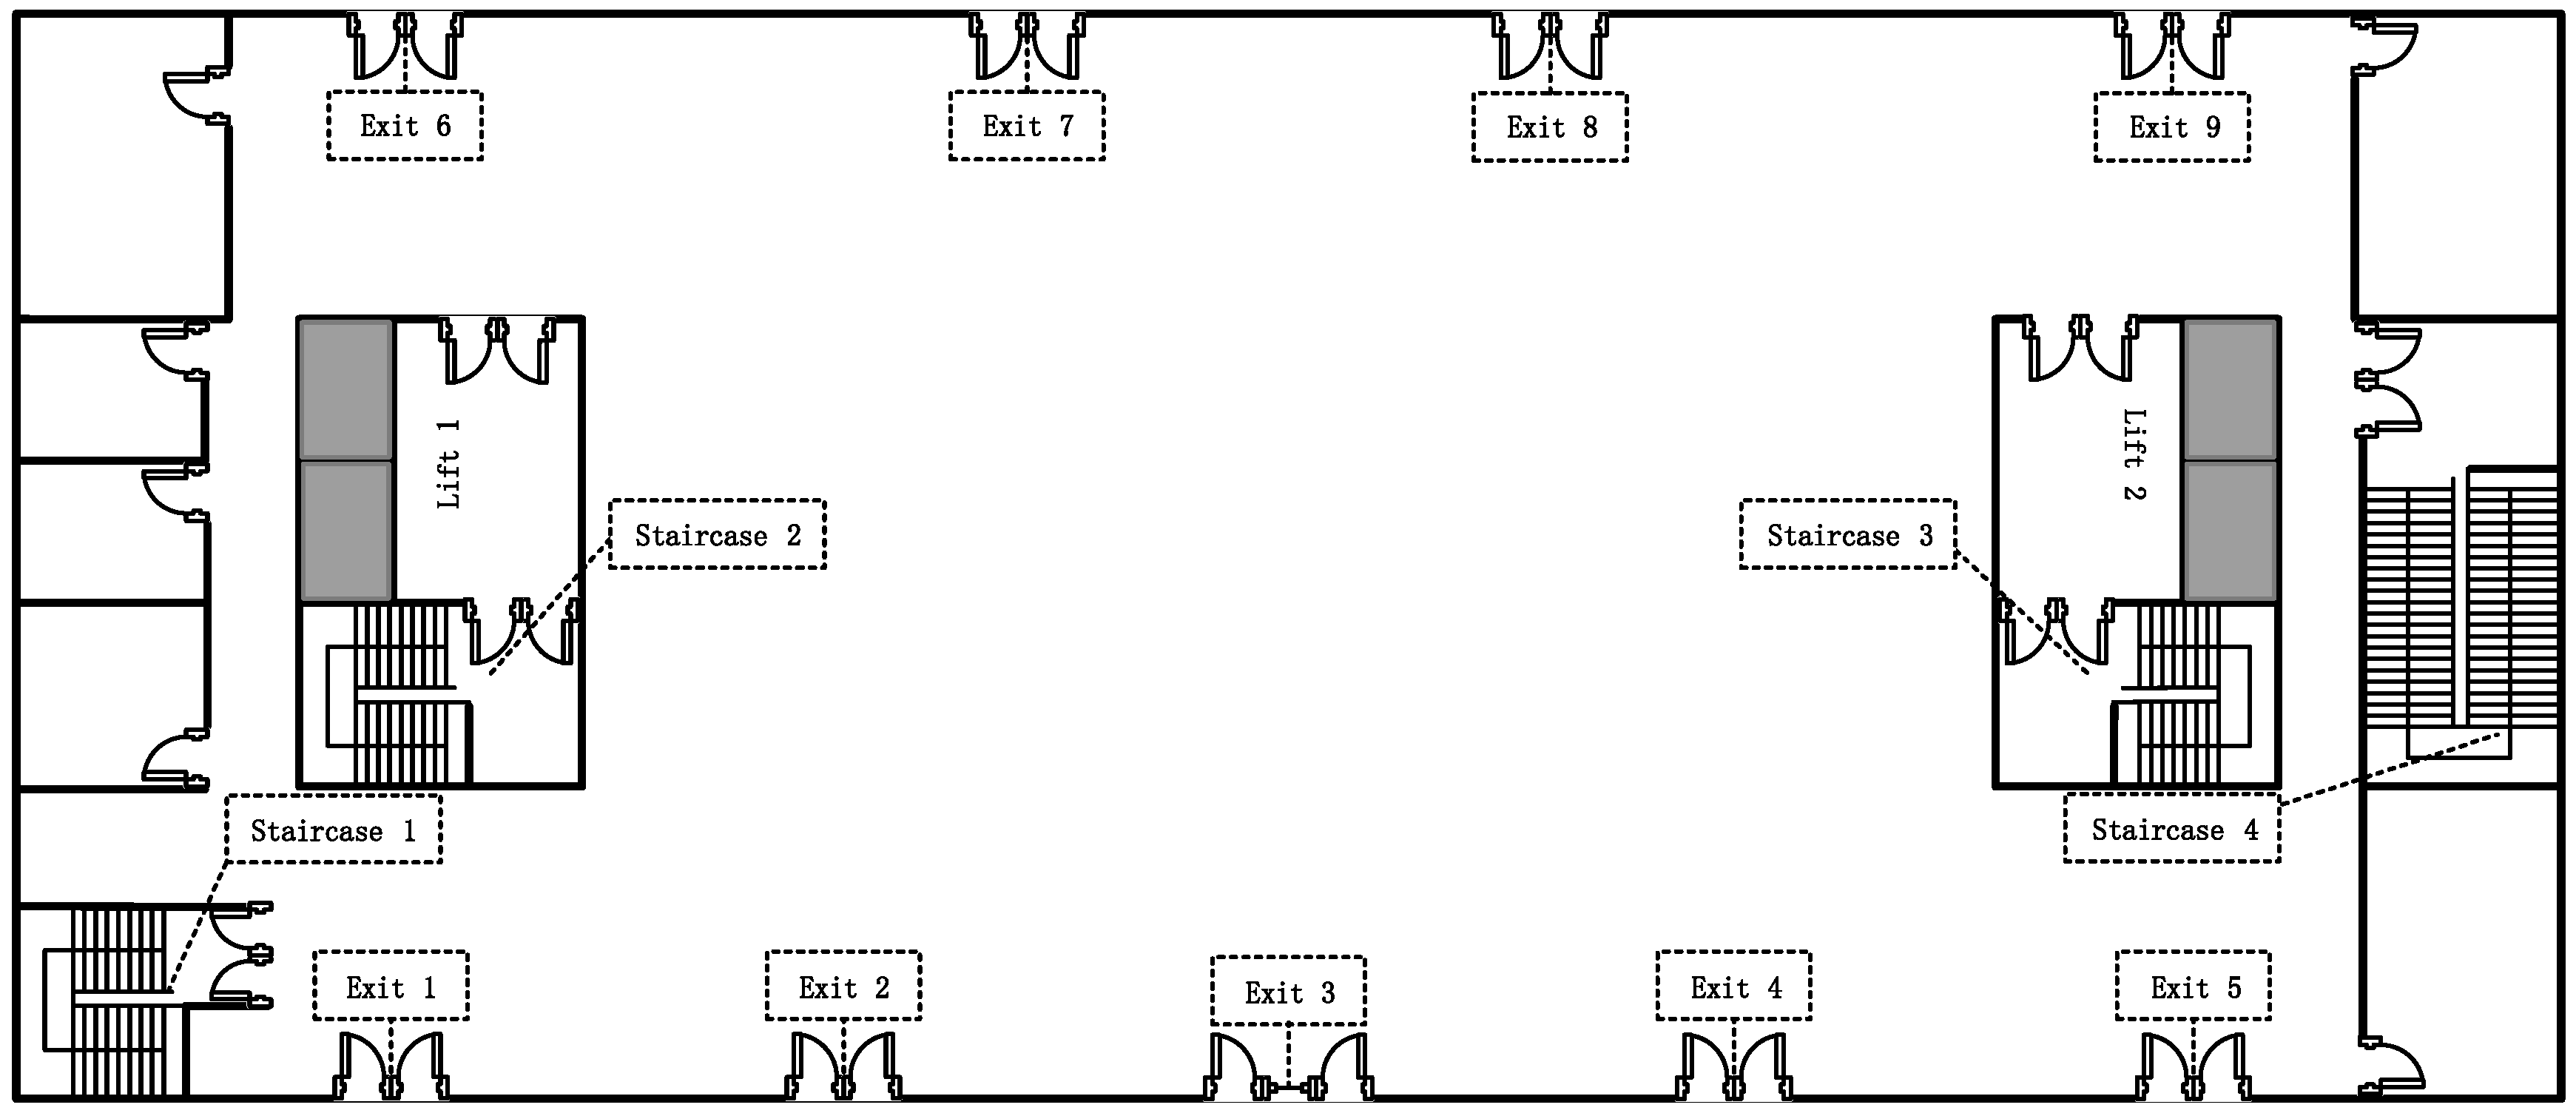
A 12-storey teaching building, where people were randomly distributed on each floor, was taken as a sample of the evacuation environment.
Figure 3 is the floor plan of the first floor. The layout of the second floor to the twelfth floor is same, as shown in
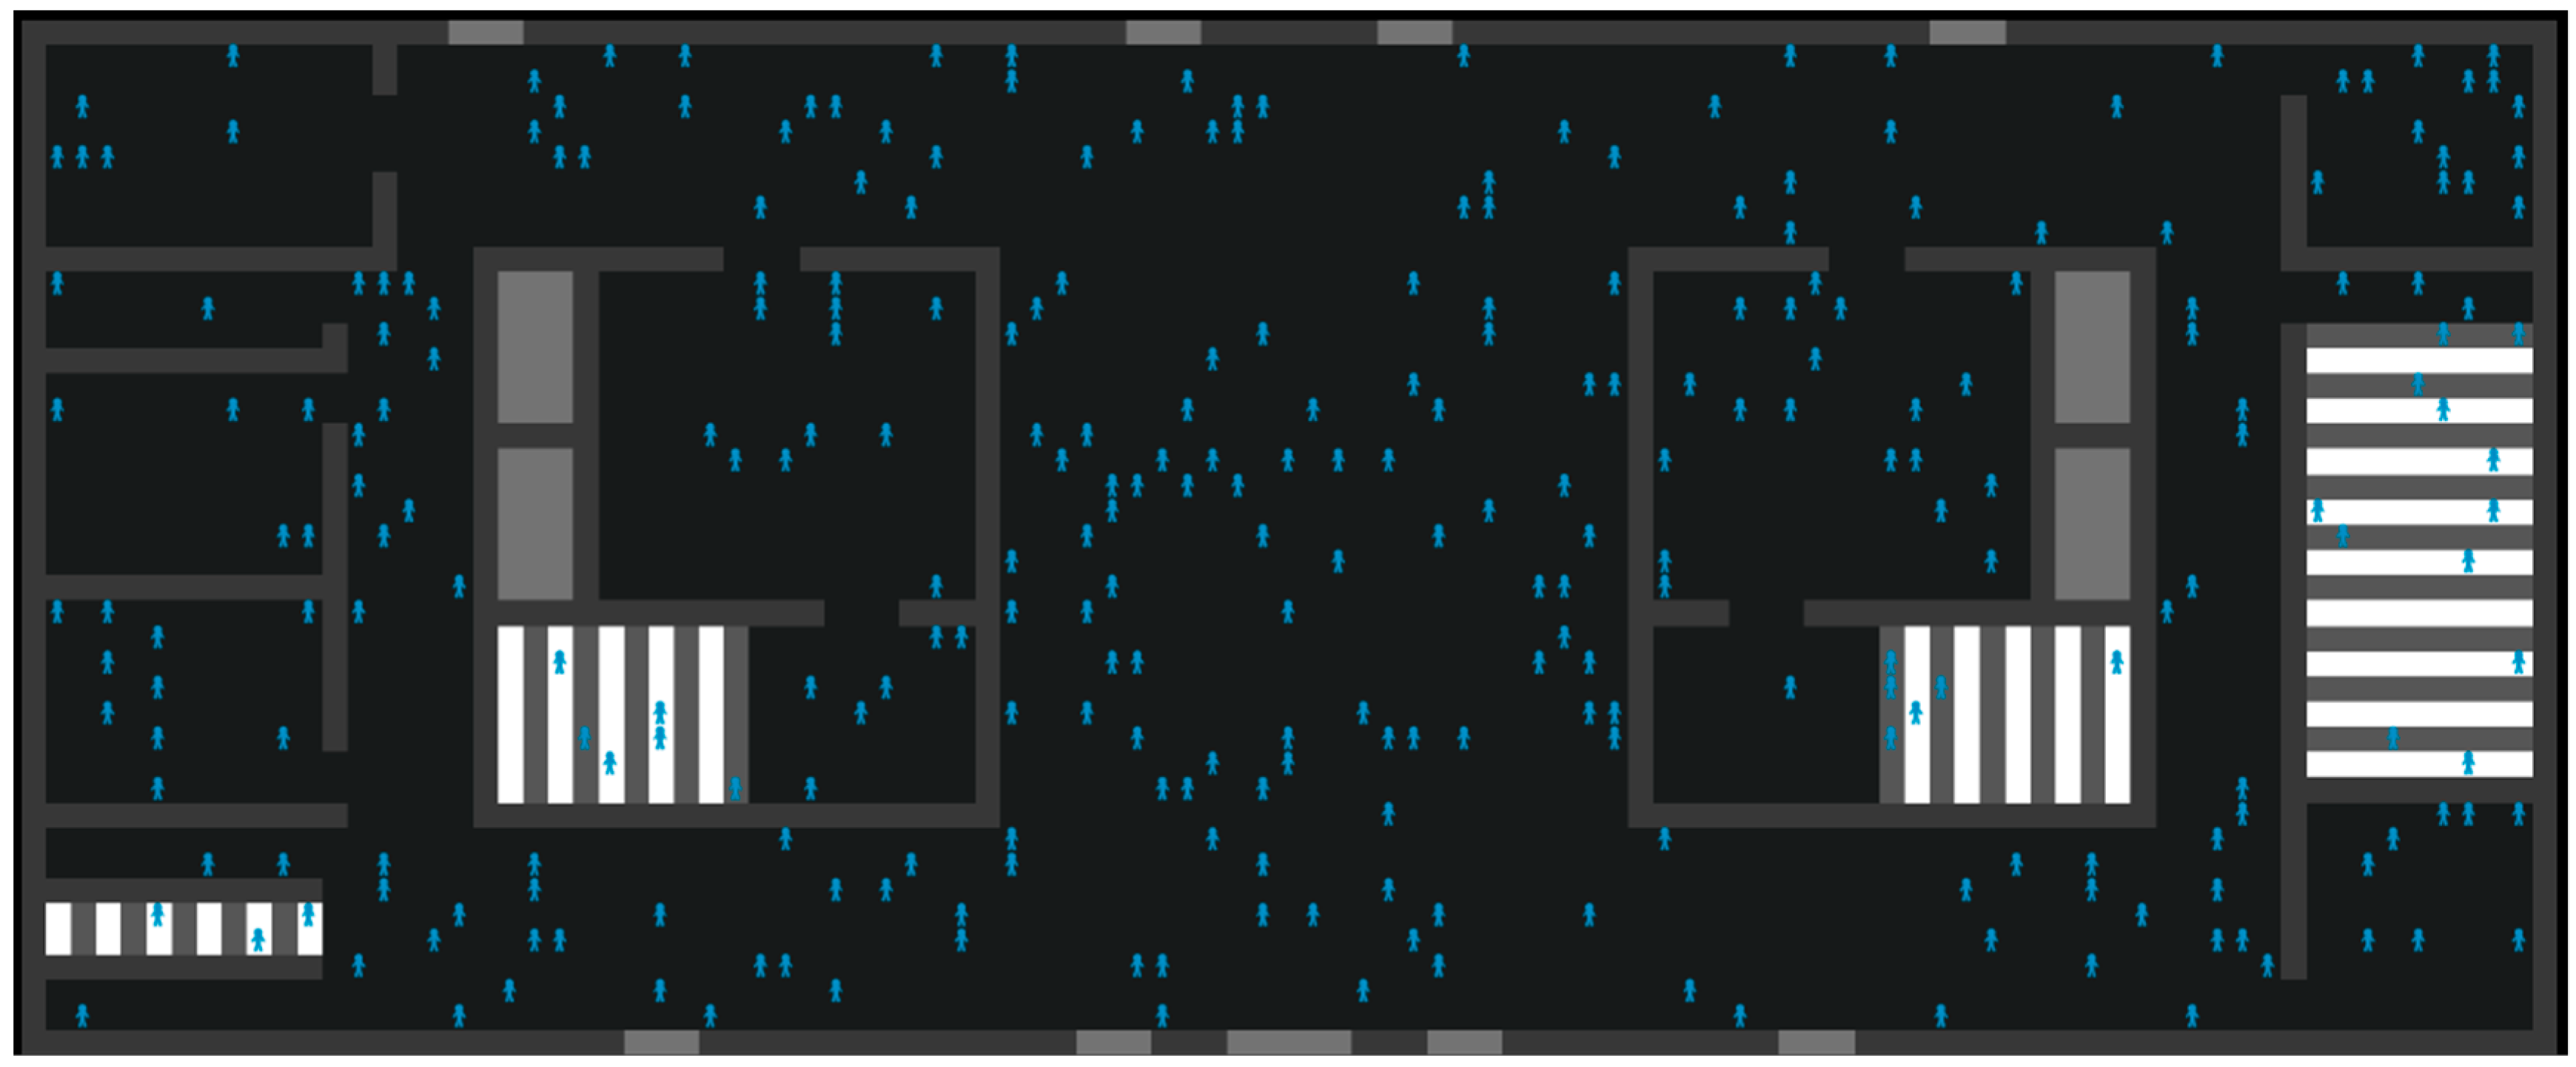
Figure 4. There are 9 exits and 4 staircases in the teaching building. Experimental Scenes are shown in
Figure 5 and
Figure 6.
In the case of multi-storey buildings, evacuees can be transported to different levels of the building by using elevators and stairs. However, when performing evacuation in an emergency such as an earthquake or fire, the use of elevators is strictly prohibited. According to the requirements of codes for building fire protection, the pedestrians on each floor can only be evacuated by stairs [
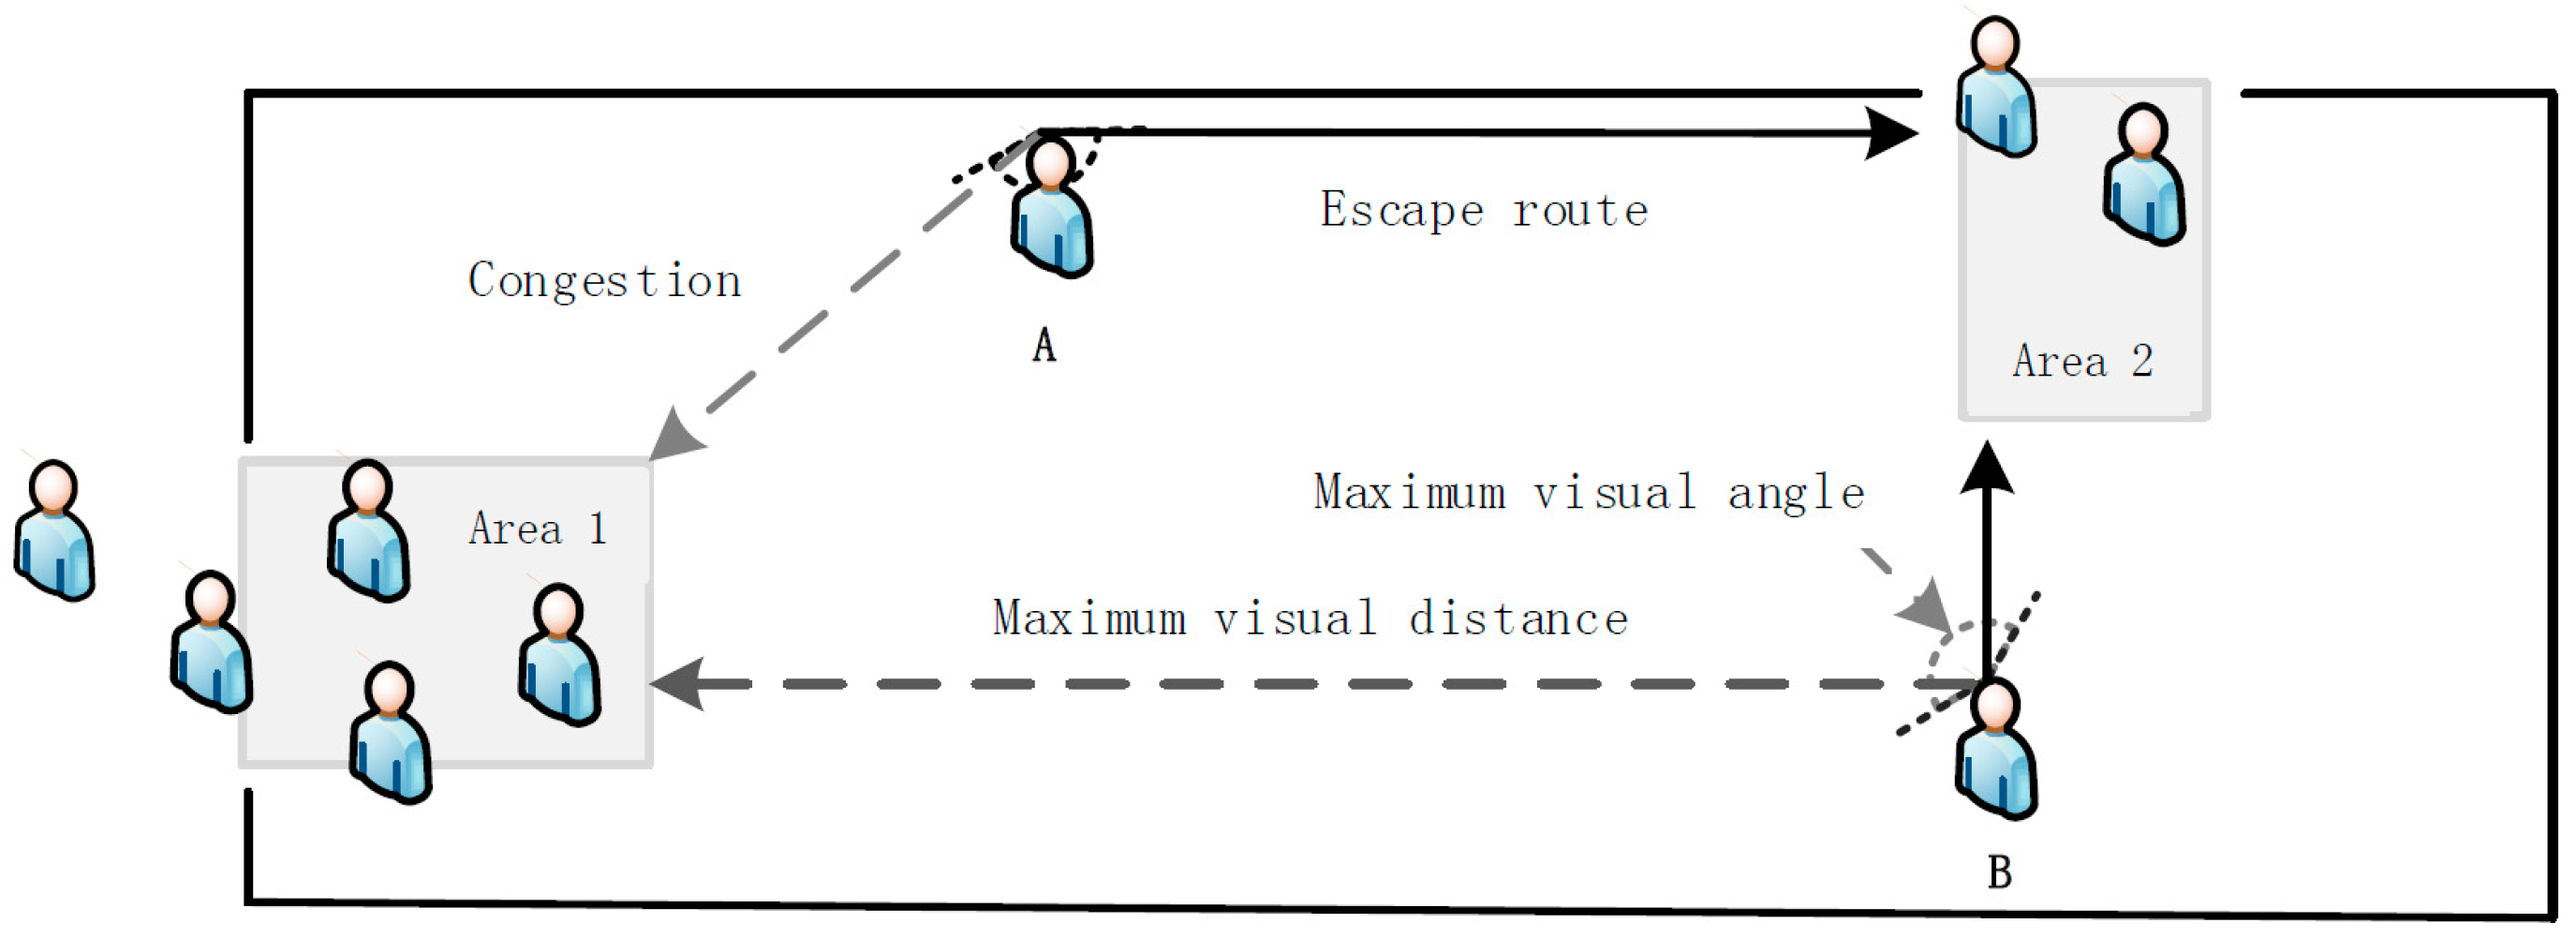
50]. Therefore, in this study we only consider evacuation via the staircase. The evacuation process of pedestrians can be divided into two phases: (i) moving to the exit of each floor, i.e., horizontal evacuation and (ii) stair evacuation, i.e., vertical evacuation. The pedestrian’s field of perception is shown in
Figure 7; the maximum visual distance is
, and the maximum visual angel is
.
3.1. Sensitivity Analysis
Experiments were carried out to test the impact on two parameters: the threshold of evacuees’ density in the staircase area
and the interaction probability
of the crowd. The number of evacuees was set to 3600, and the number of evacuees on each floor was 300 distributed randomly in the building, as shown in
Figure 6 and
Figure 7. The width of the staircase was set to 2m. The walking speed of each pedestrian on stairs was generated randomly in the range of
, and walking speed of each pedestrian moving on each floor was generated randomly in the interval
.
3.1.1. The Threshold of the Evacuees’ Density
In this subsection, we describe the sensitivity analysis of parameter and its effect on balancing the use ratios of staircases. If the crowd density near an exit exceeds the threshold, evacuees cannot move to that exit in the next step. If all crowd densities of several exits are below the threshold, evacuees will incline to choose the exit with the nearest distance. Experiments with were conducted. The interaction probability was set to 0.6. We run 100 processes for each situation in order to get enough data for the mean calculation.
When
, evacuees choose an exit or a staircase with the shortest path even if it is congested. The evacuation time is the longest in that situation. As shown in
Table 1 and
Table 2, the standard deviation (SD) of the number of evacuees reaches its minimum value when the parameter
, while the SD reaches its maximum value when the parameter
. In the beginning, each individual human is randomly located in the floor. Staircase 2 occupies an advantageous position on the floor relative to staircase 1 and is close to most classrooms and corridors. During the evacuation process, more pedestrians will first see staircase 2. Supposing there is more than one exit of the stairs in the pedestrian’s field of vision in the evacuation process, if the pedestrian density at all exits is greater than the density threshold, pedestrians will choose to wait until the pedestrian density at one of the exits decreases, then immediately evacuate to the exit. When the density threshold is set larger, pedestrians are more inclined to select the exit of the shortest path to some extent. Therefore, proper choice of the parameter
can help improve the utilization of staircases and exits. Furthermore, the escape time with
is the shortest, as shown in
Table 3.
The threshold of evacuees’ density reflects tolerance for congestion. In some cases, where there is no urgency, people are more likely to endure congestion and are willing to wait instead of finding new exits. The threshold of the evacuees’ density will be larger. In an emergency, the panicked population is often unable to accept being blocked. They are more inclined to find new ways. Accordingly, the threshold will be smaller.
3.1.2. The Interaction Probability
In this subsection, the analysis of the effect of the interaction probability between evacuees
is presented. The threshold of evacuees’ density
was set to 0.8. Experiments with
and
were conducted. We run 100 processes for each situation in order to get enough data for the mean calculation. When
, evacuees do not communicate with each other. They obtain information only by their observation of the environment. For an exit or staircase that is out of sight, evacuees cannot get any information from their neighbors to evaluate the extent of its congestion. When
, pedestrians can interact with their neighbors with probability
P, and have a chance to get better evacuation path information. The decision-making is strongly affected by incomplete information. As shown in
Table 4 and
Table 5, the standard deviation (SD) of the number of evacuees reaches its maximum value when
and reaches its minimum value when
. That is, the interaction probability
also has an effect on the utilization of staircases or exits.
The evacuation is the slowest without interaction, and the total escape time with
is the shortest, as shown in
Table 6. With the increase of interaction probability, evacuation time decreases rapidly in the initial stage. But as the probability of interaction becomes higher and higher, this reduction trend slows down, and therein occurs a rising trend. This phenomenon occurs because the interaction between evacuees takes a certain amount of time, and frequent interactions may get a lot of repetitive information.
The interaction probability reflects the possibility of people communicating information. People at an emergent circumstance (e.g., fire, earthquake) are less likely to interact with other people. If the crowd is familiar with the current environment, they will not be inclined to exchange information. So the interaction probability varies in different conditions.
3.1.3. Global Sensitivity Analysis
In this subsection, the global sensitivity of the interaction probability and density threshold is analyzed. The first-order sensitivity index
Si and the total sensitivity index
STi are used to measure the global sensitivity of parameters. The calculation formulas are as follows: [
51]:
where
is the variance of the evacuation time matrix
,
is the variance of the expectation of
conditional on
,
is the expectation of the variance of
conditional on
,
is the order of the parameters,
is the input vector,
denotes all of the model inputs except the
i-th input.
During the experiments, 16 samples were taken, i.e., the
value was 0.2, 0.4, 0.6, and 0.8, and the
value was 0.6, 0.7, 0.8, and 0.9, and the sample matrix of 16*4 was generated. Statistics of model outcomes from the mean of 100 simulated runs were measured. As a result, the first-order sensitivity indices of
and
are calculated to be 0.482 and 0.298 according to Equation (7); and the total sensitivity indices of
and
are calculated to be 0.425 and 0.475 according to Equation (8).
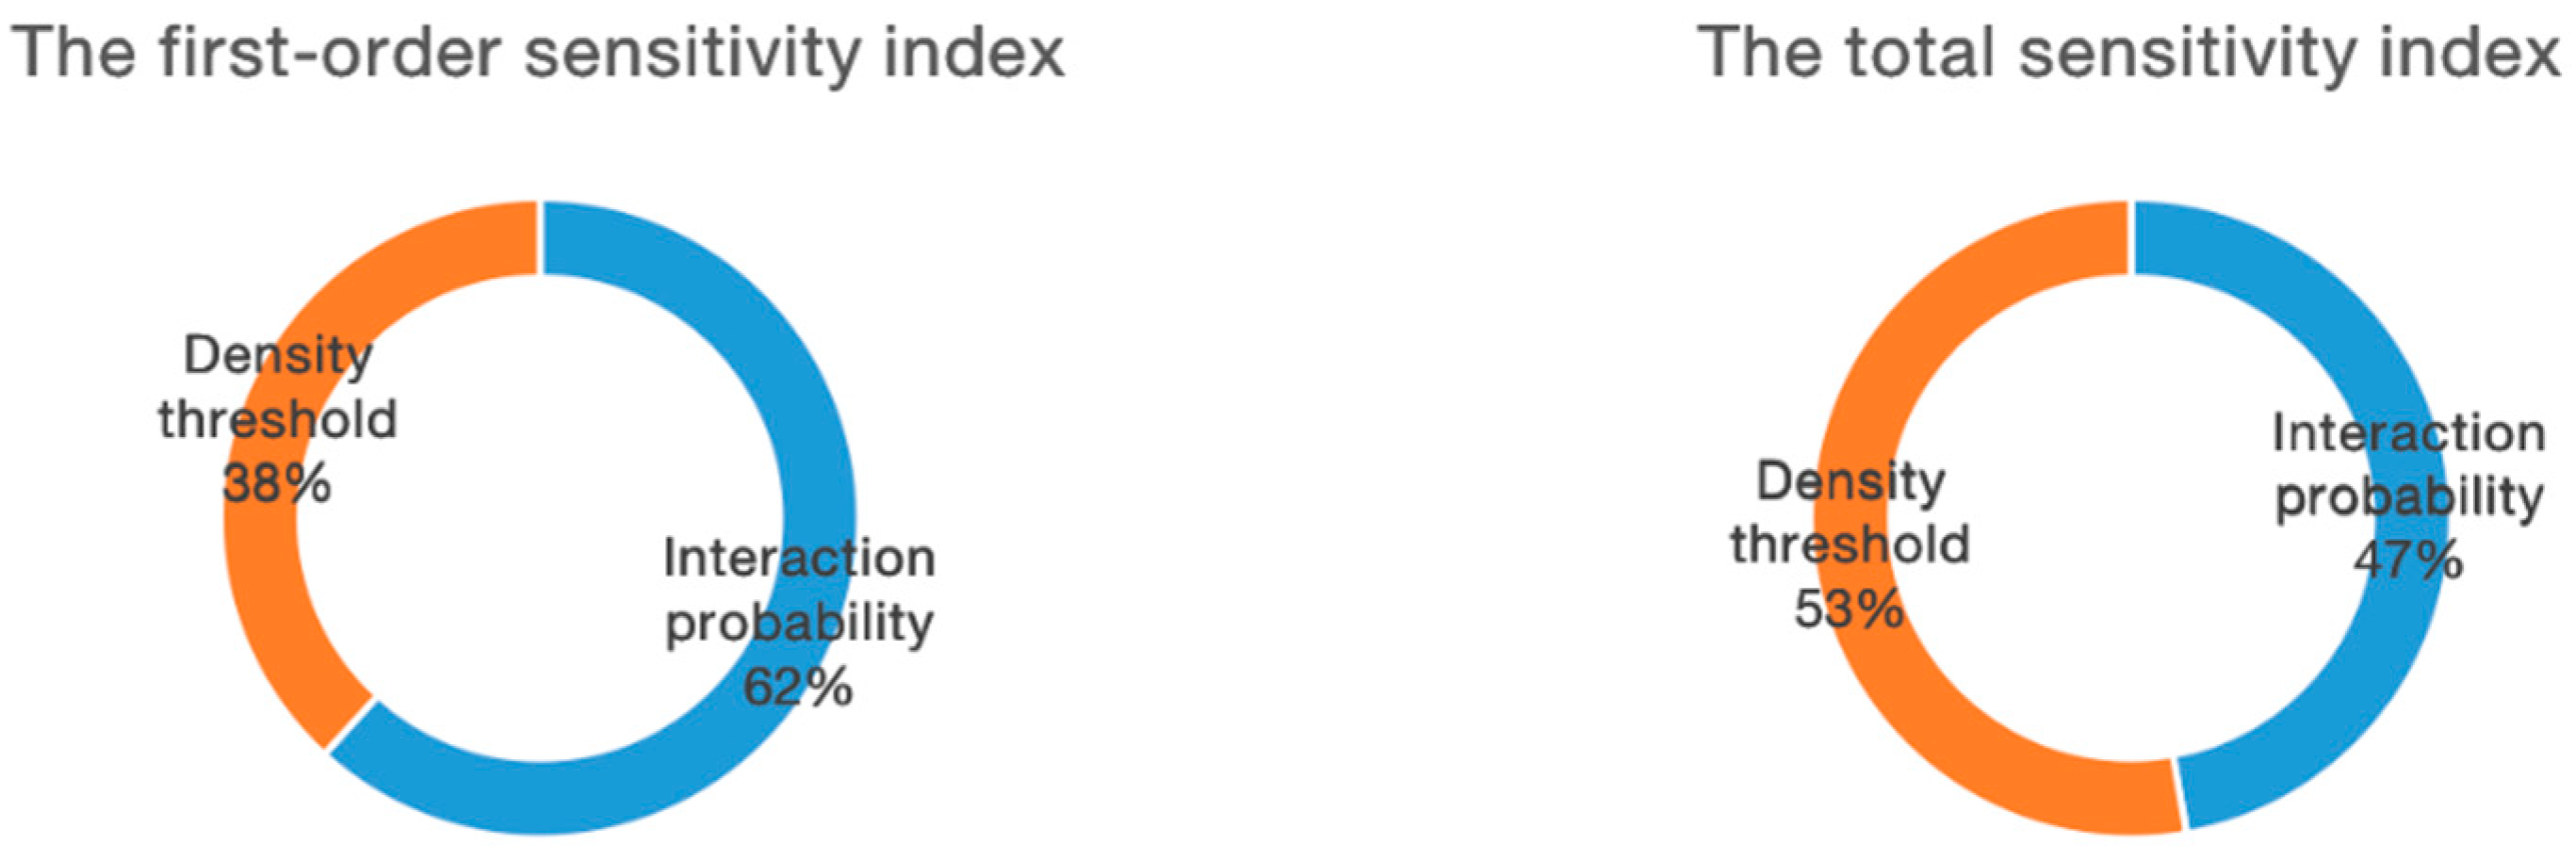
Figure 8 indicates the effects of interaction probability and density threshold. The influence of density threshold is weaker than that of interaction probability. The global sensitivity index of density threshold is a little bigger than that of interaction probability. The coupling effects of these two parameters both have great impacts on evacuation efficiency.
3.2. The Effect of Stair Speed
Experiments were conducted to analyze the impact on stair speed. The threshold of evacuees’ density
was set to 0.8. The interaction probability
was set to 0.6. The number of evacuees was set to 3600, and the number of evacuees on each floor was 300, distributed randomly in the building. The width of the staircase was set to 2m. The walking speed of each pedestrian moving on each floor was randomly generated in the range of
. The stair speed was set to 0.224, 0.416, 0.608, or randomly generated in the interval
, respectively in scenario 1 through scenario 4. For each scenario, the mean results (total evacuation times) were calculated over 100 runs. As shown in
Table 7, in the case of constant speed, the evacuation time decreased with the increase in stair speed. In scenario 4, the stair speed was randomly generated in the interval
, and the total escape time is longer than that in scenario 2. The reason for this phenomenon may be that the slowest pedestrian determines the overall evacuation efficiency. The main recommendation is that when developing an evacuation strategy, we should pay more attention to helping slow-moving pedestrians to improve their speed.
Moreover, the number of evacuees on each flight of stairs varied with time in different patterns. We define
as a set of stairs between two adjacent floors, the
, and the
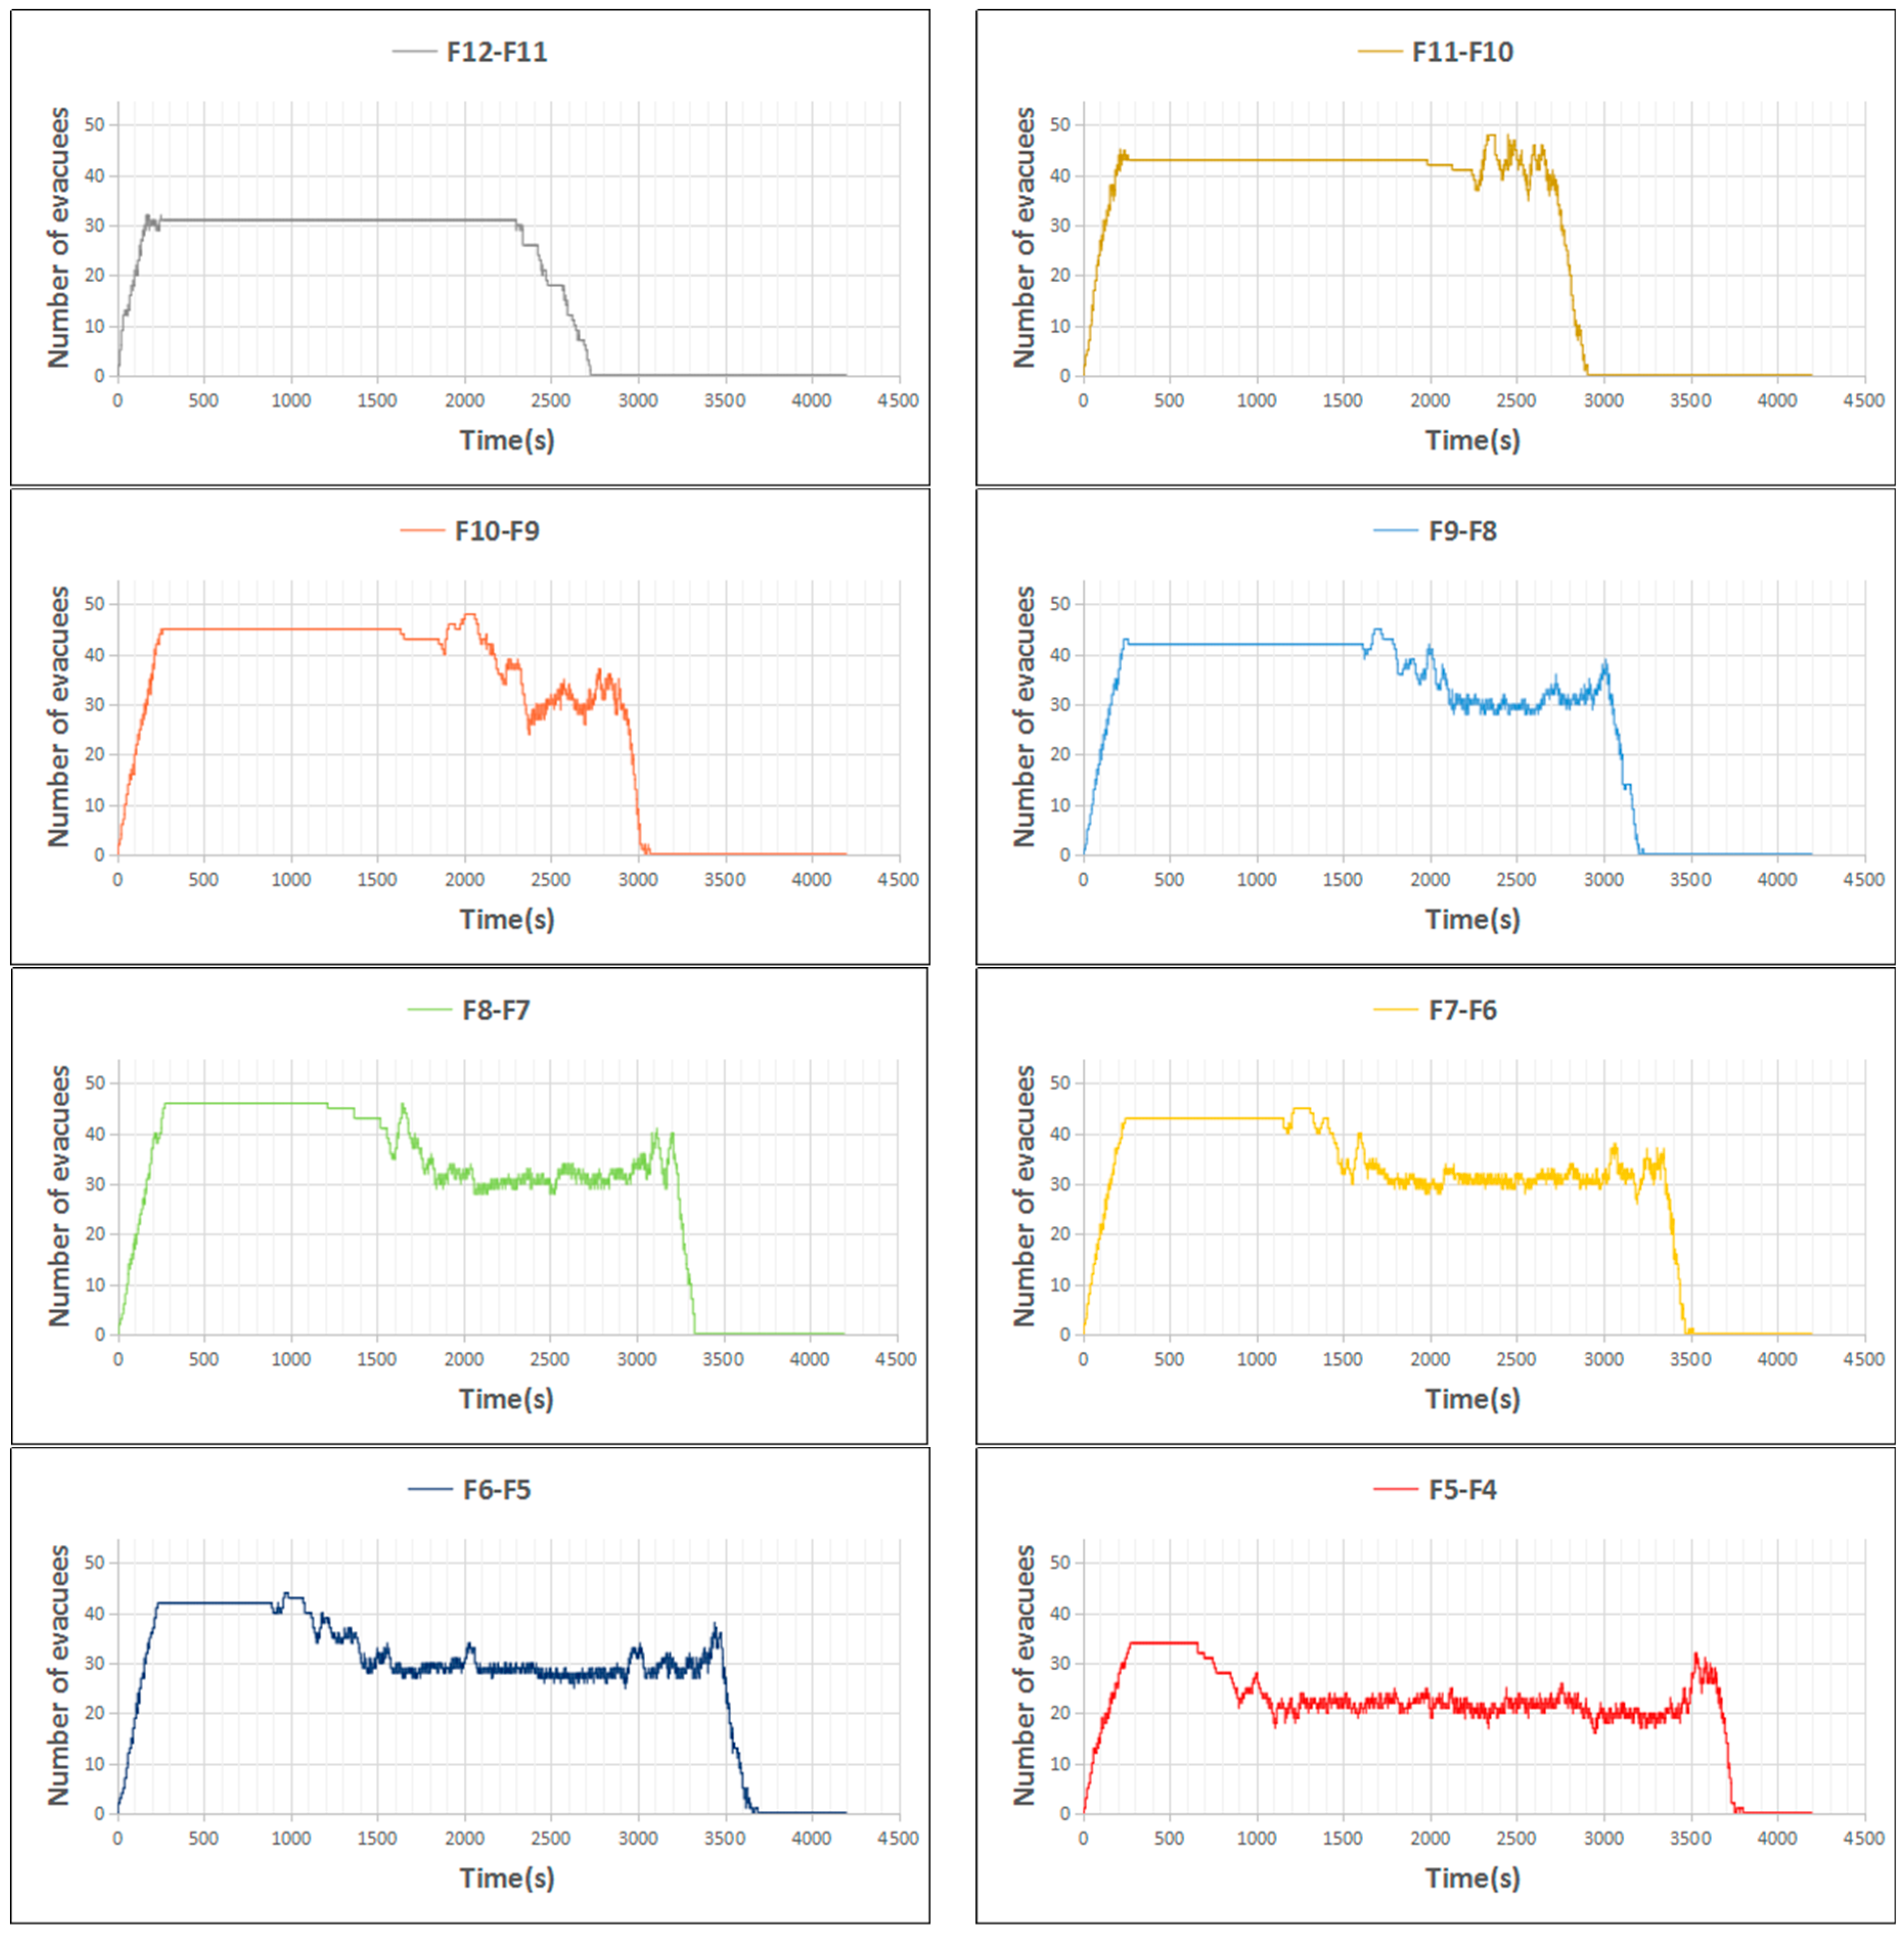
floor. Using the evacuation of staircase 2 with stair speed 0.224 as an example, in
Figure 9, the number of evacuees on each flight of stairs with respect to time is illustrated. Usually, people running from the upper floors will wait if the stairs are filled by evacuees from lower floors. Therefore, the higher the floor is, the longer the waiting time will be. This phenomenon can be represented by the horizontal lines in
Figure 9. At the same time, there is an interesting phenomenon: Although the total evacuation time of pedestrians in the high level is longer, the time of the last pedestrian on each floor entering the staircase area is almost simultaneous. That is to say, reducing the time of pedestrians in the staircase area can improve the evacuation efficiency.
3.3. The Effect of Staircase Width
In this study, more people tend to choose staircase 2 and staircase 3 instead of staircase 1 and staircase 4 during the evacuation process, because staircase 2 and staircase 3 have better locations than staircase 1 and staircase 4, as shown in
Figure 4. Experiments were conducted to test if the total evacuation time can be shortened by increasing the widths of staircases 2 and 3. The widths of staircases 2 and 3 were set to
,
,
, and
. The number of evacuees was set to 3600, and the number of evacuees on each floor was 300, distributed randomly in the building. The walking speed of each pedestrian on the stairs was generated randomly in the range of
, and the walking speed of each pedestrian moving on each floor was generated randomly in the interval
. The threshold of the evacuees’ density
was set to 0.8. The interaction probability
was set to 0.6.
As shown in
Table 8, when staircases 2 and 3 were widened to 3m, the evacuation time was shortened to
. However, when the staircase width continued to increase, the evacuation time increased as well. This phenomenon may be caused by the fact that total evacuation distance can become longer as staircase width increases, which may lead to a slower evacuation process. That is to say, the overall evacuation time does not simply decrease as the width of the stairs increases.
3.4. The Initial Number of Pedestrians on Each Floor
Nine experiments were conducted to analyze the initial number of pedestrians on each floor. The number of evacuees was set to 3600. For each experiment, the initial number of pedestrians on each floor is listed in
Table 9. The number of evacuees increased with higher floors of the high-rise building in
and
, while it decreased with higher floors in
and
. In
,
,
,
and
, the total number of people in two adjacent floors is 600. In
, the number of evacuees on each floor is equal. In
,
,
, and
, two different numbers alternate for 12 floors. The width of the staircase was set to 2m. The walking speed of each pedestrian on the stairs was generated randomly in the range of
, and the walking speed of each pedestrian moving on each floor was generated randomly in the interval
. The threshold of evacuees’ density
was set to 0.8. The interaction probability
was set to 0.6. We performed 100 times of simulation runs for each experiment in order to capture the stochastic nature of our model.
According to
Table 10, the standard deviations of evacuation times fluctuate between 40 and 77, and the corresponding confidence intervals at 95% confidence level are also calculated, which indicate the dispersion degree of evacuation time data set measured in the experiment is relatively stable. In addition, the mean of evacuation time of
is the shortest.
Figure 10 illustrates each of the 900 evacuation simulation results. In all 100 experiments of Exp#1 to Exp#9, the evacuation time difference was within 0 min to 6 min. Similar total evacuation time indicates the robustness of the IDPS model, i.e., the uncertainty of random distribution of pedestrians does not affect the stability of the IDPS model.
4. Conclusions
In this paper, a novel simulation technology, IDPS, is proposed to model the crowd dynamics in a high-rise building. This model incorporated ideas from individual intelligence and swarm intelligence. Intelligent particles perceived their surroundings and made independent evacuation decisions based on their own knowledge base. They also interacted with their neighbors with a certain probability and adjusted their behaviors. The movement of those intelligent particles models the pedestrian evacuation process realistically. It has been proven that the initial number of pedestrians on each floor can affect the evacuation efficiency, and the obstacles on the main route should be removed in time to reduce the possibility of congestion.
The IDPS model is a bio-inspired simulation technology abstracted from the cell migration process. It is also considered a new application of membrane computing. It models different evacuation environments or buildings where individuals are located. Evolution rules are used to update knowledge, determine evacuation direction, and so on. It contains knowledge update rules, decision making rules, interactive mechanism, and location update mechanism of cells. It also contains precise environment description. As in traditional membrane systems, evolution rules allow for evolving objects to be encapsulated into compartments defined by membranes. The communications between compartments and with the environment play an essential role in the processes. Priority rules, catalyst rules, probability rules, and other evolution rules originated from membrane computing, provide rich and convenient regular expressions, and make it easy to describe different evacuation scenarios.
In our model, cells have their own knowledge base which can be updated continuously according to the surrounding environment and interaction information. They interact with their neighbors and make decisions on where to go next based on their knowledge bases. In agent-based models, an agent’s decision-making is realized through a set of actions. Each action is regarded as a separate function, which continuously obtains the perceived input and maps it into an action to be executed without any symbolic reasoning. In the cellular automaton model, social-force model, and game theory model, pedestrians are also modeled without intelligent knowledge bases.
We have used NetLogo in this study because there is no typical software for our framework at this time. But NetLogo is not very efficient. In the future, we are going to build a simulation platform for IDPS through Java, and run more complex or real case studies.
Table 11 lists the pros and cons of the IDPS model and the optimized modeling techniques used in the literature.
Our model can also be varied to model emergency evacuation processes in the presence of other disasters, such as earthquakes or terrorist attacks. The dynamic changes in spatial accessibility caused by those emergency situations should be considered in future work. Up until now, most evacuation strategies still rely on static signs such as road signs, maps, etc. But this kind of strategy ignores the changing route conditions during evacuation process. For example, the previously reachable path can become unreachable due to the spread of the fire [
52]. Dealing with these changing environments and getting sufficient and reliable information is very important to conceive of a correct evacuation strategy. In this study, a homogeneous population involving only students and teachers were considered. They belonged to only one type of population. The evacuation behaviors of heterogeneous populations can also be modeled in the IDPS model (e.g., different preferred walking speeds for young and disabilities persons). Thus, different decision-making mechanisms and interaction mechanisms should be studied.

