Article

What is Currently Driving the Growth of China’s Household Electricity Consumption? A Clustering and Decomposition Analysis

1
Department of Economics and Management, North China Electric Power University, Baoding 071003, China
2
School of Chemical Engineering, University of Birmingham, Edgbaston, B15 2TT Birmingham, UK
*
Author to whom correspondence should be addressed.
Sustainability 2019, 11(17), 4648; https://doi.org/10.3390/su11174648
Submission received: 7 August 2019 / Revised: 22 August 2019 / Accepted: 25 August 2019 / Published: 26 August 2019
(This article belongs to the Section Energy Sustainability)

Abstract

:
The rapid growth of household electricity consumption is threatening the sustainable development of China’s economy and environment because of its impacts on the operation efficiency of the electric power system. To recognize the driving factors of the consumption growth and offer policy implications, based on the consumption-related data of 2015 and 2016, this research used the rank sum ratio (RSR) method to divide China’s 30 provinces into 5 groups and a logarithmic mean Divisia index (LMDI) algorithm to decompose the composition growth of each group into the quantitative contribution of each driving factor. The following conclusions were drawn from the empirical analysis. (1) The Yangtze basin is the most vigorous region of consumption growth and should be principally monitored. (2) Climate conditions have a remarkable impact on consumption growth and should be a key consideration when making differentiated household electricity policies. (3) The rebound effect has already appeared in a few of the most developed regions. Electricity price is an effective measure in dealing with this effect. (4) The improvement of the income level is the most important driving factor for consumption growth. (5) For provinces with high growth vitality, the change in the burden level of electricity expenditure prompts consumption growth. However, for provinces with low growth vitality, the situations are opposite. (6) The impacts of electricity price and population on consumption growth are negligible.

Graphical Abstract

1. Introduction

The rapid growth of household electricity consumption is threatening the sustainable development of China’s economy and environment. Thus, this study aims to identify the driving factors of consumption growth and to offer policy implications in guiding the development of China’s electric power system.
At present, China has the world’s largest electric power system. In 2018, China’s installed power generation capacity was 1.90 billion kW and generated 7.11 trillion kWh, approximately accounting for 27.4% and 25.4% of the world’s total, respectively [1]. Electricity generated by fossil energies has always accounted for the single largest part of the country’s total, given that China has abundant coal resources and has been building a considerable amount of coal-fired power plants [2]. Since the foundation of the People’s Republic, China’s share of electricity generated by fossil energies has never been less than 70% [1]. At present, thermal power plants consume 37.3% of China’s fossil energies and emit 40.9%, 32.8%, 36.7%, 16.3%, and 31.4% of CO2, SO2, NOx, industrial dust, and waste gas of the country’s total, respectively [3,4,5]. These plants are the largest fossil energy consumers and pollution sources of China.
Since the second half of 2014, China has transformed the previous high-speed extensive development mode into a “new normal,” characterized by lowering economic growth, upgrading its industrial structures, and converting the motivating force of economic growth from key elements and investment into innovation to realize the sustainable development of economy and environment [6]. In this new normal development mode, households have become a major factor in raising China’s electricity consumption with the slowdown of the growth of the industrial electricity demand. In the past four years, although the households’ consumption share did not exceed 15%, they contributed 30% of China’s electricity consumption growth [7].
The rapid growth of household electricity significantly impacts China’s sustainable development. First, this phenomenon lowers the efficiency of electricity generation. Compared with the industry, the electric load of the household has a larger peak–valley rate ((peak load–valley load)/ valley load). Generally, electricity cannot be stored in a large scale. Thus, additional reserve capacity is required to maintain a balanced supply and demand at any time with the share increase in household electricity consumption. In China, this role is generally played by thermal power plants. To satisfy the requirements of the dispatch department of the grid company, these units should frequently start and stop or remain in the state of spinning reserve for a long time. Evidently, this approach reduces the electricity generation efficiency of thermal power plants [8]. Second, it increases transmission loss. Transmission loss is inevitable given that the transmission line is not superconductive. On average, 6.7% of electricity is lost during transmission in China [9]. As China’s household electricity supply adopts low voltage with long transmission length, and its line quality is poor, this part of line loss rate generally exceeds 15%, which is much higher than the average. The rapid increase in household electricity consumption inevitably raises the loss rate of electricity transmission. Third, it adds the operating cost of industrial and commercial enterprises. China has implemented a cross-subsidy system for electricity prices to manifest the superiority of the social system since the People’s Republic was founded in 1949. That is, it sets a low electricity price for households and high electricity prices for industrial and commercial enterprises [10]. The cost of industrial and commercial enterprises in the cross-subsidy system continues to increase with the sheer increase in household electricity consumption. This research aims to identify the driving factors of China’s household electricity consumption growth and offer policy implications to mitigate these impacts.
This research is structured as follows. Following the introduction, Section 2 reviews the literature related to this research. Section 3 introduces the methodology and data source. Section 4 presents the empirical results. Section 5 discusses these results. Finally, Section 6 summarizes the key findings and provides the policy implications of the research.

2. Literature Review

2.1. Driving Factor Selection

In theory, population is the basis of household electricity consumption. Evidently, if the people in a region disappear, then the household’s electricity consumption will not also exist. Furthermore, some studies have recently confirmed that energy consumption presents different patterns because people in rural and urban areas have various living conditions and habits [11,12]. Thus, populations in rural and urban areas are selected as the potential driving factors of China’s household electricity consumption growth.
The wealth level, which is generally measured by per capita disposable income, should also be considered when analyzing China’s household electricity consumption. Mcneil and Letschert [13] adopted the econometric parameterization method to analyze the relationship between income and residential electricity consumption in developing countries. They found that the rate of appliance ownership increases with income. This phenomenon is a major factor of the growth of residential electricity consumption in developing countries. He and Reiner [14] used the statistical method to confirm the correlation between China’s household electricity demand and income. They also found that electricity consumption patterns differ between the rural and urban households. Yin et al. [15] and Khanna et al. [16] also drew similar conclusions. As a result, the income level is also considered in this research as a potential driving factor.
The same as most of the other commodities, the household electricity demand is affected by its price. Meng et al. [17] used a three-dimensional model to decompose the growth of China’s household electricity consumption per capita. They found that because China has maintained low prices for household electricity based on large-scale subsidies, the price is, in general, not a major factor for the increase in the consumption level during the period of 2001–2014. Khanna et al. [16] also confirmed this result. Therefore, aside from the implementation of the tiered price [18,19], the Chinese government has increased the overall price level for household electricity in recent years [9]. This research measures the current actual impact of price on the change of the household electricity consumption.
Furthermore, given the various climate conditions and many different living habits, China’s energy consumption generally presents different patterns among regions because of its vast area [20]. For this reason, this study initially performed a clustering analysis of China’s provinces in terms of the growth pattern of household electricity consumption, and then recognized the driving factors of the consumption growth in each group.

2.2. Clustering and Decomposition Methods

The K-means iterative algorithm [21] is a classic clustering method. It sets several original clustering centers and adjusts the center locations and clustering results by iteration. This method suits large clustering objects and can rapidly obtain the clustering results. However, this research only has 30 clustering objects (provinces), and outliers may well exist because of the complicated natural and social environment. Thus, ascertaining original clustering centers is difficult. The technique for order preference by similarity to ideal solution (TOPSIS) [22] algorithm can deal with small-sample clustering problems. It calculates the distance between two clustering objects and generates a dendrogram based on the distance results. The dendrogram can offer clustering results after setting the group number. The limitation of the TOPSIS method is that it does not consider the relative importance of the indicators. That is, all characteristic indicators should have equal importance for the clustering results. When clustering China’s provinces based on the growth pattern of household electricity consumption, not all indicators (e.g., growth speed of consumption, population, income, and electricity price) are equally important. The rank sum ratio (RSR) [23] algorithm is also a small-sample clustering method that originated from the comprehensive evaluation. Its unique rank assignment method can distinguish the relative importance of the indicators and overcome the impacts of the outliers. Thus, this method is used for the clustering analysis in this research.
At present, there have been some research works on the changes in energy consumption over time in households. Xu and Ang [24] proposed a hybrid model and used it to decompose the changes of the residential energy consumption of Singapore. Their research focused on the impacts of family conditions (e.g. room and number of appliances), but the macroconditions (e.g. income and electricity price levels considered in this research) were not considered. Nie and Kemp [25] also conducted a similar analysis using China’s data. Zhang et al. [26] investigated the difference of residential energy consumption between urban and rural areas. González et al. [27] analyzed the factors behind the change in aggregate energy consumption in the EU-27, and identified differences between member states. These research works offered policy implications based on the comparison, not the analysis of consumption changes of a region itself.
In the current research, a decomposition model is required to identify the driving factors of China’s household electricity consumption growth. At present, data envelopment analysis and Malmquist productivity index (DEA-MPI) [8,28], Laspeyres index decomposition [29], and logarithmic mean Divisia index (LMDI) decomposition [30] are widely used. DEA-MPI is generally used to decompose the changes of relative efficiency of the same objects (e.g., industrial sectors in a country [8] or companies in the same industry [28]). Hence, it is not suitable for this research. The Laspeyres index and LMDI decomposition methods have similar functions in most cases, but the latter is generally preferred in decomposition analysis because of its superiority in theoretical foundation, adaptability, ease of use and result interpretation, and some other desirable properties in the context [31]. As a result, the LMDI decomposition method is selected in this research.

3. Methods and Materials

3.1. RSR Clustering Method

Essentially, the RSR analysis comprehensively evaluates the performance of each clustering object and ascertains the group it belongs to according to the evaluation score [23]. It usually includes the following process: indicator grade recognition, rank assignment, RSR calculation, probability distribution calculation, fitting equation estimation, and object clustering [32]. This research followed this process to perform the clustering analysis of the considered provinces.

3.2. LMDI Decomposition Algorithm
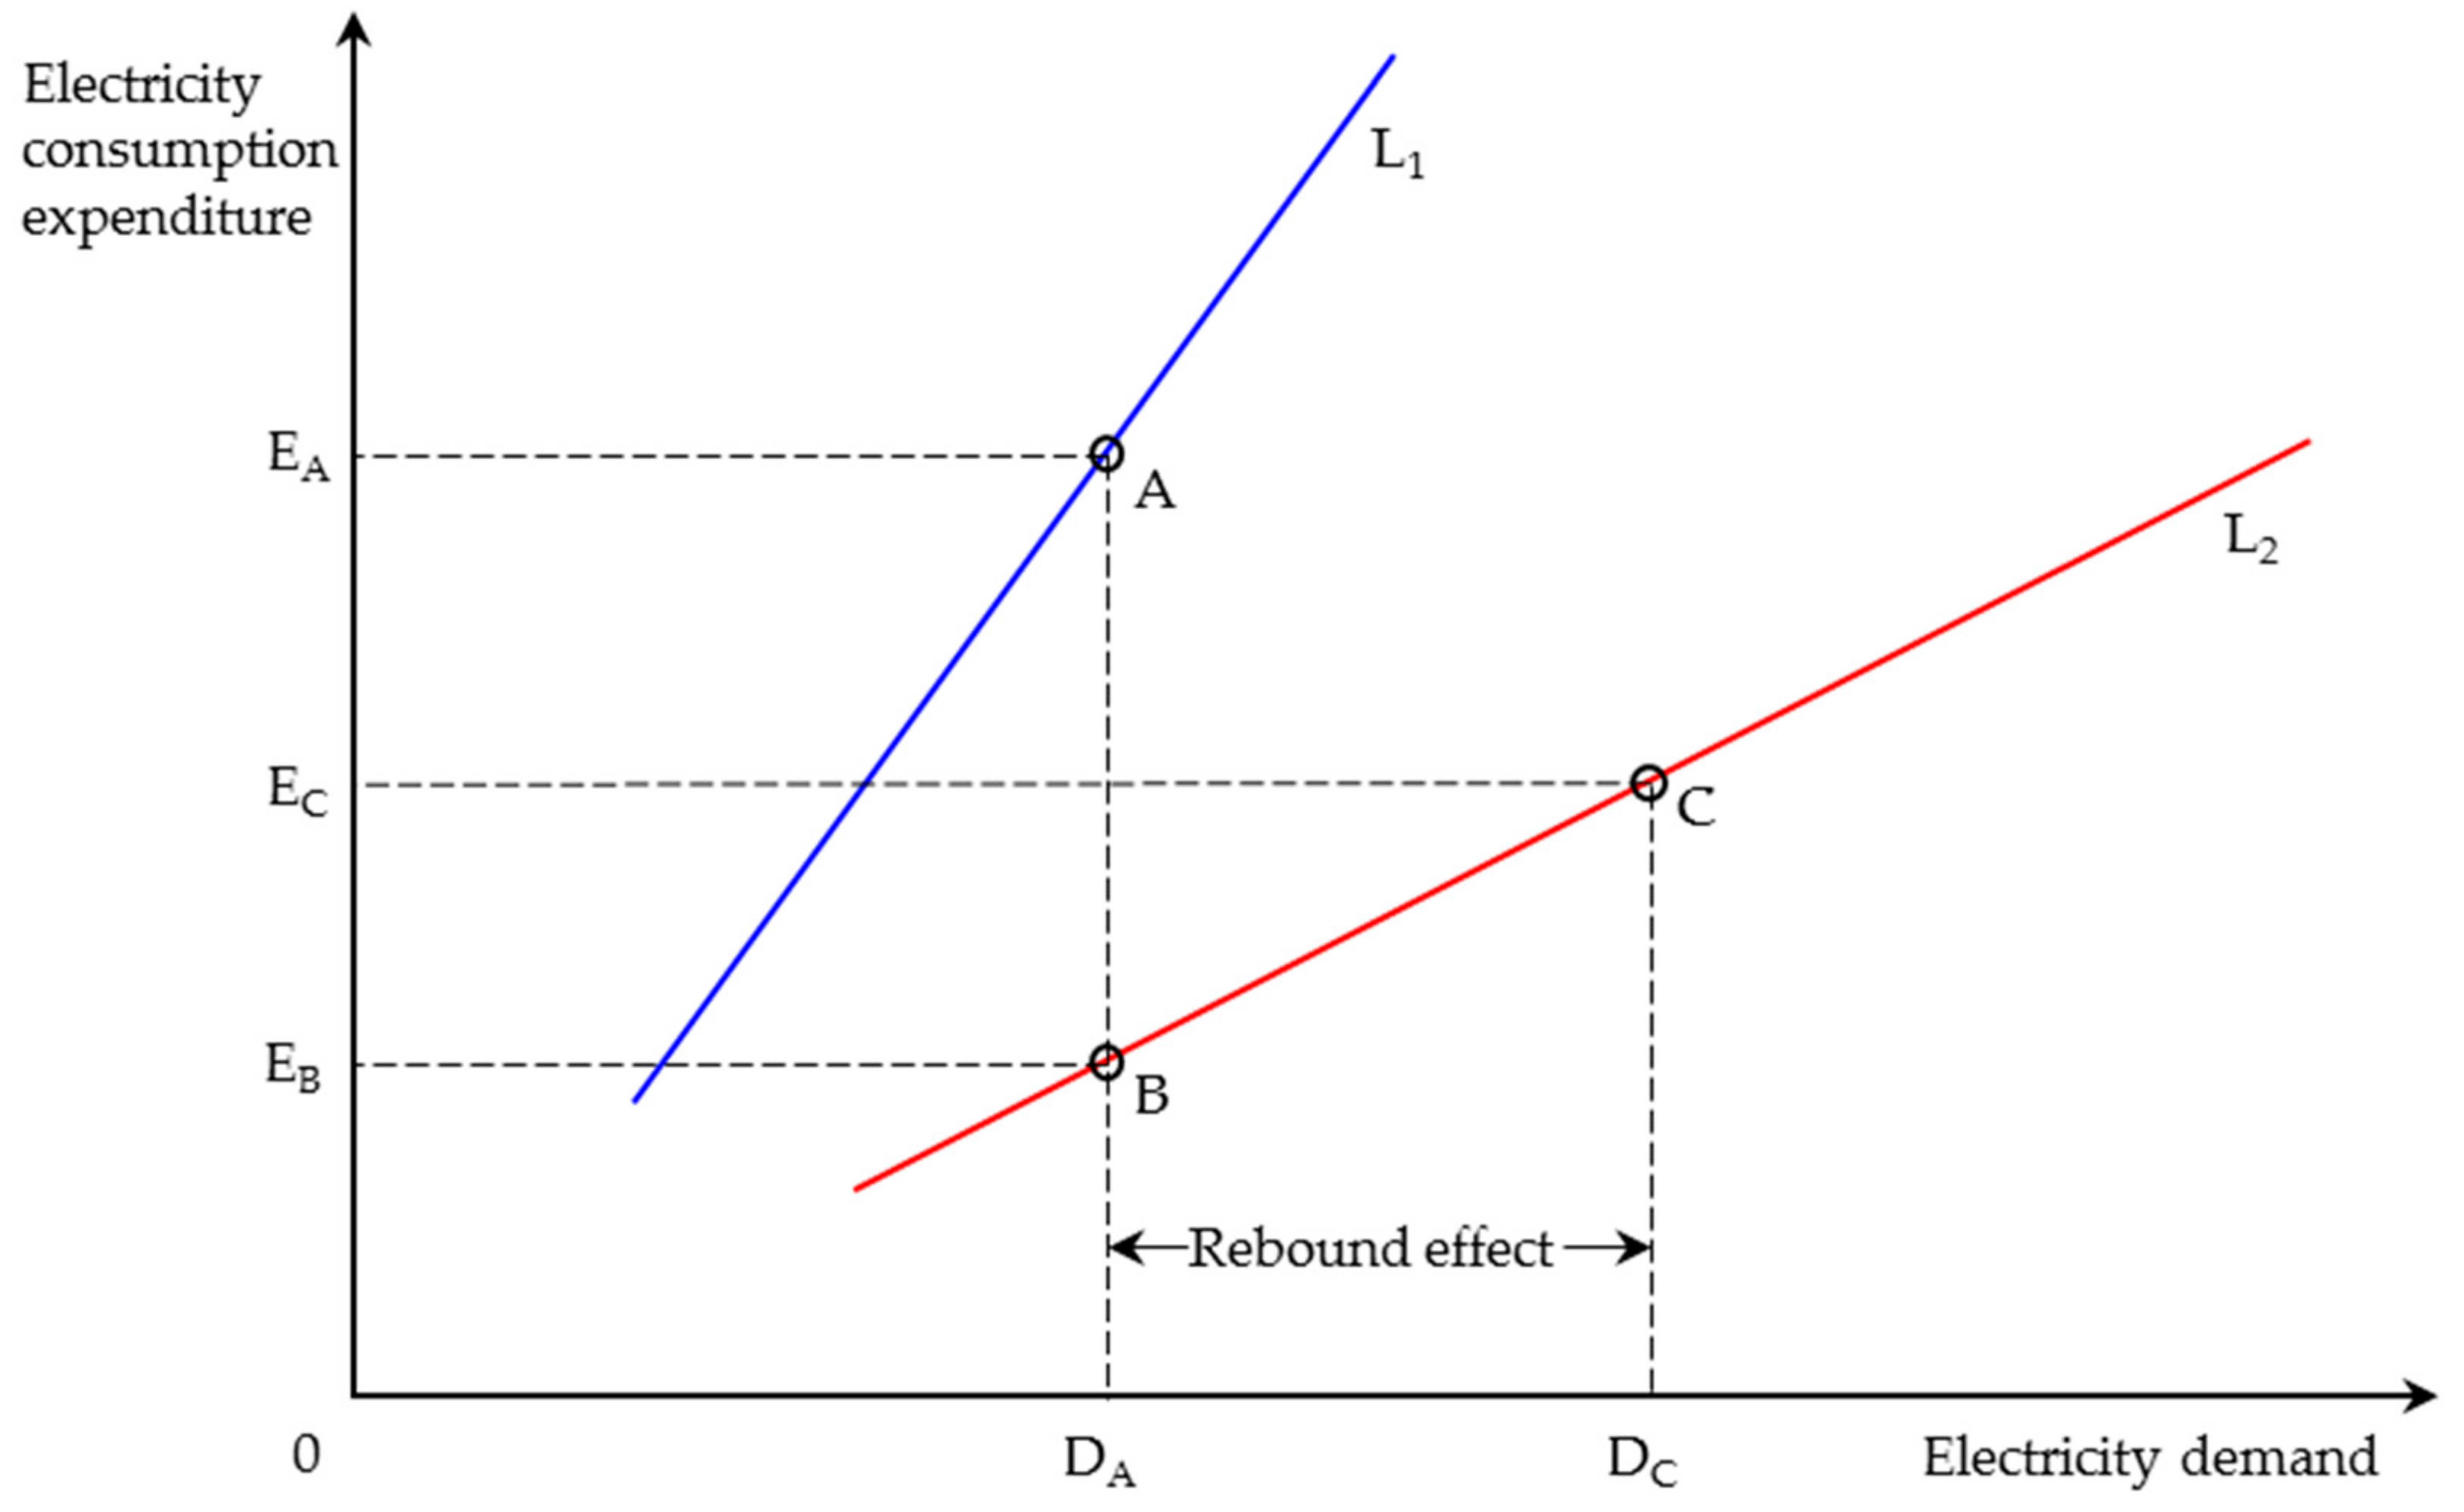
The LMDI decomposition algorithm uses a multiplication equation as the starting point and the logarithmic mean algorithm to ensure the completeness of the decomposition results [30,31]. Following this idea, this research decomposed the changes of household electricity consumption into the contributions of electricity price level (C1), burden level of electricity expenditure (C2), income level (C3), and population (C4).

3.3. Rebound Effect

The energy rebound effect refers to the discrepancy between the actual and expected energy-savings [33]. Specifically, the improved energy efficiency gives rise to not only a decrease in energy consumption but also reduction in energy prices. However, lower price increases energy consumption to some extent, thereby causing the rebound effect [34]. Figure 1 shows the economic basis of electricity rebound effect caused by price change.
In Figure 1, line 1 (L1) and line 2 (L2) denote two different electricity price levels (L1 > L2). Initially, when the electricity price level is L1, the household electricity demand is DA and the corresponding electricity consumption expenditure is EA. When the electricity price is decreased to L2, the corresponding electricity consumption expenditure is EB. However, because of the decrease in the electricity price, the households consume more electricity and finally reach DC. Evidently, (DC−DA) is the electricity rebound caused by price change.

3.4. Data Selection

As mentioned in the Introduction, the provincial data are used in this research. Among all China’s provinces, only Taiwan is uncontrolled by the Chinese central government. Hong Kong and Macao are special administrative regions with far more autonomy than the other provinces. For these reasons, these regions were not considered in the present research. Meanwhile, Tibet’s energy consumption was extremely small, thus its energy related values were not published in the statistical yearbook. Thus, Tibet was also excluded from our research.
The household electricity consumption data were selected from the “Energy Balance” table of each province in the China Energy Statistical Yearbook. Population and per capita disposable income data were obtained from the “Total Population by Urban and Rural Residence and Birth Rate, Death Rate, Natural Growth Rate by Region” and “Per Capita Disposable Income of Urban/Rural Households by Region” tables in the China Statistical Yearbook [3], respectively. The mean electricity price data were offered by the Regulation Report on National Electricity Prices 2017 [9]. The households have become a major driver of China’s electricity growth in 2015, and the latest available data are obtained from 2016. Thus, the data used in this research are from these two years. Table 1 lists all selected data.

4. Results

4.1. RSR Clustering Result

Using the data in Table 1, the rank assignment of each indicator in each province was calculated and listed in Table 2.
In Table 2, considering that the growth speed of household electricity consumption is evidently the most important positive indicator for the growth pattern, this indicator is classified into Grade 1. Population is the direct basis of household electricity consumption and identified as a positive Grade 2 indicator. Compared with population, income and electricity price are less important and therefore placed in Grade 3. Electricity price is a negative indicator because its increase curbs the household electricity consumption growth. In addition, considering that population and electricity consumption scales differ among provinces, this research used the growth rate as the basis of rank assignment. The RSR of a province is then obtained by calculating the mean of the rank assignment results of each indicator [32]. These results are also listed in Table 2.
Following the clustering process, the RSR values in Table 2 are listed in Table 3 in an ascending sort order. The accumulative frequency, quantile for normal distribution, probit values, and the following equation was obtained:
R S R = 0.212 + 0.06 P r o b i t .
The fitting results to the RSR values were obtained by inputting the probit values into Equation (1). These results are also listed in Table 3.
This research divides the considered provinces into five groups. According to the RSR method [32], 3.2, 4.4, 5.6, and 6.8 correspond to probit thresholds. Then, the range of fitted RSR for each group was obtained by inputting these thresholds into Equation (1). Table 4 lists the clustering results for all considered provinces obtained by the ranges of fitted RSR. The results of fitted RSR are listed in Table 3.

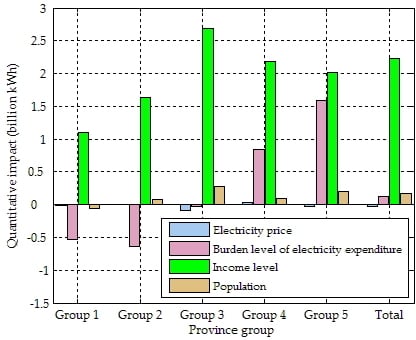
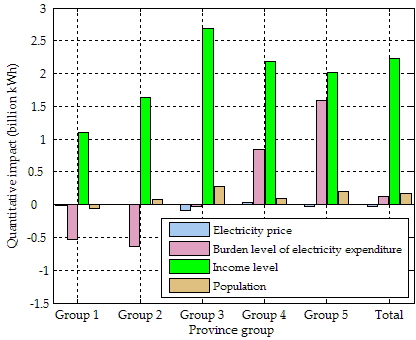
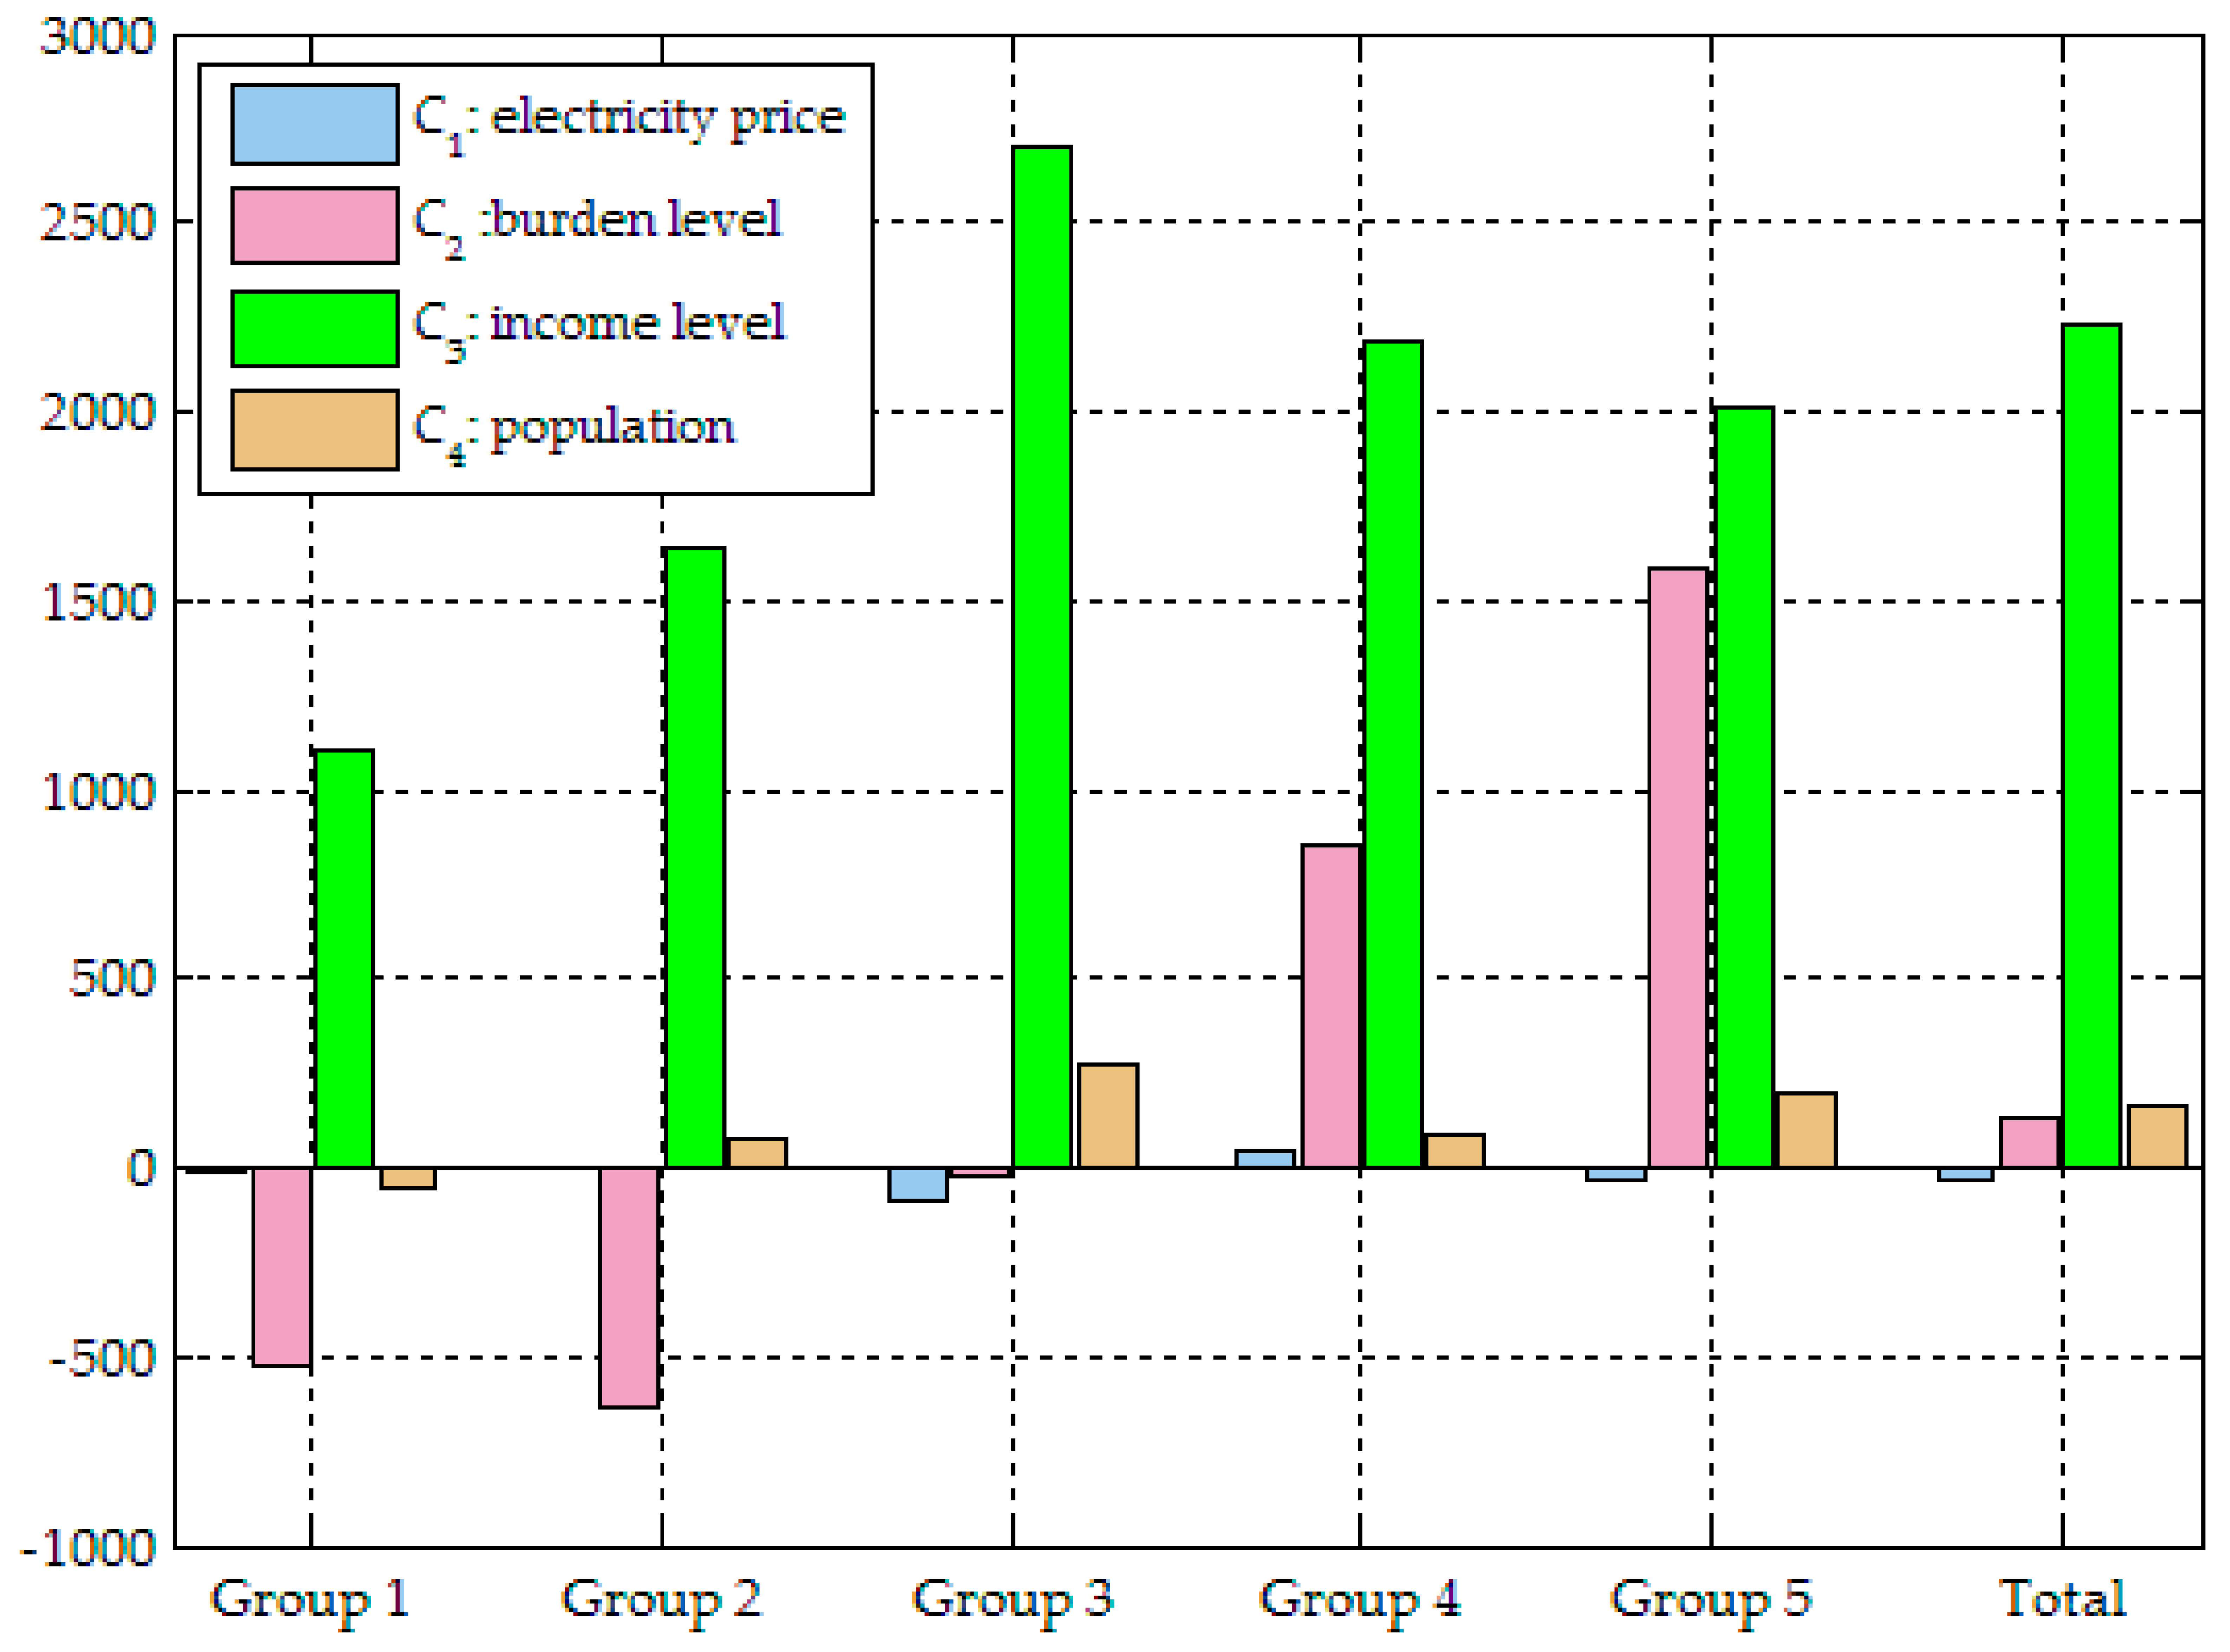
4.2. Factor Decomposition Result

The quantitative contribution of each driving factor in each province for the household electricity consumption growth was obtained using the data in Table 1 and the LMDI decomposition algorithm, listed in Table 5.
Table 5 shows the quantitative impacts of driving factors on the change in the household electricity consumption. For example, −14.4 in line 2, column 3 indicates that because of the increase in electricity price, the household electricity consumption in Heilongjiang decreased by 14.4 million kWh during 2015–2016.

5. Discussion

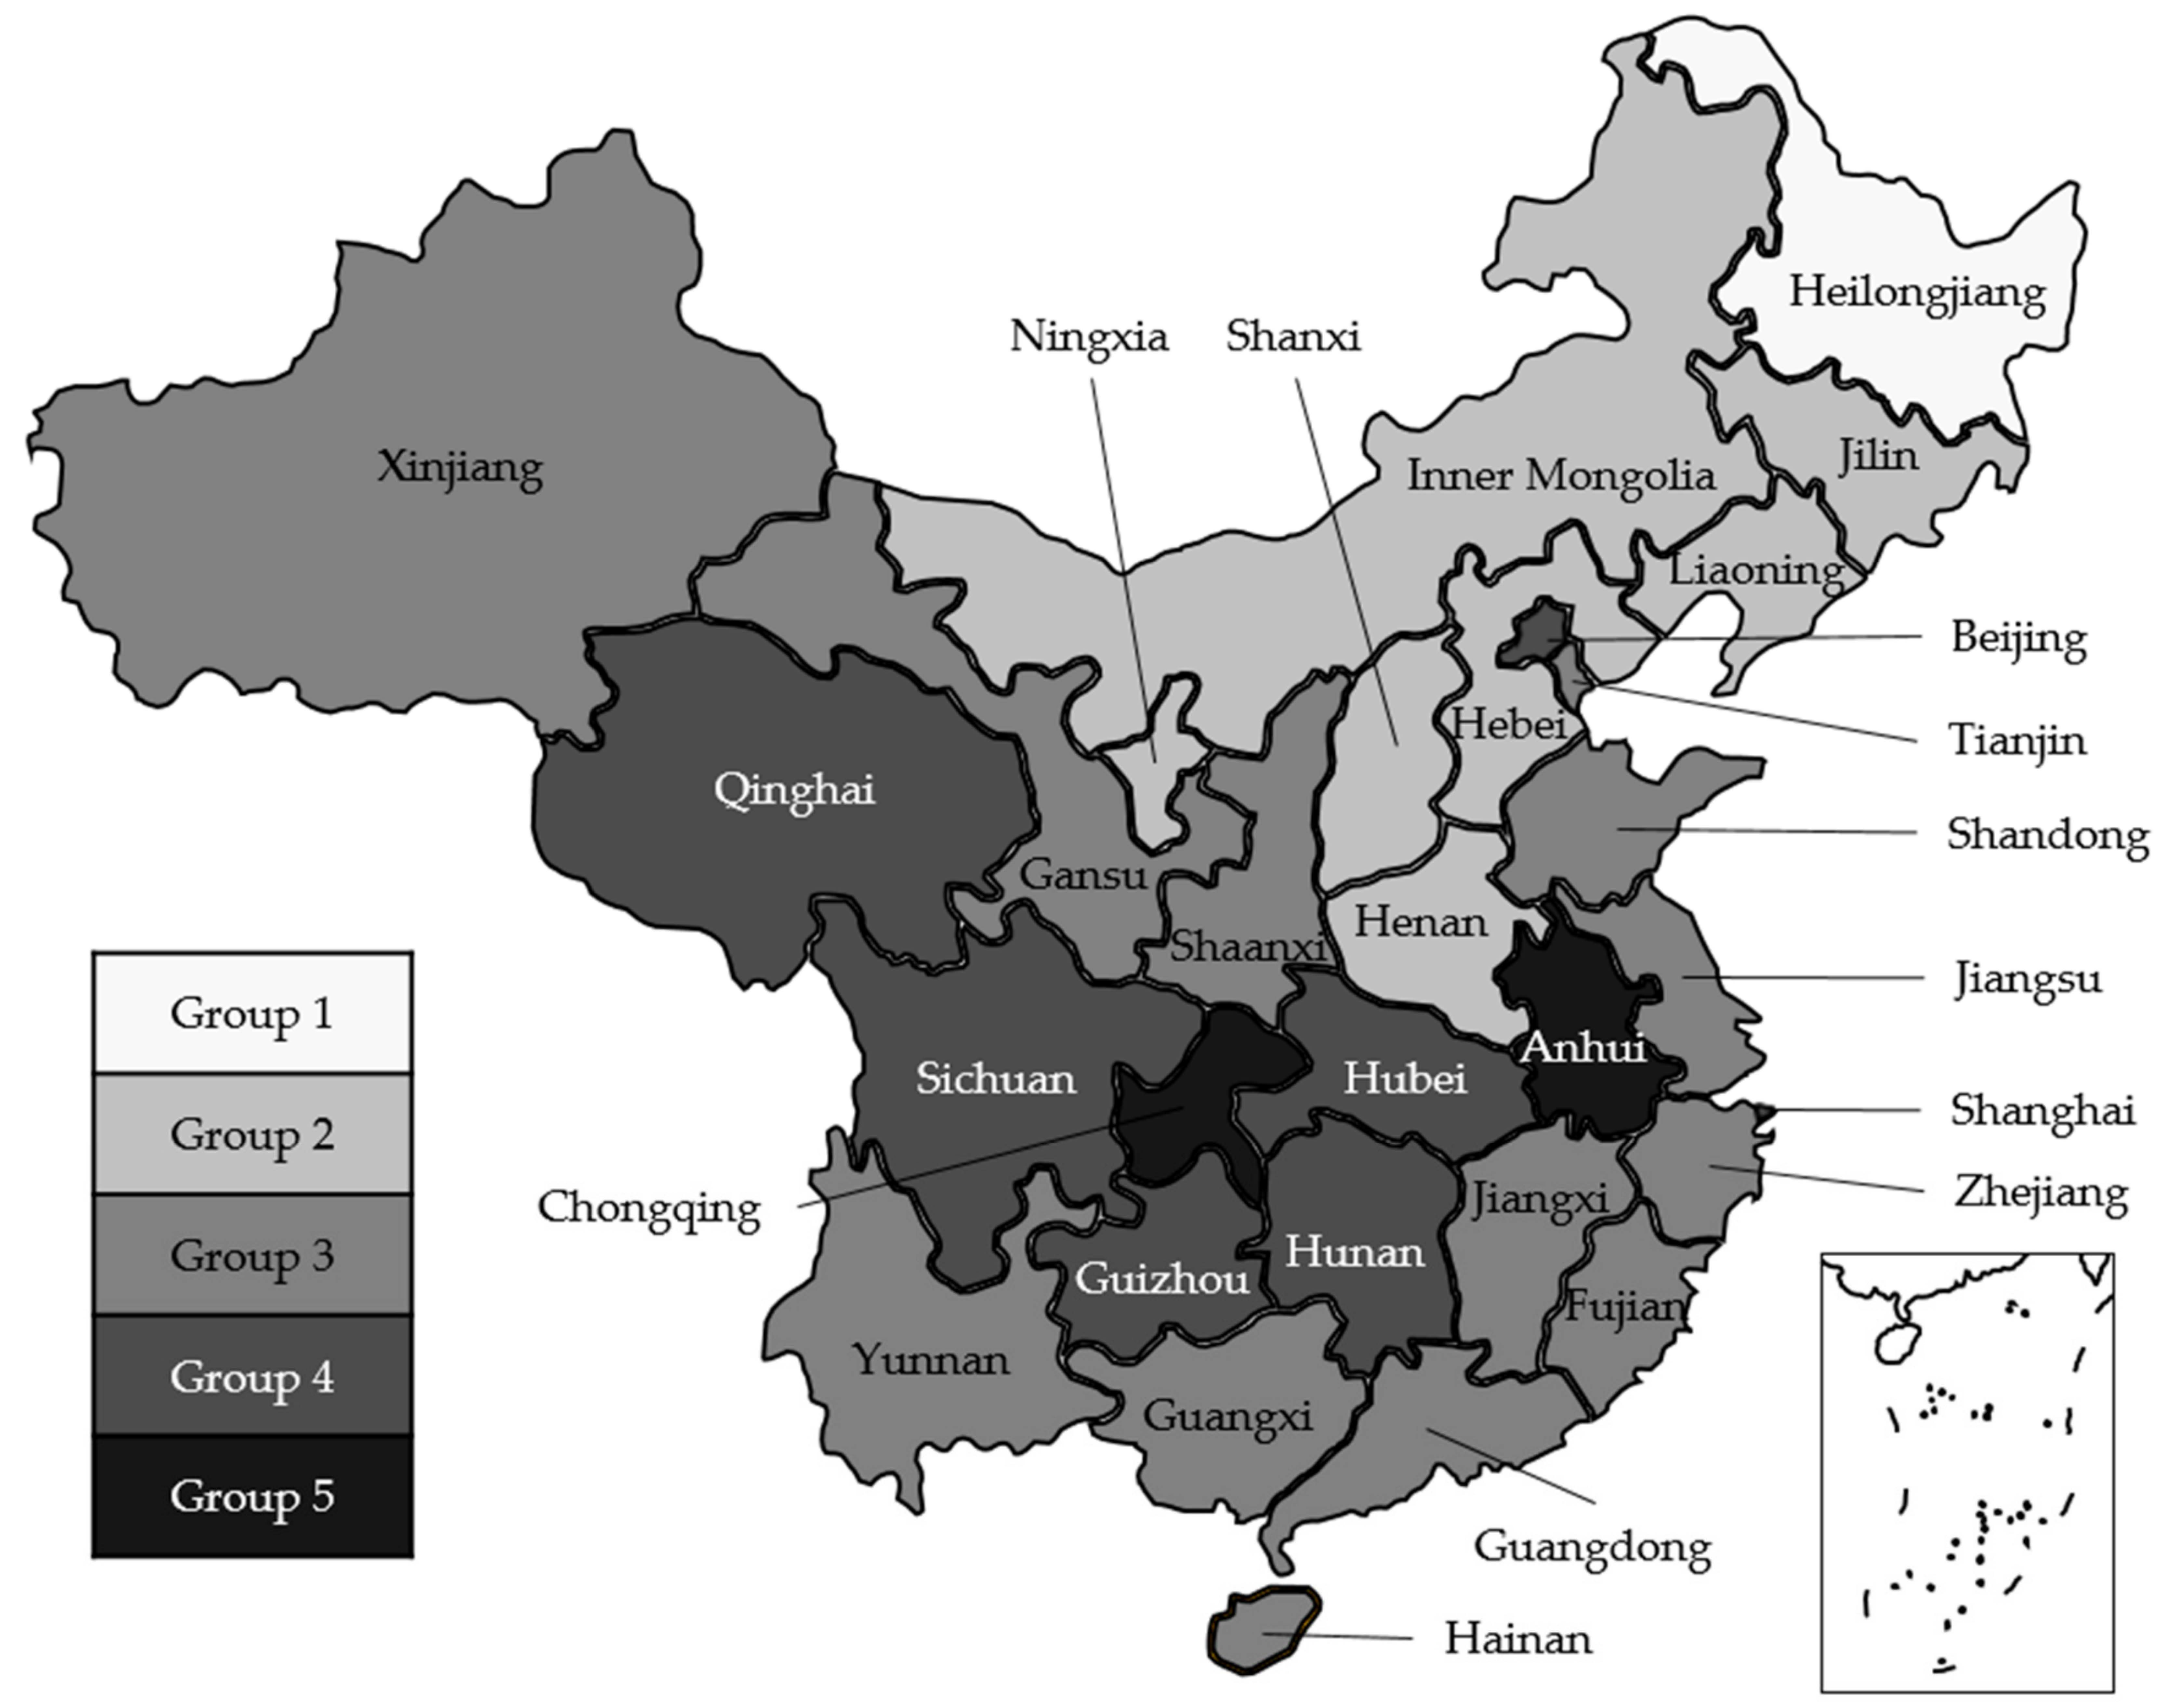
5.1. Geographic Distribution Analysis

Table 4 lists the clustering results. To observe the geographic distribution of each group, the map of China was colored accordingly (only the considered provinces were included) with different gray levels (Figure 2).
Figure 2 reveals an interesting phenomenon. The growth pattern of household electricity consumption of different provinces tend to relate to their geographic distributions. In general, except for a few outliers, the northern provinces tend to have small RSRs (Groups 1 and 2). In fact, the smallest 10 RSRs are from north China. Instead, the southern provinces have large RSRs (Groups 3, 4, and 5), and the Yangtze basin (Qinghai, Sichuan, Chongqing, Hubei, Hunan, Anhui, and several neighbor provinces of them) has the largest RSR. In accordance with the RSR clustering process, a large RSR score indicates high growth speed of electricity consumption, population, per capita disposable income, and stable electricity price. That is, provinces with large RSRs have large growth vitality of household electricity consumption. In this sense, south China has a larger growth vitality of household electricity consumption than north China, and the Yangtze basin is the most vigorous region. Considering the huge potential of consumption growth, to maintain the stable and economic running condition of the electric power system, this region should be principally monitored.
Figure 2 also shows that the neighboring provinces tend to be in the same group, particularly those at similar latitudes. Except for a few outliers, Figure 2 presents several geographic distribution belts. For example, Jilin, Liaoning, Hebei, Inner Mongolia, Shanxi, and Ningxia belong to Group 2. The provinces at similar latitudes have similar climate conditions; thus, this condition has an important impact on the growth of household electricity consumption.

5.2. OutlierAanalysis

As shown in Table 3 and Figure 2, the RSR of Beijing and Shanghai is significantly larger than that of its neighbors. Thus, they have a larger growth vitality of household electricity consumption. Using the statistics listed in Table 1, Table 6 shows the indicator comparison of Beijing, Shanghai, and other considered provinces.
Table 6 shows that Beijing and Shanghai have similar indicator values. However, compared with other provinces, they have much higher urbanization rate, income level, and growth speed of household electricity consumption. The former two indicators are decided by the social–economic conditions, but wherefrom does the high growth speed of household electricity consumption originate? The rebound effect can explain this phenomenon.
The electricity rebound effect differs among China’s different regions [35]. The household electricity consumptions of underdeveloped regions are used for the basic needs; hence, they are not sensitive to the price changes. Moreover, for the same province, as the urban regions have a higher income level (Table 1), they have a significant rebound effect.
As the most developed regions of China, Beijing and Shanghai have the best conditions for electricity rebound effect. From 2015 to 2016, the nominal electricity price changed slightly. However, because of the high-speed growth of income, the actual electricity price (price/income) decreased greatly. In fact, the actual electricity price of these two regions decreased by 7.8% and 8.1% in this period. Promoted by the rebound effect, these household electricity consumptions increased by 11.8% and 17.4%. Therefore, the rebound effect is a major driver of the household electricity consumption growth of China’s most developed regions. In China, the income levels of some cities (e.g. Shenzhen, Guangzhou, and Tianjin) are rapidly approaching Beijing and Shanghai. It can be predicted that the rebound effect will be a major driver for the household electricity consumption growth in these regions. Considering that this part of consumption growth is sensitive to price changes, the Chinese government can select this measures to deal with this effect.

5.3. Driving Factor Analysis

Table 5 demonstrates the quantitative contribution of each driving factor to the change in household electricity consumption in each province. The mean contribution values in each group and total provinces were calculated to analyze the contribution difference of the driving factors among groups (Figure 3).
Figure 3 shows that C3 (income level) is the most important driving factor in all provinces. In fact, the household electricity consumption of all the considered provinces increased by 74.9 billion kWh (Table 1), and C3 contributed 67 billion kWh (89.5%) (Table 5). This part of growth can be explained by appliance increase with the improvement of the income level [13]. Hence, increasing the energy efficiency of the household appliance is an important policy direction to mitigate this impact. In comparison with C3, the impact of C2 (burden level of electricity expenditure) differs among groups. Specifically, C2 presents negative impacts for provinces with low growth vitality of household electricity consumption. That is, the growth speed of the household electricity consumption expenditure is lower than the income. For these regions, electricity is a necessity for households and not a luxury. However, for provinces with high growth vitality of household electricity consumption, the situations are the opposite. As a result, differentiated cross-subsidy policies should be considered. For provinces with low and high growth vitalities, the subsidy should be increased and decreased, respectively. The impacts of C1 (electricity price) and C4 (population) are negligible for most considered provinces. This means that, because electricity price and population changed very slightly, they did not cause the significant changes of household electricity consumption.

6. Conclusions

This research used the RSR method to perform the clustering analysis of China’s provinces based on household electricity consumption characteristics, and an LMDI decomposition algorithm to recognize the driving factors of the consumption growth of each group. The following implications are drawn from the empirical analysis.
(1) The growth vitality of household electricity consumption of a region is highly related to its geographical location. Generally, compared with the north province, South China has a larger growth vitality, and the Yangtze basin is the most vigorous region. China should pay attention to the consumption growth of vigorous regions.
(2) The neighboring provinces at similar latitudes tend to have similar growth vitality of household electricity consumption. This finding implies that climate conditions significantly affect household electricity consumption. This result should be a key consideration when making differentiated household electricity policies.
(3) The rebound effect has already appeared in a few of the most developed regions. This effect becomes increasingly significant with the development of China’s economy. Electricity price is an effective measure for the Chinese government in dealing with this effect.
(4) The improvement of income level is the most important driving factor for the growth of China’s household electricity consumption. At present, it contributes approximately 90% of the consumption growth. To mitigate this part of growth, increasing the energy efficiency of the household appliance is an important policy direction.
(5) The impact of the burden level of electricity expenditure varies among regions. This factor prompted the consumption growth of provinces with high growth vitality for household electricity consumption. However, for provinces with low growth vitality, the situations are the opposite. The Chinese government should increase the cross-subsidy of provinces with low growth vitality, and decrease the cross-subsidy of provinces with high growth vitality.
(6) Because electricity price and population changed very slightly, the impacts of them on household electricity consumption growth are negligible.

Author Contributions

Conceptualization, M.M.; Writing—original draft, S.W.; Data curation, J.Z.; Writing—review & editing, X.W.

Funding

This study was supported by the National Natural Science Foundation of China (NSFC) (71471061) and the Fundamental Research Funds for the Central Universities (2017MS171).

Conflicts of Interest

The authors declare no conflict of interest.

References

  1. National Bureau of Statistic of China. Statistical Bulletin on National Economic and Social Development 2018. Available online: http://www.stats.gov.cn/tjsj/zxfb/201902/t20190228_1651265.html (accessed on 28 May 2019). (In Chinese)
  2. Meng, M.; Mander, S.; Zhao, X.; Niu, D. Have market-oriented reforms improved the electricity generation efficiency of China’s thermal power industry? An empirical analysis. Energy 2014, 114, 734–741. [Google Scholar] [CrossRef]
  3. National Bureau of Statistics. China Statistical Yearbook (2016–2018); China Statistics Press: Beijing, China, 2018.
  4. National Bureau of Statistics. China Statistical Yearbook on Environment (2016–2018); China Statistics Press: Beijing, China, 2018.
  5. IPCC. 2006 IPCC Guidelines for National Greenhouse Gas Inventories. Available online: http://www.ipcc-nggip.iges.or.jp/public/2006gl/vol2.html (accessed on 29 May 2019).
  6. Li, C.; Zhang, X. Renminbi Internationalization in the New Normal: Progress, Determinants and Policy Discussions. China World Econ. 2017, 25, 22–44. [Google Scholar] [CrossRef]
  7. National Energy Administration. Total Electricity Consumption Increased 8.5% in 2018. Available online: http://www.nea.gov.cn/2019-01/18/c_137754978.htm (accessed on 29 May 2019). (In Chinese)
  8. Meng, M.; Fu, Y.; Wang, X. Decoupling, decomposition and forecasting analysis of China’s fossil energy consumption from industrial output. J. Clean. Prod. 2018, 177, 752–759. [Google Scholar] [CrossRef]
  9. National Energy Administration. Regulation Report on National Electricity Prices 2017. Available online: http://www.nea.gov.cn/2018-10/09/c_137519800.htm (accessed on 31 May 2019). (In Chinese)
  10. Ye, Z.; Wu, Y.; Zhang, X.; Liu, S.; He, J. Research on the Inclining Block Tariffs Scheme for Solving Cross-subsidy under Demand Response—Based on the Perspective of Maximizing Social Welfare. Chin. J. Manag. Sci. 2019, 27, 149–159. (In Chinese) [Google Scholar]
  11. Wang, Q.; Yang, X. Urbanization impact on residential energy consumption in China: The roles of income, urbanization level, and urban density. Environ. Sci. Pollut. Res. 2019, 26, 3542–3555. [Google Scholar] [CrossRef]
  12. Jiang, L.; Chen, X.; Xue, B. Features, Driving Forces and Transition of the Household Energy Consumption in China: A Review. Sustainability 2019, 11, 1186. [Google Scholar] [CrossRef]
  13. Mcneil, M.A.; Letschert, V.E. Forecasting Electricity Demand in Developing Countries: A Study of Household Income and Appliance Ownership. Available online: https://www.researchgate.net/publication/228619092_Forecasting_Electricity_Demand_in_Developing_Countries_A_Study_of_Household_Income_and_Appliance_Ownership (accessed on 4 June 2019).
  14. He, X.; Reiner, D. Electricity demand and basic needs: Empirical evidence from China’s households. Energy Policy 2016, 90, 212–221. [Google Scholar] [CrossRef]
  15. Yin, H.; Zhou, H.; Zhu, K. Long-and short-run elasticities of residential electricity consumption in China: A partial adjustment model with panel data. Appl. Econ. 2015, 48, 2587–2599. [Google Scholar] [CrossRef]
  16. Khanna, N.Z.; Guo, J.; Zheng, X. Effects of demand side management on Chinese household electricity consumption: Empirical findings from Chinese household survey. Energy Policy 2016, 95, 113–125. [Google Scholar] [CrossRef]
  17. Meng, M.; Wang, L.; Shang, W. Decomposition and forecasting analysis of China’s household electricity consumption using three-dimensional decomposition and hybrid trend extrapolation models. Energy 2018, 165, 143–152. [Google Scholar] [CrossRef]
  18. Wang, C.; Zhou, K.; Yang, S. A review of residential tiered electricity pricing in China. Renew. Sustain. Energy Rev. 2017, 79, 533–543. [Google Scholar] [CrossRef]
  19. Fu, X.; Zeng, X.J.; Feng, P.; Cai, X. Clustering-based short-term load forecasting for residential electricity under the increasing-block pricing tariffs in China. Energy 2018, 165, 76–89. [Google Scholar] [CrossRef] [Green Version]
  20. Zhang, P.; Wang, X.; Zhang, N.; Wang, Y. China’s energy intensity target allocation needs improvement! Lessons from the convergence analysis of energy intensity across Chinese Provinces. J. Clean. Prod. 2019, 223, 610–619. [Google Scholar] [CrossRef]
  21. Adhau, S.P.; Moharil, R.M.; Adhau, P.G. K-Means clustering technique applied to availability of micro hydro power. Sustain. Energy Technol. Assess. 2014, 8, 191–201. [Google Scholar] [CrossRef]
  22. Niu, D.; Li, S.; Dai, S. Comprehensive Evaluation for Operating Efficiency of Electricity Retail Companies Based on the Improved TOPSIS Method and LSSVM Optimized by Modified Ant Colony Algorithm from the View of Sustainable Development. Sustainability 2018, 10, 860. [Google Scholar] [CrossRef]
  23. Cheng, L.; Song, Y.; Fang, X.; Zuo, Y.; Weng, Y.; Pu, Y.; Bai, Y. Analysis of the Allocation of Nursing Human Resources in China Based on Rank Sum Ratio Method (In Chinese). Chin. Hosp. Manag. 2019, 39, 74–76. [Google Scholar]
  24. Xu, X.Y.; Ang, B.W. Analysing residential energy consumption using index decomposition analysis. Appl. Energy 2014, 113, 342–351. [Google Scholar] [CrossRef]
  25. Nie, H.; Kemp, R. Index decomposition analysis of residential energy consumption in China: 2002–2010. Appl. Energy 2014, 121, 10–19. [Google Scholar] [CrossRef]
  26. Zhang, M.; Song, Y.; Li, P.; Li, H. Study on affecting factors of residential energy consumption in urban and rural Jiangsu. Renew. Sustain. Energy Rev. 2016, 53, 330–337. [Google Scholar] [CrossRef]
  27. González, F.P.; Landajo, M.; Presno, M.J. Multilevel LMDI decomposition of changes in aggregate energy consumption. A cross country analysis in the EU-27. Energy Policy 2014, 68, 576–584. [Google Scholar] [CrossRef]
  28. Liu, D. Evaluating the multi-period efficiency of East Asia airport companies. J. Air. Transp. Manag. 2017, 59, 71–82. [Google Scholar] [CrossRef]
  29. Cheng, S.; Wu, Y.; Chen, H.; Chen, J.; Song, M.; Hou, W. Determinants of changes in electricity generation intensity among different power sectors. Energy Policy 2019, 130, 389–408. [Google Scholar] [CrossRef]
  30. Yang, H.; Ma, X. Uncovering CO2 Emissions Patterns from China-Oriented International Maritime Transport: Decomposition and Decoupling Analysis. Sustainability 2019, 11, 2826. [Google Scholar] [CrossRef]
  31. Ang, B.W. Decomposition analysis for policymaking in energy: Which is the preferred method? Energy Policy 2004, 32, 1131–1139. [Google Scholar] [CrossRef]
  32. Sun, Z.; Wang, L. Comprehensive Evaluation Method and Its Application in Medicine; People’s Medical Publishing House: Beijing, China, 2014. (In Chinese) [Google Scholar]
  33. Berkhout, P.H.G.; Muskens, J.C.; Velthuijsen, J.W. Defining the rebound effect. Energy Policy 2000, 28, 425–432. [Google Scholar] [CrossRef]
  34. Wang, Z.; Lu, M.; Wang, J.C. Direct rebound effect on urban residential electricity use: An empirical study in China. Renew. Sustain. Energy Rev. 2014, 30, 124–132. [Google Scholar] [CrossRef]
  35. Wen, F.; Ye, Z.; Yang, H.; Li, K. Exploring the rebound effect from the perspective of household: An analysis of China’s provincial level. Energy Econ. 2018, 75, 345–356. [Google Scholar] [CrossRef]
Figure 1. Electricity rebound effect caused by price change.
Sustainability 11 04648 g001
Figure 2. Geographic distribution of growth pattern of household electricity consumption of the considered provinces.
Sustainability 11 04648 g002
Figure 3. Mean quantitative contribution of each driving factor in each group and the total provinces.
Sustainability 11 04648 g003
Table 1. Household electricity consumption, population, per capita disposable income, and mean electricity price of considered provinces in 2015 and 2016.
ProvinceHousehold Electricity ConsumptionPopulationPer Capita Disposable IncomeMean Electricity Price
UrbanRuralUrbanRural
201520162015201620152016201520162015201620152016
Beijing17.519.518.818.82.92.952.957.320.622.3495.1494.8
Tianjin8.79.312.8132.72.734.137.118.520.1503.3503.7
Hebei37.239.538.139.836.134.926.228.311.111.9510.7510.2
Shanxi161720.220.716.516.125.827.49.510.1493.2491.9
Inner Mongolia12.813.915.115.4109.830.63310.811.6470.9472.2
Liaoning2324.329.529.514.314.331.132.912.112.9512.4513.4
Jilin10.711.215.215.312.31224.926.511.312.1534.8531.9
Heilongjiang16.817.322.422.515.715.524.225.711.111.8521.2521.6
Shanghai18.621.821.221.332.95357.723.225.5571.3572.9
Jiangsu52.96253.154.226.725.837.240.216.317.6517.6519.6
Zhejiang44.351.736.537.518.918.543.747.221.122.9556.1558.9
Anhui25.130.13132.230.429.826.929.210.811.7569.2572.7
Fujian34.538.12424.614.414.133.33613.815551.5557.2
Jiangxi18.42123.624.422.121.526.528.711.112.1618.2620.5
Shandong50.355.456.158.742.340.831.63412.914536.7538.6
Henan41.442.544.446.250.449.125.627.210.911.7563.2563.7
Hubei27.931.533.334.225.324.727.129.411.812.7579.5573.5
Hunan32.938.734.535.633.332.228.831.31111.9607607.8
Guangdong84.690.474.576.13433.934.837.713.414.5645.6648.2
Guangxi25.12722.623.325.425.126.428.39.510.4562.9557.7
Hainan55.455.24.1426.428.510.911.8632.1632.3
Chongqing13.816.418.419.111.811.427.229.610.511.6537.3533.8
Sichuan34.139.339.140.742.94226.228.310.311.2523.3523.3
Guizhou19.821.814.815.720.519.924.626.77.48.1485.4484.2
Yunnan21.719.520.621.526.926.226.428.68.29472468
Shaanxi18.821.120.521.117.51726.428.48.79.4507.1506.3
Gansu7.78.411.211.714.814.423.825.76.97.5511.8522.5
Qinghai2.32.533.12.92.924.526.87.98.7405.8404
Ningxia2.42.63.73.83325.227.29.19.9457.2462.7
Xinjiang8811.211.612.512.426.328.59.410.2533.6530.9
Units of household electricity consumption, population, per capita disposable income, and mean electricity price are billion kWh, million people, thousand yuan, and yuan per thousand kWh, respectively.
Table 2. Assigned rank of each driving factor and rank sum ratio (RSR) for each province.
ProvinceHousehold Electricity ConsumptionPopulationPer Capita Disposable IncomeMean Electricity PriceRSR
UrbanRuralUrbanRural
Beijing208.822.816.915.916.40.559
Tianjin7.510.820.818.616.615.40.498
Hebei7.521.38.814.913.916.60.461
Shanxi913.316.312.112.117.30.445
Inner Mongolia1411.317.813.813.414.40.47
Liaoning68.322.311.912.414.60.419
Jilin59.815.812.912.618.10.412
Heilongjiang49.319.512.411.915.40.402
Shanghai2710.317.318.918.914.10.591
Jiangsu2611.89.314.615.413.40.502
Zhejiang2513.811.815.315.112.90.521
Anhui3018.316.816.415.612.60.609
Fujian1912.818.316.116.912.40.53
Jiangxi2317.313.315.917.113.60.556
Shandong1722.38.314.114.113.90.498
Henan320.812.312.613.615.40.431
Hubei2214.314.317.913.119.10.559
Hunan2815.89.817.416.114.90.566
Guangdong1112.321.817.116.413.10.509
Guangxi1215.320.313.118.118.90.542
Hainan1617.810.814.417.415.90.512
Chongqing2918.810.318.119.118.40.631
Sichuan2419.815.315.617.916.10.604
Guizhou1822.811.318.418.517.30.59
Yunnan121.813.817.618.518.60.507
Shaanxi2116.312.813.414.916.90.529
Gansu1519.314.815.312.911.90.494
Qinghai1316.818.819.117.617.60.572
Ningxia1014.819.513.814.612.10.471
Xinjiang220.321.316.614.417.90.513
Table 3. Sorted RSR, accumulative frequency, quantile for normal distribution, Probit, and fitted RSR for each province.
ProvinceRSRAccumulative FrequencyQuantile for Normal DistributionProbitFitted RSR
Heilongjiang0.4023.3−1.83.20.401
Jilin0.4126.7−1.53.50.421
Liaoning0.41910−1.33.70.434
Henan0.43113.3−1.13.90.445
Shanxi0.44516.7−140.454
Hebei0.46120−0.84.20.461
Inner Mongolia0.4723.3−0.74.30.468
Ningxia0.47126.7−0.64.40.474
Gansu0.49430−0.54.50.48
Tianjin, Shandong0.49835−0.44.60.488
Jiangsu0.50240−0.34.80.496
Yunnan0.50743.3−0.24.80.501
Guangdong0.50946.7−0.14.90.507
Hainan0.51250050.511
Xinjiang0.51353.30.15.10.516
Zhejiang0.52156.70.25.20.522
Shaanxi0.529600.35.30.526
Fujian0.5363.30.35.30.532
Guangxi0.54266.70.45.40.537
Jiangxi0.556700.55.50.543
Beijing, Hubei0.559750.75.70.552
Hunan0.566800.85.80.562
Qinghai0.57283.3160.569
Guizhou0.59086.71.16.10.578
Shanghai0.591901.36.30.588
Sichuan0.60493.31.56.50.602
Anhui0.60996.71.86.80.621
Chongqing0.63199.2*2.47.40.656
* This result is calculated by [1 − 1/(4 × 30)].
Table 4. Clustering results for all considered provinces.
GroupRange of ProbitRange of Fitted RSRProvince
1(−∞, 3.2)<0.403Heilongjiang
2[3.2, 4.4)[0.403, 0.475)Jilin, Liaoning, Henan, Shanxi, Hebei, Inner Mongolia, Ningxia
3[4.4, 5.6)[0.475, 0.548)Gansu, Tianjin, Shandong, Jiangsu, Yunnan, Guangdong, Hainan, Xinjiang, Zhejiang, Shaanxi, Fujian, Guangxi, Jiangxi
4[5.6, 6.8][0.548, 0.620]Beijing, Hubei, Hunan, Qinghai, Guizhou, Shanghai, Sichuan
5(6.8, +∞)>0.620Anhui, Chongqing
Table 5. Quantitative contribution of each driving factor in each province for the household electricity consumption growth.
GroupProvinceC1C2C3C4
1Heilongjiang−14.4−524.11106.6−58.1
2Jilin59.4−188.2758.8−79.9
Liaoning−46.135.71337.4−27
Henan−32.8−2460.43363.6229.5
Shanxi42.2−218.71145.580.9
Hebei40.9−1486.83554.3231.6
Inner Mongolia−35.7−721100.147.7
Ningxia−29.4−45.7209.325.7
3Gansu−165.575.7749.130.7
Tianjin−7.3−302.8773.386.9
Shandong−185.8−49.34811.1533.9
Jiangsu−2204165.24919.7165
Yunnan173.5−4675.82116.8125.5
Guangdong−342.1−2436.77407.51201.3
Hainan−2−42.3480.134.2
Xinjiang39.7−914.5716.9127.9
Zhejiang−2443034.94090.1439.1
Shaanxi30.3395.31759.8104.7
Fujian−370.4481.13170.1329.2
Guangxi240.8−762.42214.5227.1
Jiangxi−73.5710.41821.2111.8
4Beijing12.7542.91487.417
Hubei307.3494.92660.9166.9
Hunan−46.42503.83407.9−5.3
Qinghai10.6−88237.220.1
Guizhou54.4−463.62302.8146.5
Shanghai−58.71472.21764.941.6
Sichuan−0.71468.13464.7257.9
5Anhui−167.72337.92528231.9
Chongqing99.8836.61494.2159.4
The unit is million kWh.
Table 6. Indicator comparison of Beijing, Shanghai, and other considered provinces.
ProvinceHousehold Electricity ConsumptionPopulationPer Capita Disposable IncomeMean Electricity Price
UrbanRuralUrbanRural
201520162015201620152016201520162015201620152016
Beijing17.519.518.818.82.92.952.957.320.622.3495.1494.8
Shanghai18.621.821.221.332.95357.723.225.5571.3572.9
Mean value of other provinces24.927.426.2272120.528.430.711.312.2532.8533.3
Units of household electricity consumption, population, per capita disposable income, and mean electricity price are billion kWh, million people, thousand yuan, and yuan per thousand kWh, respectively.

