Article

Phosphorus Loss through Overland Flow and Interflow from Bare Weathered Granite Slopes in Southeast China

1
College of Environmental and Resource Sciences, Zhejiang University, Hangzhou 310058, China
2
Zhejiang Provincial Key Laboratory of Agricultural Resources and Environment, Hangzhou 310058, China
3
Agricultural Experiment Station, Zhejiang University, Hangzhou 310058, China
*
Authors to whom correspondence should be addressed.
Sustainability 2019, 11(17), 4644; https://doi.org/10.3390/su11174644
Submission received: 9 July 2019 / Revised: 15 August 2019 / Accepted: 24 August 2019 / Published: 26 August 2019
(This article belongs to the Section Environmental Sustainability and Applications)

Abstract

:
Phosphorus (P) is the key limiting factor for eutrophication, and the mechanism of P loss from hillslopes is complex. Few attempts have been made to study the processes of P loss through overland flow and interflow from bare weathered granite slopes in Southeast China. Therefore, artificial rainfall simulations were performed to evaluate P loss from bare weathered granite slopes with different slope angles (5°, 8°, 15°, 25°) and different rainfall intensities (1.5, 2.0, 2.5 mm/min). The results show that overland flow increased with rainfall intensity, while it declined with slope angle. Interflow exhibited a single-peak curve with time of runoff. The interflow accounted for 28.53–89.12% of the total runoff yield, and the percentage declined with rainfall intensity and increased with slope angle. Both total phosphorus (TP) concentration (CTP) and TP load (LTP) in overland flow increased with rainfall intensity, and the percentages of LTP in each rainfall event ranged from 51% to 92%. CTP in overland flow distinctly fluctuated, with the maximum appearing on the 25° slope, while the maximum in interflow was observed on the 5° slope. LTP in overland flow was the highest on the 8° slope, and was significantly affected by runoff yield and rainfall intensity (p < 0.01). LTP in interflow was small and was significantly affected by rainfall intensity (p < 0.01). Runoff P was mainly lost through overland flow, dominantly in the form of particulate phosphorus (PP), and P loss through interflow was an important supplementation, mainly in the form of dissolved phosphorus (DP). These results provide underlying insights and scientific background for the control of P loss in bare weathered granite areas.

1. Introduction

Non-point source (NPS) agricultural pollution is currently a major environmental problem that brings potential harm to human and environmental health [1,2]. Many studies have shown that NPS agricultural pollution is the main reason for eutrophication of water bodies [3]. Nitrogen (N) and phosphorus (P) from agricultural fields are transported into rivers and lakes in different ways, and may degrade water quality [4]. P export is the key limiting factor for eutrophication in most freshwater ecosystems [5] and its increase promotes the growth and reproduction of algae [6]. Correll [7] reported that the critical concentration of soluble P that causes eutrophication is 0.02 mg/L, and that continuous P export into water is a potential threat for the aquatic environment, even if the P amount is small.
The soil layer is thin in the weathered granite region of southeast China, and the summer is often hot and rainy. Heavy rainfalls, caused by frequent typhoons, make the study region prone to soil erosion. Soil erosion not only causes the loss of nutrients, such as N and P, but also impacts the sustainable development of agriculture by causing soil degradation and land productivity decline [8]. At present, there are many studies on soil erosion for the red soils in Southeast China [9,10]. However, mechanisms of nutrient loss from the bare weathered granite slopes need to be further studied. The slopes with weathered granite have a wide distribution area in Southeast China. The area is one of the typical representatives of the most serious eroded slopes in the red soil hills, forming a large-scale degraded ecosystem [11,12]. Field nutrients from the slopes enter the receiving water bodies mainly through overland flow and interflow. Research on nutrient transport by overland flow is well known, while that by interflow is largely unexplored. In particular, the dynamic process of P migration is difficult to study because the P adsorption–desorption mechanisms are complex within the soil [13]. At present, there are many studies about runoff and nutrient loss from slopes with loess, red and purple soils in China. However, few studies have investigated nutrient loss by interflow from bare weathered granite slopes. The current explanation that P is mainly lost via eroded sediment is vague and not totally able to explain the low P output through interflow. The main factors affecting P loss are still unclear. Therefore, it is necessary to conduct in-depth research to study P loss through interflow with artificial rainfall simulations. It has been found that the characteristics of overland flow and interflow yield are significantly different [9]. Interflow lags behind overland flow and the generation time is longer. Interflow contributes to more than half of the total runoff and, subsequently, is an important form of runoff [14]. Interflow not only changes the runoff distribution but also affects nutrient loss [15,16]. Soil leaching effect is strong in areas with abundant precipitation. The eluvial and illuvial horizons are easily formed, which dramatically impact the effective porosity of the soil and its ability to transport nutrients [9]. The migration of nutrients via downward seepage flow is closely related to soil properties because it is affected by the physical structure of soil and the characteristics of rainfall infiltration [17,18].
Some studies have shown that P loss is mainly caused by sediment transport, and the proportion caused by overland flow and interflow is relatively small [19,20]. Other experimental studies reported that nutrient loss through interflow occupies a substantial share of the total nutrient loss [5,21]. The importance of interflow increases regardless of the low P mobility. Moreover, factors affecting P loss have been studied at different levels, most of which focus on the topographical conditions (slope angle and length) [22,23] and rainfall characteristics (intensity and duration) [2,16], as well as different land use patterns [24,25], fertilization [26,27] and vegetation cover [1]. The impacts of rainfall intensity and slope angle on interflow yield have been reported to be inconsistent [28]. It is found that interflow lasts for a longer time on slopes and it is another important loss pathway besides overland flow [11]. Rainfall runoff and soil nutrients enter into the adjacent receiving water bodies through interflow. For better controlling agricultural NPS pollution, the control of nutrient loss through interflow is necessary, aside from controlling the nutrient loss through overland flow.
However, the subsurface transport of P during heavy rainfalls is hard to evaluate because of many uncontrollable factors, including rainfall duration [20], vegetation cover [1,27] and soil properties [29]. To overcome these difficulties, artificial rainfall simulations can be applied to control the effects of rainfall intensity and slope angle, and therefore to shorten the experimental time and more easily observe the runoff generation processes [30]. Because of the difficulty in simultaneous monitoring overland flow and interflow under field conditions, this study adopts three-dimensional runoff plots with adjustable slopes to conduct rainfall tests through indoor artificial simulation. This study aims to evaluate the P loss through overland flow and interflow on slopes with different angles and under various rainfall intensities. Studying the mechanisms of P loss can provide scientific support for controlling nutrient loss. It also provides a theoretical basis for the prevention of agricultural NPS pollution and, consequently, sustainability.

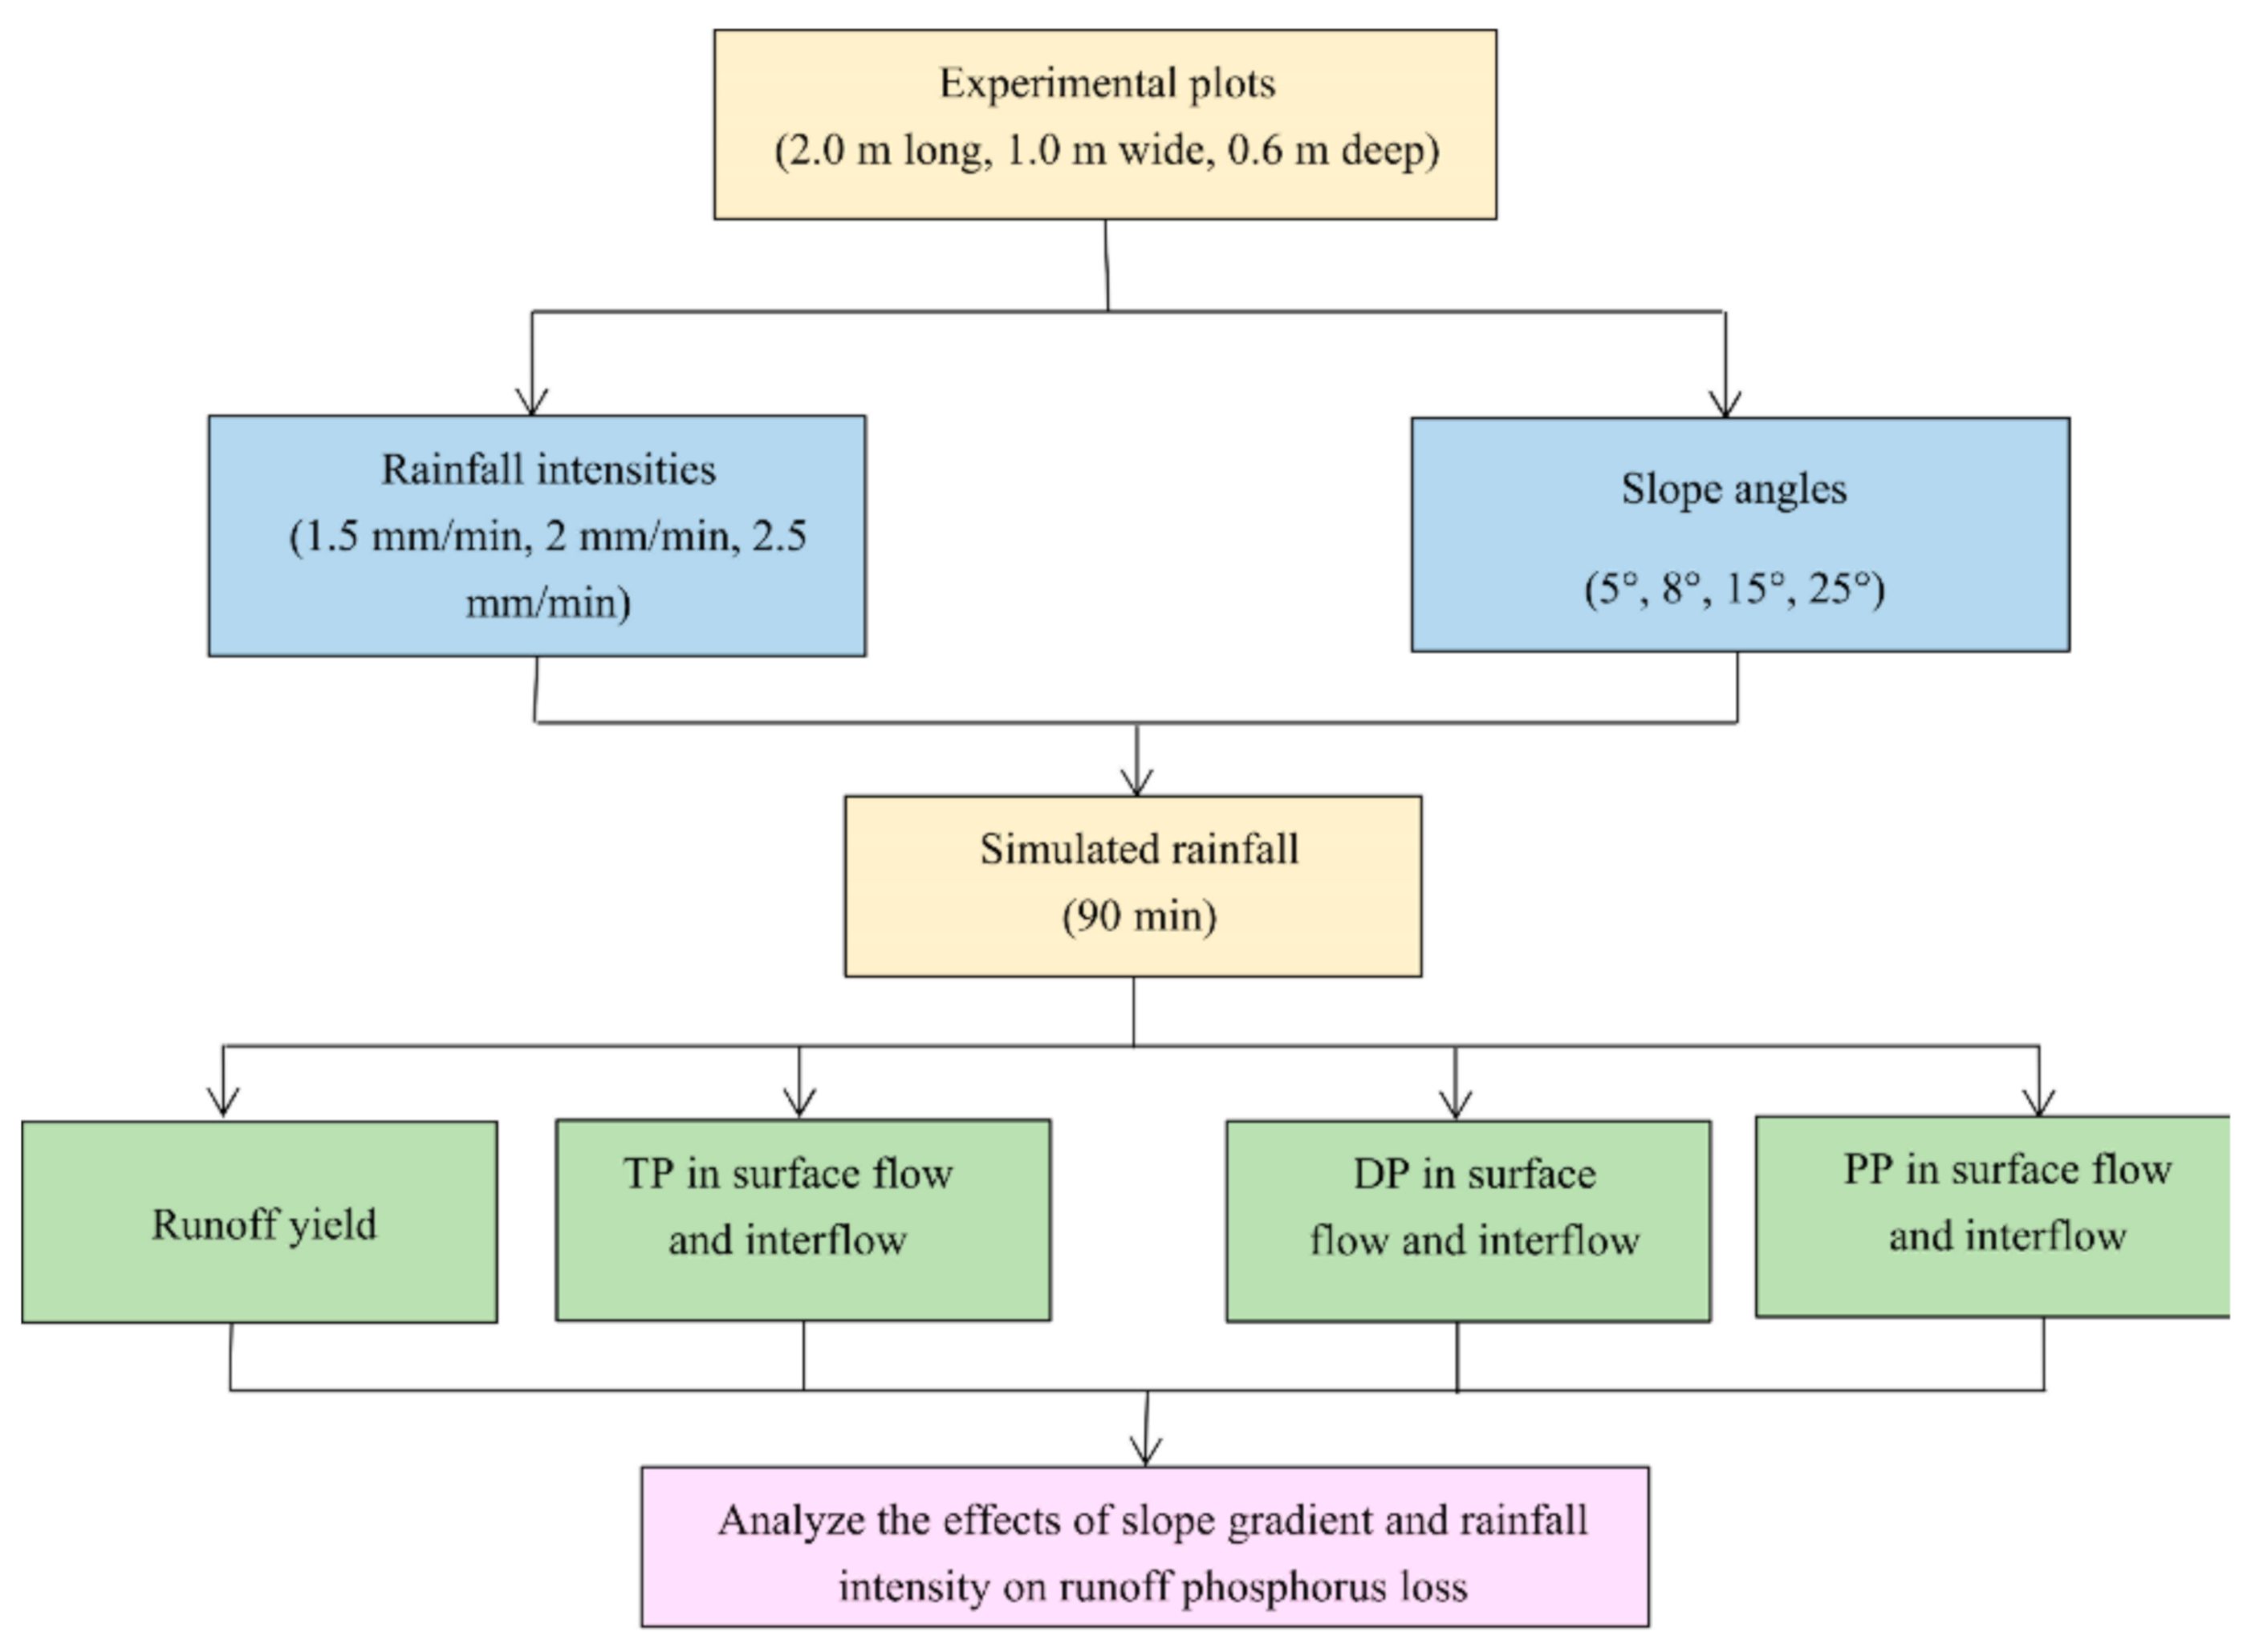
2. Materials and Methods

2.1. Study Area and Soil Sampling

The soil samples were collected from Anji County (30°34′ N, 119°23′ E; Figure 1a) in the northwest Zhejiang Province of China that belongs to the mid-subtropical monsoon region, characterized by abundant rainfall and mild climate. According to the records from the local meteorological station, the annual mean temperature is 15.6 °C, and the number of rainy days is 171, with an annual sunshine duration of 1792 h. The annual average relative humidity is 81%, and the annual mean precipitation is 1414 mm, 24.2% of which occurs from January to March, 61.7% from April to September and 14.1% from October to December. The surface soil layer is severely scoured and coarsened with the sand layer exposed due to heavy water erosion. The soil is typically derived from weathered granite, which is dominant in the region.
Before starting the rainfall experiments, soil layers (12) of 5 cm depth samples were collected along the soil profile (totaling 60 cm in depth) with sealed plastic bags, and were then taken back to the laboratory for the analysis of physicochemical properties. The bulk density (BD) was determined by the cutting ring method [31]. Some of the soil samples were used to determine the field moisture content (FMC) by the drying method [32]. Other soil samples were spread out on Kraft papers for drying at room temperature until they reached a constant moisture content of about 1.5% and were crushed by hand to promote further sieving. Then, they were sieved through a 2 mm sieve and further analyses were performed on fine-sized particle fraction (≤2 mm). The pH was determined by using a 1/2.5 (w/v) mixture of soil/water [33]. The soil organic matter (SOM) was analyzed by the wet oxidation method with K2Cr2O7-H2SO4, the total phosphorus (TP) by the molybdenum blue colorimetry method after digestion with HClO4-H2SO4 and the available phosphorus (AP) by the molybdenum antimony anti-colorimetric method after extraction with HCl-H2SO4 [34]. The total nitrogen (TN) was determined by the acid-soluble semi-micro Kjeldahl method [35]. The particle size distribution (PSD) of soil samples was determined by the pipette method after SOM oxidation with hydrogen peroxide and particle dispersion using CaCl2 (0.5 mol/L) [34]. All measurements were conducted in triplicate. The results showed that the soils were weakly acidic, with pH = 6.22 ± 0.73. The FMC was 8.00% ± 1.50% and the BD was 1.55 ± 0.13 g/cm3. The SOM was 4.65 ± 0.24 g/kg, while the TN, TP and AP content were, respectively, 0.90 ± 0.16 g/kg, 0.37 ± 0.12 g/kg and 10.92 ± 1.81 mg/kg. The soils were composed of 8.24% ± 0.92% clay (<0.002 mm), 12.25% ± 0.55% silt (0.002–0.02 mm) and 79.51% ± 1.08% sand (0.02–2 mm).

2.2. Experimental Design and Sample Analysis

The experiments were conducted in the Artificial Simulated Rainfall Test Base of Zhejiang University. The treatments included three different rainfall intensities (1.5, 2.0, 2.5 mm/min) and four slope angles (5°, 8°, 15°, 25°) that were set up according to the local hydrological and topographical conditions. The rainfall intensities were selected based on local meteorological and hydrological data from the monitoring stations and other rainfall characteristics of Zhejiang Province where heavy rainfalls caused by typhoon frequently occur [11]. The rainfall is affected by the rainy season, and strong typhoons occur every year from June to September, with a maximum rainfall intensity of 214.4 mm/h according to the difference between the annual average rainfall probability and the rainstorm level. Slopes with angles higher 25° are dominant in the study area. The slope angle of 8° is a key threshold for soil erosion according to the SL-190-2007 gradation index of the Standard of Water Conservancy Industry of the People’s Republic of China. In total, 12 rainfall tests were conducted. The experimental design is shown in Figure 2, along with the rainfall simulator (Figure 1b) and runoff plots (Figure 1c). Two runoff plots were simultaneously arranged with the same rainfall intensity covered. The separate results from the two parallel runoff plots were taken as experimental replications. The angle of the runoff plots could be regulated between 0–30°. Before starting each rainfall test, 20 rainfall calibrating gauges were placed around the runoff plots covered with waterproof cloth. Data of the rainfall calibrating gauges were verified for rainfall uniformity after the rainfall intensity approached the targeted range. Then, the tests started after the waterproof clothes were taken away. The mean coefficients of uniformity were all above 85%, which is generally considered to be acceptable [23].
Samples of overland flow and sediment were collected through the V-shaped outlet at the front part of the runoff plots and interflow percolating from the bottom sides of the runoff plots without sediment was collected by the extension groove at the bottom. Rainfall duration was recorded with stopwatches after calibrating rainfall intensity and uniformity. The total collection time was 90 min for overland flow and sediment samples and 180 min for interflow. The samples were collected at a 3 min interval and the overland flow and interflow volumes were measured with graduated cylinders. About 250 mL of the runoff samples were collected and quickly brought back to the laboratory for water quality analysis. The remaining samples were settled aside for at least 24 h and clear supernatant was decanted from the containers. The remaining part was air dried for sediment weight. The 5 cm topsoil was replaced with new soils after each rainfall test and 100 g organic fertilizer (m(P2O5) = 3.5%) and 20 g compound fertilizer (m(P2O5) = 15%) were evenly spread on the surface layer according to local fertilization practices. Then, the runoff plots were put away for one week until constant moisture content, which would be measured before the following rainfall test. The P budget was estimated based on the commonly used formula [12,24], as the applied fertilizers could not be fully transported out of the runoff plots during every rainfall:
F n = i = 1 n = 12 B f i = 0 n = 11 D w + S d + S o r i g i n a l P % = B f F n × 100 % T P m c m g / L = P % × T P m c m
where Fn is TP load (LTP) in the runoff plots before the nth rainfall, Bf is LTP in the applied fertilizers, Dw is LTP with runoff, Sd is LTP with sediment, Soriginal is the original TP content, P(%) is the reduction coefficient, TPmc is the modified TP concentration (CTP) and TPmcm is the tested CTP.
The collected samples were shaken and then some were digested by potassium persulfate oxidation to determinate CTP, while others were filtered by 0.45 μm microporous membrane to determinate the dissolved phosphorus (DP) concentration (CDP) with the method of UV/VIS spectrophotometry. The difference between CTP and CDP was considered as particulate phosphorus (PP) concentration (CPP), with the organic phosphorus in the filtered samples assumed to be negligible. The P load (LP) of each sample was calculated according to the following formula [2]:
L P = C P × V ,
where LP is P load per three min, mg; CP is the average P concentration per three min, mg/L; V is runoff volume per three min, L. The total LP of each rainfall test is the sum of all the samples. Figures were drawn using Origin 9.0, and statistical analysis was performed using Microsoft Excel 2019 and SPSS 20.0. Multi-factor analysis of variance and regression analyses were used to examine the relationships between P loads and explanatory variables.

3. Results and Discussion

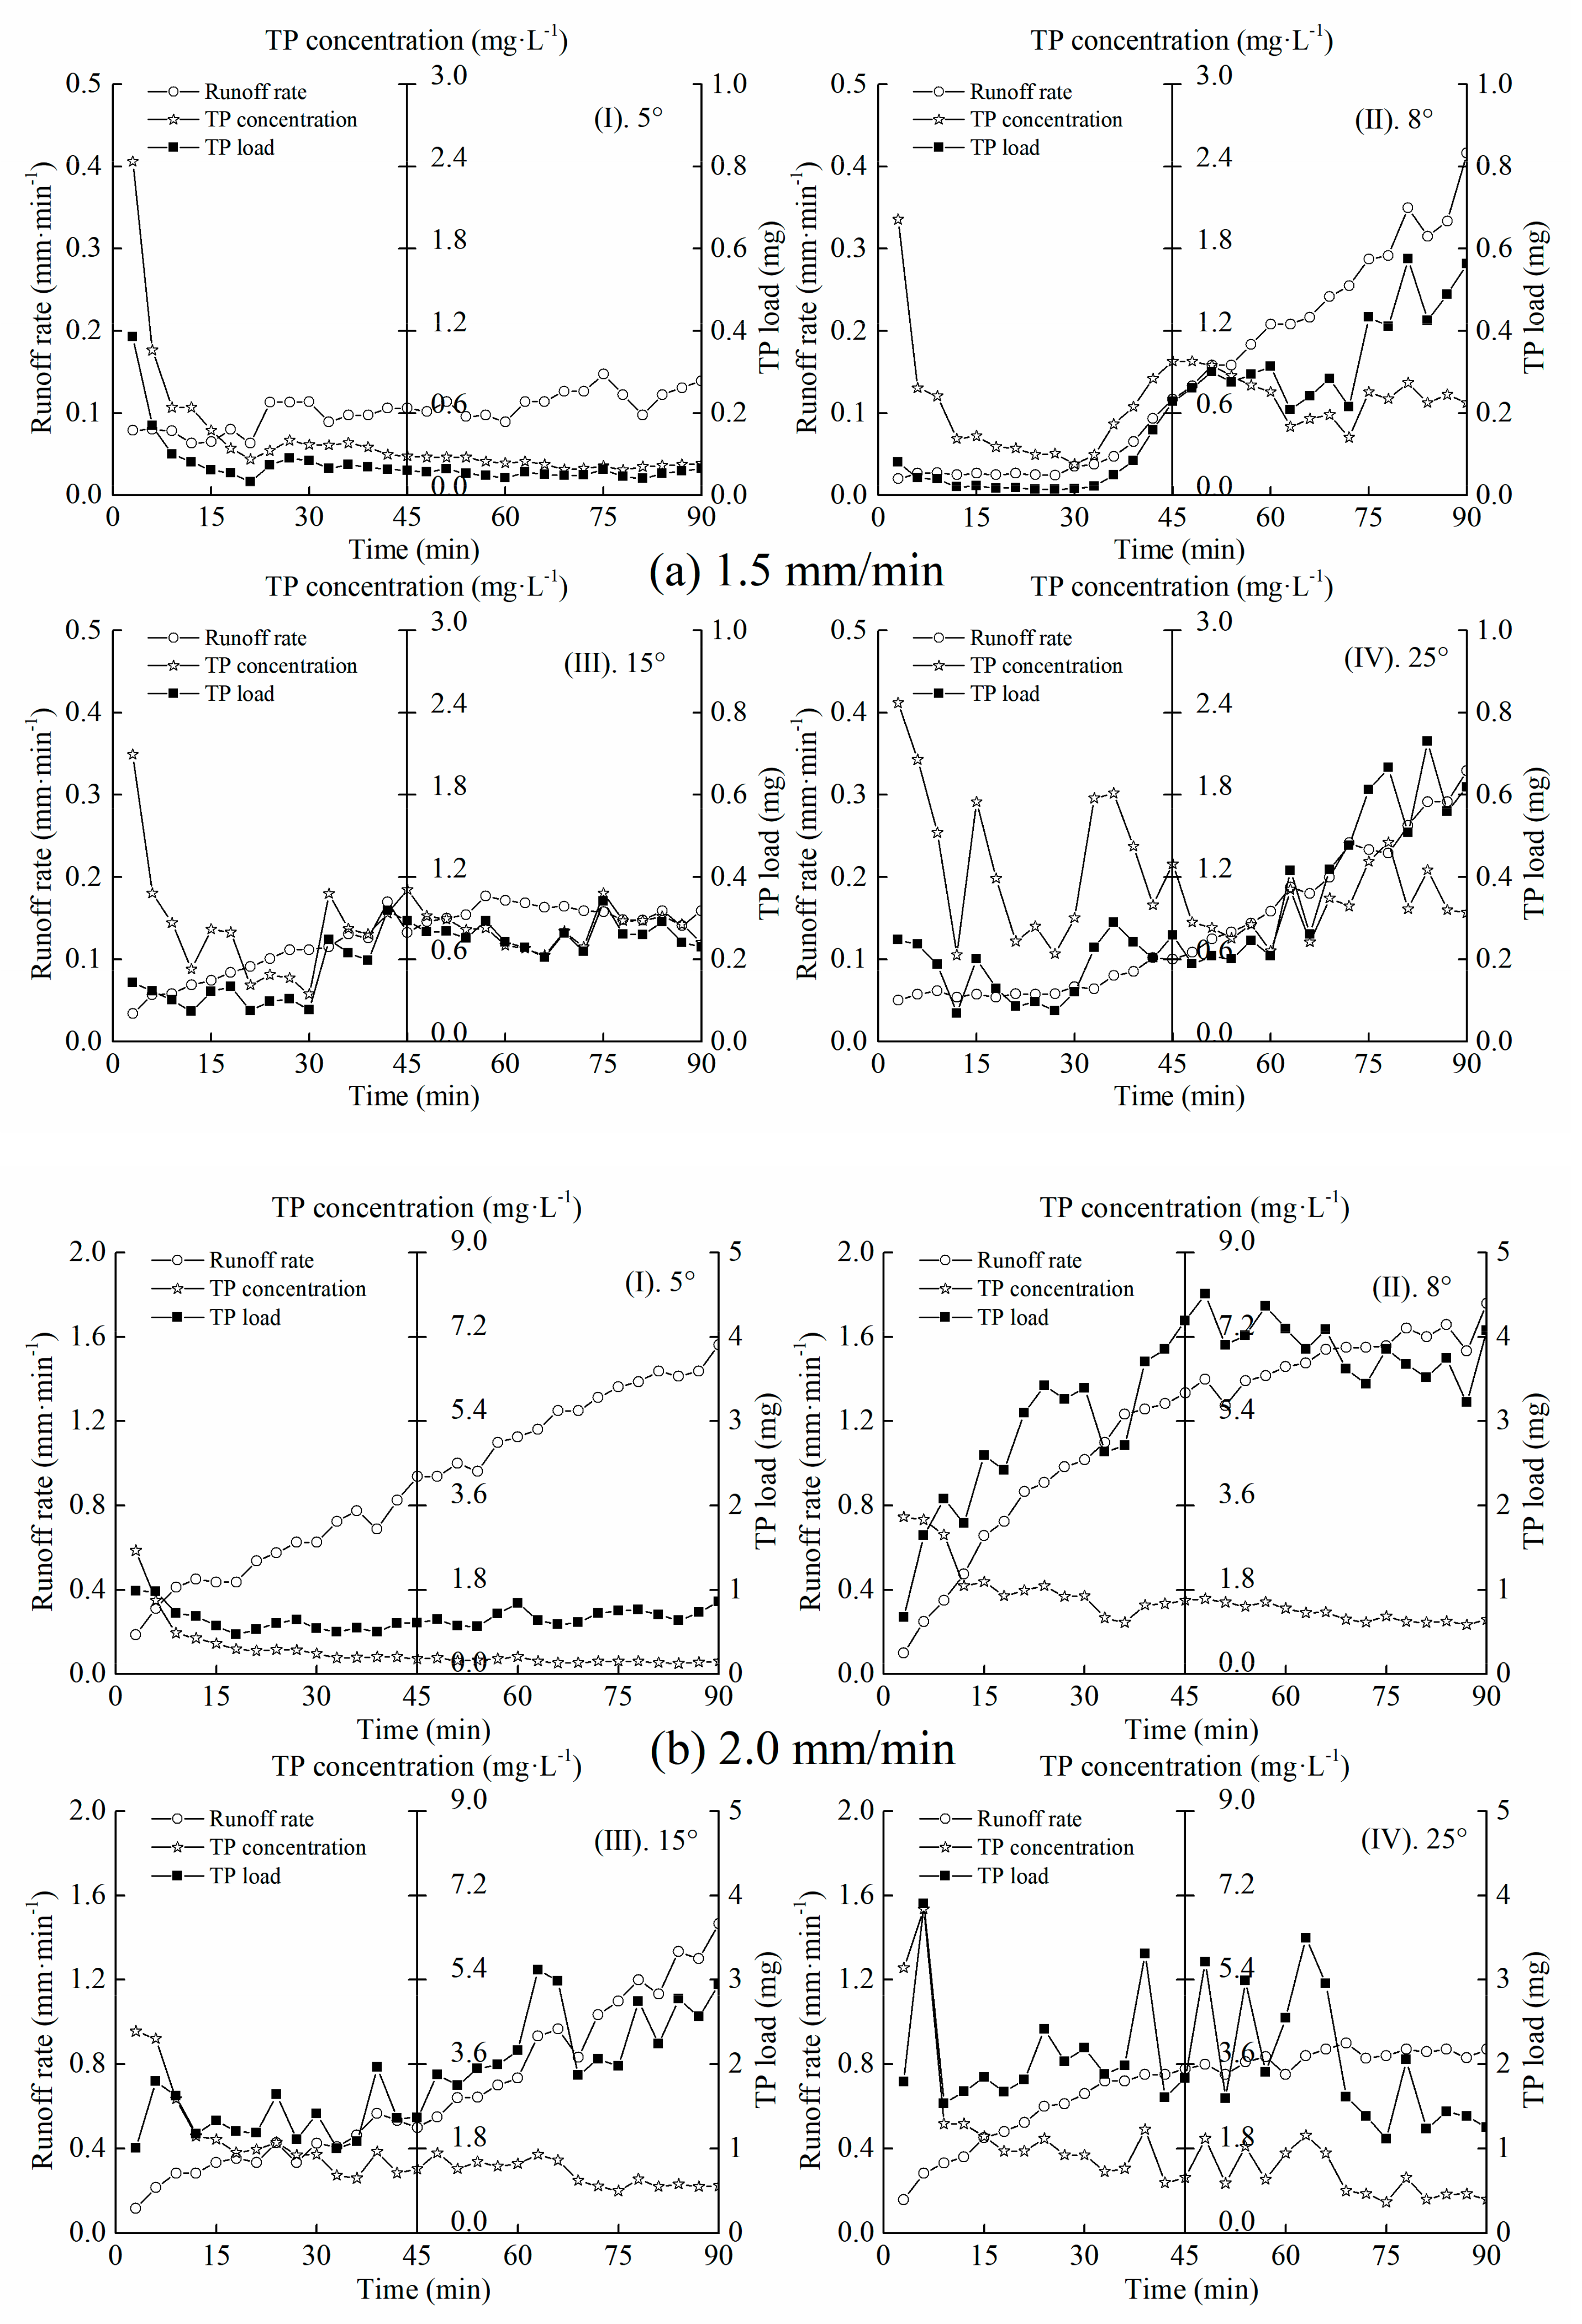
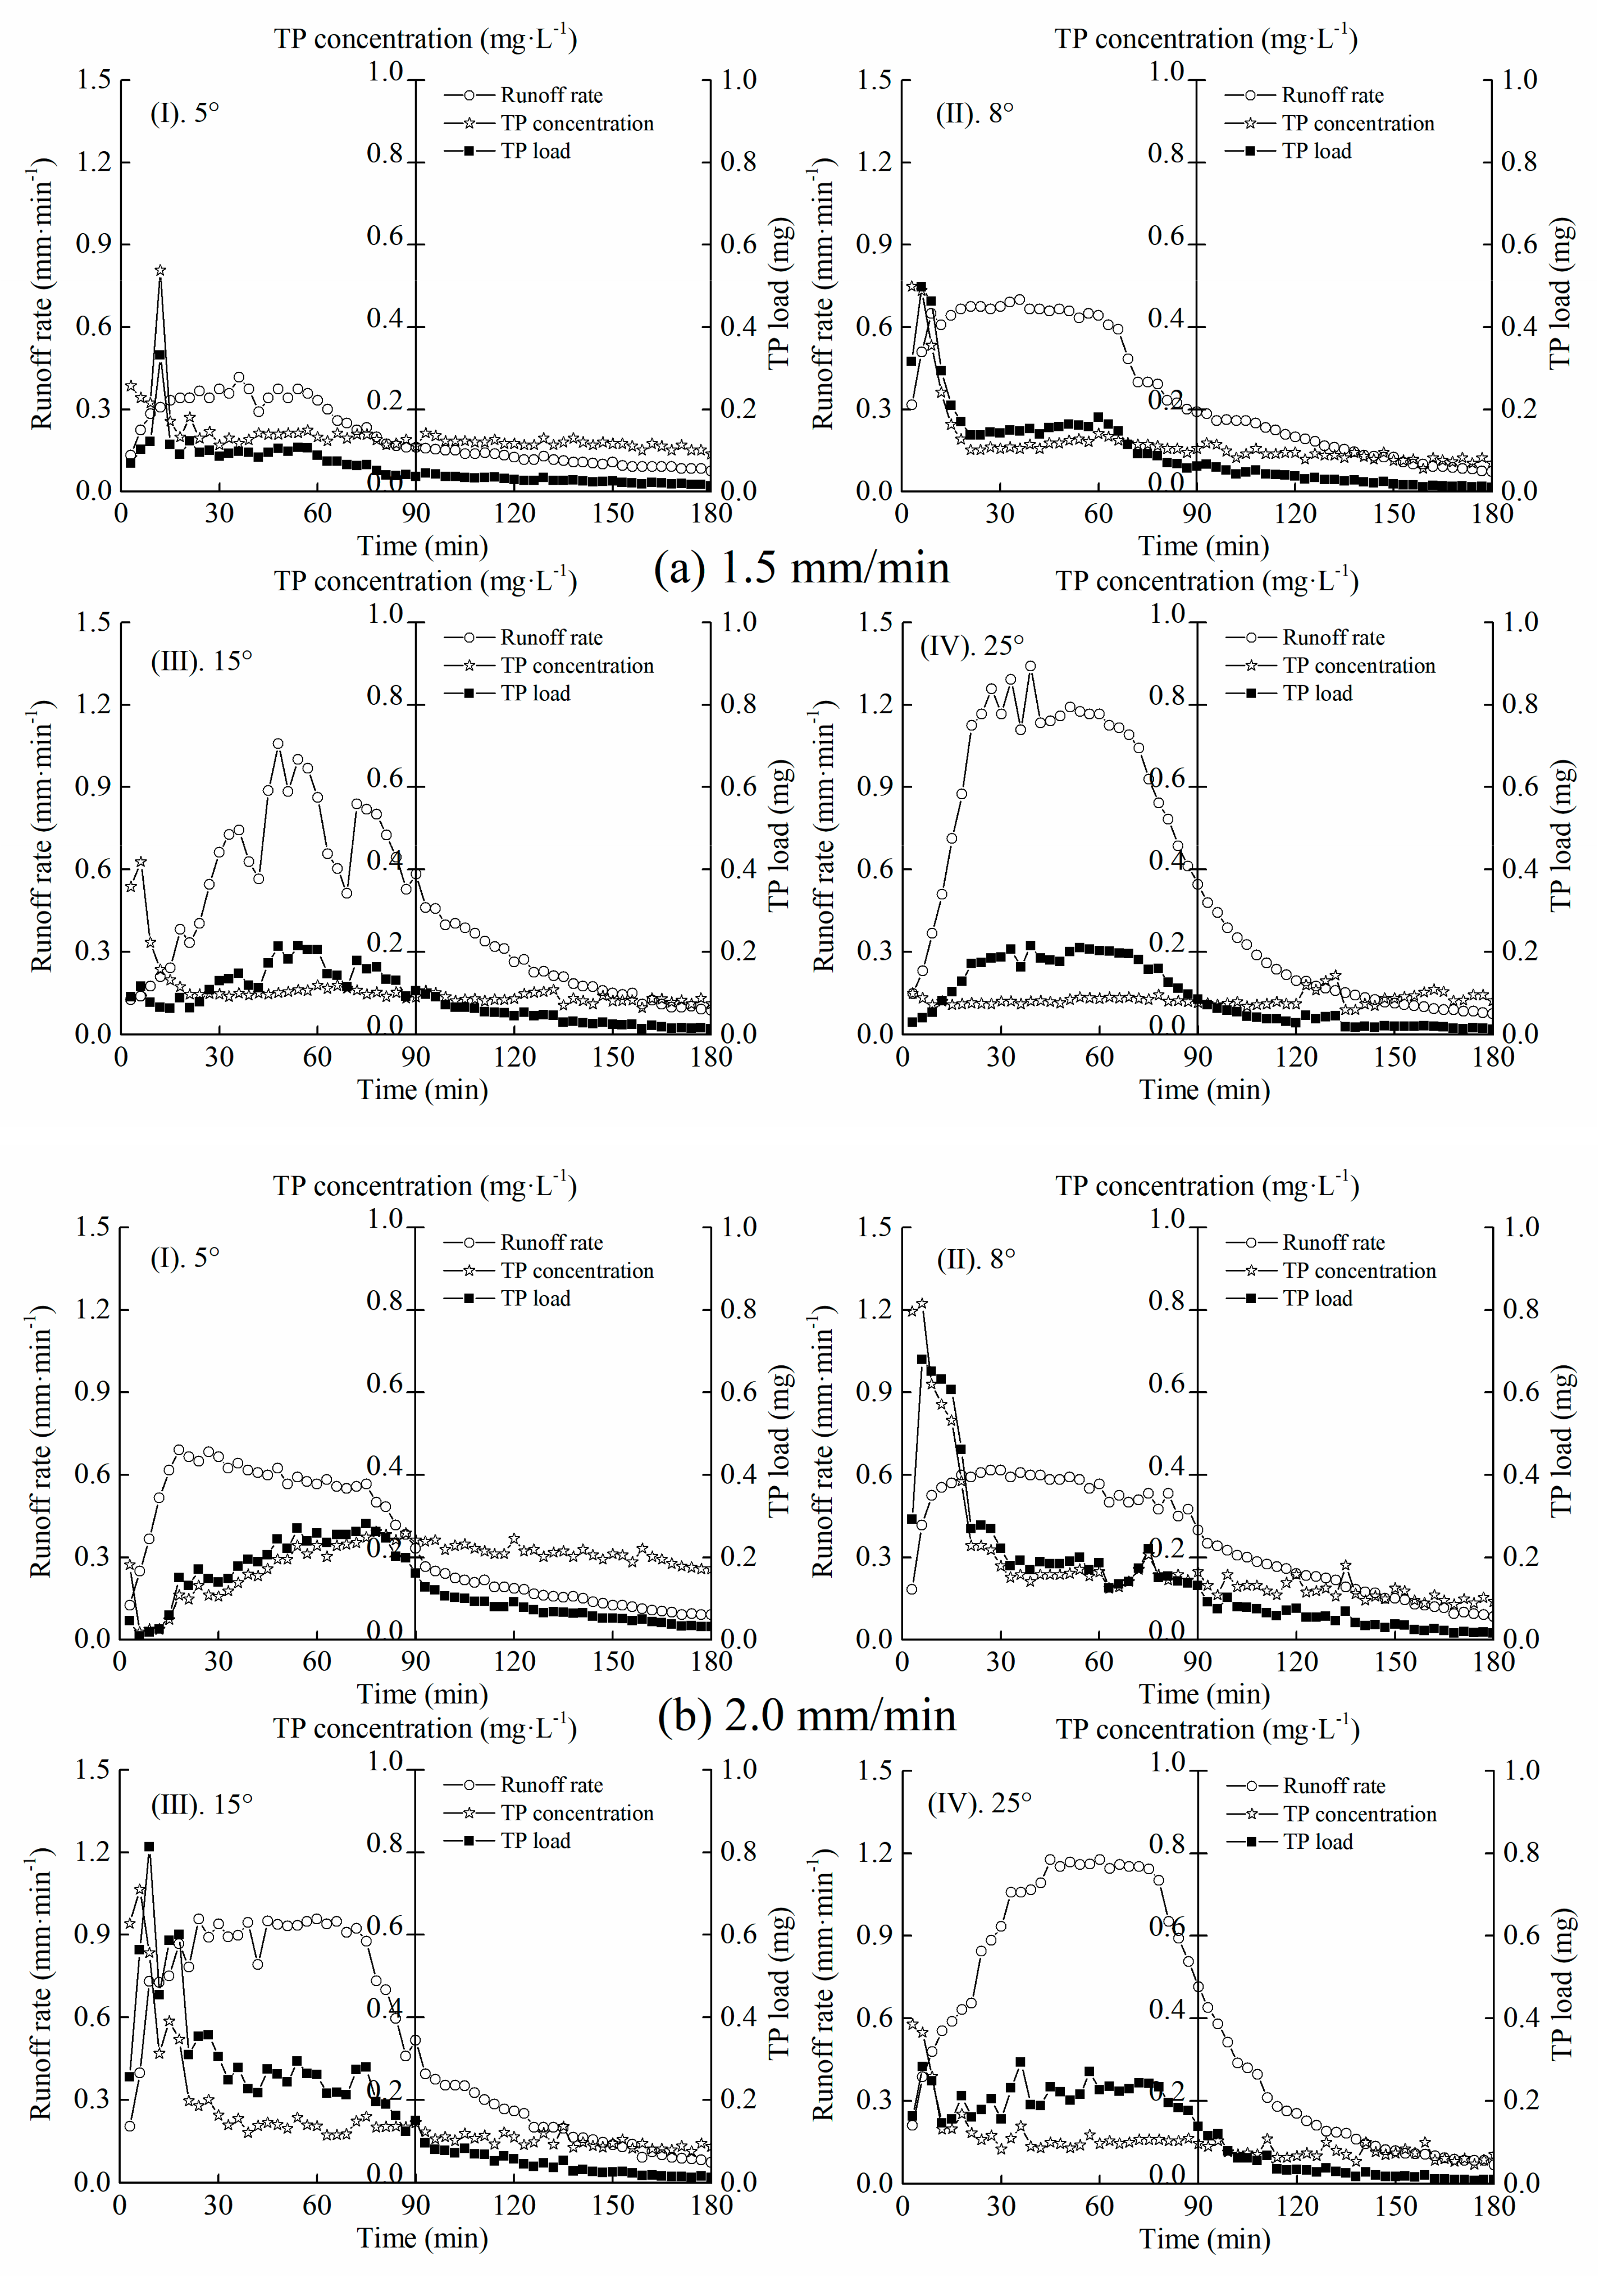
3.1. TP Loss through Overland Flow and Interflow

Runoff generation includes three different processes: overland flow, interflow and ground water [1,36]. Although interflow has been recognized as a key hydrological pathway on hillslopes for a long time, only the processes of overland flow are intensively studied nowadays under simulated and natural rainfalls [37]. Because of the design of the runoff plots, the runoff processes of this study were differentiated into overland flow and interflow for conveniently determining the P load by runoff. The patterns of overland flow and interflow rate with time of runoff under different slope angles and rainfall conditions are depicted in Figure 3. Overland flow increased with time of runoff, and the increasing rate is swift was the initial stage, then increasing slowly under rainfall intensities of 2.0 and 2.5 mm/min. It presented a light fluctuation under the 1.5 mm/min rainfalls. The reason might be that the slopes were more easily wetted under heavier rainfalls because more rainfall drops could get into the runoff plots per unit time and the splashing effect would be stronger. Overland flow increased with rainfall intensity, and the difference between different slopes gradually diminished as rainfall strengthened. Overland flow decreased with increasing slope angle, the maximum value being reached on the 8° slopes when rainfall intensity was uniform. The occurring time of interflow shortened and the interflow rate accelerated when rainfall became heavier. Interflow increased with time of runoff at first, then it stabilized for some time and finally declined after the precipitation stopped. Interflow greatly contributed to runoff loss by 28.53% to 89.12%. The maximum interflow declined with rainfall intensity on the 5° and 8° slopes, while it displayed an opposite trend on the 15° and 25° slopes. Overland flow is generated by excess infiltration when rainfall intensity is stronger than the infiltration capacity of the soil [38]. The diameter of the raindrops becomes larger and the speed of the raindrops increases, which causes strong splashes and wash-off on the test soil [11]. The subsequently formed crust potentiates overland flow generation. The kinetic energy of the raindrops is weak and the damage effect on the soil surface is small when rainfall intensity is lower than the soil infiltration capacity [38]. In these conditions, the amount of overland flow generated by excess saturation is small. Interflow generation, on the other hand, is higher due to the high soil content of sand-sized particles, which promote infiltration. Runoff infiltration and interflow generation on slopes with steep angles are also enhanced by the damage effects of heavy raindrops on the topsoil [22]. The condition of higher slope angles not only potentiates the activation and transport of soil particles, but also strengthens the potential energy and shearing force of the infiltrated runoff [39].
The dynamics of TP loss through overland flow under different experimental conditions is depicted in Figure 4. CTP in overland flow was relatively high at the initial stage and then it declined with time of runoff. The early observed high concentration was similar to the first flush effect that happened during an urban storm event [2] and the reason might be that the rainfall splashes disrupted soil aggregates and entrained particulates once overland flow produced enough shear stress [10,40]. The average CTP in overland flow presented a positive relationship with rainfall intensity and slope angle. CTP increased with rainfall intensity, the maximum value being observed at 2.5 mm/min rainfall and the minimum value at 1.5 mm/min rainfall. Gao et al. [1] also found that heavier rainfalls led to increasing P export, which gradually declined with time of runoff. The reason might be that the applied fertilizers are in a high-risk period of nutrient loss [41]. Most of the P stays in the topsoil of the bare slopes, being easily transported away by heavier rainfalls with a strong scouring effect. The immediate output of P at the beginning of rainfall led to great changes of the initial CTP. Rainfall intensity greatly affects overland flow generation [42]. The dilution effect appeared as overland flow progressively increased with time of runoff. Similar results have been reported in unsaturated loess soils [43]. It was observed that the roughness of the slopes increased with rainfall intensity, as well as slope angle and the occurrence of the phenomenon of rill erosion. Hydraulic erosion results in severe loss of suspended nutrients such as PP through overland flow. Studies have shown that P concentration is affected by the proportion and total amount of organic fertilizers applied [27], as well as the application method [44]. For example, Zhang et al. [25] found that the depth of overland flow and LTP was significantly lessened (p < 0.05) under the impacts of soil surface protection and organic matter addition. Chang et al. [26] also applied three kinds of soil management measures (humic acid (HA), polyacrylamide (PAM), green manure (GM)) to study P losses through plot-scale experiments. They found that P loss from sloping farmland was reduced by different agricultural practices with an order of GM > PAM > HA.
Studies have shown that interflow accounts for a considerable share of runoff in steep slopes, and nutrient loss through interflow cannot be ignored [5,9,45]. Few attempts have been made to analyze the impacts of slope angle on P loss through interflow. It can be seen from Figure 5 that CTP in interflow was relatively stable compared to that in overland flow, and the difference between the two loss pathways was large. CTP in interflow was more likely to be affected by rainfall intensity and slope angle. On the whole, CTP in interflow rapidly decreased with time of runoff until it became stable and the variation was smaller than that in overland flow. CTP in interflow regularly declined with time of runoff on different slopes and displayed an order of 5° > 8° > 15° > 25°, which was completely opposite to that of overland flow. In addition, CTP in interflow was positively affected by rainfall intensity on the same slopes, which was consistent with the results of overland flow. The influence of slope micro-topography was weakened on steeper slopes. For example, the surface depressions and barriers weakened runoff on steeper slopes [46]. In these conditions, rainfall was more likely to generate overland flow and transport a large amount of topsoil nutrients. Nutrient loss through the percolated interflow on steeper slopes was much less when compared with that on gentle slopes. The vertically infiltrated flow on the gentle slopes was more likely to transport runoff nutrients into the deeper soil layers, as the slope was relatively flat and the rainfall runoff was in a slow-moving state [21]. He et al. [47] studied P loss on steep slopes with purple soils using artificial rainfall simulations and found less nutrient loss through interflow and more nutrient loss through overland flow on steeper slopes. This also agrees with Hu et al. [48], who found that P loss through overland flow was positively related to slope angles. In addition, the rain-receiving area of the runoff plots declined as the slope angle increased and the horizontal infiltration area of the topsoil also decreased, which reduces nutrients loss through interflow. The differences between nutrient loss through overland flow and interflow are caused by a variety of factors, including the type, texture, structure and weathering characteristics of the test soils [29,49,50].

3.2. Average DP and PP Concentrations

The trends of average CDP and CPP in overland flow and interflow in different experimental conditions are depicted in Figure 6. The average CDP in overland flow fluctuated with rainfall intensity on slopes with different angles, which is consistent with the findings of Wu et al. [28], who studied the loss of adsorbed and dissolved P on bare loess slopes. The maximum average CDP in overland flow (0.598 mg/L) was 3.21 times higher than the minimum value. Average CDP in interflow regularly increased with rainfall intensity and declined with slope angle. The maximum average CDP in interflow (0.184 mg/L) was 5.75 times higher than the minimum value. The reason might be that CDP in interflow is dominantly dependent on runoff generation. Runoff volume increased with slope angle and produced a dilution effect on CDP. The average CDP declined under heavier rainfalls until the desorption equilibrium of soil P was reached. The interflow volume declined with increasing rainfall intensity due to the formation of soil crusts caused by heavy rainfall splashes and the reduction of the infiltration rate. Both the DP load (LDP) and average CDP in interflow were comparatively smaller than that in overland flow, which indicated that overland flow was the predominant loss pathway of DP. The results are in accordance with that of Heathwaite and Dils [16], who found that DP dominates P loss via overland flow. They attributed the DP increase to the soil-interflow interactions. A water sealing layer will be formed as runoff depth increases to a certain extent. Especially under heavy raindrops and splash erosion on gentle slopes, soil seals were more likely to form and impact DP dissolution in the topsoil. The reason might be that the splash erosion was mild and the desorption capacity of soil P was weak at light rainfalls. Rainfall splashes and runoff generation strengthened with increasing rainfall intensity and intensify the fluctuations of CDP. Consequently, the average CDP in overland flow declined with increasing rainfall intensity. This was because overland strengthens under heavier rainfalls and thus intensifies soil erosion which was greater than the dilution effect. Interflow increased faster than the dissolution rate of soluble P. Dupas et al. [17] found that CDP in shallow ground water was a good indicator for stream P concentration. They recommended the predominant CDP regulation for controlling stream nutrient discharges.
The curves in Figure 6 indicate that the average CPP in overland flow increased with rainfall intensity and slope angle, except at the 2.0 mm/min rainfall treatment on the 8° slope. The average CPP in interflow dramatically fluctuated under the various rainfall intensities and slope angles. The average CPP in overland flow was 0.12–1.62 mg/L, while that in interflow is 0.04–0.12 mg/L. The average CPP in overland flow was greatly higher than the average CDP, while an opposite trend was observed in interflow. This might be attributable to the large kinetic energy of heavy rainfalls and the scouring effect of runoff strengthening P desorption capacity [28]. These results agree with Dupas et al. [51], who reported that PP loss was dependent on runoff discharge and eroded sediment. The average CPP pattern in interflow was less distinctive compared to CTP and CDP. However, there was a decreasing trend with slope angle for CPP in interflow under the 2.5 mm/min rainfall intensity. Wu et al. [28] found that CPP accounts for about 96.6% of CTP and is the predominant form of soil P loss. Doody et al. [52] concluded that PP accounts for more than 53% for LTP. Wang et al. [53] also found that PP generally contributes more than 70% for P loss. CPP in interflow declines as rainfall intensity becomes higher. LPP in interflow increases through leaching and sorption mechanisms as the residue/contact time increases [5]. A certain amount of PP might also be exported in the available form of soluble P when PP is attached on the anoxic sediment [54]. Moreover, soil P desorption is significantly impacted by the formed pathways of preferential flow [55,56].

3.3. Relationships between TP, DP and PP in Overland Flow and Interflow

Figure 7 shows the percentages of the different forms of P loss through overland flow and interflow at each individual rainfall experiment. The percentage of LTP through overland flow was 51–92%, indicating that overland flow was the main loss pathway of runoff P. The percentage of LTP through overland flow was the highest on the 8° slope. PP was the main form of P lost through overland flow, while DP was the main form of P lost through interflow. The average CDP in overland flow varied from 0.186 to 0.598 mg/L, while in interflow it varied from 0.032 to 0.184 mg/L, which is higher than the critical DP concentration of 0.02 mg/L that causes water eutrophication. It can be concluded that P loss from the agricultural land is a serious problem for the aquatic environment. Rainfall intensity significantly impacted the form of P loss under these experimental conditions because the selected rainfall intensities were high. The intensity of raindrops hitting the surface soil was high and the amount of eroded sediment increased under heavier rainfalls. Overland flow had a large scouring effect on the soil surface and transported a great amount of PP in the runoff, whereas the PP mobility was extremely weak in interflow due to its high adsorption capacity. P output in interflow was mainly in the form of DP with very small losses. The proportions of the different forms of P in various pathways are related to the fertilization practices, such as the quality and type of the fertilizers [57,58]. P in the less-fertilized agricultural lands of this study was dominated by PP. The soluble P that is not fixed by the soil was also relatively high, so the proportion of DP in overland flow was larger than that in interflow. This was because the test soil was poor in nutrients and the amount of applied fertilizers might be insufficient.
The impacts of slope angle and rainfall intensity on P loss via different runoff pathways are presented in Table 1. Overland flow was significantly affected by rainfall intensity (p < 0.01), while interflow was positively related to slope angle. LTP in overland flow was significantly affected by rainfall intensity and runoff yield (p < 0.01). LTP and LDP in interflow were significantly correlated to rainfall intensity (p < 0.01) and presented negative relationships with runoff yield and slope angle. LDP and LPP were highly related to LTP, both in overland flow and interflow. The correlation coefficient (R2) of DP was greater than that of PP. Equations (3) and (4) are linear regression models of LTP and slope angle, rainfall intensity and runoff yield:
L T P O = 4.219 S + 87.745 I + 0.818 Q 186.229             R 2 = 0.712 ,
L T P I = 0.86 S + 12.814 I + 0.179 Q 17.558         R 2 = 0.936 ,
where LTPO is LTP in overland flow, mg; LTPI is LTP in interflow, mg; S is slope angle, °; I is rainfall intensity, mm/min; Q is runoff yield, L. The two linear regression models are well fitted and reliable. TP loss is mainly controlled by rainfall intensity [59]. P loss processes on agricultural fields are very complex and impacted by rainfall characteristics and topographical factors as well as soil properties [1]. Runoff movement was the key factor to the loss of nutrients from agricultural fields, and its contributions to P loss cannot be ignored. P loss through overland flow was predominant, which was accompanied by P loss via eroded sediment. The interflow generation was small but long-lasting, and P loss through interflow was considerable. It is necessary to improve the water holding capacity of soils and reduce runoff and nutrient loss through interflow when defining prevention and erosion measures on agricultural lands. For example, measures such as vegetation maintenance and mulching that cover the soil surface can be adopted to reduce runoff generation and mitigate nutrient losses in this region.

4. Conclusions

This study systematically explored P loss by runoff from bare weathered granite slopes with simulated rainfalls. Results show that overland flow was significantly affected by rainfall intensity but interflow was positively related to slope angle. The interflow yield made great contributions to runoff loss, with a range of 28.53–89.12%. Runoff yield and P load in overland flow presented negative correlations with slope angle. The variations of CTP in interflow was relatively stable compared to that in overland flow. The percentage of LTP in overland flow was 51–92%, indicating that overland flow was the dominant loss pathway of runoff P. P export by interflow was mainly in the form of DP with very small losses. Both CDP and LDP in interflow were much smaller than that in overland flow, but the concentration was higher than the limiting P concentration, causing eutrophication. The contribution of interflow to P discharge cannot be ignored. P loss was mainly controlled by rainfall intensity, and protective measures should be adopted to mitigate nutrient loss by runoff. In short, this study revealed the characteristics of P loss through overland flow and interflow on bare weathered granite slopes. These findings give scientific supports for the control and mitigation of P pollution in weathered granite ecosystems. However, further research is needed to study the transport processes of P under the field conditions, and to compare the loss mechanisms in different kinds of soils.

Author Contributions

Conceptualization, L.D. and L.Z.; methodology, L.D. and L.Z.; software, K.F. and T.S.; validation, L.D., K.F. and T.S.; formal analysis, K.F., T.S. and X.F.; investigation, L.D.; resources, L.N. and L.Z.; data curation, X.F.; writing—original draft preparation, L.D.; writing—review and editing, L.Z.; visualization, L.Z.; supervision, L.Z.; project administration, L.Z.; funding acquisition, L.Z.

Funding

This research was funded by the National Natural Science Foundation of China (41877065).

Acknowledgments

The authors thank the staff of the Agricultural Science Experimental Station of Zhejiang University (Changxing County, China) for help with the experiments.

Conflicts of Interest

The authors declare no conflict of interest.

References

  1. Gao, Y.; Zhu, B.; Zhou, P.; Tang, J.; Wang, T.; Miao, C. Effects of vegetation cover on phosphorus loss from a hillslope cropland of purple soil under simulated rainfall: A case study in China. Nutr. Cycl. Agroecosys. 2009, 85, 263–273. [Google Scholar] [CrossRef]
  2. Zhang, R.; Li, M.; Yuan, X.; Pan, Z. Influence of rainfall intensity and slope on suspended solids and phosphorus losses in runoff. Environ. Sci. Pollut. Res. 2018, 26, 1–13. [Google Scholar] [CrossRef] [PubMed]
  3. Novais, S.V.; Olivieira-Zenero, M.D.; Carneiro-Barreto, M.S.; Montes, C.R.; Pelegrino-Cerri, C.E. Phosphorus removal from eutrophic water using modified biochar. Sci. Total Environ. 2018, 633, 825–835. [Google Scholar] [CrossRef] [PubMed]
  4. Yang, P.; Lai, D.Y.F.; Jin, B.; Bastviken, D.; Tan, L.; Tong, C. Dynamics of dissolved nutrients in the aquaculture shrimp ponds of the Min River estuary, China: Concentrations, fluxes and environmental loads. Sci. Total Environ. 2017, 603, 256–267. [Google Scholar] [CrossRef] [PubMed]
  5. Jeong, C.Y.; Weindorf, D.C.; DeRamus, A.; Goodeaux, L.L. Surface and subsurface phosphorus losses from sugarcane fields with different management practices. Water Air Soil Poll. 2011, 217, 649–661. [Google Scholar] [CrossRef]
  6. Zheng, J.; Li, F.; Sun, L. Identification of eutrophication-controlling factors in mesohalinous waters of coastal region: A case study on Qingjing Lake of Tianjin City. Acta Sci. Circumstantiae 2016, 36, 785–791. [Google Scholar] [CrossRef]
  7. Correll, D.L. The role of phosphorus in the eutrophication of receiving waters: A review. J. Environ. Qual. 1998, 27, 261–266. [Google Scholar] [CrossRef]
  8. Recanatesi, F.; Ripa, M.N.; Leone, A.; Luigi, P.; Luca, S. Land use, climate and transport of nutrients: Evidence emerging from the lake vicocase study. Environ. Manag. 2013, 52, 503–513. [Google Scholar] [CrossRef]
  9. Zheng, H.; Liu, Z.; Zuo, J.; Wang, L.; Nie, X. Characteristics of nitrogen loss through Surface-Subsurface flow on red soil slopes of southeast china. Eurasian Soil Sci. 2017, 50, 1506–1514. [Google Scholar] [CrossRef]
  10. Wu, X.; Wei, Y.; Wang, J.; Xia, J.; Cai, C.; Wu, L.; Fu, Z.; Wei, Z. Effects of erosion degree and rainfall intensity on erosion processes for Ultisols derived from quaternary red clay. Agric. Ecosyst. Environ. 2017, 249, 226–236. [Google Scholar] [CrossRef]
  11. Deng, L.; Fei, K.; Sun, T.; Zhang, L.; Fan, X.; Ni, L. Characteristics of runoff processes and nitrogen loss through overland flow and interflow from weathered granite slopes of Southeast China. J. Mt. Sci. Engl. 2019, 16, 1048–1064. [Google Scholar] [CrossRef]
  12. Fei, K.; Deng, L.; Zhang, L.; Sun, T.; Wu, Y.; Fan, X.; Dong, Y. Lateral transport of soil total carbon with slope runoff and interflow: Effects of rainstorm characteristics under simulated rainfall. Catena 2019, 179, 39–48. [Google Scholar] [CrossRef]
  13. Roberts, W.M.; Stutter, M.I.; Haygarth, P.M. Phosphorus retention and remobilization in vegetated buffer strips: A review. J. Environ. Qual. 2012, 41, 389–399. [Google Scholar] [CrossRef] [PubMed]
  14. Zhou, B.; Vogt, R.D.; Lu, X.; Yang, X.; Lu, C.; Mohr, C.W.; Zhu, L. Land use as an explanatory factor for potential phosphorus loss risk, assessed by P indices and their governing parameters. Environ. Sci. Proc. Imp. 2015, 17, 1443–1454. [Google Scholar] [CrossRef] [PubMed] [Green Version]
  15. Chu, L.; Wang, K.; Song, Z.; Li, T.; Li, Y. Dynamics of nitrogen and phosphorus in tobacco slope cropland interflow. J. Agro Environ. Sci. 2010, 29, 1346–1354. [Google Scholar]
  16. Heathwaite, A.L.; Dils, R.M. Characterising phosphorus loss in surface and subsurface hydrological pathways. Sci. Total Environ. 2000, 251, 523–538. [Google Scholar] [CrossRef]
  17. Dupas, R.; Mellander, P.; Gascuel-Odoux, C.; Fovet, O.; McAleer, E.B.; McDonald, N.T.; Shore, M.; Jordan, P. The role of mobilisation and delivery processes on contrasting dissolved nitrogen and phosphorus exports in groundwater fed catchments. Sci. Total Environ. 2017, 599, 1275–1287. [Google Scholar] [CrossRef]
  18. Tuo, G.; Li, H.; Jin, Y.; Li, Y. Characteristics of phosphorus transfer in farmland under artificial rainfall conditions. Hupokexue 2009, 21, 45–52. [Google Scholar] [Green Version]
  19. Li, Z.; Zhang, G.; Yu, X.; Liu, Q.; Zhang, X. Phosphorus loss and its estimation in a small watershed of the Yimeng mountainous area, China. Environ. Earth Sci. 2015, 73, 1205–1216. [Google Scholar] [CrossRef]
  20. Wang, L.; Liang, T.; Zhang, Q. Laboratory experiments of phosphorus loss with surface runoff during simulated rainfall. Environ. Earth Sci. 2013, 70, 2839–2846. [Google Scholar] [CrossRef]
  21. Heclrath, G.; Brookes, P.C.; Poulton, P.R.; Goulding, K. Phosphorus leaching from soils containing different phosphorus concentrations in the broadbalk experiment. J. Environ. Qual. 1995, 24, 904–910. [Google Scholar] [CrossRef]
  22. Xie, S.; Mo, M.; Tu, A.; Liu, Y. Characteristics of vertical runoff output on red-soil slope under natural rainfall condition. Trans. Chin. Soc. Agric. Eng. 2014, 30, 132–138. [Google Scholar] [CrossRef]
  23. Fu, X.; Zhang, L.; Wang, X. The effect of slope length on sediment yield by rainfall impact under different land use types. Water Resour. 2016, 43, 478–485. [Google Scholar] [CrossRef]
  24. Tiwari, K.R.; Sitaula, B.K.; Bajracharya, R.M.; Borresen, T. Effects of soil and crop management practices on yields, income and nutrients losses from upland farming systems in the Middle Mountains region of Nepal. Nutr. Cycl. Agroecosys. 2010, 86, 241–253. [Google Scholar] [CrossRef]
  25. Zhang, Q.; Chen, S.; Dong, Y.; Liu, D.; Yang, X.; Yang, Z. Controllability of phosphorus losses in surface runoff from sloping farmland treated by agricultural practices. Land Degrad. Dev. 2017, 28, 1704–1716. [Google Scholar] [CrossRef]
  26. Chang, S.; Hu, X.; Shi, D.; Ding, W.; Jiang, P. Characteristics of runoff and sediment, nitrogen and phosphorus losses under soil management measures in sloping farmland. J. Soil Water Conserv. 2016, 30, 34–40. [Google Scholar] [CrossRef]
  27. Fan, X.; Zhang, L.; Deng, L.; Wu, Y.; Qian, J. Effects of vegetation coverage and fertilization on total phosphorus loss on slope land with different slope length. J. Soil Water Conserv. 2017, 31, 30–35. [Google Scholar] [CrossRef]
  28. Wu, L.; Qiao, S.; Peng, M.; Ma, X. Coupling loss characteristics of runoff-sediment-adsorbed and dissolved nitrogen and phosphorus on bare loess slope. Environ. Sci. Pollut. Res. 2018, 25, 14018–14031. [Google Scholar] [CrossRef]
  29. Xiao, Y.; Tang, J.; Wang, M.; Zhai, L.; Zhang, X. Impacts of soil properties on phosphorus adsorption and fractions in purple soils. J. Mt. Sci. Engl. 2017, 14, 2420–2431. [Google Scholar] [CrossRef]
  30. Liu, R.; Wang, J.; Shi, J.; Chen, Y.; Sun, C.; Zhang, P.; Shen, Z. Runoff characteristics and nutrient loss mechanism from plain farmland under simulated rainfall conditions. Sci. Total Environ. 2014, 468, 1069–1077. [Google Scholar] [CrossRef]
  31. Wei, Y.; Wu, X.; Cai, C. Splash erosion of clay–sand mixtures and its relationship with soil physical properties: The effects of particle size distribution on soil structure. Catena 2015, 135, 254–262. [Google Scholar] [CrossRef]
  32. Yang, L.; Yang, G.; Li, H.; Yuan, S. Effects of rainfall intensities on sediment loss and phosphorus enrichment ratio from typical land use type in Taihu Basin, China. Environ. Sci. Pollut. Res. 2019, 26, 1–8. [Google Scholar] [CrossRef]
  33. Barré, P.; Durand, H.; Chenu, C.; Meunier, P.; Montagne, D.; Castel, G.; Billiou, D.; Soucémarianadin, L.; Cécillon, L. Geological control of soil organic carbon and nitrogen stocks at the landscape scale. Geoderma 2017, 285, 50–56. [Google Scholar] [CrossRef]
  34. Bao, S. Soil and Agricultural Chemistry Analysis; China Agricultural Press: Beijing, China, 2000. [Google Scholar]
  35. Su, J.; Wang, H.; Kimberley, M.O.; Beecroft, K.; Magesan, G.N.; Hu, C. Fractionation and mobility of phosphorus in a sandy forest soil amended with biosolids. Environ. Sci. Pollut. Res. 2007, 14, 529–535. [Google Scholar] [CrossRef]
  36. Sun, Z.; Lotz, T.; Chang, N. Assessing the long-term effects of land use changes on runoff patterns and food production in a large lake watershed with policy implications. J. Environ. Manag. 2017, 204, 92–101. [Google Scholar] [CrossRef]
  37. Tang, J.; Zhu, B.; Wang, T.; Cheng, X.; Gao, M.; Lin, H. Suboverland flow processes in sloping cropland of purple soil. J. Mt. Sci. Engl. 2012, 9, 1–9. [Google Scholar] [CrossRef]
  38. Calvo-Cases, A.; Boix-Fayos, C.; Imeson, A.C. Runoff generation, sediment movement and soil water behaviour on calcareous (limestone) slopes of some Mediterranean environments in southeast Spain. Geomorphology 2003, 50, 269–291. [Google Scholar] [CrossRef]
  39. Deng, L.; Zhang, L.; Fan, X.; Wu, Y.; Sun, T.; Fei, K. Characteristics of runoff and sediment yield under different rainfall intensities and slope gradients in erosive weathered granite area. Trans. Chin. Soc. Agric. Eng. 2018, 34, 143–150. [Google Scholar] [CrossRef]
  40. Ribolzi, O.; Patin, J.; Bresson, L.M.; Latsachack, K.O.; Mouche, E.; Sengtaheuanghoung, O.; Silvera, N.; Thiebaux, J.P.; Valentin, C. Impact of slope on soil surface features and infiltration on steep slopes in northern Laos. Geomorphology 2011, 127, 53–63. [Google Scholar] [CrossRef]
  41. Shan, Y.; Yang, L.; Yan, T.; Wang, J. The variation of P & N contents in paddy soil water and its environmental effect. Acta Ecol. Sin. 2005, 25, 115–121. [Google Scholar] [CrossRef]
  42. Li, F.; Zhang, G.; Xu, Y. Spatiotemporal variability of climate and streamflow in the Songhua River Basin, northeast China. J. Hydrol. 2014, 514, 53–64. [Google Scholar] [CrossRef]
  43. Kong, G.; Wang, Q.; Fan, J. Research on nutrient loss from loessial soil under different slope. J. Soil Water Conserv. 2007, 21, 14–18. [Google Scholar] [CrossRef]
  44. Sharpley, A.N.; McDowell, R.W.; Kleinman, P. Phosphorus loss from land to water: Integrating agricultural and environmental management. Plant Soil 2001, 237, 287–307. [Google Scholar] [CrossRef]
  45. Tan, C.; Zhang, T. Surface runoff and sub-surface drainage phosphorus losses under regular free drainage and controlled drainage with sub-irrigation systems in southern Ontario. Can. J. Soil Sci. 2011, 91, 349–359. [Google Scholar] [CrossRef]
  46. Du, E.; Jackson, C.R.; Klaus, J.; McDonnell, J.J.; Griffiths, N.A.; Williamson, M.F.; Greco, J.L.; Bitew, M. Interflow dynamics on a low relief forested hillslope: Lots of fill, little spill. J. Hydrol. 2016, 534, 648–658. [Google Scholar] [CrossRef] [Green Version]
  47. He, S.; Gong, Y.; Zheng, Z. Phosphorus loss through interflow from sloping cropland of purple soil region. J. Soil Water Conserv. 2014, 28, 20–24. [Google Scholar] [CrossRef]
  48. Hu, Z.; Gao, M.; Xie, D.; Wang, Z. Phosphorus loss from dry sloping lands of three gorges reservoir area, China. Pedosphere 2013, 23, 385–394. [Google Scholar] [CrossRef]
  49. Wang, Y.; Zhang, T.; Hu, Q.; O’Halloran, I.P.; Tan, C.; Reid, K. Temporal patterns of soil phosphorus release to runoff during a rainfall event as influenced by soil properties and its effects on estimating soil P losses. Can. J. Soil Sci. 2011, 91, 339–347. [Google Scholar] [CrossRef]
  50. Wang, G.; Wu, B.; Zhang, L.; Jiang, H.; Xu, Z. Role of soil erodibility in affecting available nitrogen and phosphorus losses under simulated rainfall. J. Hydrol. 2014, 514, 180–191. [Google Scholar] [CrossRef]
  51. Dupas, R.; Gascuel-Odoux, C.; Gilliet, N.; Grimaldi, C.; Gruau, G. Distinct export dynamics for dissolved and particulate phosphorus reveal independent transport mechanisms in an arable headwater catchment. Hydrol. Process. 2015, 29, 3162–3178. [Google Scholar] [CrossRef]
  52. Doody, D.; Moles, R.; Tunney, H.; Kurz, I.; Bourke, D.; Daly, K.; O’Regan, B. Impact of flow path length and flow rate on phosphorus loss in simulated overland flow from a humic gleysol grassland soil. Sci. Total Environ. 2006, 372, 247–255. [Google Scholar] [CrossRef]
  53. Wang, C.; Zhao, P.; Gao, M. Characteristics of nitrogen and phosphorus transportation through runoff in a typical ecological-hydrological unit of hilly area of purple soil. J. Hydraul. Eng. 2013, 44, 748–755. [Google Scholar]
  54. Sharpley, A.N.; Robinson, J.S.; Smith, S.J. Bioavailable phosphorus dynamics in agricultural soils and effects on water-quality. Geoderma 1995, 67, 1–15. [Google Scholar] [CrossRef]
  55. Allaire, S.E.; Van-Bochove, E.; Denault, J.; Dadfar, H.; Theriault, G.; Charles, A.; De-Jong, R. Preferential pathways of phosphorus movement from agricultural land to water bodies in the Canadian Great Lakes basin: A predictive tool. Can. J. Soil Sci. 2011, 91, 361–374. [Google Scholar] [CrossRef]
  56. Simard, R.R.; Beauchemin, S.; Haygarth, P.M. Potential for preferential pathways of phosphorus transport. J. Environ. Qual. 2000, 29, 97–105. [Google Scholar] [CrossRef]
  57. Uusitalo, R.; Turtola, E.; Kauppila, T.; Lilja, T. Particulate phosphorus and sediment in surface runoff and drainflow from clayey soils. J. Environ. Qual. 2001, 30, 589–595. [Google Scholar] [CrossRef]
  58. Zhang, T.; Tan, C.; Zheng, Z.; Drury, C.F. Tile drainage phosphorus loss with Long-Term consistent cropping systems and fertilization. J. Environ. Qual. 2015, 44, 503–511. [Google Scholar] [CrossRef]
  59. Shore, M.; Jordan, P.; Mellander, P.E.; Kelly-Quinn, M.; Wall, D.P.; Murphy, P.N.C.; Melland, A.R. Evaluating the critical source area concept of phosphorus loss from soils to water-bodies in agricultural catchments. Sci. Total Environ. 2014, 490, 405–415. [Google Scholar] [CrossRef]
Figure 1. Location of the soil sampling sites (a) and detail of the artificial rainfall simulating system, including an artificial rainfall simulator (b) with its controlling device and runoff plots (c).
Sustainability 11 04644 g001
Figure 2. The experimental design. TP = total phosphorus, DP = dissolved phosphorus, PP = particulate phosphorus.
Sustainability 11 04644 g002
Figure 3. Variations of overland flow and interflow rates with time of runoff on slopes with different angles and under different rainfall intensities.
Sustainability 11 04644 g003
Figure 4. TP loss by overland flow with time of runoff on slopes with different angles and under different rainfall intensities of (a) 1.5 mm/min, (b) 2.0 mm/min and (c) 2.5 mm/min.
Sustainability 11 04644 g004aSustainability 11 04644 g004b
Figure 5. TP loss by interflow with time of runoff on slopes with different angles and under different rainfall intensities of (a) 1.5 mm/min, (b) 2.0 mm/min and (c) 2.5 mm/min.
Sustainability 11 04644 g005aSustainability 11 04644 g005b
Figure 6. DP and PP concentrations in (a) overland flow and (b) interflow under different experimental conditions.
Sustainability 11 04644 g006
Figure 7. Percentages of (a) runoff yield, (b) TP load, (c) DP load and (d) PP load.
Sustainability 11 04644 g007
Table 1. Correlations between rainfall intensity, slope angle, runoff yield, TP load, DP load and PP load.
LTPLDPLPPQIS
LTP10.913 **0.989 **0.765 **0.800 **0.069
LDP0.894 **10.844 **0.845 **0.775 **0.031
LPP0.734 **0.35310.704 *0.775 **0.080
Q0.4100.3740.2910.844 **−0.320
I0.905 **0.927 **0.4860.25110
S0.0800.0930.0260.909 **01
Notes: gray corresponds to overland flow and white to interflow. LTP represents TP load, LDP is DP load, LPP is PP load, Q is runoff yield, I is rainfall intensity, S is slope angle. * means that the correlation was significant at a confidence level of 0.05, N = 12; ** means that the correlation was significant at a confidence level of 0.01, N = 12.

