1. Introduction
Pricing is one of the most important parts of a company’s marketing mix, as part of the marketing strategy. Pricing could be an authentic price, a lowered price showing discount, or the price which the commodity is sold at. A study of the literature reveals the effect of the varieties of prices on the behavior of the Indian customer [
1]. This effect, and its extent, are of paramount importance to marketers and customers alike. The common practice in India is to increase the selling price and then offer a discount on the product. This article is based on malls in tier 2 and tier 3 cities and e-commerce portals in India to collect the data on discounts on offer. The data are on the sales of discount-offered goods and the effect on purchase decision taken by the customers in the malls. All the sellers practice discounts in some form or other. The justifications are varied for each one, some for managing their sales targets, some for inventory purposes to smoothen demand fluctuations, and the rest try to differentiate between customers’ purchasing power. Lack of complete data on the part of the customers makes this dubious discount possible. This research is aimed at the influence of discounts on an ill-informed customer and his unfounded choices. This leads to marketers increasing the marked price to an imaginary high and then slashing the prices to induce customer purchase; 78% of the products surveyed in the malls across two cities in India had practiced this dubious and unsustainable pricing method [
2].
The middle class, which is the primary target market of these marketers, does not get into the hassles of lawsuits in India, which is the primary encouraging factor behind this game of virtual discounts. Consumers possibly have the impression that low-priced products and discount stores can meet their status needs [
3]. In developed countries, over a quarter of the lawsuits on advertisers are related to dubious discounts [
4]. There has been a sudden drop in the number of cases across developed countries from 1982, the reason being the inability of the period between 1970 and 1980. The lawmakers were differentiating an actual discount from a duplicate one. There is a strong relation between the US consumer market of the period 1970–1980 and the current Indian market of recent years 2017–2018 in terms of growing middleclass [
2]. However, in India, a middleclass buyer wants an easy and comfortable shopping experience and life, and does not want to follow the cumbersome legal path, which the marketers exploit.
Marketing strategies are aimed at generating a high number of sales and, thus, revenues, while the effort to entice buyers is—most of the time—made up of many claims whose truth is often hard to establish [
5]. Misleading commercial practices also include claiming to offer a competition or prize promotion without awarding the prizes described, or a reasonable equivalent such as: Discounts, price reductions, commercial lotteries, vouchers, and competitions [
6]. The firms involved in fake discounts take advantage of the absence of strong law in India to make their profits. However, consumers who perceive price unfairness may spread negative word-of-mouth information, in addition to resisting purchases, and therefore negatively affect the sustainable long-term profits of suppliers [
7]. On the other hand, the outcomes of such fake discounts are impossible to accurately identify [
8]. In order to provide a clear framework on the concept, [
9] define a sales promotion as “an action-focused marketing event whose purpose is to have a direct impact on the behavior of the firm’s customer.” Moreover, empirical research studies have revealed that consumers prefer extra free products to discounts because of mental accounting, and the way that these different types of promotions are framed [
10]. Some research studies suggest that the most important elements of a retailer promotion are price discounts, the medium in which price discounts are offered, communications of sales promotions, and objectives of the promotion [
11]. Other researchers have demonstrated that when consumers view regular and sale prices with identical left digits, they may attribute greater value and increased purchase likelihood to higher-priced, lower-discounted items [
12]. Some researchers suggest that as long as people have sufficient motivation and cognitive capacity, they can adequately adjust for invalid social comparison information [
13]. Service providers may believe that they will profit in the short run from unsatisfactory service, but misleading practices, however, can hurt long-term profits if customer defections increase as a result [
14].
A survey of the literature on the US market reveals lawsuits against well-known firms like Carters Inc. in 2010 and QVC in 2008 that went in favor of the corporates, due the inability of the consumer to prove financial harm beyond doubt. However, the cases against firms in India have been more on harmful contents of the products and not on its pricing. The customer’s reaction on discounts and their effect on sales has been identified in this article. The data were collected from popular malls and e-commerce portals across India in this article. Popular malls are those with the highest number of footfalls, and popular e-commerce portals are the ones with the highest volume of sales. The combination of online and offline sellers’ pricing gives us a window to study the business of dubious discounting. List prices and the discounted prices were collected from various sellers. Both actual and fake discounts were studied during the research in market, as all of the previous literature surveyed was conducted in artificial settings using survey method. An artificially-increased marked price is a fake discount, but an actual drop in selling price without changes made to inflate the marked price is a real discount [
2]. Some experimental research has stated that a fixed price format elicits more positively valenced thoughts and stronger positive affect than a discounted price format [
15]. The customers ’buying behavior could be accurately researched in the actual market place, rather than in surveys and samples. Nevertheless, the concept of the revenue-maximizing, or even the revenue-hungry, state is unlikely to be a very useful starting point [
16]. The prices considered in this article are actual prices of the products, and real time impact of discounts on multiple products can be studied, but not just a few products based on our convenience. The miserliness of the Indian middleclass was researched through the discrete choice model to identify the impact of discounts on buying behavior. The impact was due to differences in marked price across similar products. The identification of the discounts, along with the prices across similar groups of products, negates the need for variables to control for situations where explanatory variable is correlated with error term.
Previous empirical studies have discovered that discount is perceived by the consumers as the most effective sales promotion technique, followed by product display and buy one get one free [
17]. Some research studies have suggested that when consumers interact with an advertised sale price above the lowest expected price, then the exaggerated reference price increases the percentage of consumers who purchase the product from the advertiser without checking other stores’ prices [
18]. Price reduction as a sales promotional technique is used by brands, and is used as policy by giant-sized retailers. This generates behavioral responses such as purchase acceleration, stockpiling, and spending more. This is because discounts cause a certain consumer behavior based on store visits, purchase, and earlier purchase [
19]. Extremely high discounts and consistent sales may lead consumers to believe that the transaction utility gained is fake [
20]. Other research studies have revealed that consumers contemplating small purchases are discouraged by the presence of extreme quantity discounts for large purchases [
21]. A previous empirical discovery having a more analytical perspective suggested that price discounts resulted in greater impulse buying intention than did bonus packs when the product was hedonic, and bonus packs were a more effective sales promotion than price discounts when the product was utilitarian [
22].Some evidence suggests that a price discount on a bundle is only effective/necessary when the purchase situation motivates and enables consumers to engage in piecemeal processing of item price information [
23].The main problem here is that dubious discounts drive actual sales in Indian markets.
But is this a sustainable initiative, considering its impact on customers’ buying behavior? Or does it generate irreversible consequences or environmental damages? However, who is the real beneficiary of trapping fake discounts as drivers of real revenues? Sustainability is a concept that has gained increasing popularity among consumers around the world. Basically, sustainability can be defined as a state of affairs where the sum of natural and man-made resources remains at least constant for the foreseeable future, in order that the well-being of future generations does not decline [
24]. The concept of sustainable development, also known as sustainability, has been defined by the Brundtland Commission “Our Common Future” in 1987 as “a development that meets the needs of the present without compromising the ability of future generations to meet their own needs” [
25].An empirical research has shown that one economy with a higher societal discount rate might be more strongly characterized as a “throw-away society” than a similar economy with lower societal consumption discount rates [
26].Basically, economic sustainability includes the ability of an economy to support a certain level of economic output for an indefinite period of time. Moreover, for how long can India support these deceptive marketing practices, considering that it is an emerging economy with explosive population growth and high poverty issues?
In the literature, a broad debate continues on the implications of marketing strategies for sustainable economic development. Economic sustainability represents the capacity of an economy to support a certain level of economic production (output) and long-term economic growth, without affecting the environmental, social, or cultural factors, for an indefinite period of time. On the other hand, there are opinions in the literature that expectations of win–win sustainable growth through technological and efficiency improvements have not been fulfilled, thus generating the need for an optimal alternative, respectively the new concept of sustainable degrowth. This concept represents an equitable downscaling of production and consumption, that increases human wellbeing and enhances ecological conditions at the local and global level, in the short- and long-term [
27].
The research gap identified and addressed in this paper is the degree of effect of discounts on the customer, as previous research is on the effects of the discount, but none have addressed to what extent it affects customer decision-making and harms them in the Indian market.
The study is limited to the purchases recorded in tier 2 and 3 cities in India, and was conducted over 250 days only. The malls were selected based on convenience sampling.
The main objectives of the study are:
- (1)
To identify the degree of effect of discounts on customer decision-making.
- (2)
To identify how marked price is used as an indicator of quality.
The Indian customer associates the marked price with quality. This is the reason why dubious discounts are offered in the Indian market to increase sales. Is there a relation between the marked price and buying behavior? What if the customer is aware of the actual marked price? Do Indian customers use marked price as an indicator of quality? The aim of this article is to find answers to all of these questions.
The remainder of the research paper is organized as follows: In the
Section 1, an introduction and other relevant aspects of the research topic are included.
Section 2 presents a literature review.
Section 3 includes the research methodology, and
Section 4 includes the empirical analysis. The empirical results are presented in
Section 5. Finally, we present a conclusion section, and the references come at the end of the research paper.
2. Literature Review
This study is associated with literature on pricing and retail across the globe. Objective pricing and its relation to quality in the minds of customers form the foundation of this article. This article focuses on fake discount; it reads into the impact of discounts on buying behavior. The outcomes point towards the regulations of dubious discounts and tricking of the customers. The literature review gives us a lot of study done on how buying behavior is related to price and its relation to product quality. On the other hand, aware consumers could be more likely to purchase deals on less-preferred brands compared with unaware consumers because of high discounts [
28]. Although offering a high-price discount can increase consumers’ perceptions of savings, it also has a negative effect on consumers’ perceptions of product quality [
29]. The bias that the higher the price, the higher the quality still influences the mentality of consumers in India. Moreover, fake discount is sometimes related to the piracy, imitation, counterfeiting, and forgery of famous brands. However, the lower cost is the most frequently cited motivation for buying brand counterfeit products [
30]. Despite increasing efforts to improve mechanisms for the international enforcement of intellectual property rights, neither companies nor governments in industrialized countries appear able to curb the increasing supply and demand for counterfeits [
31]. However, brand knowledge may act as a shield against credibility issues [
32]. For the purpose of our empirical research study, dubious discounts have been defined as “no decrease from previous selling price, but a difference in the present selling price and fake introductory price” [
2].
In the literature, a number of relevant aspects of consumer behavior have been discussed in the context of price discounts. Some researchers have argued that decrease in sales adversely affects low-priced and low-quality products [
33]. Certain researchers have suggested that allowing the price discount to be increasing in the number of units increases willingness to pay sales value and retailers’ revenue, and that a price discount that is uniformly distributed across units also has the potential to motivate consumers to buy more units of the product [
34]. Other researchers have suggested that when price information is communicated using misleading practices, consumers develop lower levels of trustworthiness toward the source of information, as well as willingness to buy [
35].A business-to-consumer commercial practice of misleading the average consumer is a very common phenomenon in India. Meanwhile policy makers should continue to assign significant time and resources to investigating concerns about misleading price comparison-based promotions [
36]. Unfortunately, deceptiveness is a vague legal concept, including very different commercial practices [
37]. However, including the individual characteristics of potential consumers has an influence on the buying process.
Understanding how people make online purchasing decisions is of growing importance [
38]. The emergence and ever-increasing use of online commerce has triggered new behavioral dimensions and consumer possibilities to compare products or services, as their new status of online consumers are endless [
39]. Unfortunately, the huge investment to grasp virtual consumers has induced online sellers to go no further towards the understanding of consumer behavior [
40]. For instance, some researchers have concluded that although online shopping has provided a new international landscape to conduct business, the use of this medium and the absence of face-to-face interactions has presented the law with numerous challenges in terms of the scope of consumer protection [
41].Some researchers investigated the impact of factors affecting consumers’ trust in online product reviews and suggest that both argument quality and perceived similarity contribute to increased trust, but in varying degrees [
42]. Moreover, in the case of payments that are automatically processed, such as online cashback, a benefit of separating a discount payment from the purchase event may arise out of positive spillover effects on future purchases rather than from imperfect redemption behavior [
43].
Previous studies have revealed that the profit derived out of the relations between price and quality is based on the proportions of educated and uneducated customers [
44]. The article is not based on informed customers or prices alone, as it finds a relationship between high price and its impact as an advertisement in itself [
45,
46]. On the other hand, dubious discounts do not increase the costs to the company like other variables [
47]. The articles provide information on the nexus between price, quality, and value of it towards dubious discounts [
48]. The forged price provides a fake discount, one which does not give any value but changes the impression of the customer. Discounts cloud the consumer’s mind [
18]. Customers use non-price characteristics of the products more [
49,
50] and take undue advantage of customers looking for value in pricing [
51]. The impact of this has been researched on both dubious discounts and real ones, and this article identifies the popular yet unknown areas where offers of discount have actual and dubious parts. Attempts to inspect the effect of reduction in prices has resulted in ideas of reference vulnerability [
52,
53]. Such articles have noted multiple-mentioned situations that marketers rely on, such as marked prices that are advertised [
54], other retailers’ prices [
55], outlet proposals [
56], and dubious offers [
57]. There is a recognizable range within which the discounts are effective [
58]. There is an explanation based on the theory of allusion, supporting lost offer cost [
47].
Pricing policy with multiple impacts on buying behavior is due to culture, despite the absence of foundation in established theory, like endings of pricing [
53]. Consumers are continuously changing their attitudes, behavior, and approaches in domains of consumption, but price sensitivity is high regardless of their choice preference [
59]. Consumers create a balance between expected costs and benefits, such as convenience, aesthetics, and price—but in today’s market, the price point is such a powerful influence that environmental friendliness is something consumers may not consider when purchasing a product [
60]. This article, however, uses customer knowledge on actual pricing. Articles have been written on the impact of dubious discounts and price comparisons on the welfare of customers [
61]. The important point here is whether dubious discounts cheat, and if they do, how they adversely impact the customers [
62,
63]. This article tries to measure the impact of these dubious discounts on Indian customers.
The arguments to identify the effects of price drops have impacted the notions of dependence on reference [
52]. The incomes from use of price to signal quality are highly dependent on informed and uniformed customers [
44,
51]. Research closely relates pricing as a silent salesman or advertisement [
45,
46]. The aspect of relation between prices, perceived quality, and the value it gives to dubious discounts are studied [
48]. Numerous literatures exist on the effect of price reductions on behavior of consumers, beyond signaling quality [
64]. Consumers do not search after getting discounts as they use non-price benefits [
49,
50] and discounted products as useful [
51]. Research on dubious discounts and prices are related to consumer welfare [
61]. The question is if fake discounts deceive the consumers and damage them [
63,
65].
3. Research Methodology
This study is based on the primary data that has been collected based on questionnaire, interview, and observational methods. The questionnaire was based on the impact of discounts on the buying behavior of the respondents. The interview was designed to identify the perceived quality of the product in the minds of the respondents. The observation technique was used to identify the purchase of the product by the respondent. The samples were selected after they were observed purchasing the discounted product under the study, and interviewed after the purchase at the billing counter. The selection of the sample was intentional, based on the purchases done by the respondents. The measurement error is mean ±3. Positivism is used as a research philosophy where the hypothesis is tested and the result is confirmed. An inductive research approach is used to form a new understanding of the topic. Both quantitative and qualitative data were analyzed. Cross-sectional study was conducted to record all the data. Purposive sampling was employed to select the respondents, and a closed questionnaire was employed to collect the required data.
Data were collected from selected major e-commerce portals in India, and from popular Brick and Motor outlets of tier 2 and tier 3 cities in India. The malls were selected based on convenience sampling. The top five e-commerce portal were selected due to high volume of sales in India. The selected e-commerce portals were Amazon, Flipkart, Snapdeal, Myntra, and Jabong. According to Morgan Stanley, the Indian e-commerce market is worth
$119 billion and the market share leader is Flipkart with 37%, followed by Amazon with 21–24%, Snapdeal 15%, Myntra 12%, and Jabong 7% market share. However, this article focuses on respective market leaders in the categories. There are both real and fake discounts provided by the marketers here.
Table 1 gives 11 types of products sold by multiple firms and their types. The firms here fix fake discounts by increasing the list prices.
The customers were interviewed after the check out and bill payment at the counter, after observation of the purchase in the specified category where discounts were available. Customers were also questioned during the interview, after the purchase, on how they perceived the quality of the product. The interview method was selected as it was the most accurate method to capture the customers’ feelings, perceptions, and opinions. It has high response rate among the Indian middle class, and allowed us detailed questioning of the respondents. Finally, customers were questioned during the interview, after the purchase, on how they perceive the quality of the product bought and what factors prompted the purchase.
The products that were considered for the research were the following: Footwear, mobiles, electronic devices, Wi-Fi devices, groceries, clothing, food and beverages, home and living products, watches, cosmetics, and bags. These are the broad categories into which all the products in Indian retail is divided into. All the products considered were from popular malls of Mangalore, Mysore, and Bangalore in India. The selected malls were the following: Forum and City Centre in Mangalore, Mantri, Phoenix in Bangalore, Forum and Mall of Mysore in Mysore, and the five popular e-commerce portals mentioned above. The databases on the above analysis cover a period of 250 days. The marked price, along with discounts, of the above products were noted. On the customer’s side, the bill, date was noted respectively.
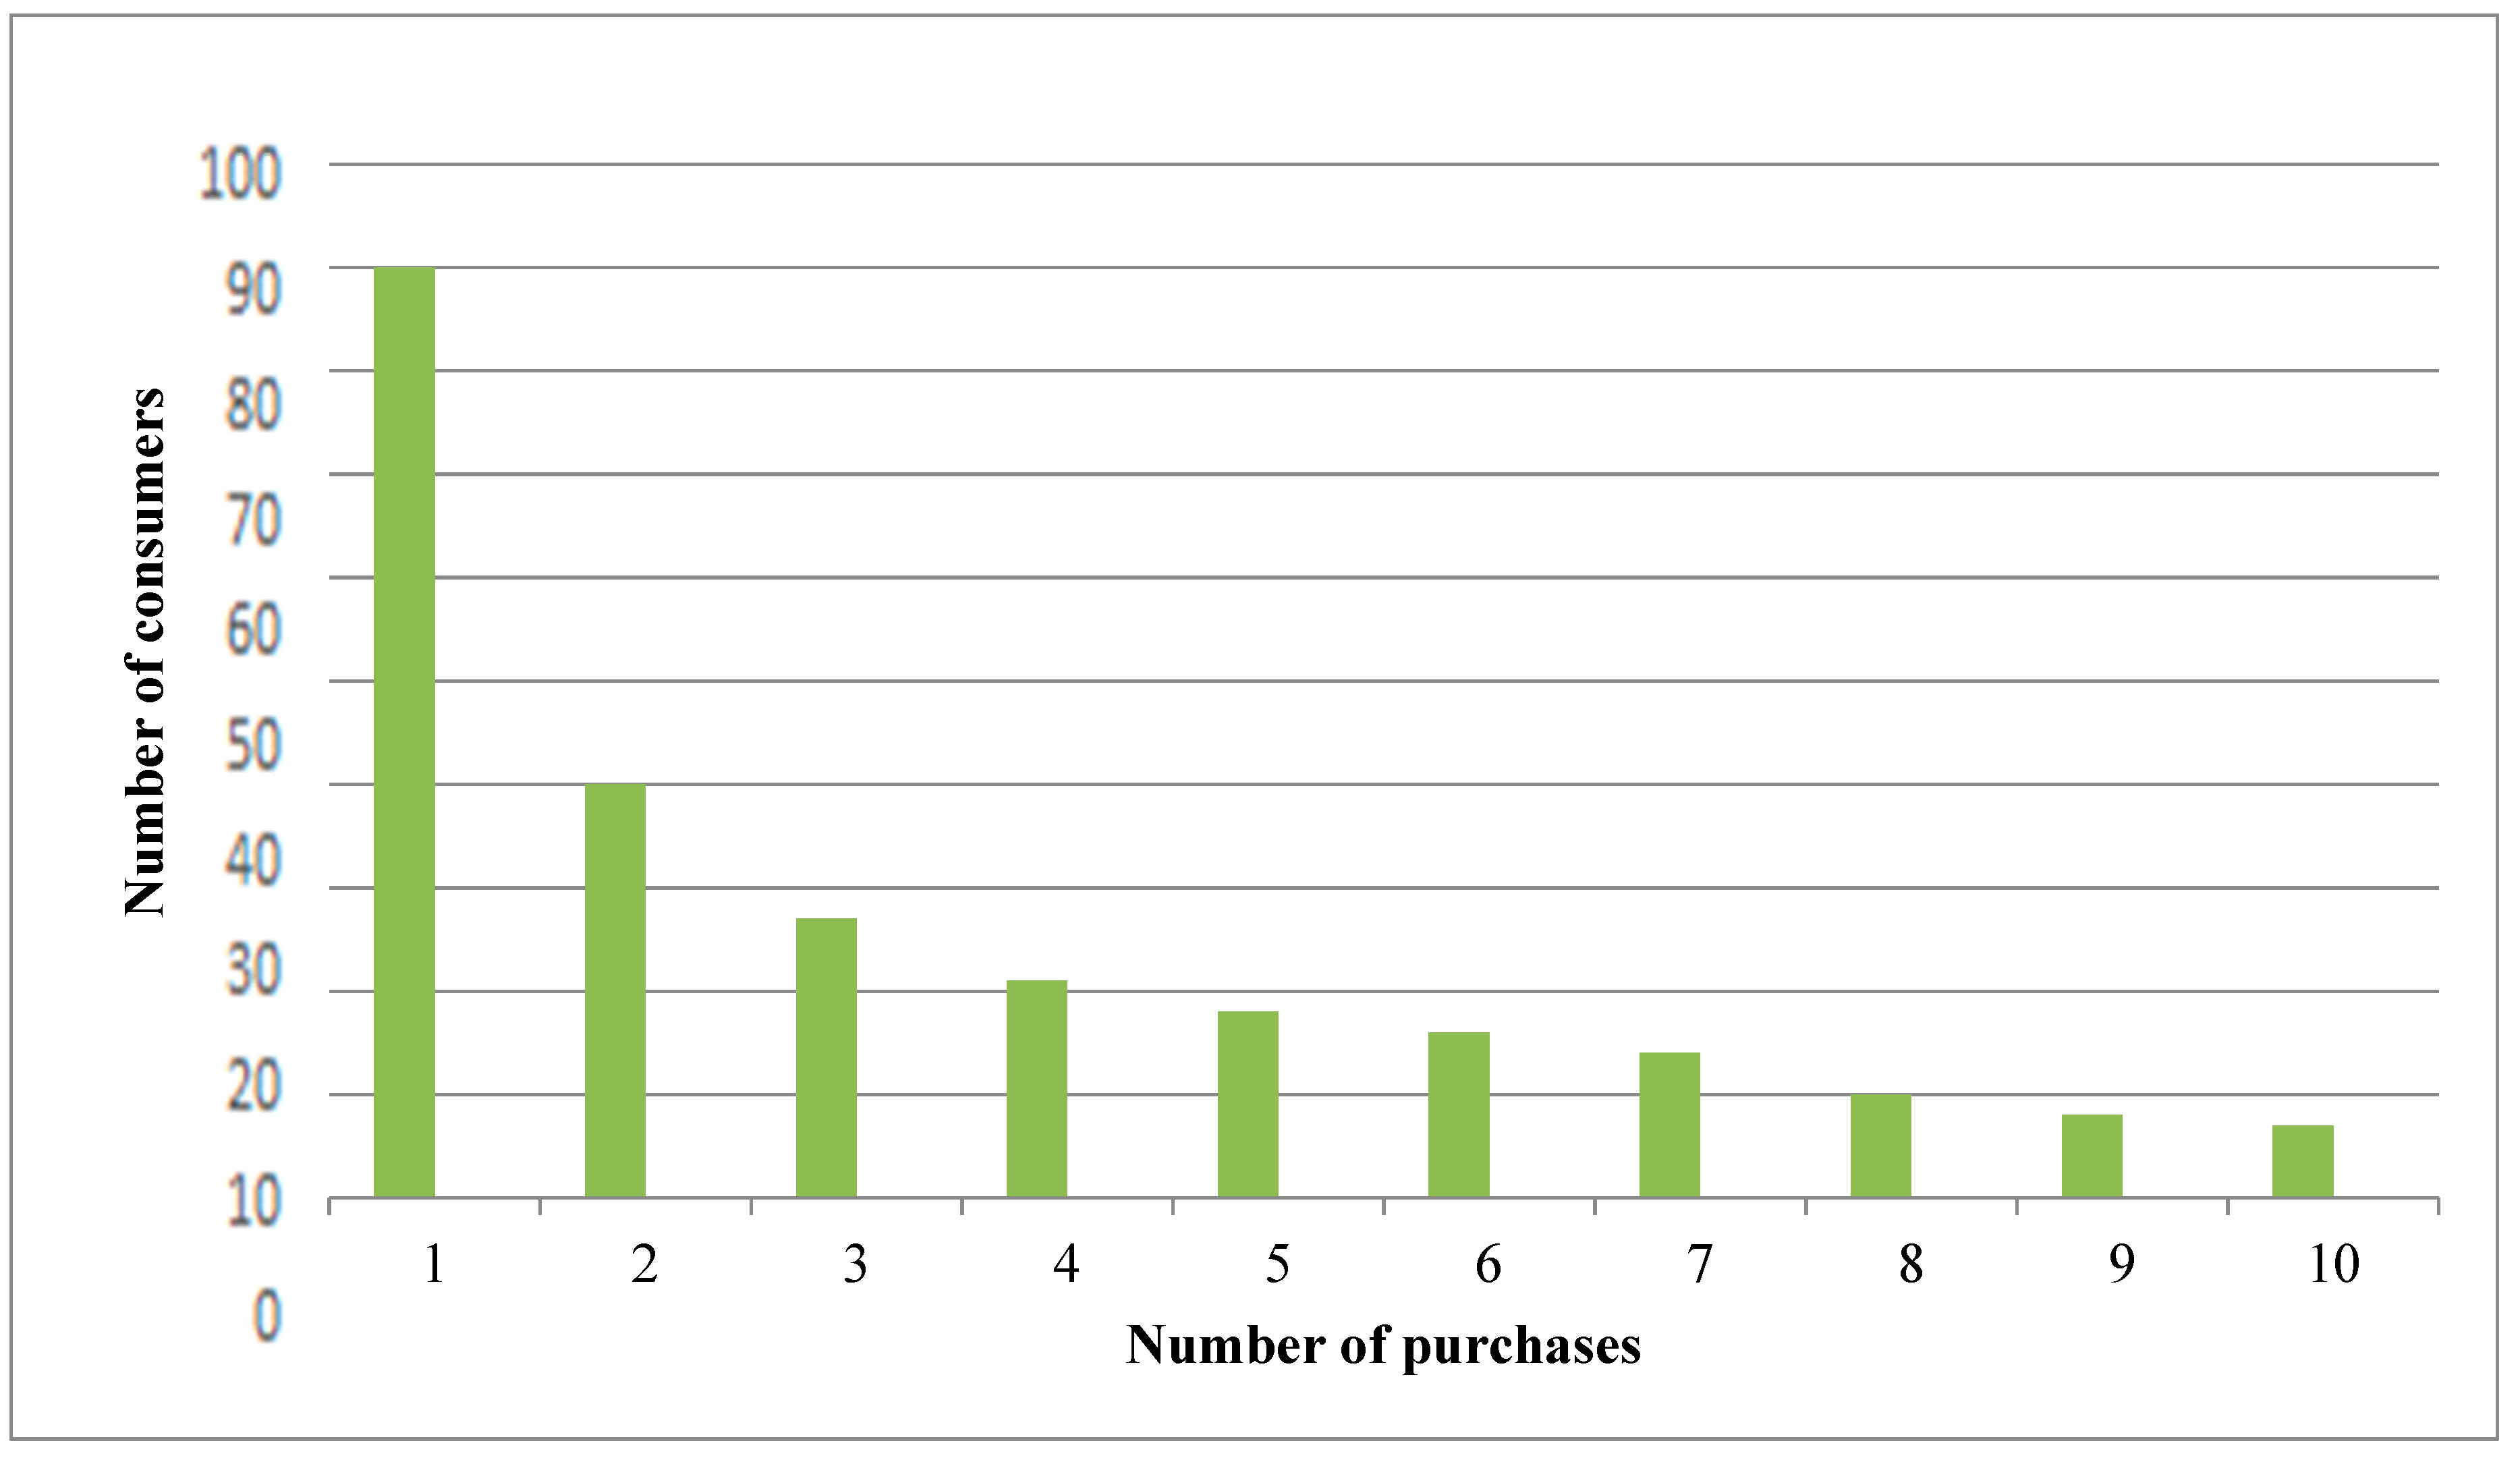
The type of research was empirical in nature and the type of sampling used for selection of respondents was purposive sampling. A total of 14,90,170 customers were observed during the process of the study. Practically, 14, 90, 170 is the number of footfalls in the selected malls over the course of the study in the selected categories. This is the total footfalls of all six malls selected for the study. Repeat purchase was also noted, and was been found to be a considerable number as shown in
Figure 1. In online stores, 31% of sales was through return customers.
The study was conducted based on observation of respondents offline and by checking the number of goods sold online. The study was conducted over 250 working days in 2018. The researchers observed one category out of 11 on every day, for 6 h a day. The sample size was 750 based on the purposive sampling method. The sample size was calculated based on the population size of customers of these Brick and Mortar stores and e-commerce portals. Confidence level was 99% and standard error was set at 5. The customers were interviewed after the check out and bill payment at the counter, after observation of the purchase in the specified category where discounts were available. SPSS econometric software was used for data analysis and multiple regression analysis was conducted in order to analyze the data. The independent variable was “discount” and the dependent variable was “sales”.
Data Analysis
There are multiple variants of the same merchandise from the same producer. Each type differs by its marked price. The marked cost is given when the product is initially given to market and it remains unchanged. Also, the price variations among the similar products differing in style may be because of some colors’ deep connection with the Indian culture. Over 4000 styles of various merchandise were observed.
Prices across online and offline stores in marked price with and without discounts are shown below in
Table 2. The high-quality products are expensive when compared to lower quality products in both kinds of stores. There is a difference in marked prices, and online store on regular basis carry higher marked prices than offline stores. The same sellers’ prices across online and offline stores are measured.
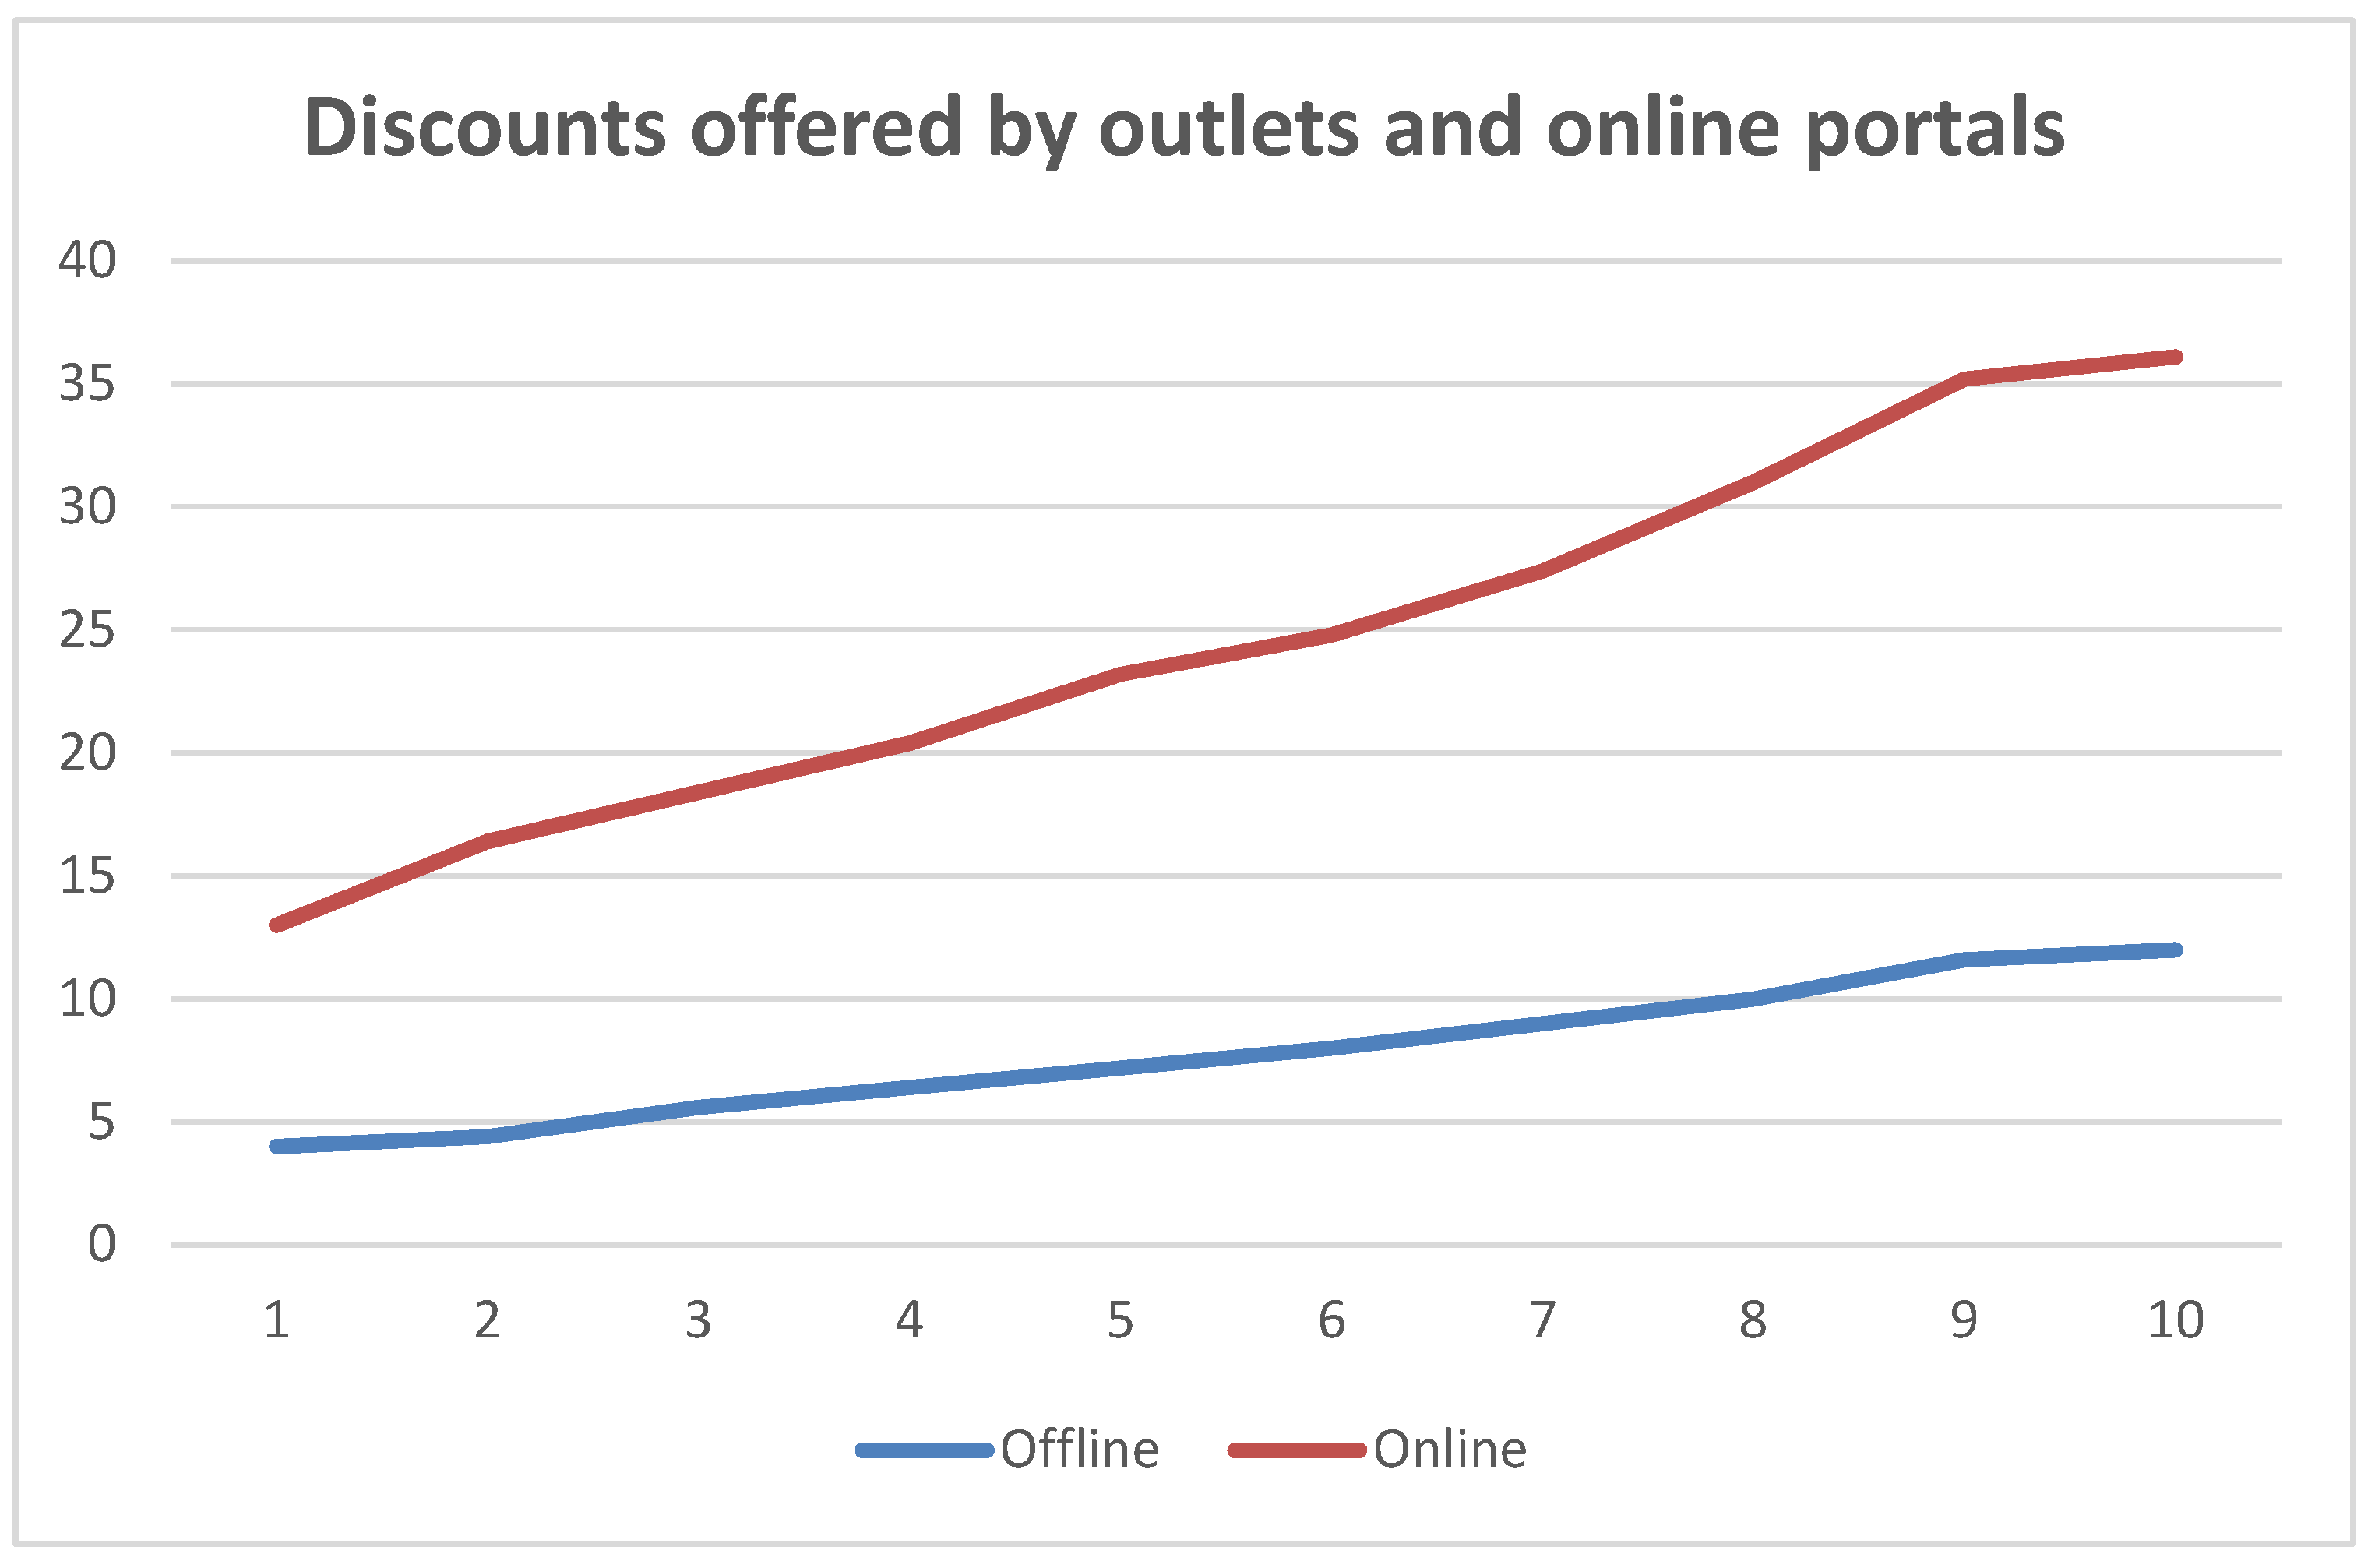
Differences in pricing in online and offline are there, and occasionally offline store prices are more competitive than the online stores. The revenue is obtained by multiplying the number of goods sold to selling price, and multiplying the amount thus obtained by the discount percentage on offer. The amount thus obtained is converted into percent to obtain the revenue percentage to the company.
Figure 2 shows the discounts offered by online and offline outlets during the study. The products sold offline are sold mostly at full prices, whereas lower quality high discount products are sold online. Most of the firms give discounts across all forms, irrespective of sales in that category.
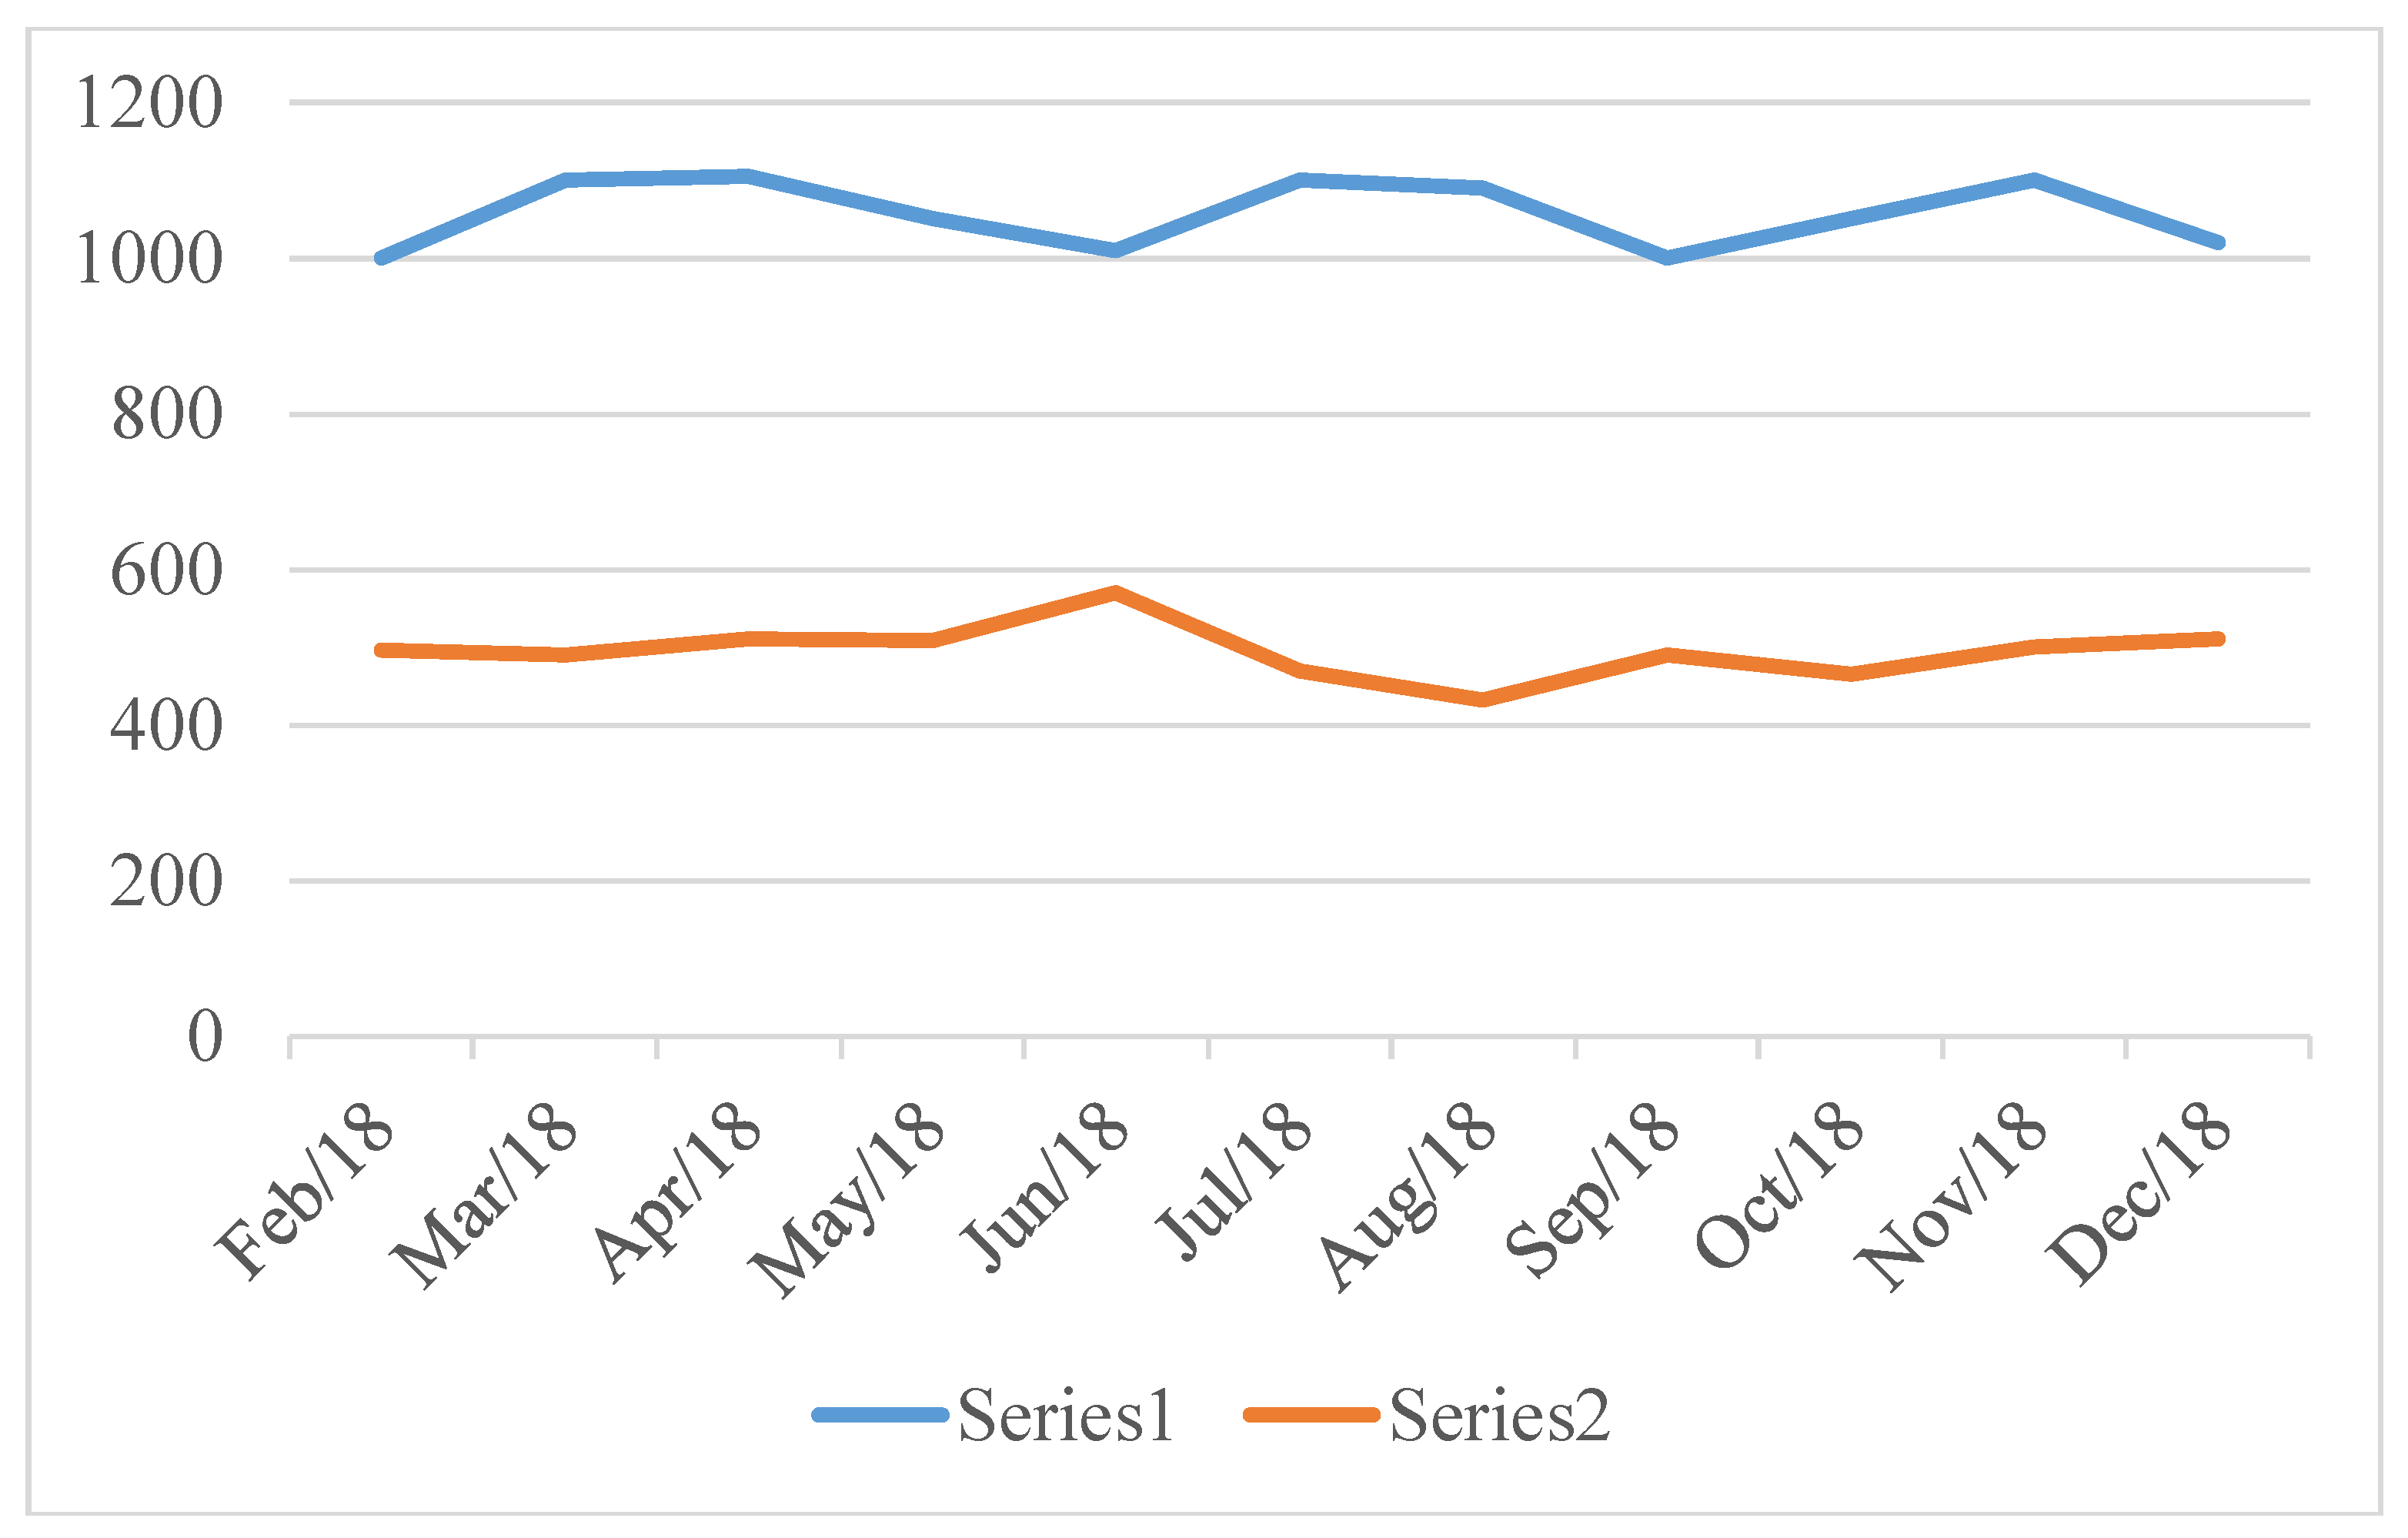
The discounts, however, vary across store type and time, and are based on product features. Discounts might be different at different stores and time periods. The discounting is strongly related to the products’ newness in the market. The marked price and the discounted price are shown in
Figure 3. Series1 shows average market price and Series2 shows the price after discount.
The horizontal line shows the marked price of all products under observation. All sales over the life of a product is plotted, and none were sold at marked price. Over 89% of the goods were sold by the end of discounted period online. This Figure 89% was obtained by consolidating the data provided by all the outlets at the end of the discount period of sales of goods on discount. Customer attaches maximum worth to the newness of a product and remaining were to clear stocks.
4. Demand Management Process
The discrete choice model of miserly Indian middleclass has been presented here, and its parameters are given with respect to the data set. Measuring whether dubious discounts impact buying behavior, keeping all other features the same, is the objective of this section. The primary focus is comparison of original prices with dubious ones. The outcome shows that dubious discounts indeed have a high impact on purchases, and this mostly affects the ill-informed Indian customers.
The discrete choice model is used to explain the role of discrete options, such as buying or not buying. This model is chosen to empirically test the choices of customers among a finite set of alternatives. Logistic regression is used for empirical analysis of discrete choice. The factors are: Discount, which is used by companies to quickly draw prospects into the online and offline stores.; dubious discounts, which artificially increase the marked price to give a sense of discount which is not real; store attributes, both online and offline, which practice both the form of discounts i.e., real or dubious; and consumer behavior, which guides us on how customers select the products.
The actual discounts help us identify the real benefit to the customer and the resulting changes in the sales graph. The dubious discounts give us the perceived benefit to the customer and the result of this marketing gimmick on the changes in the sales graph. The store attributes are also a factor which plays an important role in store selection. Consumer behavior give us insight into how customers purchase decisions vary across various prices and discounts.
4.1. Prototype
Item p, in shops, time period t given by attributes X pt, quality which cannot be defined Ep, marked price MPp, and selling price Ppst. The marked price may be:
MPp= max s, t Ppst which is the real price and dubious one being MPp> max s, t Ppst.
The difference between marked price and selling price is due to dubious and real discounts.
The outcome of a customer c, after buying product p, store s and time period t is given by the following equation:
where
α,
β,
γst
f, γst
r are the taste parameters of Indian customers, and
D refers to changes in demand.
The parameter varies across outlets to allow differences among Indian consumers, culturally and demographically. This is same as the earlier parameters that marked prices are shown as pointers of demand.
If
D is considered to be iid Type-1 high point and changing the system of outcomes of share of market, mean utilities can be given as dpst:
where s pst is market share, and s 0st is the share of outside good. When the customer visits an outlet but does not make a purchase, it is regarded as a purchase from outside. To enable us to identify this, a given time’s footfall is measured, which helps estimate outside purchases.
4.2. Identification
The estimates of demand could be identified by the difference between discounted price and marked price. When the store is chosen by the customer and the same store has dubious discounts, then this increases the sales estimates. The best situation to examine the pricing effect on purchase decision is where marked cost is given without method to items, or where marked costs differ across stores over a period, based on the prediction that marked price is not related to products which cannot be observed. These kinds of predictions are misleading. For this to be wrong, the product desirability should not be a controllable factor, and the marketer can estimate desirability of various products and set prices accordingly. The first condition might be right, but the second requirement is not when demand is uncertain. Differences in marked prices across categories are presented in
Table 3 as follows:
The sign ₹ represents the Indian rupee currency symbol and INR is the International Organization for Standardization currency code. Products sold online are subject to more dubious discounts than offline ones. Moreover,
Table 3 gives variation of four randomly selected products in a price range over online and offline stores. Online products which have fake discounts and corresponding data were used in the analysis. Thus, online gives methods as to how to control the choice in which products are provided dubious offers, and the coefficient of this gives us fluctuation in demand that exists in both offline and online stores.
The merchandise with low sales is provided with bigger discounts those are fake. However, not all firms allow discounting based on the amount of sales of a given piece of merchandise. It is hard to point out the availability of a relationship among sales and marked prices of products, as prices could be affected by a mix of varied features not specific to the products. To obtain impact of relationship, the difference between products from the same firm sold online and off line needs to be established. To establish differences among online and offline prices of a product from the same firm, this research uses regression in relation to both. The outcomes of this are given in
Table 4. Every outcome recorded is for only one product. The outcomes in the first column give us the average price of product online being less than offline by ₹53. The second column shows that online and offline products from the same seller are not significantly different.
The next three columns contain the outcomes of respective prices after discount on an average basis. Online products are sold at ₹ 1451.3 under the the market price. The difference is considerable in prices after discount between low- and high-quality products of the same firm; this difference is at Rs ₹ 60. The time gap in clear every product was sold, there exists no difference in strategies of online and offline goods. Which points that revenue and appeal of products in identification of demand in efficient can control for selection of discounts between online and offline products.
4.3. Estimation and Results
The demand parameter is identified by regressing mean utility levels as shown in the Equation (3) on observables. The Indian market is shown here on outlet week. In every outlet week, the footfall number is the size of the market. The characteristics of the product Xpt consist of newness of the product and viability in the corresponding categories. The fixed effect of the outlet type and outlet week are also reported. Descriptive statistics of variables in the sample that is estimated is given in the
Table 5, as follows:
Table 6 consists of the outcomes of demand estimation, and the regression estimates of mean utility are shown in the first column The variables that are exploratory are type of outlet and time period. Probability of purchase strongly correlates with both type of outlets, i.e., online or offline. The variable correlated to the price at which product is sold and age of the product. The following
Table 6 presents the estimation of demand:
Table 6 gives the interaction between actual and dubious discounts. This is used to control the effect of decrease of prices in actual and dubious discounts on buying behavior. The outcome is that actual discount has a bigger effect on online products than offline products, and dubious discounts impact buying behavior more than actual discounts.
Table 6 has results from regulations in which the market price is taken as a regress at the place of discount variables. Comparison of co-efficient shows that a ₹100 increase in an item’s market price has the same impact on buying behavior as does an ₹81 reduction of the price at which the product is sold. The change in market price does not add cost to the company, which has a bigger effect on customer, given estimates from a model of interruptions among market price and online product. The majority of the product sold has dubious discount and not actual product in bridle and motor shop have dubious discount, so the dubious online discounted product is served on dubious discount. The values point out that fake market prices have an effect on buying behavior that is 1.91 times more than the actual market prices. There are differences among online and offline products that impact the importance of marked prices. The outcomes throw light on dubious marked prices and the following discounts, which have impact on buying behavior that compete with real discounts. The outcomes give us reason for demand in the market as its effect on marketing decision. The analysis gives us understanding of how consumer awareness of the focus of the product neglects their effects.
4.4. Rate Prices and Consumer Heterogeneity
The lack of awareness on the consumers’ part makes the market price a signal of quality [
44]. The data on demand in the market, including market price and price after discount, give us the option to measure this signaling effect from price and quality correction, then their sensitivity to market price should be more than consumers who are aware.
The market space is varied from the laboratory research environment that uses the price–quality relationship. In this article, we focus on all products available for sale. Assumptions about betterment of quality in marginal cost with a company having high quality with lost cost on quality and hence the importance of keeping prices high. The present scenario has a high-quality product which is not expensive to the firm to produce, as demand is driven by aesthetics which do not increase production cost much. There are multiple reasons why the Indian middleclass consumer links price to quality. Firms with multiple products also try to push customers towards products that provide more value to the company, utilizing the customers’ lack of awareness.
The inflated marked price list effects the structure of production cost, as quality is weakly connected to marginal cost. The willingness to show inflated market price reduces the need of pricing against marginal cost to increase income, while still relying on prices to convey quality. To identify the response of the Indian customer to dubious discounts and their relationship with awareness of the brands, this paper identifies relation among price-reducing variables, along with experience of users of the product, with the product. The experiences are day gap periods for which the consumer knows the store. This is based on the assumption that the longer the store has been operating in the mall (both tier 2 and tier 3), the more informed itis about pricing policies and dubious discounts. Another experience being the proximity between local outlets and the upperclass malls. The supposition about the variable is that the closer the local store, the higher the awareness will be of customers to note the variations in the assortments among channels and the existence of dubious discounts in the malls. The malls’ fixed effects are taken for every regression, which are identified from the data from the outlets.
The following
Table 7 presents the estimations on heterogeneity, such as:
The identification has store-level interactions. The outlet time duration of existence is noted in column number 1. Exact store existence in years is available for all the outlets in the malls and e-commerce portals. Changes in the selected list of items point to the concerned store. Customers who are associated with malls and e-commerce sellers long-term experience less effect of dubious discounts on their buying behavior, but are sensitive to actual discounts. The second column shows the distance of malls from the regular outlets. The average distance of a mall from regular stand-alone stores is 35 m. There are some changes due to opening and closing of certain stores. The changes observed when a store opened reduced the distance to 20 m and 15 m when the store closeed among the distance variable of existing brick and mortar stores; 21 such instances were found. The increased distance between offline stores increased the response of the customers. The measurements are given in column 3, using two dummy values in the model. The measurements give proof that brand awareness reduces the sensitivity towards actual and dubious discounts. This leads us to believe that a dummy of consumer awareness would be misleading us about consumer beliefs about the prices. The dummy values may be correlated with other factors that may impact customers’ reactions towards dubious discounts. The data obtained through observation is matched with the data obtained from experiments in which the sample was provided with data about actual marked prices.
5. Experimental Approach
The outcomes of experiments prepared identification of the impact of dubious discounts on purchase behavior. This supplements the observational data, as it gives us the independence to control the subjects of the samples’ understanding of actual and fake discounts. The hypothesis that dubious discounts impact buyer behavior who is informed about the actual marked price is rejected. The relationship between reference price and buying behavior has been established by researchers before. The possibility of marked price controlled by marking the impacts for brands that are known and unknown was identified to even it [
54]. The subjects of the experiment were shown footwear with the actual marked price. The footwear was select according to the category of product it belonged to in the observational data. The subjects were given information on marked price of the footwear, which was ₹1200. Along with the actual price, a dubious discount was also given along with the actual marked price.
The subjects were given situations with actual and dubious discounts, ranging from ₹1200 to ₹3000, with prices increasing by ₹200.
Table 8 gives the total elements in the sample that belong to a particular group. A total of 750 observations were done. A five-point scale was used to rate their purchase likelihood. To identify the impact of every data on purchase likelihood, the following experiments were conducted.
The outputs of regression are shown in
Table 9. The actual marked price had an impact on buying behavior, but the displayed marked price had no effect. In the survey design stage, the actual price was displayed only in the first stages, but the displayed original price was presented during the testing of buying behavior.
The outcomes show that dubious discounts increase sales by manipulating customers. Individuals who were part of the observation sample ranked the discounts on specified criteria based on buying behavior.
The criteria were measured on a scale on which the rating was done. The criteria considered were:
Whether the sample considered the discount to be of value.
Whether the firm is trying to manipulate the buyer.
Subjects’ and others’ perceptions of the quality of the product.
The following
Table 10 presents a detailed analysis of the variables and the results are relevant for a better understanding of consumer behavior in India:
The model has a low R2 because the actual marked price had an impact on the buying behavior of consumers, but on the other hand, the displayed marked price had no effect. The marked price that was affected did not have any significant effect on the research measurements. The subjects undergoing this research study doubted the authenticity of the firm more when the displayed price and actual price difference was high.
By regressing the measurements on prices, the above table records the outcomes. The findings show that higher marked prices made the customers think that the goods were of superior make. Subjects also believed that the discount had value: The higher the marked price, the truer the price is. The offer was considered 2.8 times more responsive to actual price than the quality of the product. The marked price that was struck did not have any considerable effect on measurements. The subjects doubted the authenticity of the firm more when the displayed price and actual price difference was high.
The following
Table 11 presents the buyer intention based on selected variables:
By regressing buying behavior towards pricing and response ratings, the mediation analysis was done. The ratings of responses mediated the impact of pricing on buying behavior with the customer’s perception of quality being more important than the offer itself. How others see quality did not have any considerable effect on the subject’s own behavior. Ratings whether the firm is misleading its customers did not correlate with the buyer’s behavior. Observations of multiple dimensions of consumers’ responses are the same as the previous findings about prices and consumers’ perceptions [
53,
66]. The findings show that demand spikes from dubious discounts observed were because of customers believing that fake marked price was the actual price. The parameter varied across outlets to allow differences among Indian consumers, culturally and demographically, and this is same as the earlier parameters that marked prices were shown as pointers of demand [
67].
The marked price was directly proportional to the customer’s perception of product quality and the value in the offer. This led to an increase in the percentage of sales. However, when the customer had the data on actual prices of the products, no effect on demand was shown, which stayed the same. However, the customer perceived the firm as misleading the customer. The customers need to understand that not all discounts are genuine, and they must check the marked prices with other sellers to arrive at the decision. If the marked price is increased, this gives a dubious discount. A well-informed customer will not fall into this trap, and can clearly understand a dubious discount from a real discount.
6. Conclusions
Price has been at the heart of promotions for almost all firms involved in marketing in offline and online platforms. But the impact of these modifications on buyer behavior is important to all the relevant stakeholders. Changes in the prices in the form of discounts represent a huge driver of demand in the online and offline markets, which also involves low cost on the part of the marketers. Customers try to assess whether the prices inform or cheat them. The outcomes prove that marked price has a significant impact on buying behavior. The outcomes indicate that customers perceive ₹81 selling price to ₹100 marked price. In other words, the effect of discounts on sales has been identified as an increase of ₹100 on the listed price has an impact equal to a discount of ₹81. However, the impact drastically reduces when the customer is aware of the original list price. The outcomes prove that there is a strong correlation between misleading discounts and purchase by deceiving customers about the actual prices.
This research found that offers based on prices in India had an impact of 2.8 times higher than the actual quality of the product. This study found that Indian consumers use actual price as an indicator of quality. However, a third of the sampled consumers doubted the offer when the discount was near or more than half the actual price. The outcome is that customers perceive ₹81 selling price to ₹100 marked price. The demand generated by dubious discounts was through manipulation of the customers who believed the fake marked price to be real. This study found that when actual marked price was revealed, the displayed marked price effect was zero on the customers. The outcomes show that, when marked prices is same, an increased real marked price gives an increased purchase intent.
The moderating factor here is the time period at which the stores are open, as well as the distance between brick and mortar stores—which shows that customer awareness about actual price reduces the effect of discounts, both offline and online, on buying behavior. The lab experiments also prove the same. Customers believe high price to be indicator of a quality. The lab experiments have been conducted with the limitations. This article, however, opens doors for further research on the challenges faced by firms in the area of dubious discounts. However, the discounts offered in the Indian market point to the fact that it is profitable to the firms. The practice of discounts has a repetitive aspect to it [
68]. Lawmakers must identify these practices and regulate fake discounts. Prior studies have suggested that the anchoring bias for regulation appears to be a robust tool for determining whether consumers are systematically deceived [
69]. Changing the system of outcomes of share of market is something that has also been used in previous studies [
70]. Basically, all the previous articles say that dubious discounts are a way to cheat customers who lack knowledge about prices. There exists a strong relationship among quality and cost of production which sets the marked price, which in turn indicates quality [
2]. Quality could be a variable factor, as in the case of production companies, which may be controlled through production process by companies. These companies use dubious discounts as a method to overcome uneven data about quality of products in the market. Further, many industries have varied qualities, and such an idea will fit those industries well.
This empirical study contributes towards identifying the effect of both fake and real discounts in the Indian marketing environment. This article has been inspired by numerous research papers on discounts, and has identified the repetitive nature of discounts by sellers. This article shows that discounts have an impact only when perceived as genuine, and sellers need to focus on actual discount to drive sales. Also, the sellers can use the effect to which marked price is used as an indicator of quality by Indian customers. This article leaves more room for research for academics as to how time and place also have an impact on the offers, as India has many festivals and holidays.


