A GIS-Assisted Assessment and Attribute-Based Clustering of Forest Wetland Utility in South Korea


Abstract
1. Introduction
1.1. Forest Wetland Conservation and Use
1.2. Evaluation of Forest Wetlands
2. Methodology
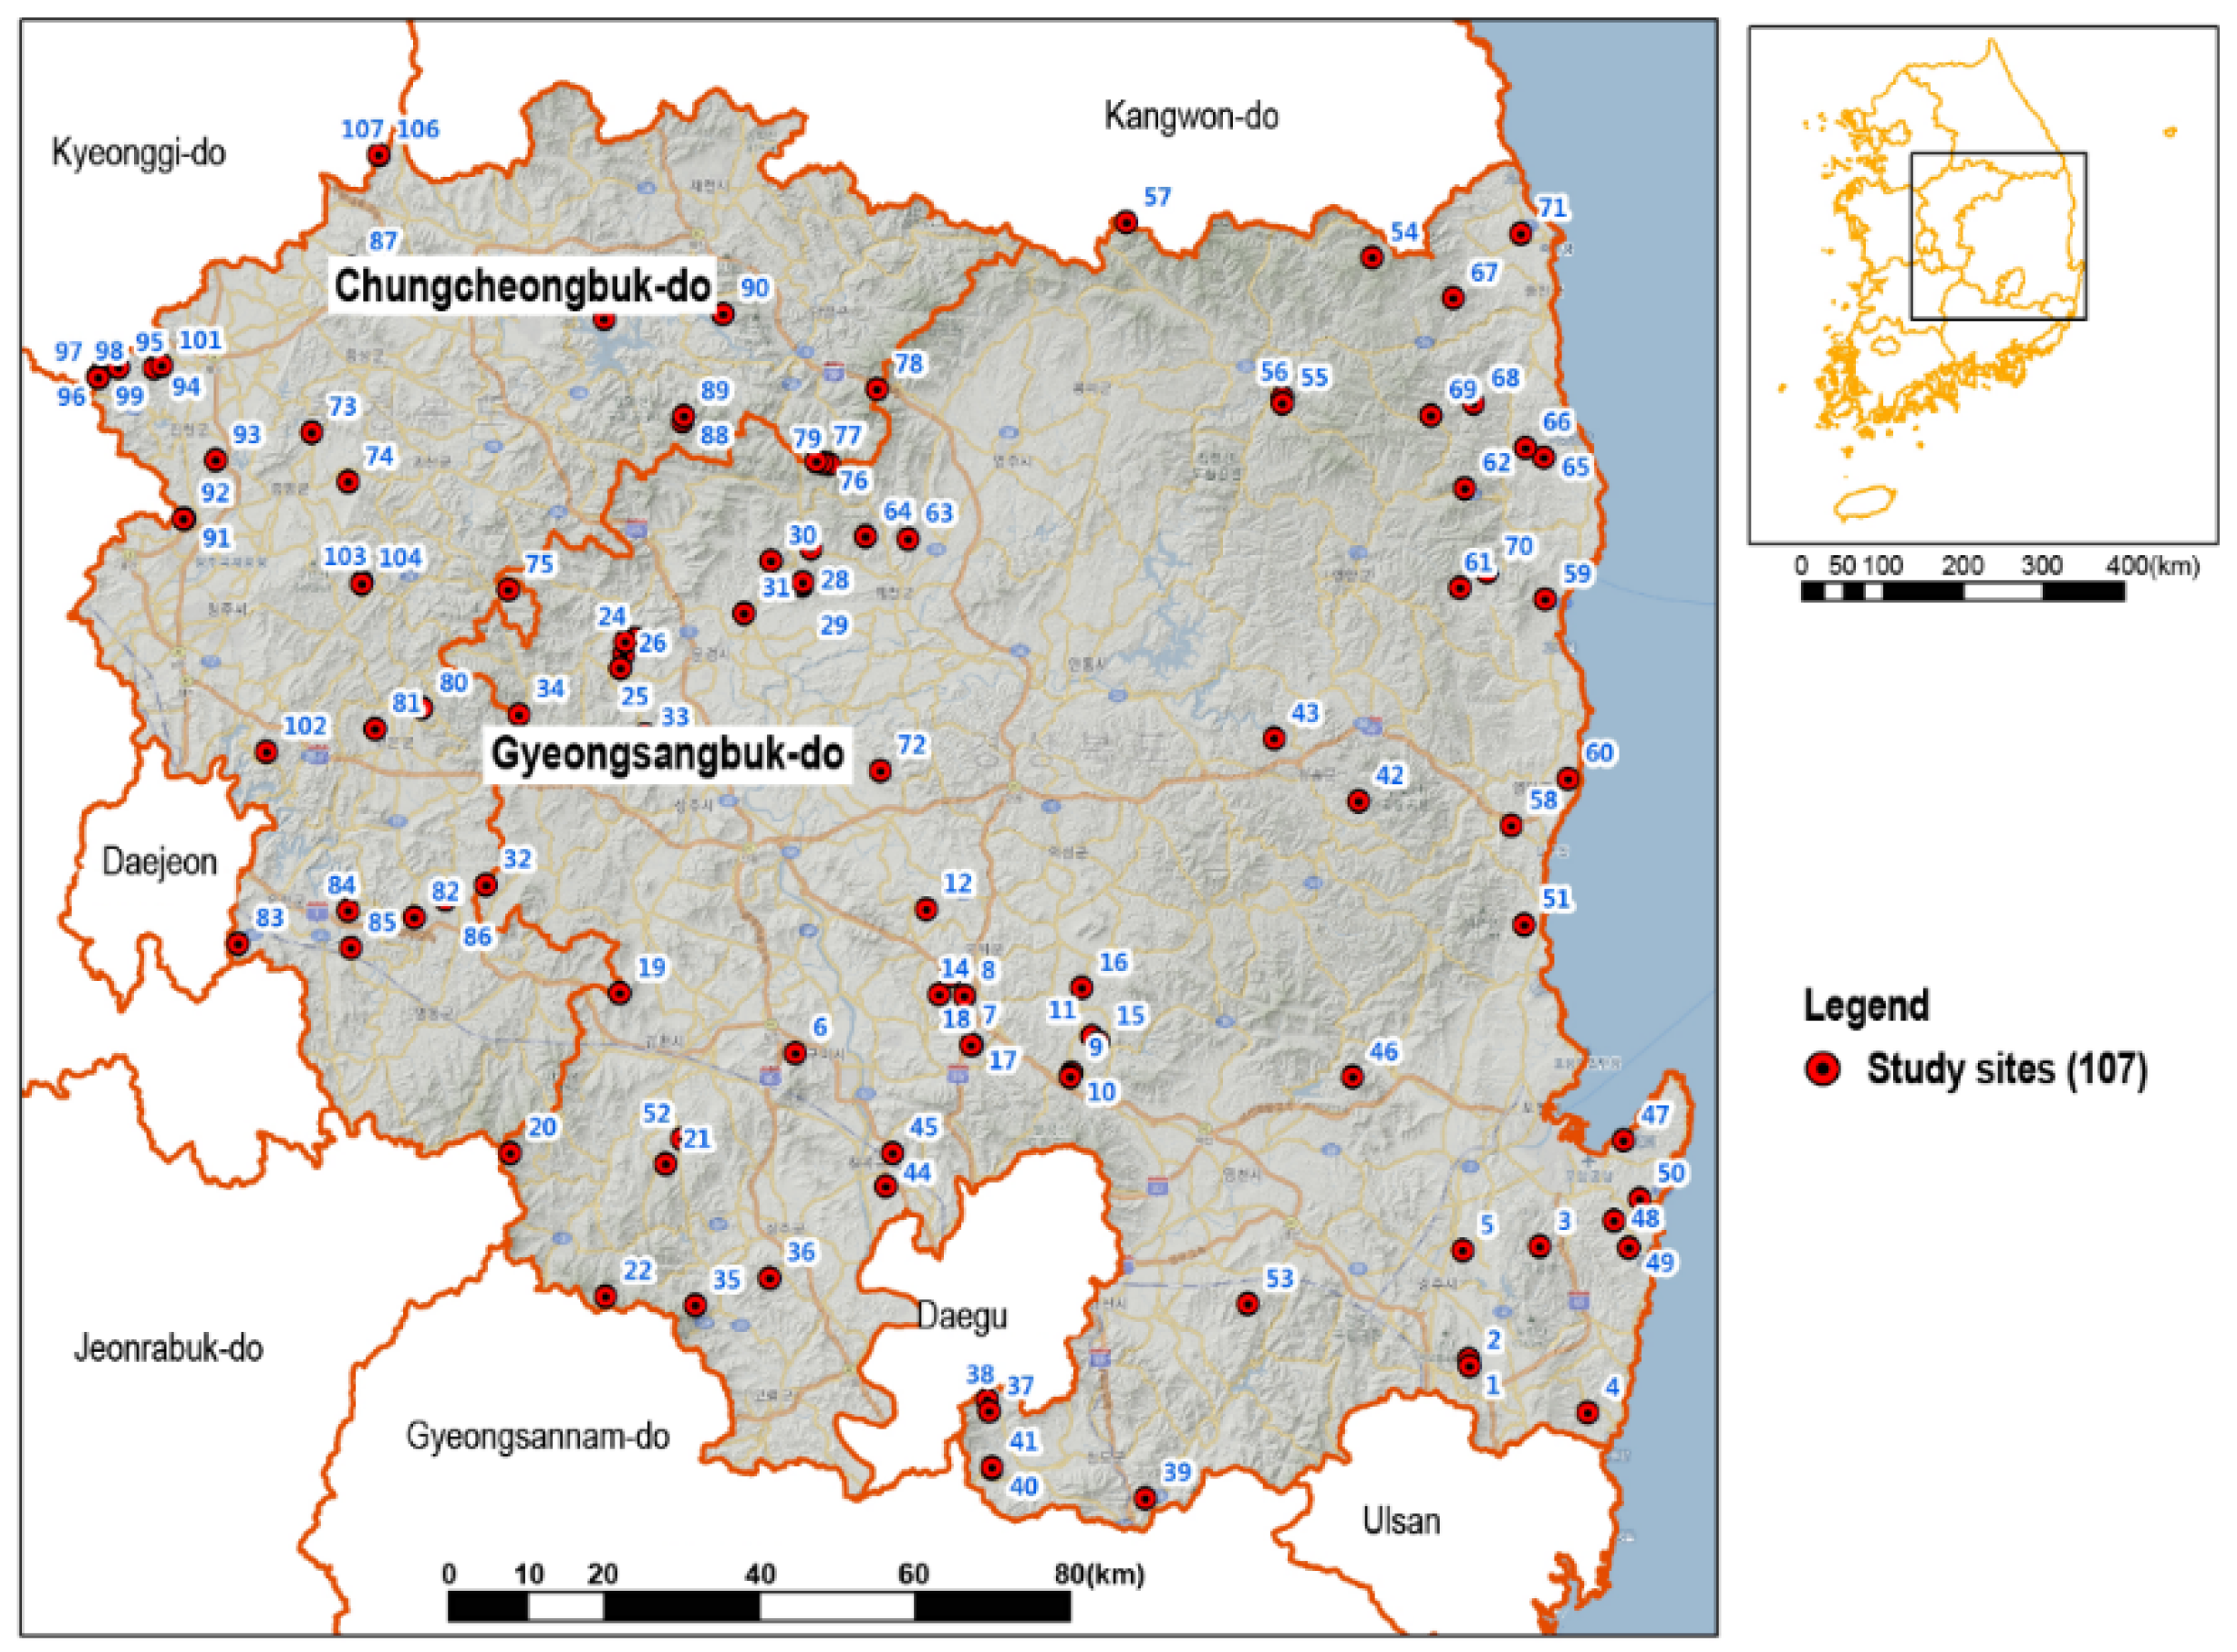
2.1. Study Sites
2.2. Assessment Factors
2.3. Data Collection and Units of Analysis
2.4. Data Analysis Methods
2.5. Cluster Analysis
3. Results
3.1. AHP Result by Forest Wetland Factors
3.2. Forest Wetland Site Suitability
3.3. Comparison of Forest Wetlands Between Clusters
4. Discussion
4.1. Is Balancing Forest Wetland Conservation with Development Possible?
4.2. The Application of This Assessment System and Policy Implications
5. Conclusions
Author Contributions
Funding
Conflicts of Interest
References
- Sakané, N.; Alvarez, M.; Becker, M.; Böhme, B.; Handa, C.; Kamiri, H.; Langensiepen, M.; Menz, G.; Misana, S.; Mogha, N.; et al. Classification, characterisation, and use of small wetlands in East Africa. Wetlands 2011, 31, 1103–1116. [Google Scholar] [CrossRef]
- Son, H.; Kim, Y.; Kim, N.; Lee, H.; Kim, S.; Lee, H.; Park, W. Plants Species Diversity and Flora of Wetlands in the Forest of Gangwon Province. Plant Resour. 2015, 28, 419–440. [Google Scholar]
- Liu, X.; Conner, W.H.; Song, B.; Jayakaran, A.D. Forest composition and growth in a freshwater forested wetland community across a salinity gradient in South Carolina, USA. For. Ecol. Manag. 2017, 389, 211–219. [Google Scholar] [CrossRef]
- Reeder, B.C.; Wulker, B.D. Avifauna use of reference and restored bottomland forest wetlands in Eastern Kentucky. Ecol. Eng. 2017, 108, 498–504. [Google Scholar] [CrossRef]
- Cubbage, F.; Abt, R.; Sheffield, R.; Flather, C.; Wickham, J. Forest Wetland Area and the Forest Sector Economy in the U.S. South. Open J. For. 2018, 08, 409–428. [Google Scholar] [CrossRef]
- Korea Forest Service. Report of Wetland Research of Civil Owned Forest; Korea Forest Service: Daejeon, Korea, 2014.
- Laćan, I.; McBride, J.R.; De Witt, D. Urban forest condition and succession in the abandoned city of Pripyat, near Chernobyl, Ukraine. Urban For. Urban Green. 2015, 14, 1068–1078. [Google Scholar] [CrossRef]
- Ramirez, J.I.; Jansen, P.A.; den Ouden, J.; Goudzwaard, L.; Poorter, L. Long-term effects of wild ungulates on the structure, composition and succession of temperate forests. For. Ecol. Manag. 2019, 432, 478–488. [Google Scholar] [CrossRef]
- Karjalainen, E.; Sarjala, T.; Raitio, H. Promoting human health through forests: Overview and major challenges. Environ. Health Prev. Med. 2010, 15, 1–8. [Google Scholar] [CrossRef] [PubMed]
- Aasetre, J.; Gundersen, V.; Vistad, O.I.; Holtrop, E.J. Recreational preferences along a naturalness-development continuum: Results from surveys in two unequal urban forests in Europe. J. Outdoor Recreat. Tour. 2016, 16, 58–68. [Google Scholar] [CrossRef]
- Nesbitt, L.; Hotte, N.; Barron, S.; Cowan, J.; Sheppard, S.R.J. The social and economic value of cultural ecosystem services provided by urban forests in North America: A review and suggestions for future research. Urban For. Urban Green. 2017, 25, 103–111. [Google Scholar] [CrossRef]
- Wang, R.; Zhao, J.; Meitner, M.J. Urban woodland understory characteristics in relation to aesthetic and recreational preference. Urban For. Urban Green. 2017, 24, 55–61. [Google Scholar] [CrossRef]
- Mann, C.; Pouta, E.; Gentin, S.; Jensen, F.S. Outdoor recreation in forest policy and legislation: A European comparison. Urban For. Urban Green. 2010, 9, 303–312. [Google Scholar] [CrossRef]
- Campbell, M.O.N. The impact of habitat characteristics on bird presence and the implications for wildlife management in the environs of Ottawa, Canada. Urban For. Urban Green. 2009, 8, 87–95. [Google Scholar] [CrossRef]
- Keddy, P.A. Wetland Ecology: Principles and Conservation, 2nd ed.; Cambridge University Press: New York, NY, USA, 2010. [Google Scholar]
- Miao, G.; Noormets, A.; Domec, J.C.; Fuentes, M.; Trettin, C.C.; Sun, G.; King, J.S. Hydrology and microtopography control carbon dynamics in wetlands: Implications in partitioning ecosystem respiration in a coastal plain forested wetland. Agric. For. Meteorol. 2017, 247, 343–355. [Google Scholar] [CrossRef]
- Liu, H.; Gao, C.; Wang, G. Understand the resilience and regime shift of the wetland ecosystem after human disturbances. Sci. Total Environ. 2018, 643, 1031–1040. [Google Scholar] [CrossRef]
- Zou, Y.; Duan, X.; Xue, Z.; Mingju, E.; Sun, M.; Lu, X.; Yu, X. Water use conflict between wetland and agriculture. J. Environ. Manag. 2018, 224, 140–146. [Google Scholar] [CrossRef] [PubMed]
- Eggers, J.; Lindhagen, A.; Lind, T.; Lämås, T.; Öhman, K. Balancing landscape-level forest management between recreation and wood production. Urban For. Urban Green. 2018, 33, 1–11. [Google Scholar] [CrossRef]
- Yu, X.; Mingju, E.; Sun, M.; Xue, Z.; Lu, X.; Jiang, M.; Zou, Y. Wetland recreational agriculture: Balancing wetland conservation and agro-development. Environ. Sci. Policy 2018, 87, 11–17. [Google Scholar] [CrossRef]
- Miller, S.J.; Wardrop, D.H. Adapting the floristic quality assessment index to indicate anthropogenic disturbance in central Pennsylvania wetlands. Ecol. Indic. 2006, 6, 313–326. [Google Scholar] [CrossRef]
- Mitsch, W.J.; Zhang, L.; Stefanik, K.C.; Nahlik, A.M.; Anderson, C.J.; Bernal, B.; Song, K. Creating Wetlands: Primary Succession, Water Quality Changes, and Self-Design over 15 Years. Bioscience 2012, 62, 237–250. [Google Scholar] [CrossRef]
- Behn, K.; Becker, M.; Burghof, S.; Möseler, B.M.; Willy, D.K.; Alvarez, M. Using vegetation attributes to rapidly assess degradation of East African wetlands. Ecol. Indic. 2018, 89, 250–259. [Google Scholar] [CrossRef]
- Dudek, T.; Kasprzyk, I.; Dulska-Jez, A. Forest as a place for recreation but also the source of allergenic plant pollen: To come or avoid? Eur. J. For. Res. 2018, 137, 849–862. [Google Scholar] [CrossRef]
- Stålhammar, S.; Pedersen, E. Recreational cultural ecosystem services: How do people describe the value? Ecosyst. Serv. 2017, 26, 1–9. [Google Scholar] [CrossRef]
- McInnes, R.J.; Everard, M. Rapid Assessment of Wetland Ecosystem Services (RAWES): An example from Colombo, Sri Lanka. Ecosyst. Serv. 2017, 25, 89–105. [Google Scholar] [CrossRef]
- Pedersen, E.; Weisner, S.E.B.; Johansson, M. Wetland areas’ direct contributions to residents’ well-being entitle them to high cultural ecosystem values. Sci. Total Environ. 2019, 646, 1315–1326. [Google Scholar] [CrossRef]
- Meyer, K.; Botsch, K. Do forest and health professionals presume that forests offer health benefits, and is cross-sectional cooperation conceivable? Urban For. Urban Green. 2017, 27, 127–137. [Google Scholar] [CrossRef]
- Lerstrup, I.; Refshauge, A.D. Characteristics of forest sites used by a Danish forest preschool. Urban For. Urban Green. 2016, 20, 387–396. [Google Scholar] [CrossRef]
- Deng, J.; Andrada, R.; Pierskalla, C. Visitors’ and residents’ perceptions of urban forests for leisure in Washington, D.C. Urban For. Urban Green. 2017, 28, 1–11. [Google Scholar] [CrossRef]
- Beuel, S.; Alvarez, M.; Amler, E.; Behn, K.; Kotze, D.; Kreye, C.; Becker, M. A rapid assessment of anthropogenic disturbances in East African wetlands. Ecol. Indic. 2016, 67, 684–692. [Google Scholar] [CrossRef]
- Ghermandi, A.; Van Den Bergh, J.C.J.M.; Brander, L.M.; De Groot, H.L.F.; Nunes, P.A.L.D. Values of natural and human-made wetlands: A meta-analysis. Water Resour. Res. 2010, 46, 1–12. [Google Scholar] [CrossRef]
- Malczewski, J. GIS-based land-use suitability analysis: A critical overview. Prog. Plan. 2004, 62, 3–65. [Google Scholar] [CrossRef]
- Amato, F.; Tonini, M.; Murgante, B.; Kanevski, M. Fuzzy definition of rural urban interface: An application based on land use change scenarios in Portugal. Environ. Model. Softw. 2018, 104, 171–187. [Google Scholar] [CrossRef]
- Martellozzo, F.; Amato, F.; Murgante, B.; Clarke, K.C. Modelling the impact of urban growth on agriculture and natural land in Italy to 2030. Appl. Geogr. 2018, 91, 156–167. [Google Scholar] [CrossRef]
- Mei, Y.; Sohngen, B.; Babb, T. Valuing urban wetland quality with hedonic price model. Ecol. Indic. 2018, 84, 535–545. [Google Scholar] [CrossRef]
- Bell, J.L.; Boyer, J.N.; Crystall, S.J.; Nichols, W.F.; Pruyn, M. Floristic quality as an indicator of human disturbance in forested wetlands of northern New England. Ecol. Indic. 2017, 83, 227–231. [Google Scholar] [CrossRef]
- US EPA. Element of a State Water Monitoring and Assessment Program for Wetlands; United States Environmental Protection Agency: Washington, WA, USA, 2006.
- Zhang, J.; Su, Y.; Wu, J.; Liang, H. GIS based land suitability assessment for tobacco production using AHP and fuzzy set in Shandong province of China. Comput. Electron. Agric. 2015, 114, 202–211. [Google Scholar] [CrossRef]
- Feghhi, J.; Teimouri, S.; Makhdoum, M.F.; Erfanifard, Y.; Abbaszadeh Tehrani, N. The assessment of degradation to sustainability in an urban forest ecosystem by GIS. Urban For. Urban Green. 2017, 27, 383–389. [Google Scholar] [CrossRef]
- Moreno-Fernández, D.; Álvarez-González, J.G.; Rodríguez-Soalleiro, R.; Pasalodos-Tato, M.; Cañellas, I.; Montes, F.; Pérez-Cruzado, C. National-scale assessment of forest site productivity in Spain. For. Ecol. Manag. 2018, 417, 197–207. [Google Scholar]
- Kienast, F.; Degenhardt, B.; Weilenmann, B.; Wäger, Y.; Buchecker, M. GIS-assisted mapping of landscape suitability for nearby recreation. Landsc. Urban Plan. 2012, 105, 385–399. [Google Scholar] [CrossRef]
- De Valck, J.; Landuyt, D.; Broekx, S.; Liekens, I.; De Nocker, L.; Vranken, L. Outdoor recreation in various landscapes: Which site characteristics really matter? Land Use Policy 2017, 65, 186–197. [Google Scholar] [CrossRef]
- Nino, K.; Mamo, Y.; Mengesha, G.; Kibret, K.S. GIS based ecotourism potential assessment in Munessa Shashemene Concession Forest and its surrounding area, Ethiopia. Appl. Geogr. 2017, 82, 48–58. [Google Scholar] [CrossRef]
- James, A.; Choy, S.L.; Mengersen, K. Elicitator: An expert elicitation tool for regression in ecology. Environ. Model. Softw. 2010, 25, 129–145. [Google Scholar] [CrossRef]
- Rabe, S.E.; Gantenbein, R.; Richter, K.F.; Grêt-Regamey, A. Increasing the credibility of expert-based models with preference surveys—Mapping recreation in the riverine zone. Ecosyst. Serv. 2018, 31, 308–317. [Google Scholar] [CrossRef]
- Bunruamkaew, K.; Murayama, Y. Site suitability evaluation for ecotourism using GIS & AHP: A case study of surat Thani Province, Thailand. Procedia Soc. Behav. Sci. 2011, 21, 269–278. [Google Scholar]
- Houshyar, E.; Sheikhdavoodi, M.J.; Almassi, M.; Bahrami, H.; Azadi, H.; Omidi, M.; Witlox, F. Silage corn production in conventional and conservation tillage systems. Part I: Sustainability analysis using combination of GIS/AHP and multi-fuzzy modeling. Ecol. Indic. 2014, 39, 102–114. [Google Scholar] [CrossRef]
- Chaudhary, P.; Chhetri, S.K.; Joshi, K.M.; Shrestha, B.M.; Kayastha, P. Application of an Analytic Hierarchy Process (AHP) in the GIS interface for suitable fire site selection: A case study from Kathmandu Metropolitan City, Nepal. Socio-Econ. Plan. Sci. 2016, 53, 60–71. [Google Scholar] [CrossRef]
- Alami Merrouni, A.; Elwali Elalaoui, F.; Ghennioui, A.; Mezrhab, A.; Mezrhab, A. A GIS-AHP combination for the sites assessment of large-scale CSP plants with dry and wet cooling systems. Case study: Eastern Morocco. Sol. Energy 2018, 166, 2–12. [Google Scholar] [CrossRef]
- Korea Forest Service. Detailed Report of Forest Wetland; Korea Forest Service: Daejeon, Korea, 2017.
- Korea Forest Service. Report of Wetland Research of Civil Owned Forest; Korea Forest Service: Daejeon, Korea, 2009. [Google Scholar]
- Kim, H.; Hwang, H.; Ban, Y. Evaluating model building and application for suitable locations reflecting forest types. For. Sci. Technol. 2010, 99, 111–124. [Google Scholar]
- Vauhkonen, J.; Ruotsalainen, R. Assessing the provisioning potential of ecosystem services in a Scandinavian boreal forest: Suitability and tradeoff analyses on grid-based wall-to-wall forest inventory data. For. Ecol. Manag. 2017, 389, 272–284. [Google Scholar] [CrossRef]
- Westfall, J.A.; Morin, R.S. A cover-based method to assess forest characteristics using inventory data and GIS. For. Ecol. Manag. 2013, 298, 93–100. [Google Scholar] [CrossRef]
- Tourism Promotion Act of Korea. Available online: https://english.visitkorea.or.kr/enu/bs/tour_investment_support/invest_guidance/foreigner_invest_laws3.jsp (accessed on 7 December 2018).
- Saaty, T.L. The Analytic Hierarchy Process: Planning, Priority Setting, Resource Allocation; Mcgraw-Hill Books: New York, NY, USA, 1980. [Google Scholar]
- Saaty, T.L. Decision Making for Leaders: The Analytical Hierarchy Process for Decisions in a Complex World; Lifetime Learning Publication: Belmont, CA, USA, 1982.
- Akinci, H.; Özalp, A.Y.; Turgut, B. Agricultural land use suitability analysis using GIS and AHP technique. Comput. Electron. Agric. 2013, 97, 71–82. [Google Scholar] [CrossRef]
- Saaty, T.L. How to make a decision: An analytic hierarchy process. Interfaces 1994, 24, 19–43. [Google Scholar] [CrossRef]
- Yun, H.; Kim, T. Monitoring and evaluation system of rural tourism villages each development step using AHP. Korea J. Tour. Res. 2009, 33, 157–176. [Google Scholar]
- Wattage, P.; Mardle, S. Total economic value of wetland conservation in Sri Lanka identifying use and non-use values. Wetl. Ecol. Manag. 2008, 16, 359–369. [Google Scholar] [CrossRef]
- Morgan, R. An investigation of constraints upon fisheries diversification using the Analytic Hierarchy Process (AHP). Mar. Policy 2017, 86, 24–30. [Google Scholar] [CrossRef]
- Choi, S.; Hwang, H.; Han, K.; Kim, Y. Resources evaluation system for rural planning purposes: Formulation of goal system for resource evaluation. Korean Soc. Rural Plan. 1998, 3, 54–67. [Google Scholar]
- Oh, Y.; Choi, J.; Bae, S. Evaluation of regional rural amenity values on living and tourism resource characteristics. Korean Soc. Rural Plan. 2008, 14, 21–32. [Google Scholar]
- Decheng, F.; Jon, S.; Pang, C.; Dong, W.; Won, C. Improved quantum clustering analysis based on the weighted distance and its application. Heliyon 2018, 4, e00984. [Google Scholar] [CrossRef]
- Feng, J.; Wang, J.; Yao, S.; Ding, L. Dynamic assessment of forest resources quality at the provincial level using AHP and cluster analysis. Comput. Electron. Agric. 2016, 124, 184–193. [Google Scholar] [CrossRef]
- Core Team R. A Language and Environment for Statistical Computing R; Foundation for Statistical Computing: Vienna, Austria, 2014; Available online: http://www.R-project.org/ (accessed on 17 January 2019).
- Russi, D.; ten Brink, P.; Farmer, A.; Badura, T.; Coates, D.; Forster, J.; Kumar, R.; Davidson, N. The Economics of Ecosystems and Biodiversity for Water and Wetlands; IEEP, Gland: London, UK; Ramsar Secretariat: Brussels, UK, 2013. [Google Scholar]
- Pueyo-Ros, J.; Garcia, X.; Ribas, A.; Fraguell, R.M. Ecological Restoration of a Coastal Wetland at a Mass Tourism Destination. Will the Recreational Value Increase or Decrease? Ecol. Econ. 2018, 148, 1–14. [Google Scholar] [CrossRef]
- Lee, M. A Study on Vegetation Characteristics of Forest Wetlands. Master’s Thesis, Chonbuk National University, Jenjou, Korea, 21 August 2009. [Google Scholar]
- Korea National Arboretum. The Analysis of Site Suitability for Arboretum and Ecological Forest Using GIS; Korea National Arboretum: Pocheon, South Korea, 2009. [Google Scholar]
- Korea National Arboretum. The Analysis of New Forest Wetland and Management Zoning Using FGIS; Korea National Arboretum: Pocheon, South Korea, 2014. [Google Scholar]
- Zhai, Y.; Baran, P.K.; Wu, C. Spatial distributions and use patterns of user groups in urban forest parks: An examination utilizing GPS tracker. Urban For. Urban Green. 2018, 35, 32–44. [Google Scholar] [CrossRef]
- Kaiser, J.E.; Godschalk, R.D.; Chapin, F.S., Jr. Urban Land Use Planning, 4th ed.; University of Illinois Press: Illinois, IL, USA, 2010. [Google Scholar]
- Jaziri, W. Using GIS and multicriteria decision aid to optimize the direction of trees cutting in the forest ecosystem: A case study. Comput. Electron. Agric. 2017, 143, 177–184. [Google Scholar] [CrossRef]
- Baker, S.C.; Kasel, S.; van Galen, L.G.; Jordan, G.J.; Nitschke, C.R.; Pryde, E.C. Identifying regrowth forests with advanced mature forest values. For. Ecol. Manag. 2019, 433, 73–84. [Google Scholar] [CrossRef]
- Madurika, H.; Hemakumara, G. GIS based analysis for suitability location finding in the residential development areas of Greater Matara region. Int. J. Sci. Technol. Res. 2015, 4, 96–105. [Google Scholar]
- Termansen, M.; McClean, C.J.; Jensen, F.S. Modelling and mapping spatial heterogeneity in forest recreation services. Ecolog. Econom. 2013, 92, 48–57. [Google Scholar] [CrossRef]
- Singh, L.K.; Jha, M.K.; Chowdary, V.M. Assessing the accuracy of GIS-based multi-criteria decision analysis approaches for mapping groundwater potential. Ecol. Indic. 2018, 91, 24–37. [Google Scholar] [CrossRef]
- Martire, S.; Castellani, V.; Sala, S. Carrying capacity assessment of forest resources: Enhancing environmental sustainability in energy production at local scale. Resour. Conserv. Recycl. 2015, 94, 11–20. [Google Scholar] [CrossRef]
- Peng, B.; Li, Y.; Elahi, E.; Wei, G. Dynamic evolution of ecological carrying capacity based on the ecological footprint theory: A case study of Jiangsu province. Ecol. Indic. 2019, 99, 19–26. [Google Scholar] [CrossRef]
- Xiao, S.; Jia, L.; Jiang, L. Forest Recreation Opportunity Spectrum in the Suburban Mountainous Region of Beijing. J. Urban Plan. Dev. 2012, 138, 335–341. [Google Scholar] [CrossRef]
- Oishi, Y. Toward the improvement of trail classification in national parks using the recreation opportunity spectrum approach. Environ. Manag. 2013, 51, 1126–1136. [Google Scholar] [CrossRef]
- Romijn, E.; Lantican, C.B.; Herold, M.; Lindquist, E.; Ochieng, R.; Wijaya, A.; Verchot, L. Assessing change in national forest monitoring capacities of 99 tropical countries. For. Ecol. Manag. 2015, 352, 109–123. [Google Scholar] [CrossRef]
- Reis, B.P.; Martins, S.V.; Fernandes Filho, E.I.; Sarcinelli, T.S.; Gleriani, J.M.; Leite, H.G.; Halassy, M. Forest restoration monitoring through digital processing of high resolution images. Ecol. Eng. 2019, 127, 178–186. [Google Scholar] [CrossRef]


| Criteria | Factors | Sign | Source |
|---|---|---|---|
| Natural landscape | Slope | Negative | Korea Forest Service (DEM) |
| Elevation | Negative | Korea Forest Service (DEM) | |
| Visibility | Positive | Korea Forest Service (DEM) | |
| Natural ecology | Ecological zoning map | Positive | Ministry of Environment, Korea |
| Vegetation (Age Class) | Positive | Forest type map by Korea Forest Service (1:25,000) | |
| Water system | Positive | National Information Society Agency | |
| Species diversity | Negative | Korea Forest Service | |
| Land use | Forest wetland area | Positive | Korea Forest Service |
| Land ownership | Nominal Scale | Korea Forest Service (Basic map of nation-owned property), Korea National Arboretum | |
| Development feasibility | Nominal Scale | Ministry of Environment, Korea (Land use regulations information system) | |
| Accessibility | Distance to city | Negative | Ministry of Land, Infrastructure, and Transport (Traffic map) |
| Distance to access road | Negative | Korea Transport Database | |
| Tourist attraction | Number of nearby tourists | Positive | Tourism Knowledge Information System |
| Number of nearby tourist destination | Positive | Ministry of Culture and Tourism | |
| Number of nearby cultural heritage | Positive | Cultural Heritage Administration, Korea | |
| Proximity to national park | Negative | Korea National Park Service |
| Division | Frequency (Percent) or Average | |
|---|---|---|
| Occupation | Faculty | 16 (48.5%) |
| Researcher | 10 (30.3%) | |
| Related Industry | 5 (15.2%) | |
| Doctoral candidate | 2 (6.1%) | |
| Major | Tourism management | 14 (42.4%) |
| Landscape architecture | 13 (39.4%) | |
| Forestry | 4 (12.1%) | |
| Rural Planning | 2 (6.1%) | |
| Period of related research experience | - | 13.3 year |
| Division | 5 Grade | 4 Grade | 3 Grade | 2 Grade | 1 Grade |
|---|---|---|---|---|---|
| Dispersion | |||||
| Evaluation score | 0.2 | 0.4 | 0.6 | 0.8 | 1.0 |
| Criteria | Weight | Conversion Value | Factors | Weight | Conversion Value |
|---|---|---|---|---|---|
| Natural landscape | 0.128 | 127.628 | Slope | 0.246 | 31.375 |
| Elevation | 0.298 | 37.991 | |||
| Visibility | 0.456 | 58.261 | |||
| Natural ecology | 0.522 | 521.977 | Ecological zoning map | 0.228 | 118.918 |
| Vegetation (Age Class) | 0.191 | 99.942 | |||
| Water system | 0.122 | 63.811 | |||
| Species diversity | 0.458 | 239.306 | |||
| Land use | 0.150 | 150.267 | Forest wetland area | 0.461 | 69.222 |
| Land ownership | 0.221 | 33.241 | |||
| Development feasibility | 0.318 | 47.804 | |||
| Accessibility | 0.095 | 94.655 | Distance to city | 0.463 | 43.870 |
| Distance to access road | 0.537 | 50.784 | |||
| Tourist attraction | 0.105 | 105.473 | Number of nearby tourists | 0.362 | 38.224 |
| Number of nearby tourist destination | 0.148 | 15.558 | |||
| Number of nearby cultural heritage | 0.202 | 21.333 | |||
| Proximity to national park | 0.262 | 27.684 | |||
| Total | 1.000 | 1000.000 | - | 4.975 | 997.325 |
| Region (Serial Number) | Assessment Criteria | Synthesis | Ranking | ||||
|---|---|---|---|---|---|---|---|
| Natural Landscape | Natural Ecology | Land Use | Accessibility | Tourist Attraction | |||
| Gyeongbuk 2017_04 | 104.323 | 430.344 | 76.316 | 58.175 | 97.262 | 766.420 | 2 |
| Gyeongbuk 2017_06 | 85.496 | 450.332 | 76.316 | 84.497 | 66.530 | 763.173 | 3 |
| Gyeongbuk 2017_12 | 86.395 | 485.431 | 90.160 | 65.566 | 32.471 | 760.024 | 5 |
| Gyeongbuk 2017_38 | 88.228 | 450.332 | 76.313 | 66.949 | 70.328 | 752.153 | 6 |
| Gyeongbuk 2017_44 | 127.627 | 376.947 | 108.734 | 94.654 | 54.301 | 762.263 | 4 |
| Gyeongbuk 2017_52 | 101.204 | 402.471 | 103.457 | 75.723 | 47.811 | 730.666 | 15 |
| Gyeongbuk 2018_07 | 85.072 | 450.332 | 76.316 | 68.332 | 61.629 | 741.681 | 9 |
| Gyeongbuk 2018_13 | 67.145 | 441.365 | 117.301 | 48.018 | 64.791 | 738.621 | 10 |
| Gyeongbuk 2018_18 | 93.180 | 437.570 | 131.145 | 18.931 | 53.717 | 734.544 | 11 |
| Chungbuk 2017_05 | 90.959 | 389.709 | 131.145 | 68.332 | 94.266 | 774.411 | 1 |
| Chungbuk 2017_06 | 90.959 | 376.947 | 117.301 | 68.332 | 94.266 | 747.805 | 8 |
| Chungbuk 2017_19 | 106.156 | 393.504 | 117.849 | 48.018 | 86.621 | 752.148 | 7 |
| Chungbuk 2017_20 | 91.773 | 389.709 | 136.971 | 75.723 | 38.008 | 732.183 | 14 |
| Chungbuk 2017_32 | 64.026 | 465.443 | 95.437 | 48.018 | 60.993 | 733.918 | 12 |
| Chungbuk 2017_34 | 106.156 | 356.958 | 150.267 | 46.636 | 73.439 | 733.456 | 13 |
| Criteria | Cluster Type (Percent Occupied) | ANOVA Test | |||
|---|---|---|---|---|---|
| 1 Cluster (37.6%) | 2 Cluster (40.9%) | 3 Cluster (21.51%) | F | Sig | |
| Natural landscape | 73.4 | 73.8 | 88.9 | 4.917 | 0.009 ** |
| Natural ecology | 387.1 | 322.1 | 259.7 | 151.055 | 0.000 ** |
| Land use | 97.0 | 118.0 | 113.1 | 11.340 | 0.000 ** |
| Accessibility | 61.8 | 57.5 | 59.2 | 0.943 | 0.393 |
| Tourist attraction | 54.8 | 65.5 | 54.4 | 3.957 | 0.023 * |
© 2019 by the authors. Licensee MDPI, Basel, Switzerland. This article is an open access article distributed under the terms and conditions of the Creative Commons Attribution (CC BY) license (http://creativecommons.org/licenses/by/4.0/).
Share and Cite
Yun, H.J.; Kang, D.J.; Kim, D.-K.; Kang, Y. A GIS-Assisted Assessment and Attribute-Based Clustering of Forest Wetland Utility in South Korea. Sustainability 2019, 11, 4632. https://doi.org/10.3390/su11174632
Yun HJ, Kang DJ, Kim D-K, Kang Y. A GIS-Assisted Assessment and Attribute-Based Clustering of Forest Wetland Utility in South Korea. Sustainability. 2019; 11(17):4632. https://doi.org/10.3390/su11174632
Chicago/Turabian StyleYun, Hee Jeong, Dong Jin Kang, Dong-Kap Kim, and Youngeun Kang. 2019. "A GIS-Assisted Assessment and Attribute-Based Clustering of Forest Wetland Utility in South Korea" Sustainability 11, no. 17: 4632. https://doi.org/10.3390/su11174632
APA StyleYun, H. J., Kang, D. J., Kim, D.-K., & Kang, Y. (2019). A GIS-Assisted Assessment and Attribute-Based Clustering of Forest Wetland Utility in South Korea. Sustainability, 11(17), 4632. https://doi.org/10.3390/su11174632