Article

Spatial Heterogeneity of the Carbon Emission Effect Resulting from Urban Expansion among Three Coastal Agglomerations in China

1
School of Public Management, Guangdong University of Finance & Economics, Guangzhou 510320, China
2
School of Geography & Ocean Sciences, Nanjing University, Nanjing 210023, China
3
Beijing GEOWAY Software Co., Ltd., Beijing 100043, China
4
School of Geographical Sciences, Guangzhou University, Guangzhou 510006, China
*
Author to whom correspondence should be addressed.
Sustainability 2019, 11(17), 4590; https://doi.org/10.3390/su11174590
Submission received: 10 July 2019 / Revised: 19 August 2019 / Accepted: 19 August 2019 / Published: 23 August 2019

Abstract

:
Land-use change, particularly urban expansion, can greatly affect the carbon balance, both from the aspects of terrestrial ecosystems and anthropogenic carbon emissions. Coastal China is a typical region of rapid urban expansion, and obvious spatial heterogeneity exists from the north to south. However, the different urban change characteristics and the effect on carbon balance remain undetermined. By unifying the spatial-temporal resolution of carbon source and sink data, we effectively compared the carbon budgets of three coastal urban agglomerations in China. The results show that all of the three urban agglomerations have undergone an obvious urban expansion process, with the built-up area increasing from 1.03 × 10⁴ km2 in 2000 to 3.06 × 10⁴ km2 in 2013. For Beijing–Tianjin–Hebei (BTH), the built-up area gradually expanded. The built-up area in the Yangtze River Delta (YRD) gradually changed before 2007 but rapidly grew thereafter. The built-up expansion of the Pearl River Delta (PRD) passed through three growing stages and showed the largest mean patch size. Carbon emission spatial patterns in the three urban agglomerations are consistent with their economic development, from which the net ecosystem production (NEP) spatial patterns are very different. Compared to carbon emissions, NEP has a carbon sink effect and can absorb some carbon emissions, but the amounts were all much lower than the carbon emissions in the three urban agglomerations. The carbon sink effect in the Yangtze River Delta is the most obvious, with the Pearl River Delta following, and the lowest effect is in Beijing–Tianjin–Hebei. Finally, a scientific basis for policy-making is provided for viable CO2 emission mitigation policies.

1. Introduction

The carbon cycle is a main driver of global change [1]. The expanding mass-energy exchange on the land surface has accelerated the asymmetry of the carbon cycle. More carbon emissions and less carbon absorption has resulted in increasingly negative impacts on the global climate and environment [2,3,4]. In addition to natural factors, global warming is closely related to CO2 (carbon dioxide) emissions produced by human socio-economic activities [5,6]. According to the IPCC (Intergovernmental Panel on Climate Change) 5th Assessment Report, approximately 816 ± 124 Gt CO2 of anthropogenic CO2 emissions have not been absorbed and remain in the atmosphere, probably resulting in the observed warming since the mid-20th century. Improving the carbon sequestration of terrestrial ecosystems and reducing greenhouse gas emissions are internationally recognized as two of the crucial ways to mitigate climate change [7,8]. As centres of economic activities, population migration, and energy consumption, urban areas play a significant role in addressing CO2 emissions and global climate change [9], particularly in rapidly developing countries [10,11]. It has been reported that 2% of the global land in urban areas includes more than 50% of the world’s population and approximately 75% of the global carbon emissions [12,13]. Thus, examination of the carbon budget in rapidly expanding urban regions is necessary.
Under the government’s reform and opening-up policies since 1978, China is undergoing rapid urbanization, industrial processes and land-use/-cover change. Built-up land, where highly populated, has dramatically expanded and occupied large areas of ecological land, especially in coastal regions [14,15,16]. The process has threatened China’s sustainable development and the long-term stability of the global climate, which has raised global concerns [17]. As the expansion rate is still rapidly accelerating and has increasingly high carbon emissions intensity, China is encountering intense pressure to reduce its CO2 emissions [18]. Yangtze River Delta (YRD), Pearl River Delta (PRD) and Beijing–Tianjin–Hebei (BTH) are three of the coastal urban agglomerations in China. As population growth and economic development are concentrated, these regions contribute most to CO2 release with significant land-use and land-cover change [19,20,21]. Zha et al. found that CO2 release is higher in urban land than in rural land [22]. CO2 concentration would increase when forestry lands convert to agriculture [23]. Meanwhile, the three urban agglomerations are distinguished by different natural conditions and socio-economic development. For natural conditions, YRD locates by China’s greatest river with mild climate; climate is dry in BTH with worse vegetation growth; while vegetation carbon fixation is the best in PRD with synchronous rain and heat. For socio-economic development, the urbanization process is rapid, and urban development is quite even in YRD; BTH shows lower urban industrial land-use efficiency; and city clusters are most obvious in PRD [24,25,26]. It is significant and feasible to discuss how the natural and man-made factors affect the carbon sources and sinks for possible low carbon development strategies in the three urban agglomerations. There is an impressive and growing literature regarding carbon sources and sinks in these three urban agglomerations [19,20,21,27,28,29]. However, currently, there seem to be no comparable studies that present the same methodology and same data source.
Different data sources have been collected to examine carbon sources and sinks, including field measurements, government statistics and optical remote sensing data. Morton and Andreas attempted to improve the field measurement of the net ecosystem exchange CO2 flux to identify peatlands acting as either a net CO2 uptake or release [30]. Using field measurements, many studies have focused on carbon flux calculation to explore carbon sources and sinks in different single ecosystems of a specific type, but these studies are limited in data size and field scale and fail to be directly compared [31,32]. Rahman and Kashem provided the possibility to examine the relationships between carbon emissions, energy consumption and industrial growth in Bangladesh using economic data from the Word Development Indicator and the Central Bank of Bangladesh [33]. Socio-economic statistics published by governments has enabled the use of a top-down method to estimate carbon emissions, but the lack of spatial distribution and the inconsistency of the statistics quality lead to lower data mining accessibility and comparability [34].
Distinctly advantageous for detecting spatial-temporal variation and capturing data at a large scale, data from remote sensing aids research on carbon source and sink more objectively and effectively. It is remote-sensing capabilities that a large number of researchers have previously focused on in studying carbon sources and sinks. Chuai et al. examined the net ecosystem production (NEP) trend, an indicator of whether an ecosystem can fix or release carbon from or into the atmosphere using Moderate Resolution Imaging Spectroradiometer data, meteorological data, and soil organic carbon data [35]. Abdalla and Fadul assessed the relationship between green cover and carbon emissions from cars using remote-sensing data from Landsat and Quick Bird satellites [36]. Meng et al. used nighttime light imagery and statistical energy data to estimate CO2 emissions [37]. All of these studies either targeted the entirety of China or separately investigated only one of the regions for NEP or carbon emissions. It is still missing that a comprehensive analysis of carbon budgets examination for both socially and physically derived carbon in spatial dimension.
Our overall objective was the presentation of an analytical framework to study the spatial and temporal pattern of regional carbon budgets in the three urban agglomerations. By unifying the spatial-temporal resolution of carbon source and sink data, attempts are made to compare carbon budgets in different urban agglomerations to enhance the understanding of the natural-human dual structure of carbon effects. Then, a scientific basis for policy-making is provided for viable CO2 emission mitigation policies. The next section addresses the study areas and data sources. The third section introduces the study methods, including urban information extraction, NEP calculation, carbon emission calculation, carbon budgets calculation and spatial statistics. Then we come to the results on the urban expansion characteristics, carbon budgets statistics and spatial patterns of the three urban agglomerations. Finally, we discuss and draw conclusions.

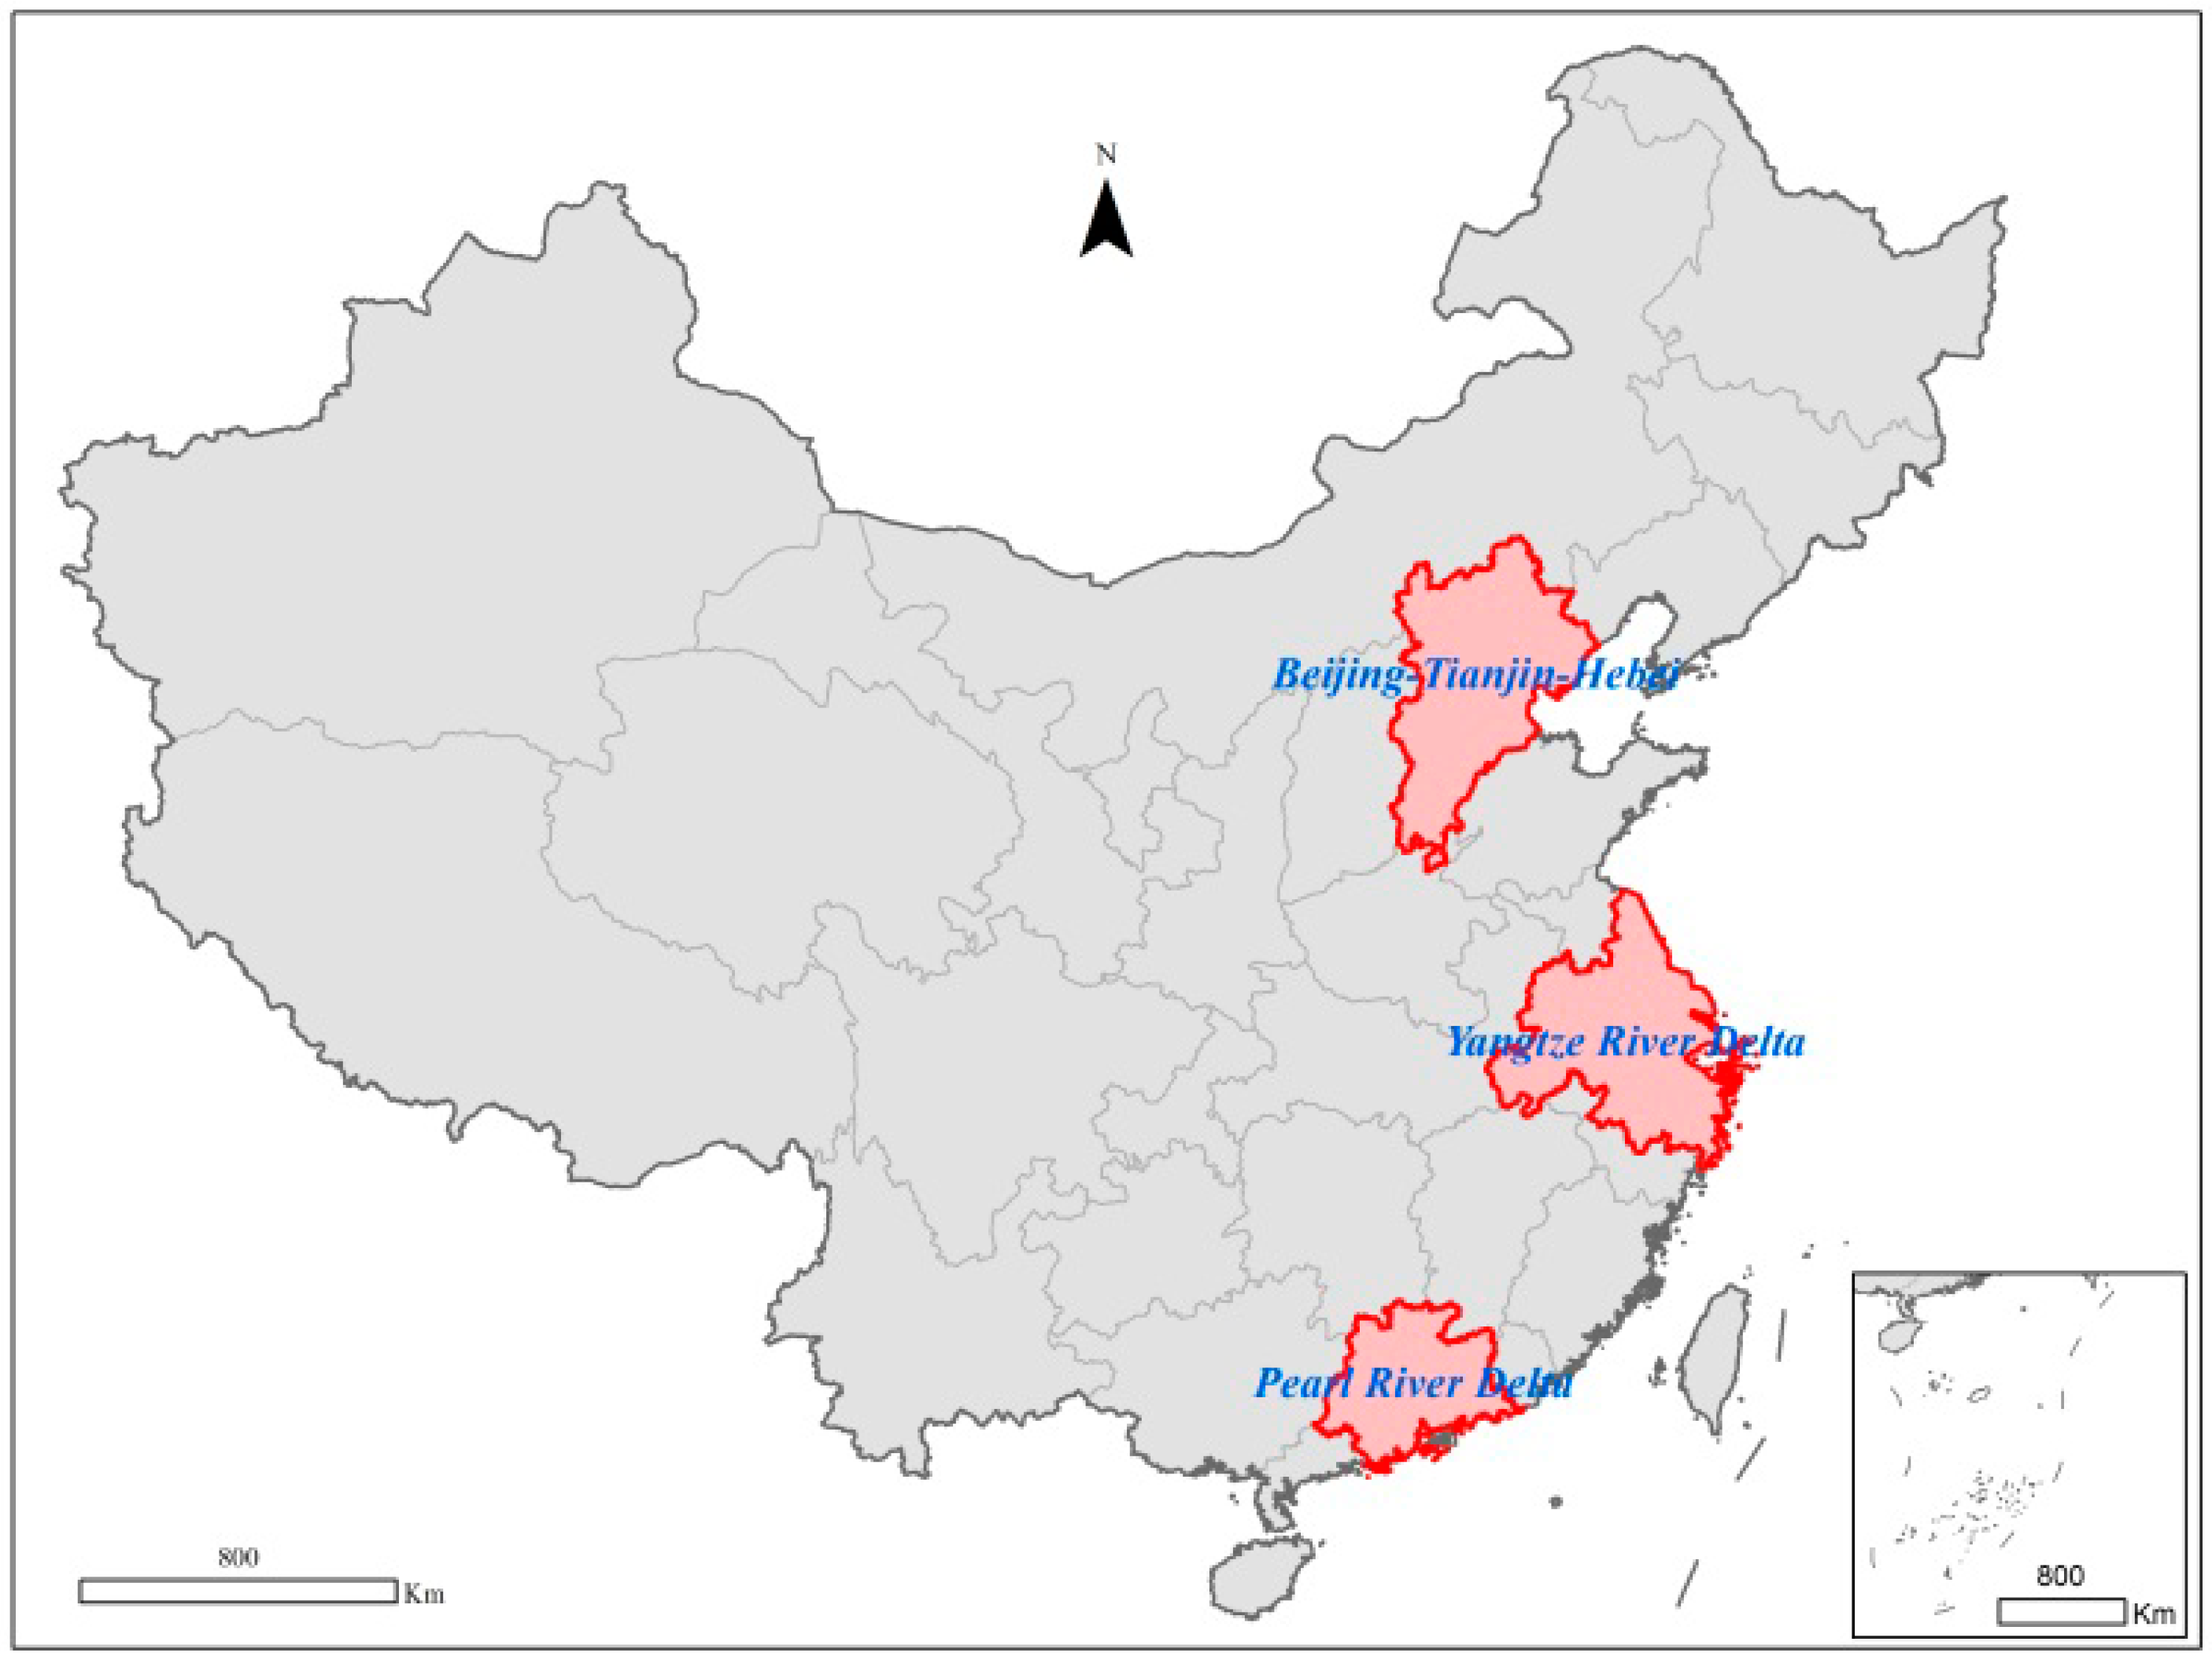
2. Study Areas and Data Sources

YRD, PRD and BTH are three of the coastal urban agglomerations in China (Figure 1), which contribute most to CO2 emissions with significant land-use and land-cover change. Occupying a very important strategic position in China’s modernization and opening up, the YRD is composed of 26 cities, including the Shanghai city and another 25 cities of the Jiangsu, Zhejiang, and Anhui provinces. The PRD is formed mainly by 14 cities of the Guangdong Province in Southern China, characterized by economic vitality and technological innovation. BTH, in Northern China, is the political and cultural centre of the nation, including the cities of Beijing and Tianjin and the whole of Hebei Province.
The annual Moderate Resolution Imaging Spectroradiometer(MODIS) net primary productivity (NPP) data from 2000 to 2013 used in this study were downloaded from the Numerical Terradynamic Simulation Group (NTSG) at the University of Montana (http://www.ntsg.umt.edu/). The dataset is in a TIF format and has a resolution of 30-arcsec (approximately 1-km). A detailed description of the NPP model calculation process can be obtained from Zhang et al. [38]. The accuracy of the product has been validated as being consistent with field-observed NPP data [39]. We extracted the global map with the overlay of the study areas. Meteorological data (precipitation and temperature) observed at 745 national basic meteorological stations in China were provided by the China Meteorological Data website (http://data.cma.cn/). The 2000–2013 annual nighttime light images originated from the Operational Linescan System (OLS) aboard the American Defense Meteorological Satellite (DMSP). These images were downloaded from the National Geophysical Data Center (NGDC) affiliated with the American National Oceanic and Atmospheric Administration (NOAA) (https://www.ngdc.noaa.gov/). The product contains cloud-free average radiance values that have undergone an outlier removal process to remove fires and other ephemeral lights; grey values range from 1–63, and the resolution is 30 arcsec (approximately 1 km). As nighttime light data slightly vary from different sensors, we adopted the pre-processing approach from Cao to conduct data fusion, image segmentation, irradiance calibration and coordinate translation [40]. The annual energy consumption data of 30 provinces in China from 2000 to 2013 were collected from the China Energy Statistical Yearbook. Maps in the article were all made by using ArcGIS [9.3], (http://www.esri.com/software/arcgis).

3. Methods

3.1. Urban Information Extraction

The nighttime light data originated from OLS is sound source data to monitor human activities and has been used to study carbon emissions in a considerable amount of research, as human activity is the main source of carbon emissions. Many studies indicate that DMSP/OLS nighttime light data correlate with carbon emissions. Moreover, nighttime light data can be applied to urban area extraction. We used the thresholding technique along with ancillary data to extract the urban information of the three urban agglomerations [41]. Liu et al. divided China into eight economic regions, extracting a single threshold for each [41]. The YRD is in Eastern Coastal China, the PRD is in Southern Coastal China and BTH is in Northern Coastal China.

3.2. Net Ecosystem Production (NEP) Calculation

The net ecosystem production (NEP) indicates the carbon fixation capacity of the terrestrial ecosystem over the short term. The NEP depends strongly on climate and vegetation, reflecting the impacts of nature more than man-made impacts [42]. The NEP can be calculated by subtracting the soil heterotrophic respiration (Rh) from the net primary production (NPP) as follows:
NEP = NPP − Rh
where NEP is the annual net ecosystem productivity (gC·m−2.year−1), NPP is the annual net primary productivity (gC·m−2·year−1) directly provided by the MODIS products, and Rh is the annual soil heterotrophic respiration (gC·m−2·year−1) [35].
In this study, Rh was calculated from the relationship between Rs and Rh [35]. We collected Rs and Rh data from up to 101 groups, with the observed years from 1994 to 2013. The data included most ecosystems, with a wide distribution across China. According to the collected data, a linear equation presented the best fitting according to the following formula:
Rh = 0.4679 × Rs + 114.42    R 2 = 0.667
where Rh is the annual soil heterotrophic respiration (gC·m−2·year−1) and Rs is the annual soil respiration (gC·m−2·year−1).
By synthesizing the Rs data set of ChinaFLUX and those published in approximately 200 papers in the literature, Yu et al. established an Rs database of China and developed a new region-scale geostatistical model of soil respiration (GSMSR) by modifying a global-scale statistical model [43]. Based on 333 collected Rs data points, the established model has been validated by 57 Rs data that were not used in the model parametrization. The GMSR presented a better simulation in China; thus, we used this mode on an annual scale as follows:
Rs = ( 0.588 + 0.118 × SOC ) × e ln ( 1.83 × e 0.006 × T ) × T ÷ 10 × ( P + 2.972 ) ÷ ( P + 5.657 ) × 365
where T is the annual mean air temperature (°C), P is the mean monthly precipitation (cm), and SOC is the topsoil (0–20 cm) organic carbon storage density (kg C·m−2). An interpolation method was used to generate precipitation and temperature maps, and the inverse distance method was used to finish the interpolation process and set them as 1 km grid layers. The topsoil (0–20 cm) property data sets were obtained from the 2nd national Soil Survey. The grid SOC density data at a depth of 20 cm were obtained based on interpolation from the 1:4,000,000 SOC density vector data.

3.3. Carbon Emission Calculation

For carbon emission, energy consumption is a main man-made factor [44,45]. Again, the nighttime light data originated from OLS is used to study energy consumption. We investigated the relationships between nighttime light data and energy consumption at the provincial level by regression analysis. The research data covered 30 provinces in China from 2000 to 2013, which offered adequate data size to verify the effectiveness of regression analysis. Consistent with previous studies [46,47,48], we found that the correlation coefficient is highest with a linear fit (R2 = 0.625). And we assumed that the correlation can be transformed from the provincial level to the 1 km2 level. Thus, we produced the annual energy consumption grid maps by allocating the provincial energy consumption in proportion to the nighttime light value of the 1-km2 grid. The formula is as follows:
EC = 115 × NL
where EC is the annual energy consumption of a province (tC·km−2·year−1), and NL is the nighttime light values ranging from 1~63.

3.4. Carbon Budgets Calculation

By calculating the carbon absorption and emission at the same spatial resolution, we tried to subtract them from one another for comparison. The formula is as follows:
CB = NEP − EC
where CB is the carbon budget comparing the carbon absorption and emission (gC·m−2·year−1).

3.5. Spatial Statistics

To investigate the distribution pattern of the grid data, spatial statistical tools in the ArcGIS software were adopted, such as mean patch size, shape index, spatial autocorrelation (Moran’s I), directional distribution (standard deviational ellipse) and cluster and outlier analysis (Anselin Local Moran’s I) [49]. Mean patch size (km2) is defined as the total area of urban patches divided by patch numbers, representing the integrity of the built-up area. The shape index, which is the perimeter to area ratio, can be used to measure the complexity of the patch. Spatial autocorrelation measures spatial autocorrelation based on feature locations and attribute values using the Global Moran’s I statistic. Directional distribution creates standard deviational ellipses to summarize the spatial characteristics of geographic features, such as central tendency, dispersion, and directional trends. Cluster and outlier analysis, given a set of weighted features, statistically identifies significant hot spots and cold spots, which depict high and low value collection areas, respectively, using the Anselin Local Moran’s I statistic. Some papers can be consulted for more information regarding the tools [50,51,52].

4. Results

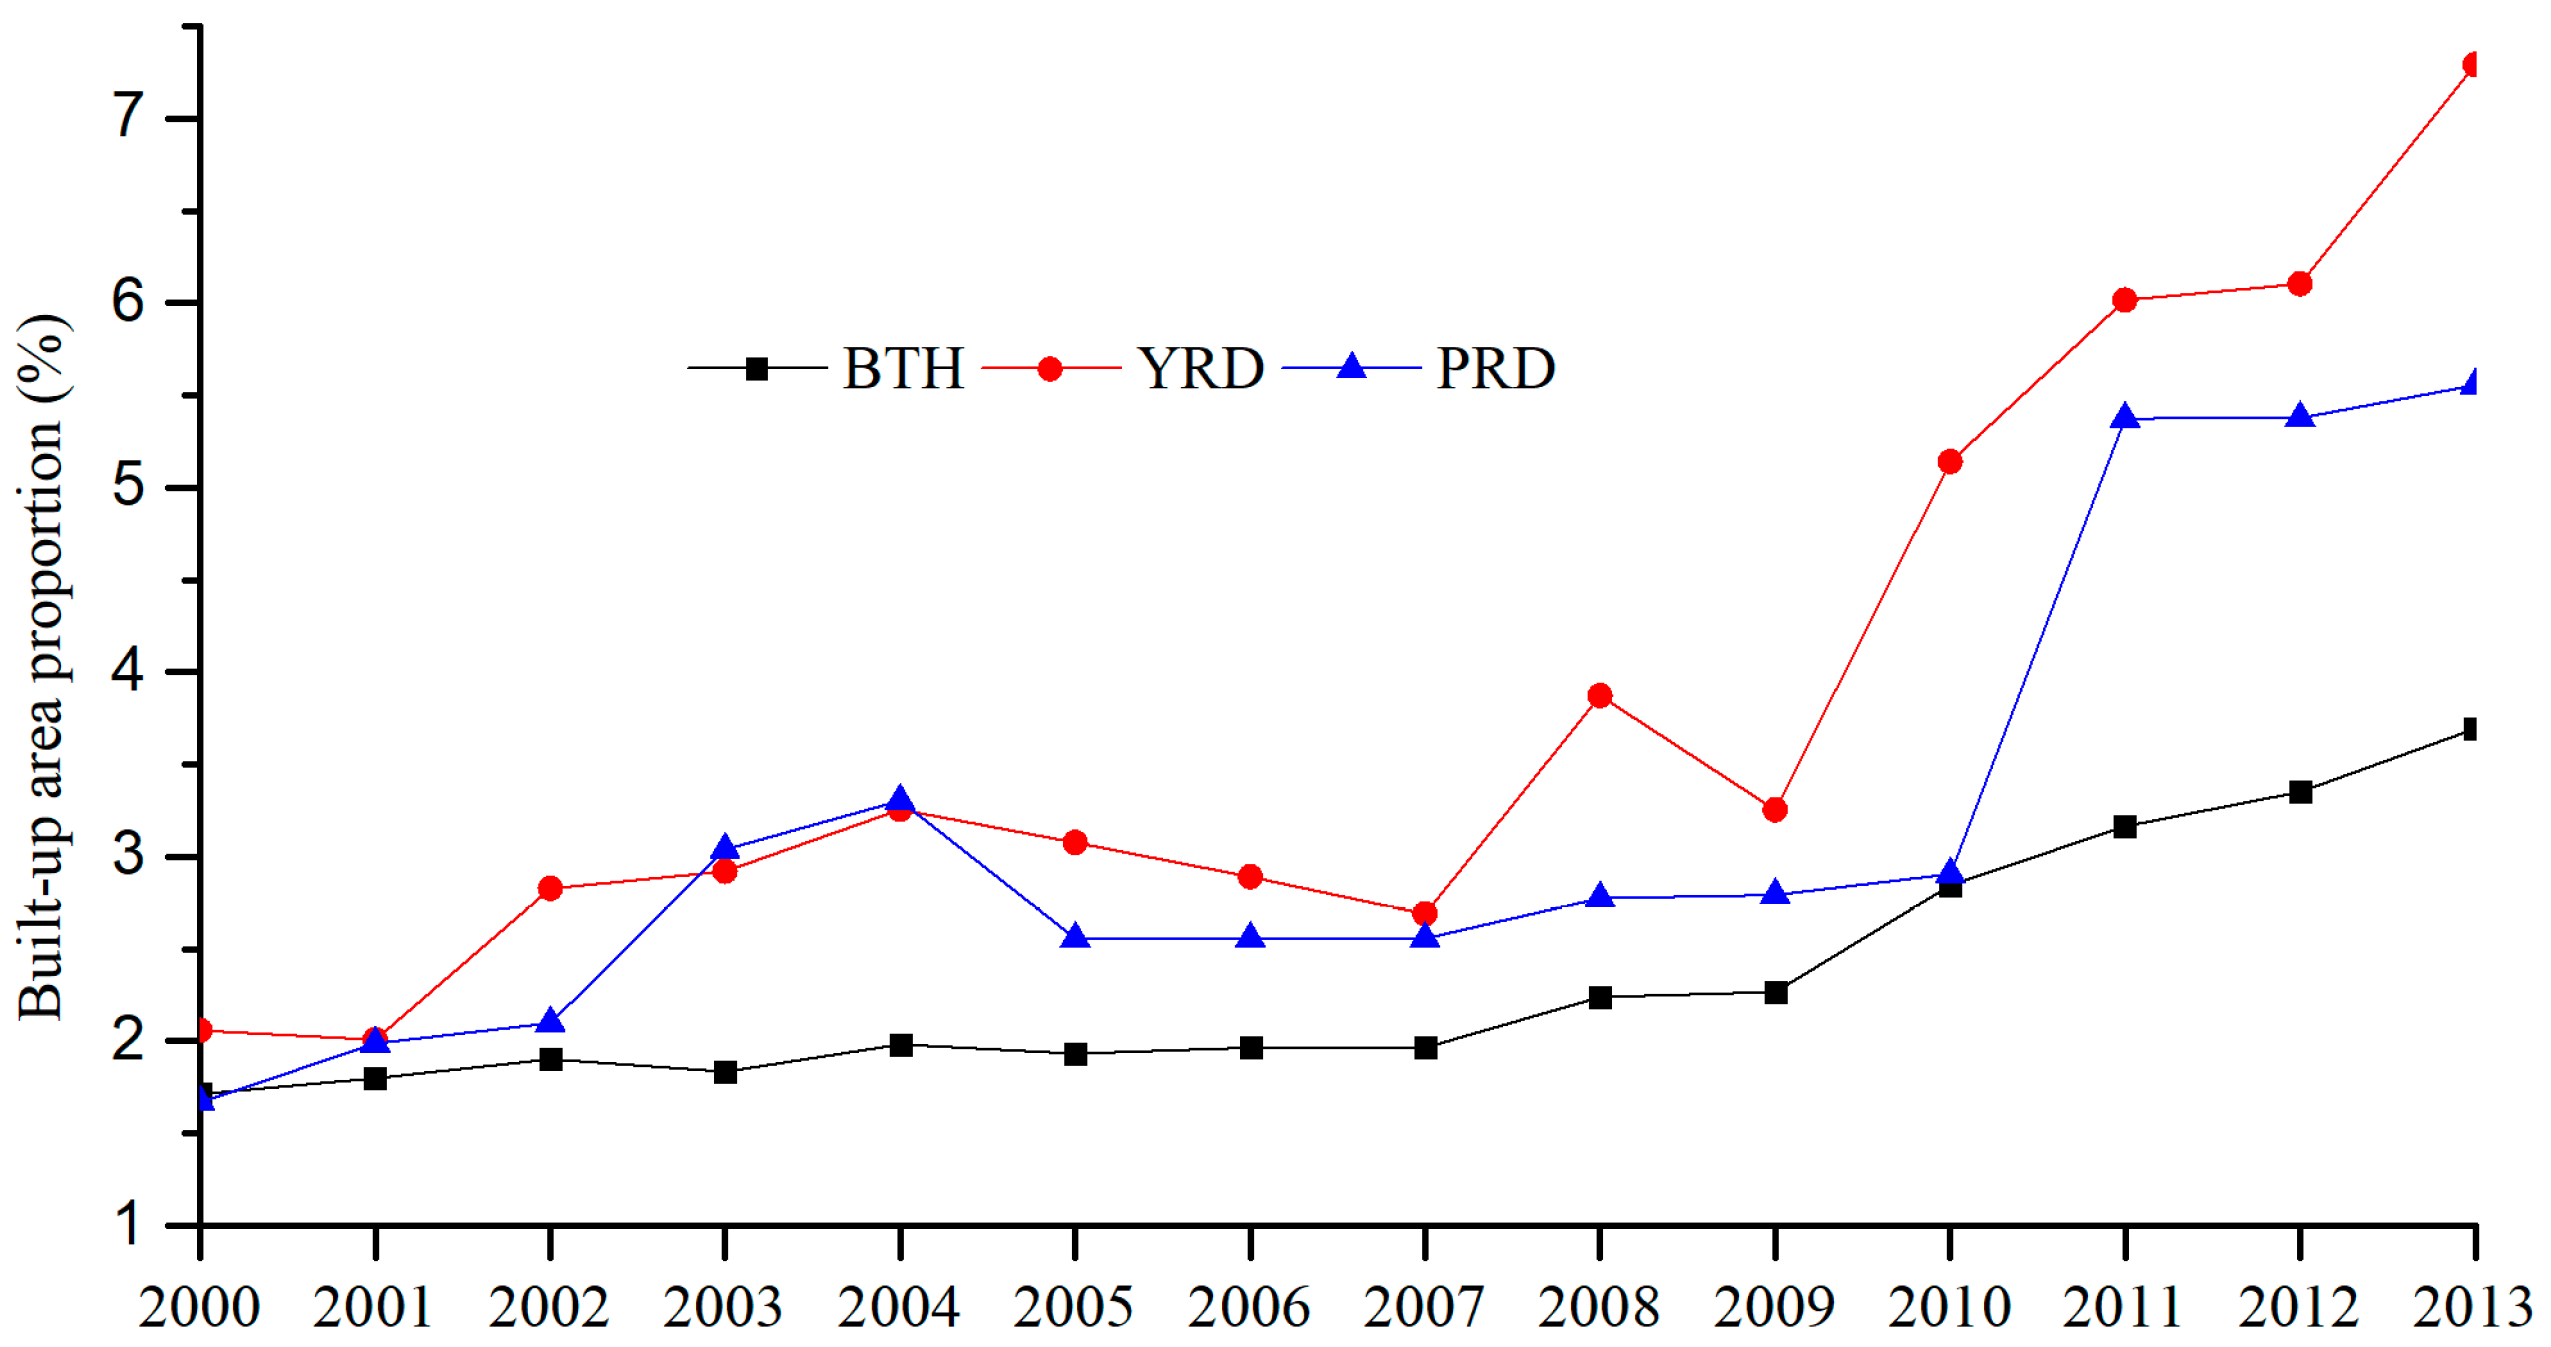
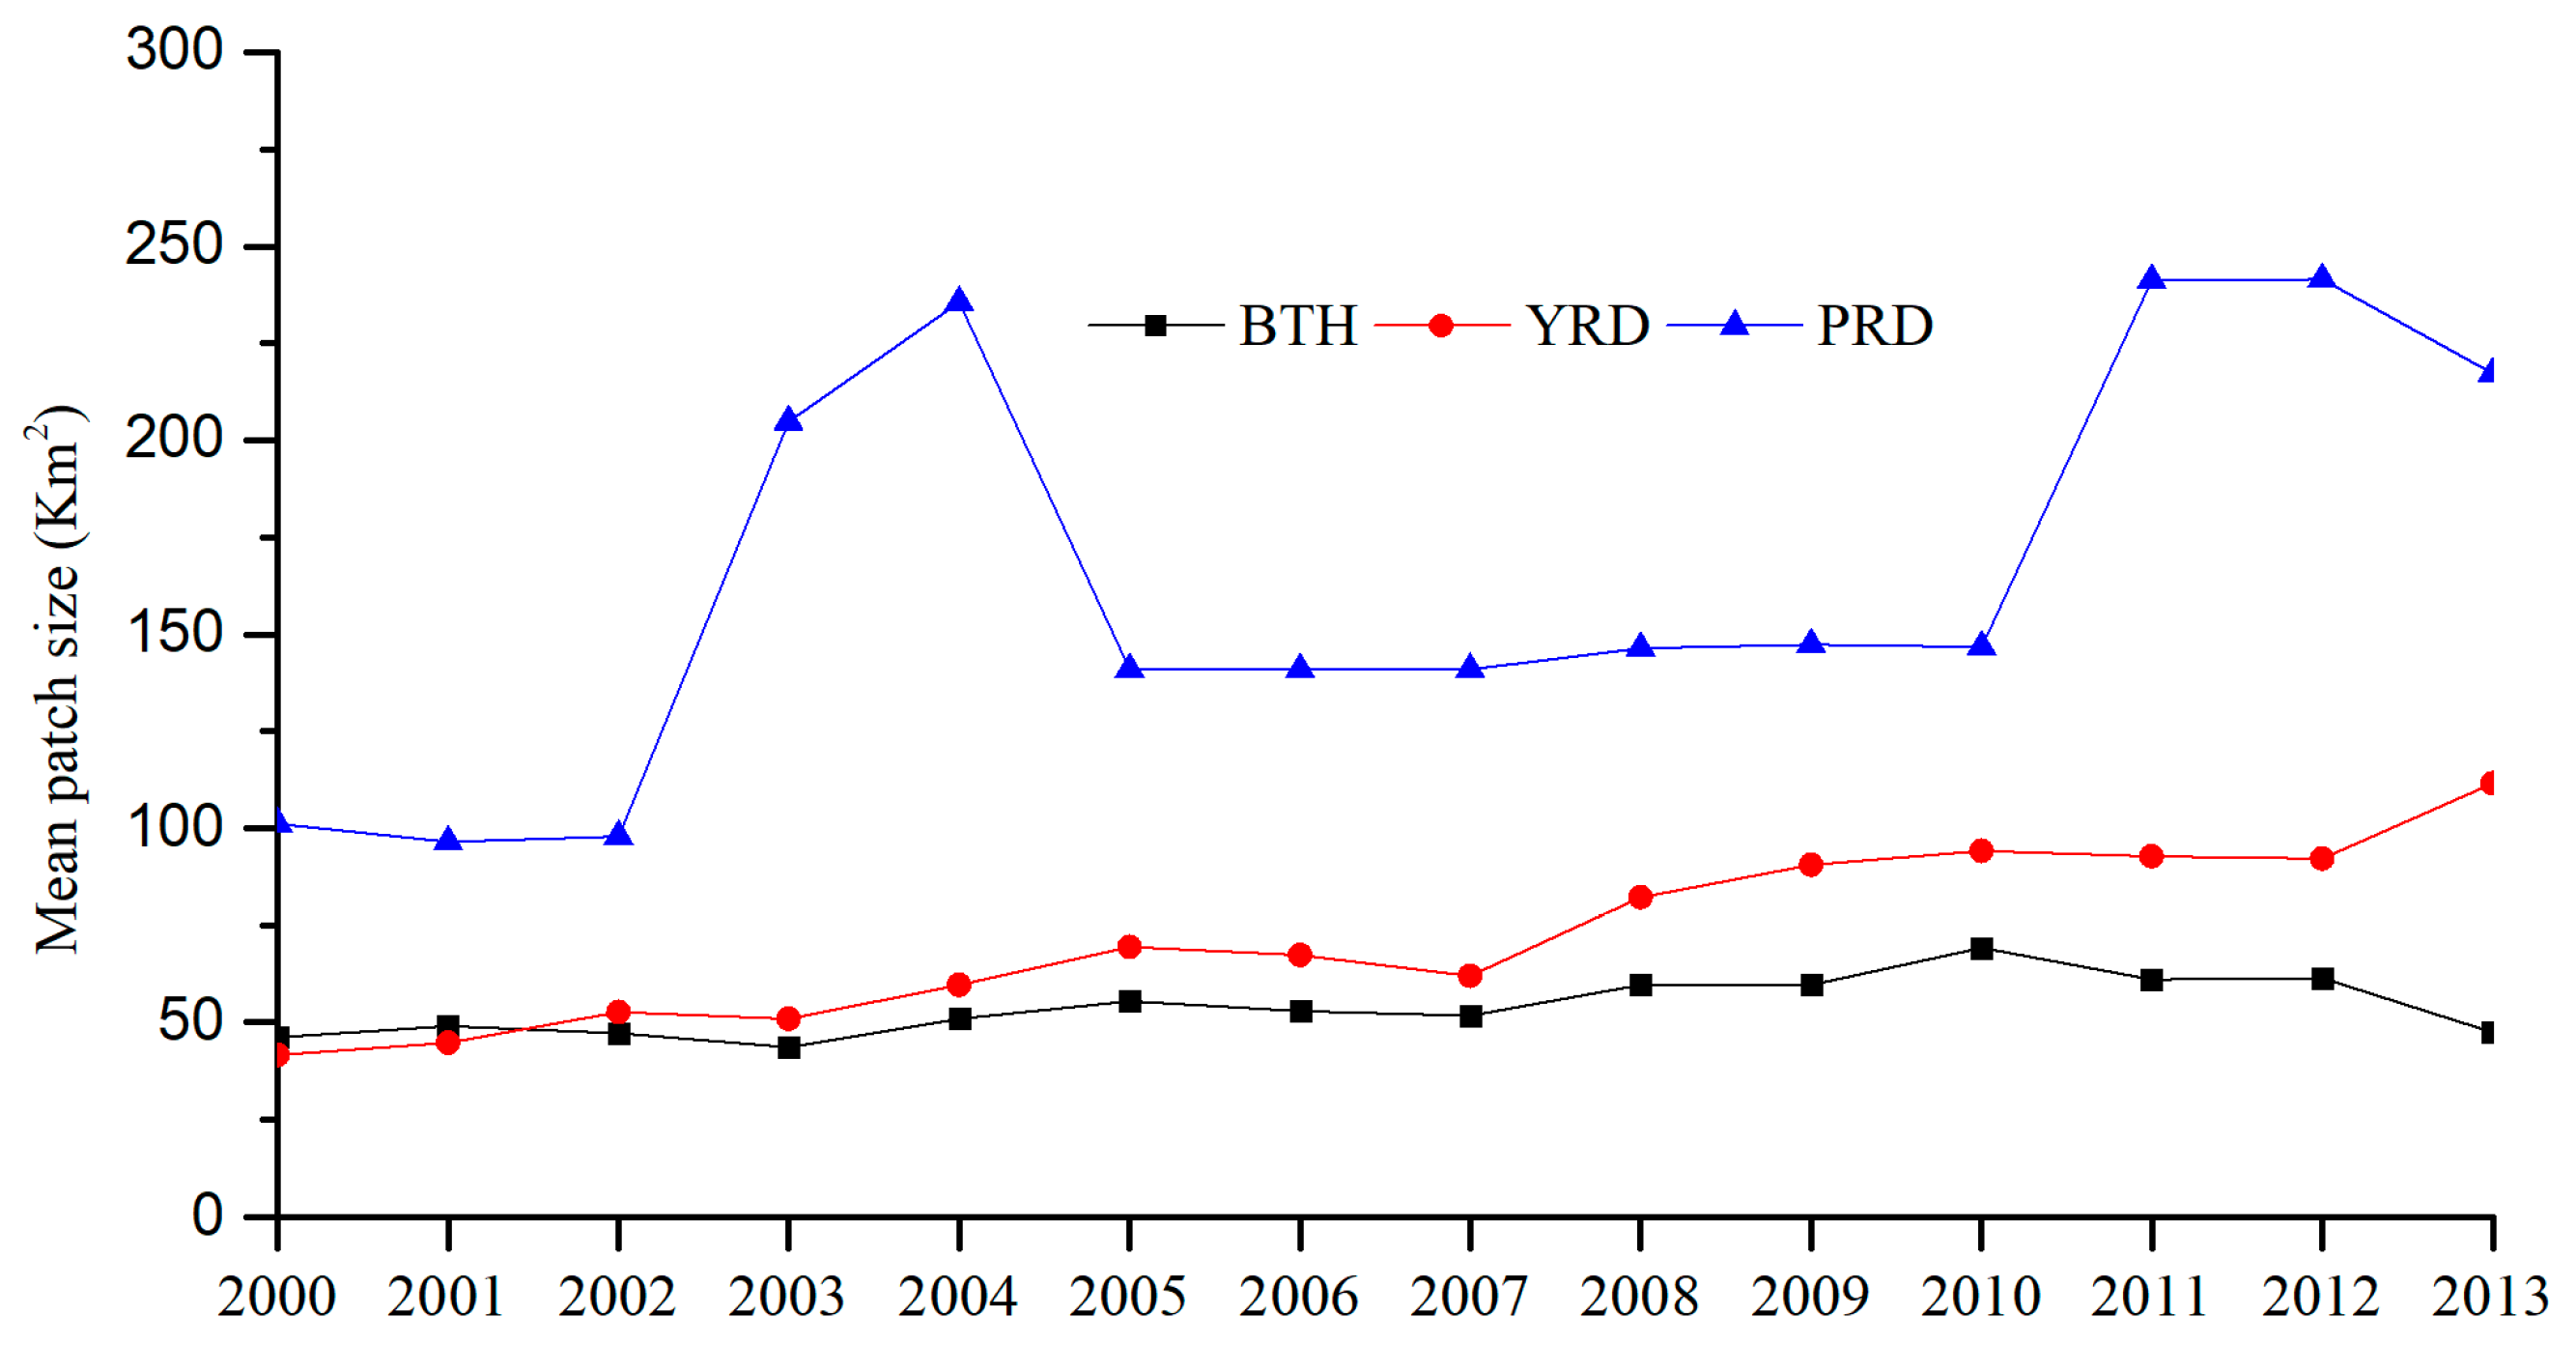
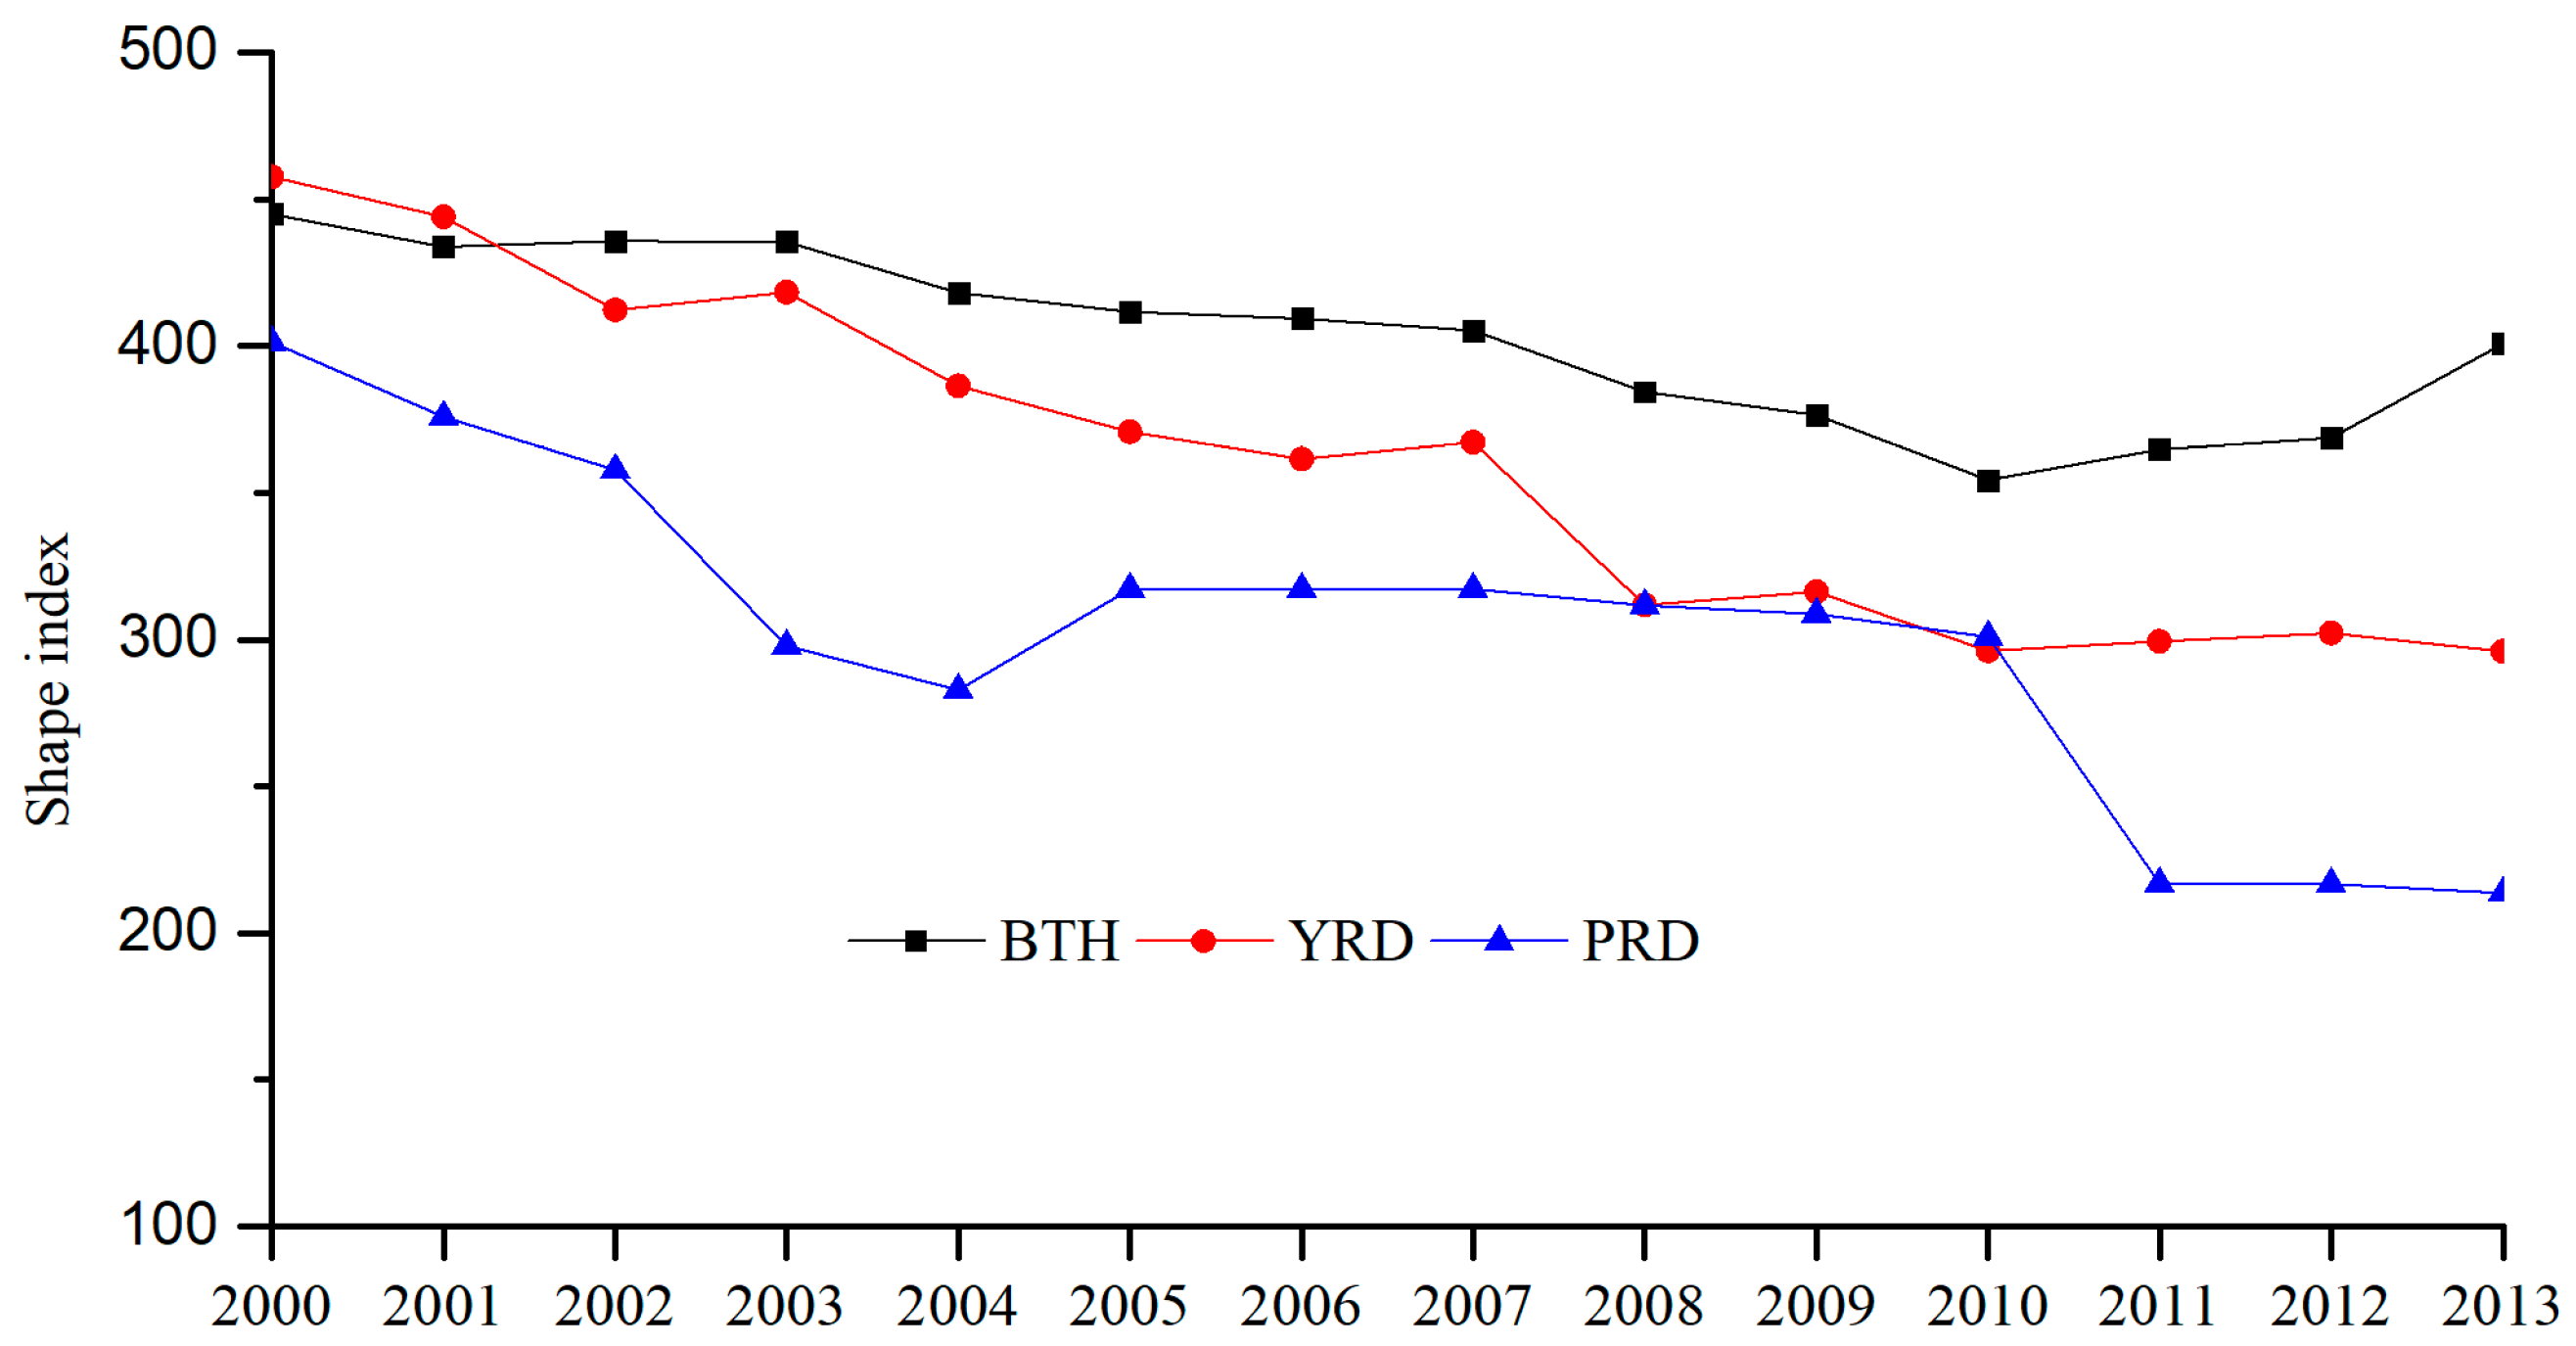
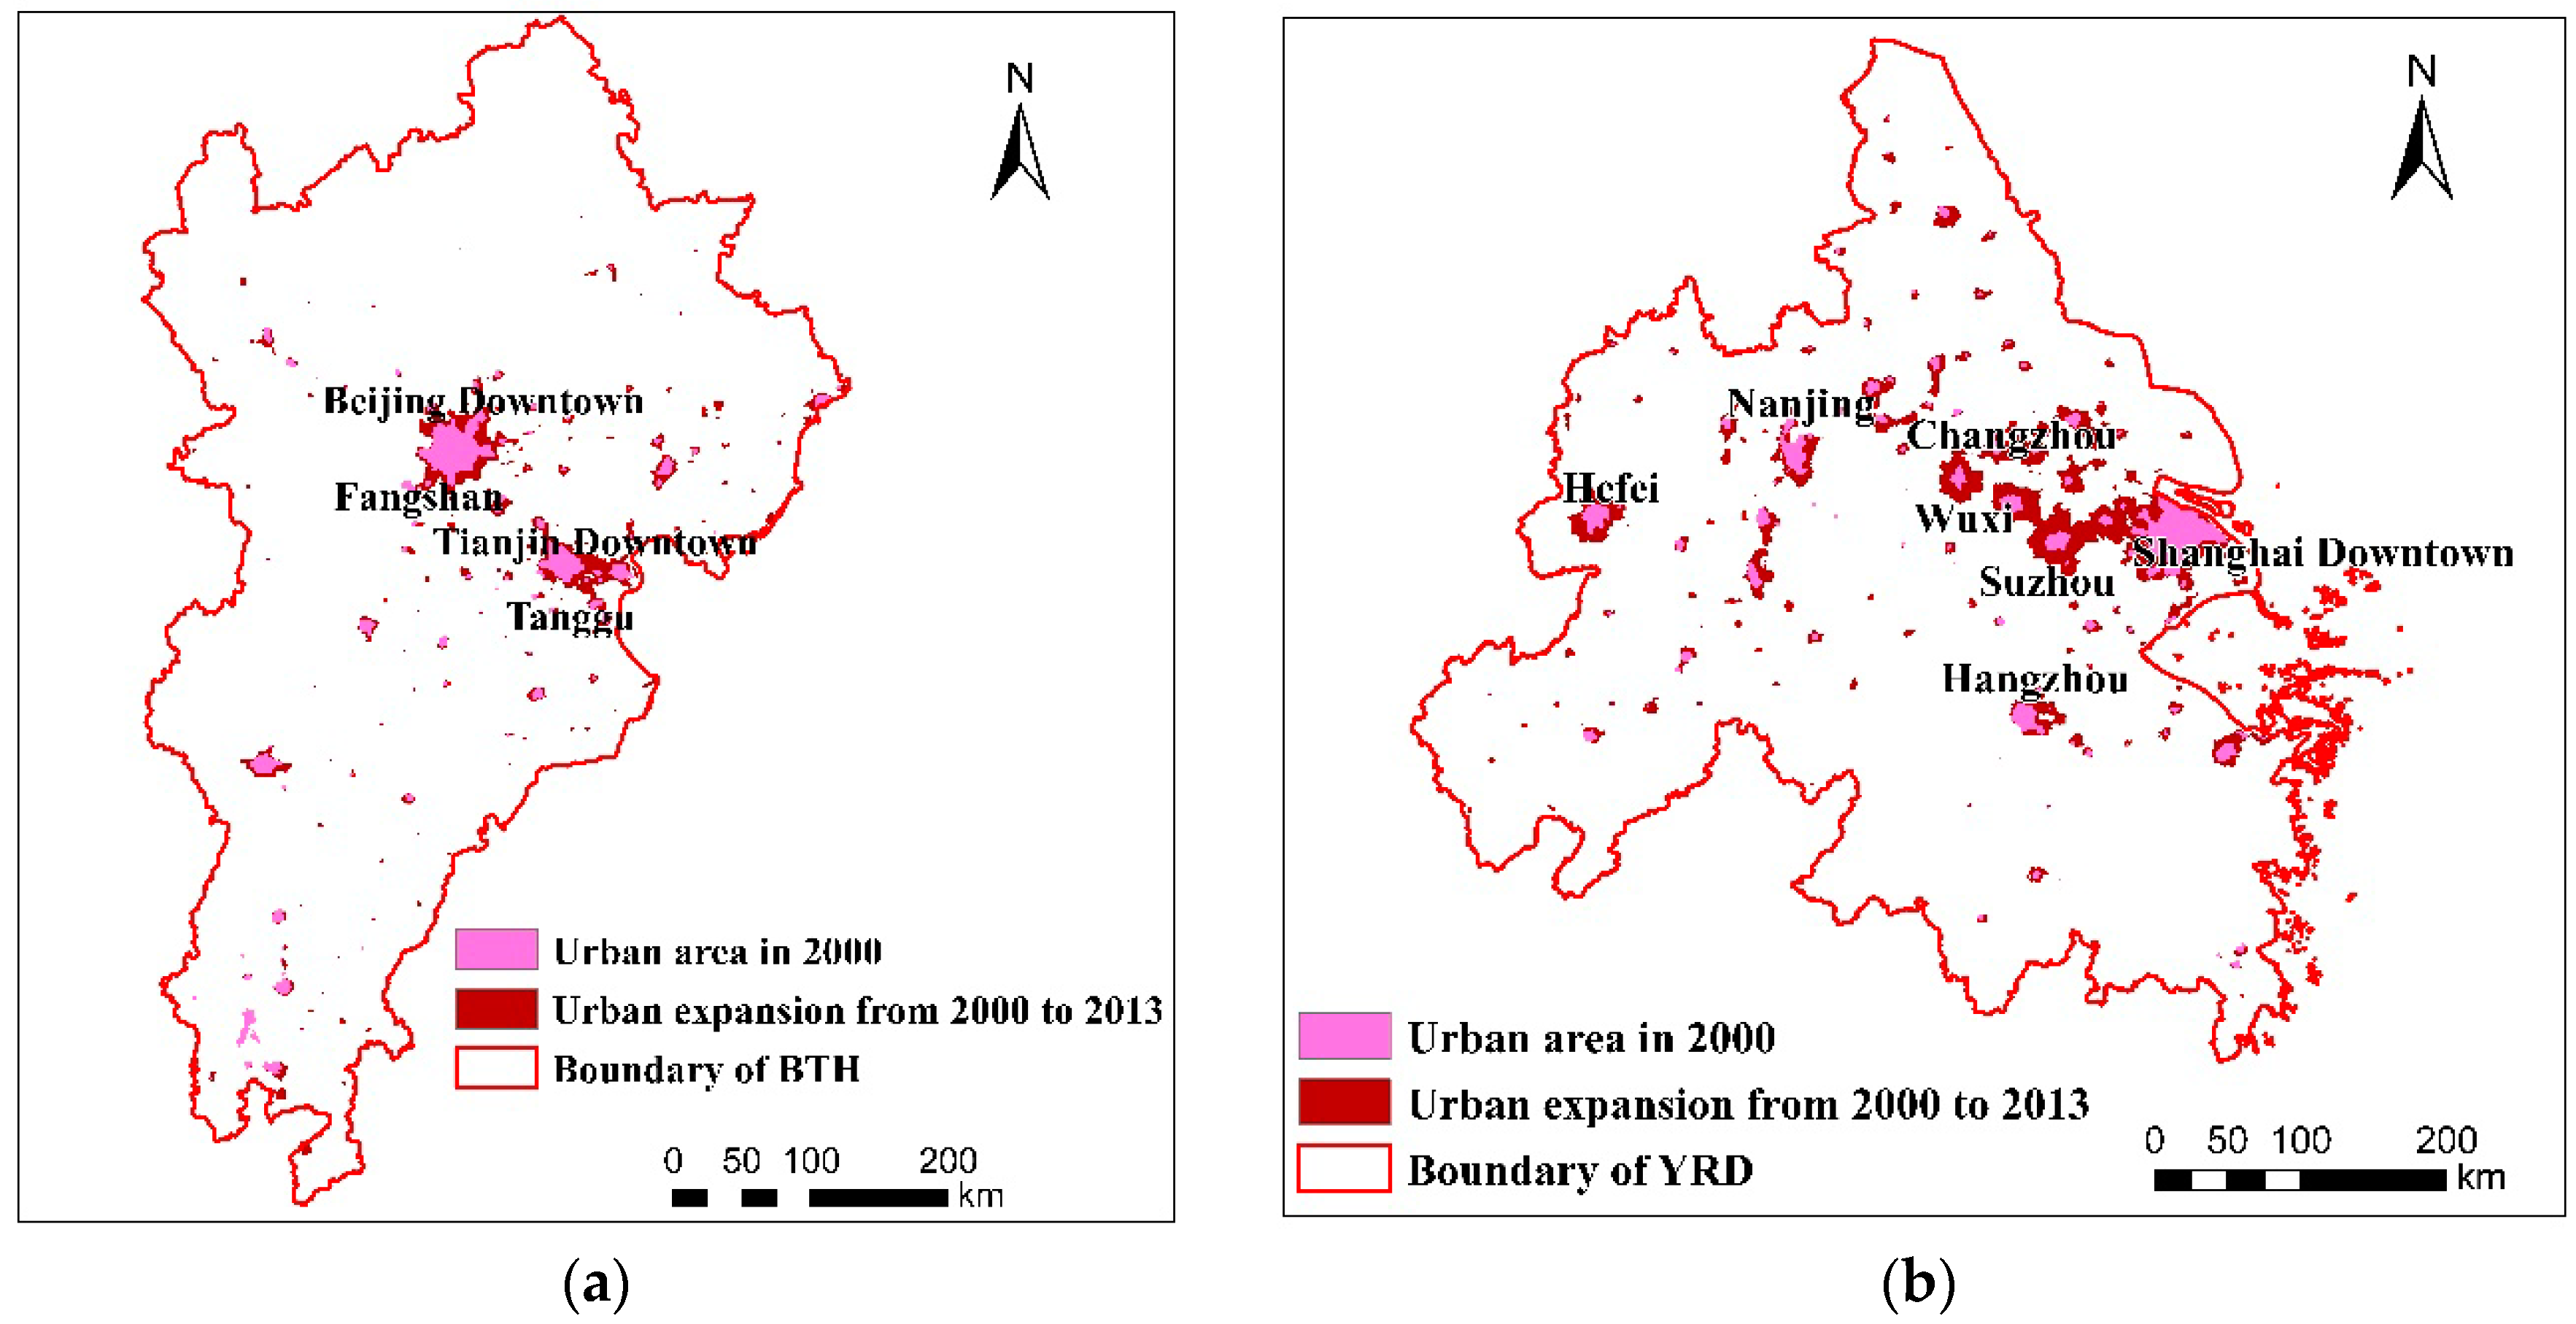
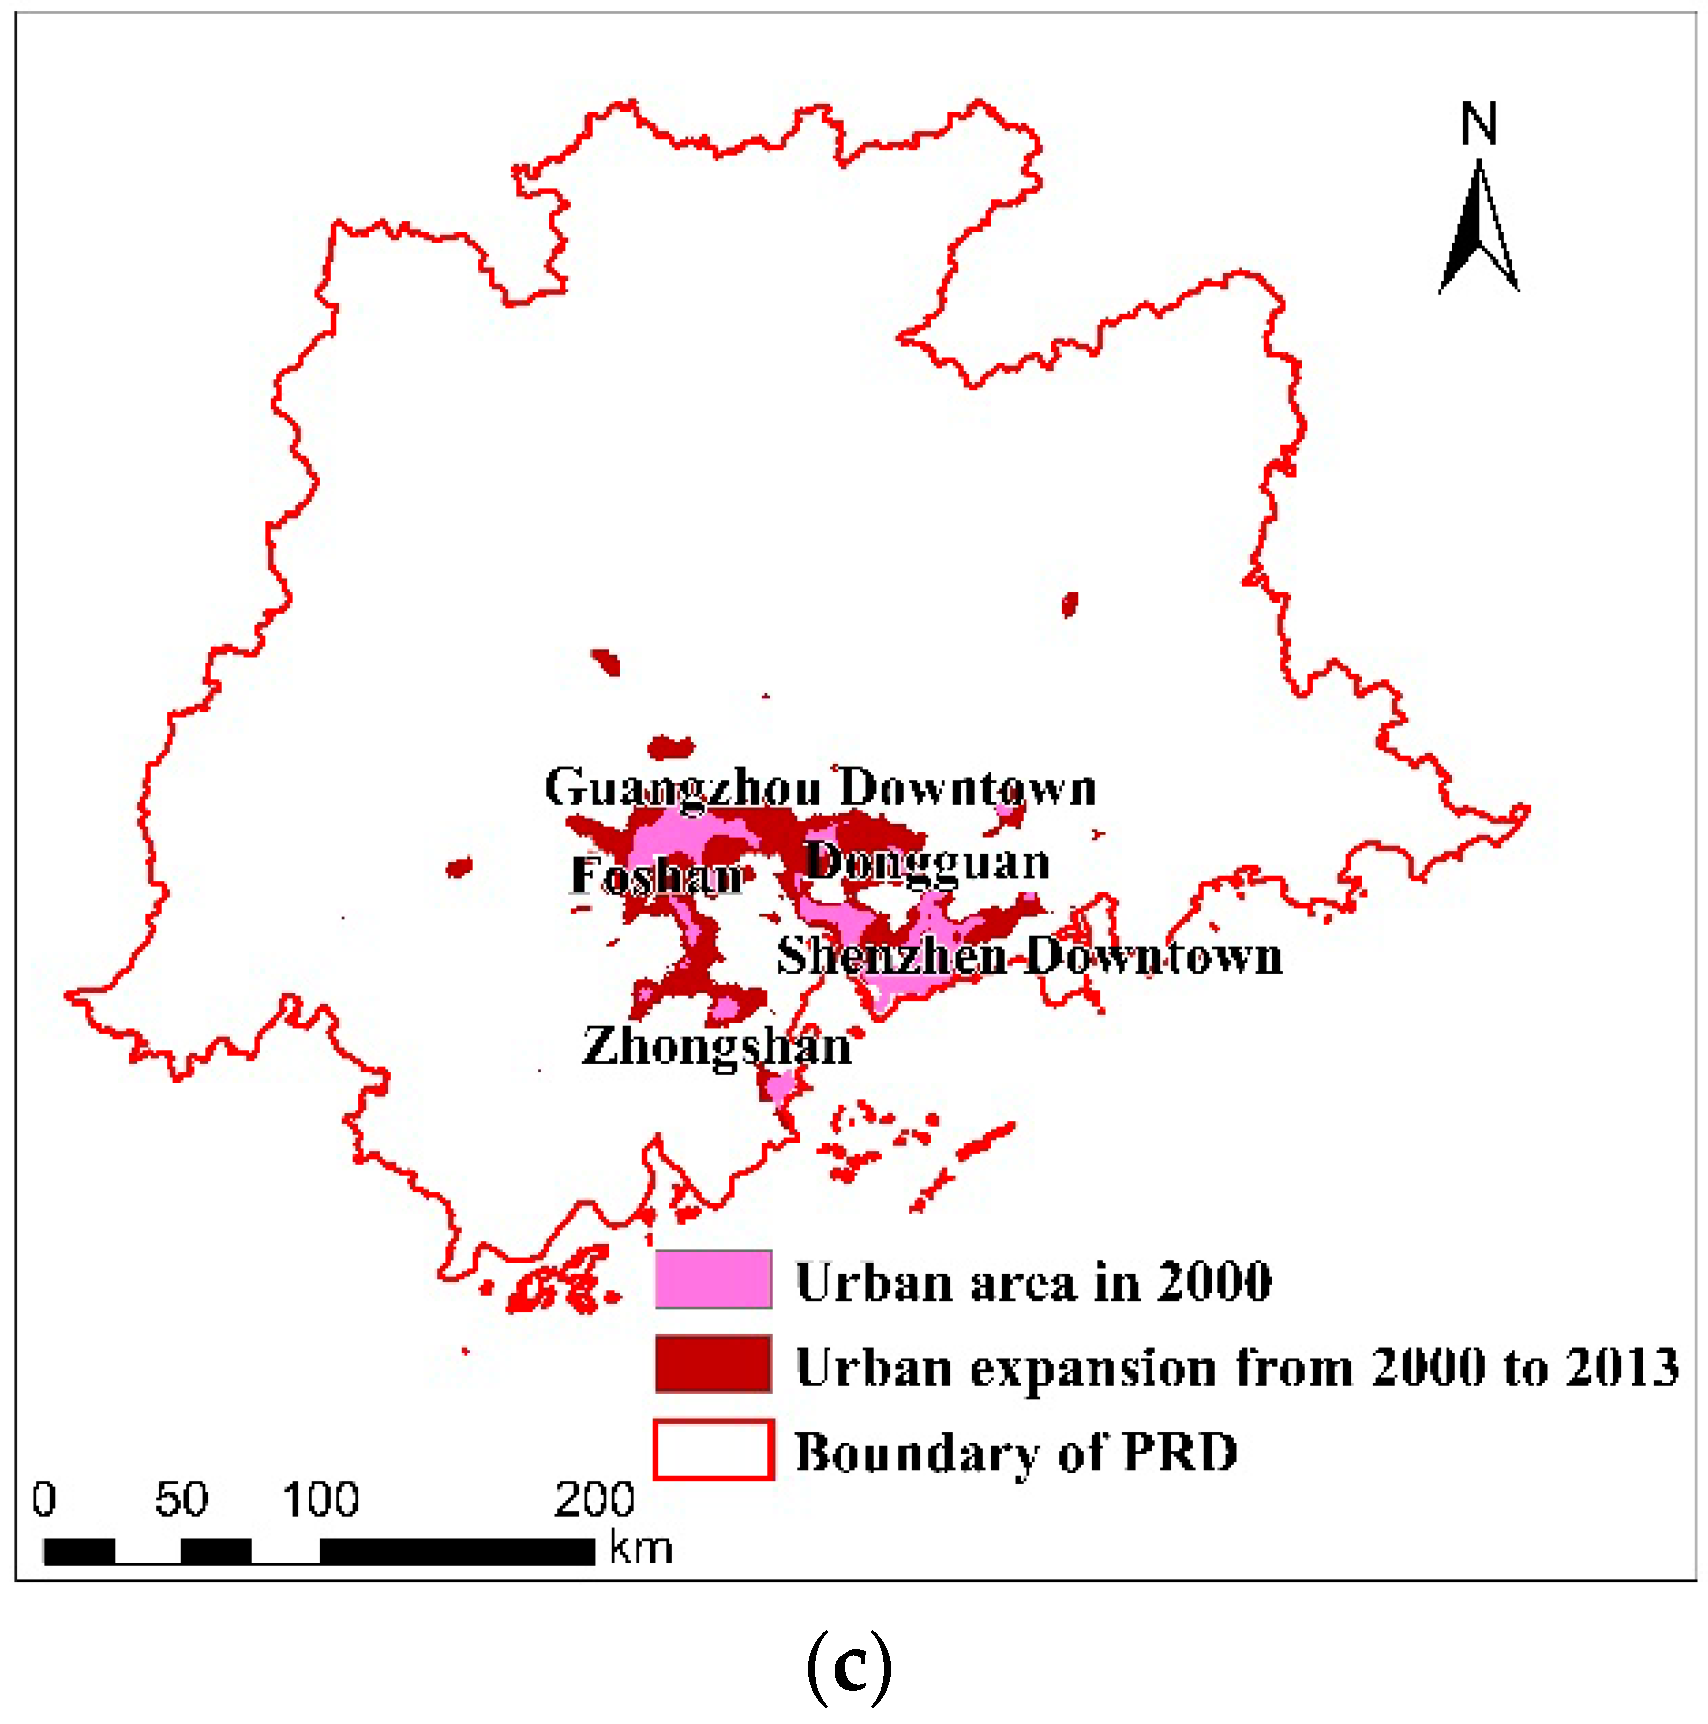
4.1. Urban Expansion Characteristics of the Three Urban Agglomerations

We presented the built-up area to describe urban expansion. All of the three urban agglomerations underwent an urban expansion process between 2000 and 2013, with the built-up area increasing from 1.03 × 10⁴ km2 to 3.06 × 10⁴ km2 on the whole. As shown in Figure 2, the built-up area line chart indicated different urban extension patterns for the three urban agglomerations. For BTH, the built-up area gradually expanded, on average 6.34% per year. The built-up area in YRD gradually changed before 2007 (4.95% per year) but rapidly grew thereafter (20.64% per year). The built-up expansion in the PRD passed through three stages: steadily increasing from 2000 to 2004 (19.57% per year), decreasing 22.59% in 2005, slightly changing from 2005 to 2010 (2.64% per year), sharply increasing 84.94% in 2011, and slightly changing from 2011 to 2013 (1.68% per year). The built-up area proportion to the whole region in the three urban agglomerations continuously increased. The YRD has the largest built-up area proportion on average 3.82%, followed by the PRD at 3.18% and BTH at 2.33%.
The mean patch size represents the integrity of the built-up area. The line chart (Figure 3) shows that built-up area in the PRD (on average 164.23 km2) bears a much higher integrity than that in BTH (on average 53.99 km2) and the YRD (average 72.29 km2). The mean patch size in PRD experienced great change in 2003 (109.25%), 2005 (−40.18%) and 2011 (64.39%). In BTH and the YRD, the mean patch size only slightly changed, at 0.86% in BTH and 8.47% in YRD.
The shape index can be used to measure the complexity of the patch. From the line chart shown in Figure 4, we found that the shape index decreased in all three urban agglomerations. The shape index is highest in BTH (403.09), followed by the YRD (359.96) and PRD (302.55).
Let us come to the information presented in the urban expansion map (Figure 5). This shows the different urban expansion processes of the three urban agglomerations between 2000 and 2013. We assigned the contiguous built-up areas larger than 500 km2 as the urban core zones. In BTH, the urban core zone is mainly in the Beijing and Tianjin downtown areas, which increasingly developed and combined with the surrounding clusters, such as the Tanggu and Fangshan districts, during the 14-year period. In the YRD, the urban core zone only includes downtown Shanghai. During the 14 years, downtown Shanghai combined with Suzhou, Wuxi and Changzhou; In addition, Nanjing, Hefei and Hangzhou developed as new urban core zones. In the PRD, the urban core zone is mainly in the Shenzhen and Guangzhou downtown areas, which combined with Dongguan, Foshan and Zhongshan to form a much larger urban core zone.

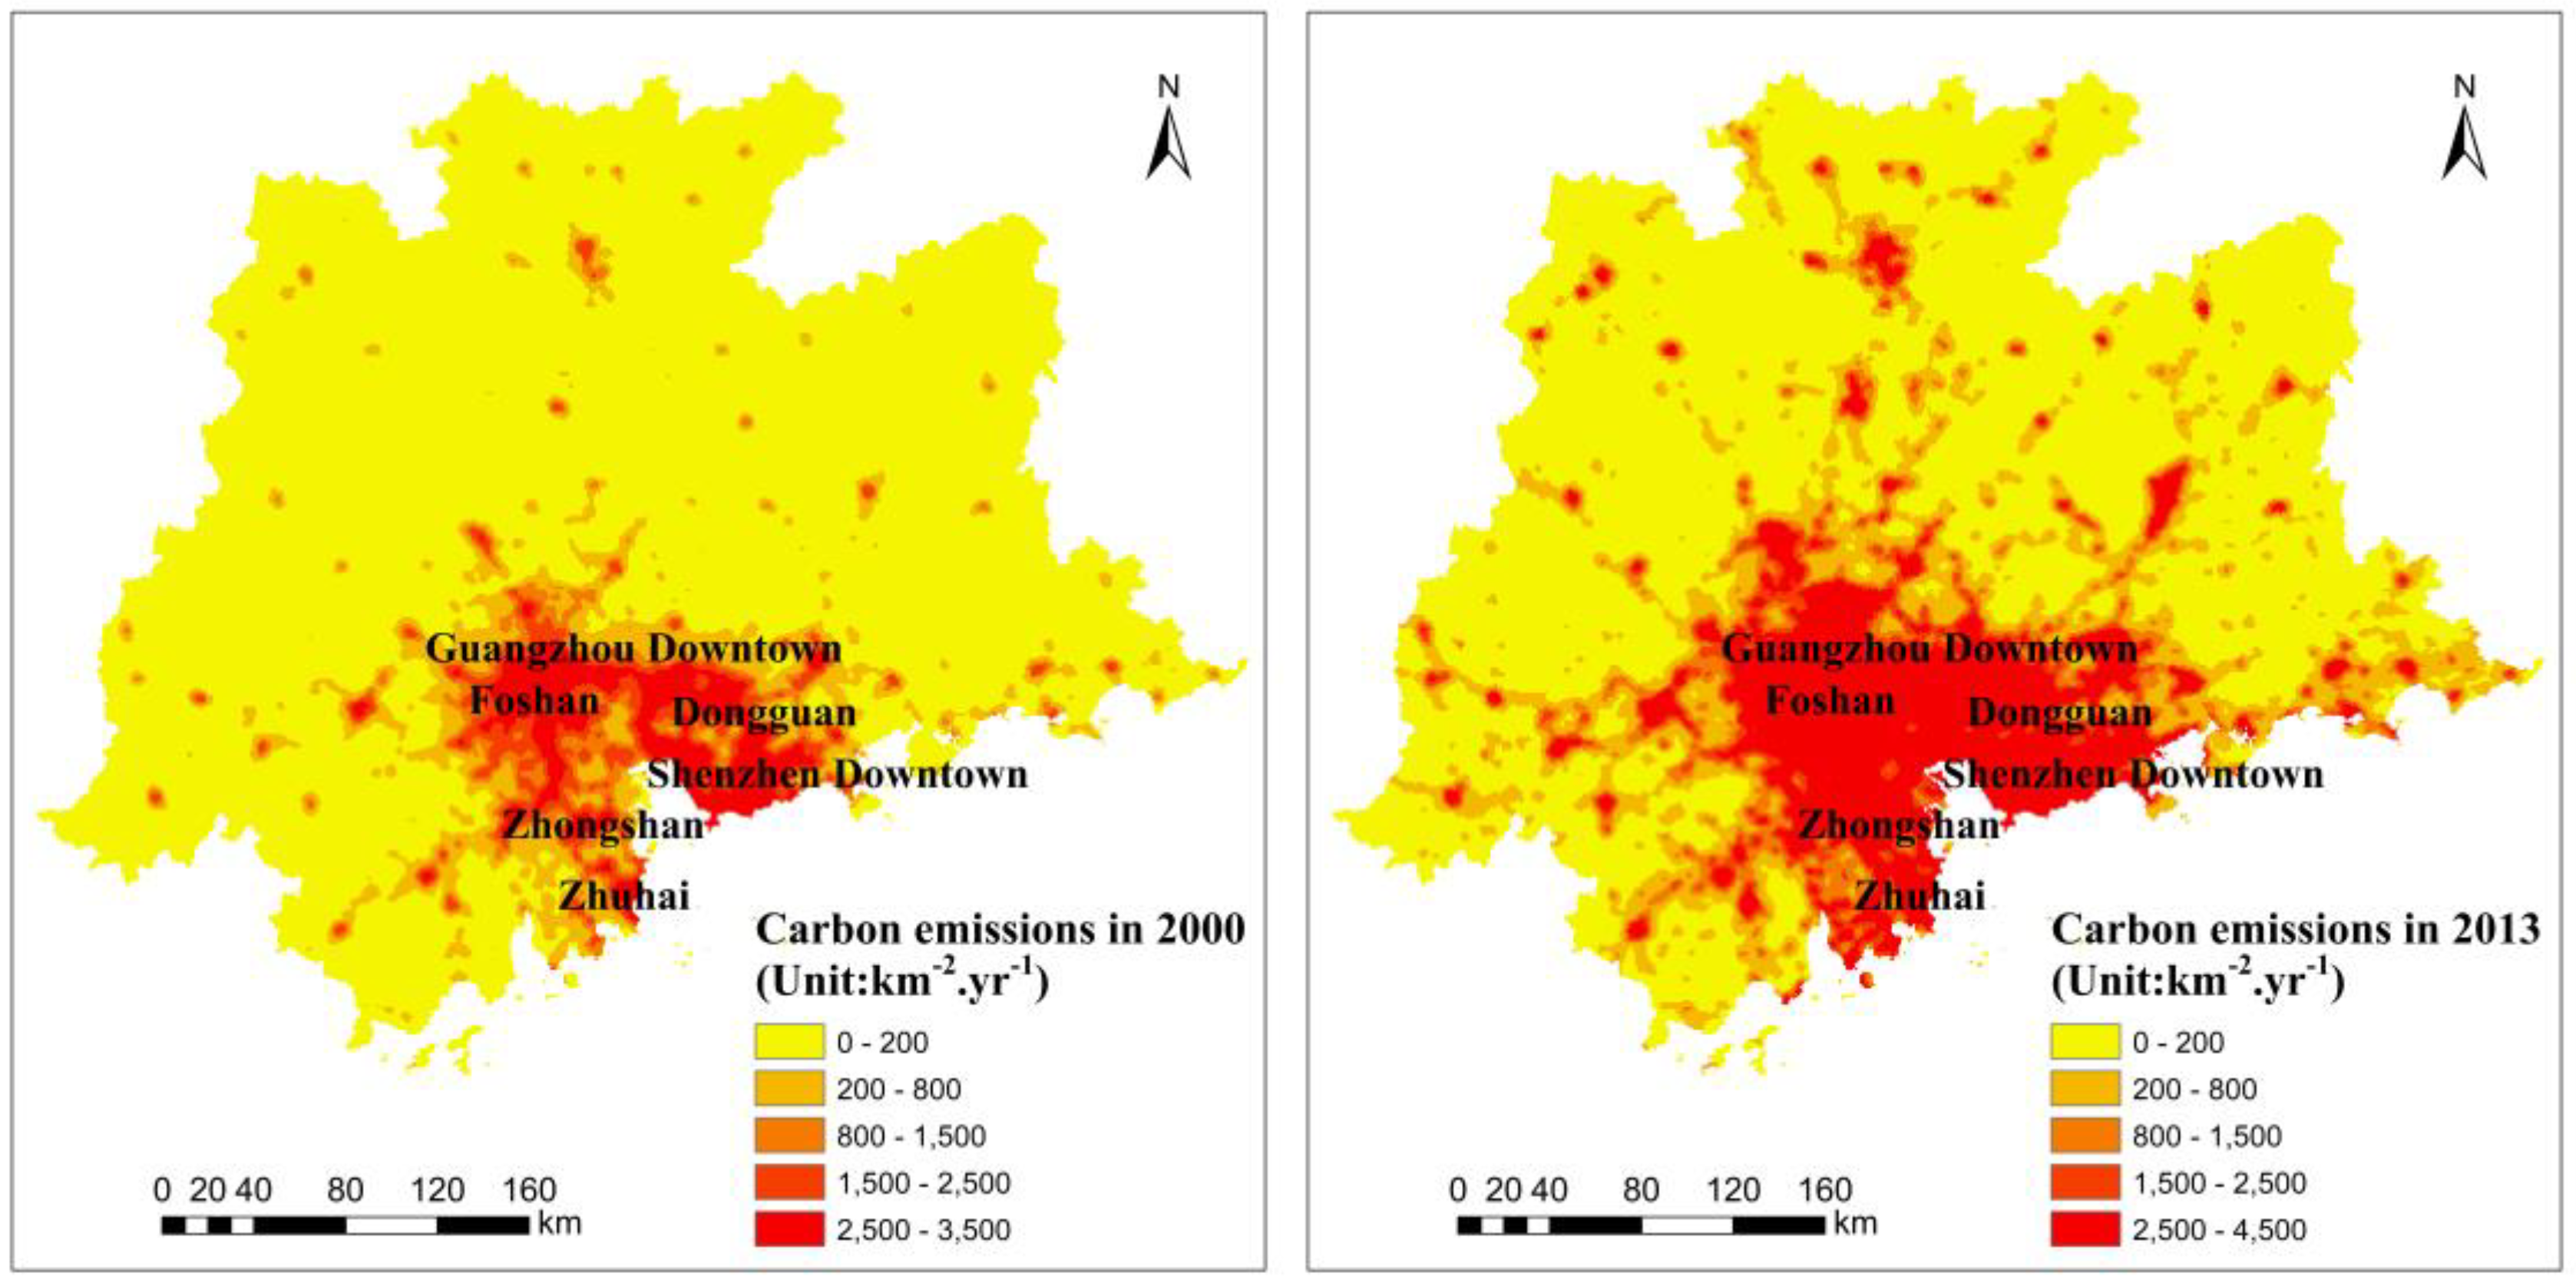
4.2. NEP and Carbon Emission Statistics for the Three Urban Agglomerations

The NEP was evaluated from the aspects of mean value, standard deviation, and Moran’s I (Table 1). During 2000–2013, the mean annual NEP shows that the NEP in the YRD and PRD seem to be approximately the same, while in BTH it is much lower and negative for most of the years. Standard deviation analysis during 2000–2013 shows that the NEP in the YRD and BTH gradually changed, and a weak fluctuation trend was found for the PRD. By calculating Moran’s I, we found that the spatial aggregation of the NEP in the YRD and BTH is more intense than that in the PRD.
Extracting the NEP mean values in the built-up area (Table 1), we found large changes in all the three urban agglomerations, and the mean values are much lower than those of the whole urban agglomerations. The mean value is the highest in the YRD (31.59 gC·m−2·year−1), while it is negative in BTH (−48.22 gC·m−2·year−1) and the PRD (−13.92 gC·m−2·year−1). By calculating Moran’s I, we found that the NEP spatial aggregation in the built-up area is less intense than that in the whole urban agglomeration.
Statistics from the 2000–2013 annual carbon emission grid data (Table 2) suggest notable increasing trends in all three urban agglomerations. The PRD has the lowest carbon emission. Carbon emissions in the YRD and BTH are similar. Meanwhile, variation coefficients of carbon emission decreased during the 14 years, which shows that the carbon emission values increasingly concentrated. Calculation of Moran’s I suggests that the spatial aggregation of carbon emission is highest in the YRD, followed by the PRD and BTH.
The 2000–2013 carbon budget calculation (Table 3) demonstrates an evident increasing trend as a carbon source, except for the years between 2000 and 2004 in the PRD. Carbon liabilities are the most evident in BTH, followed by the YRD and PRD. Calculation of Moran’s I shows high spatial aggregation of the carbon budget in the YRD.

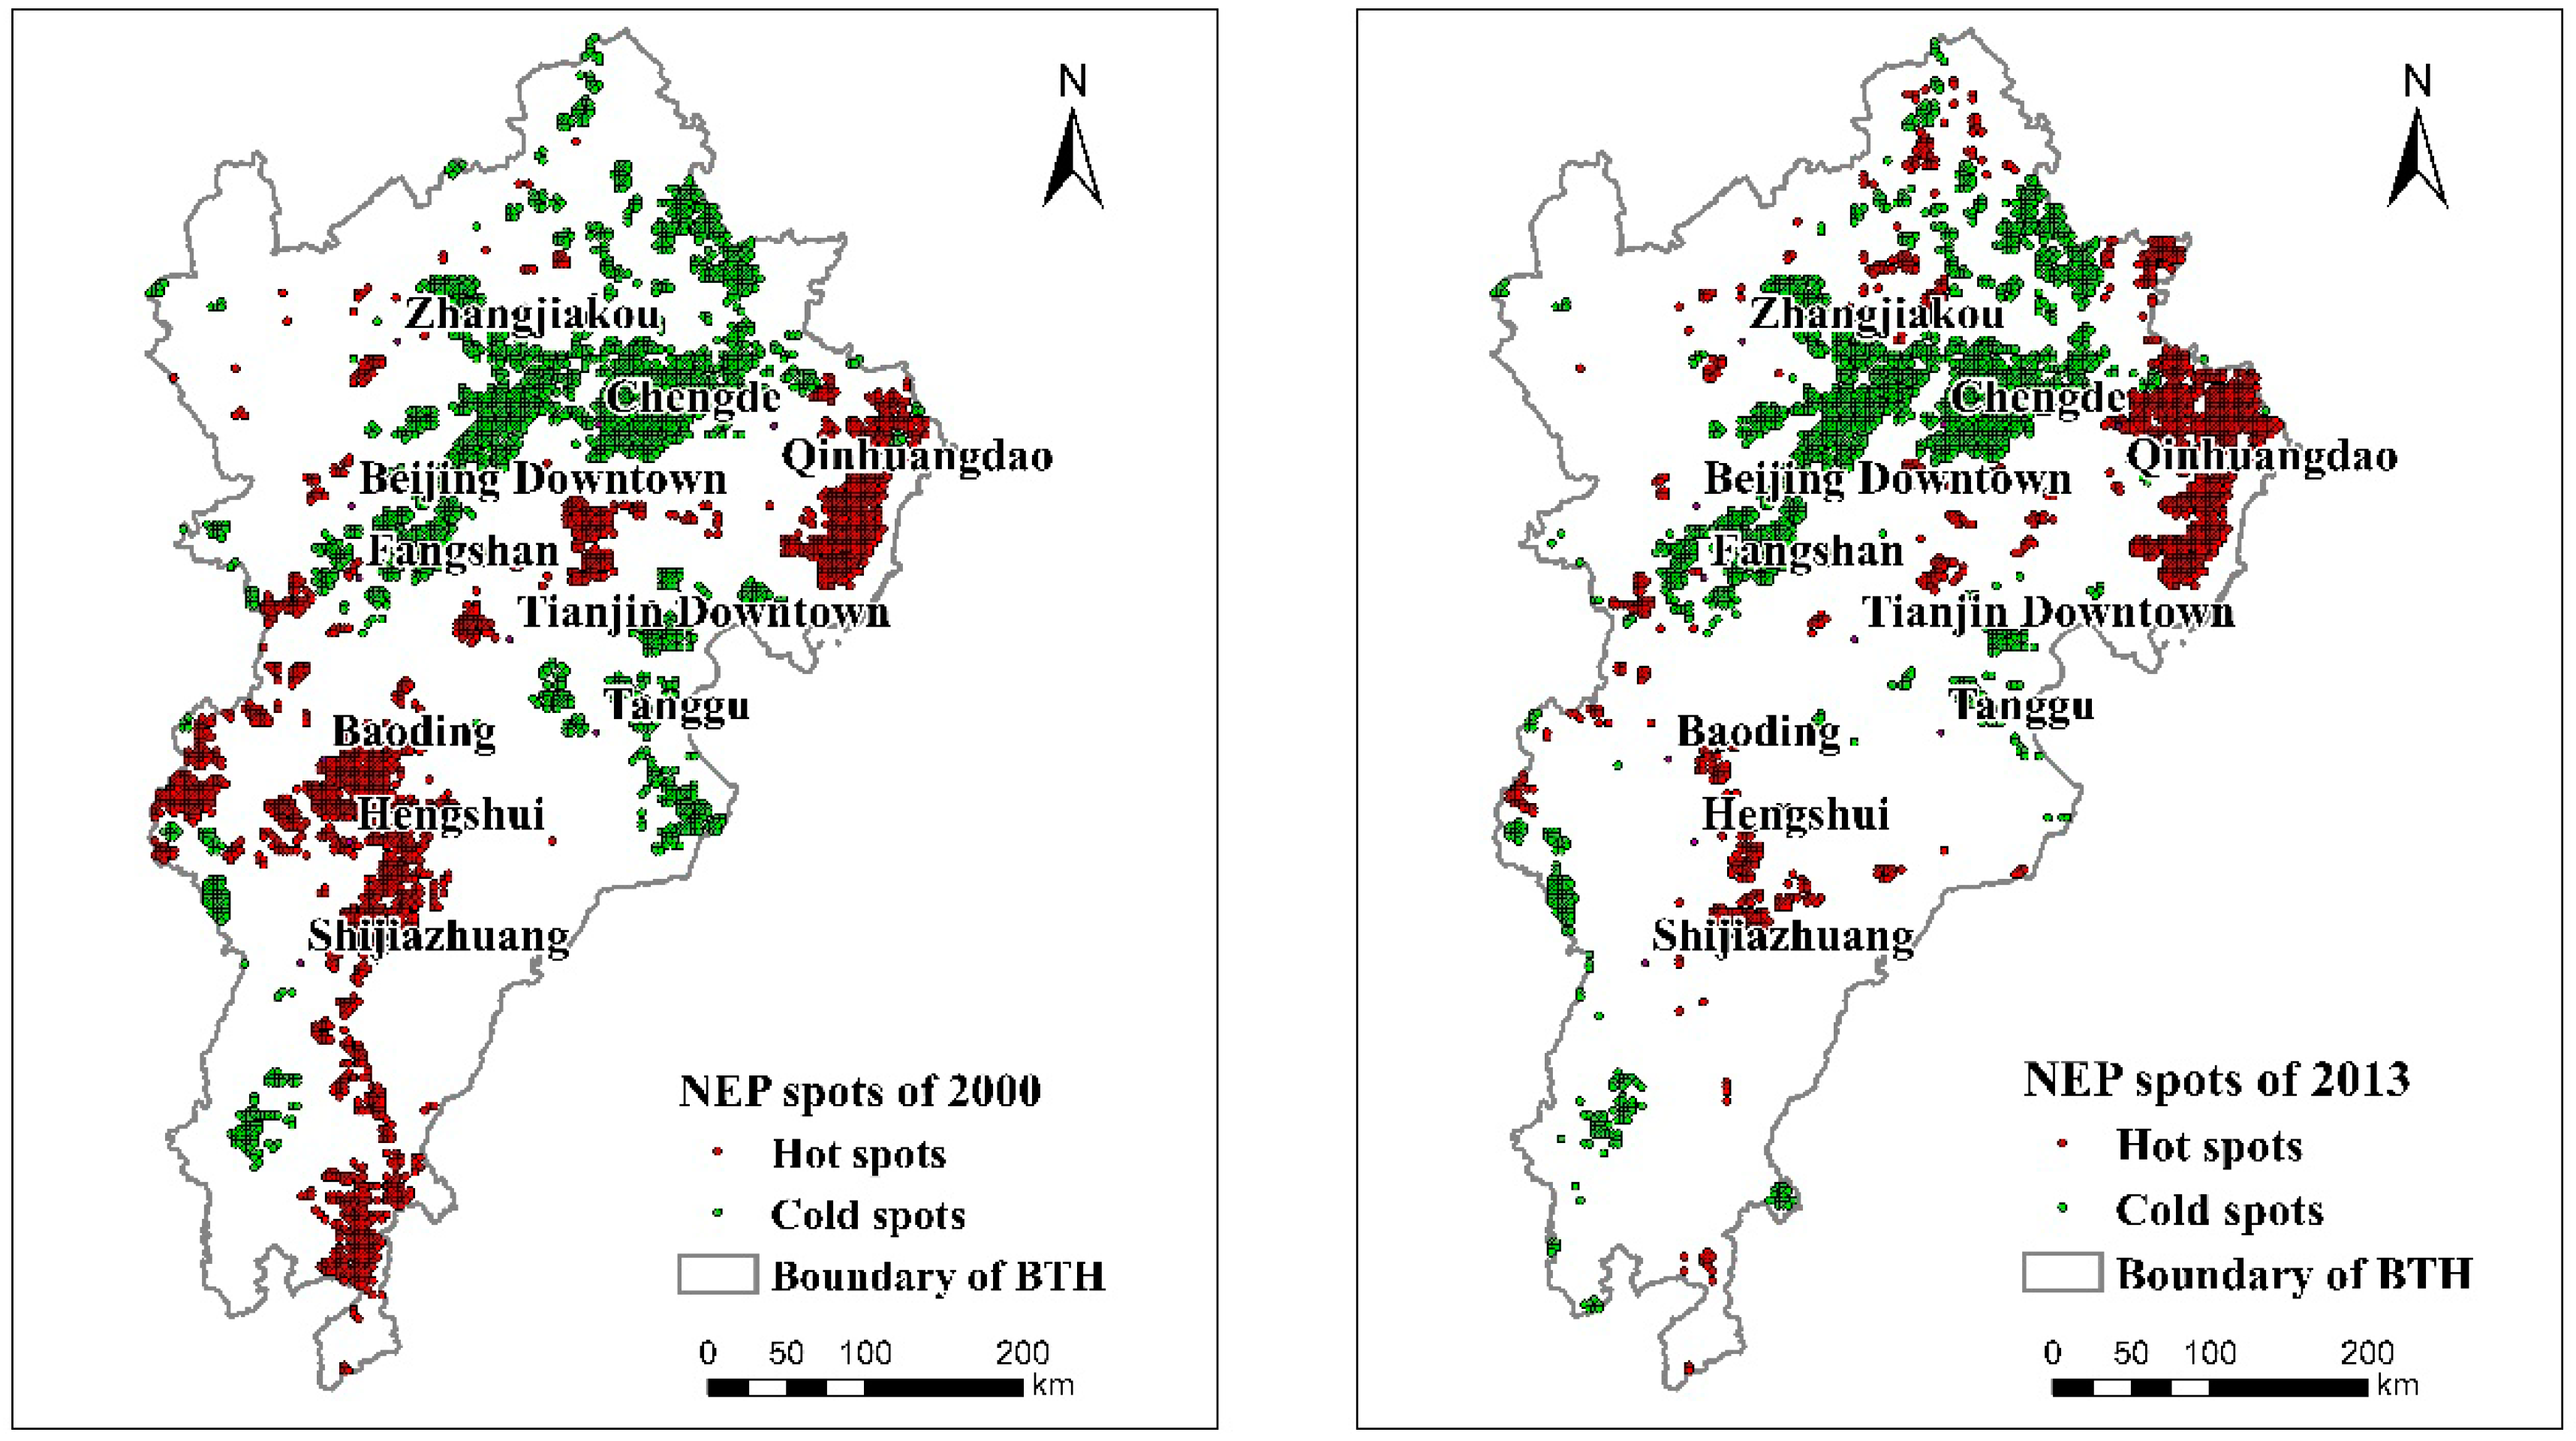
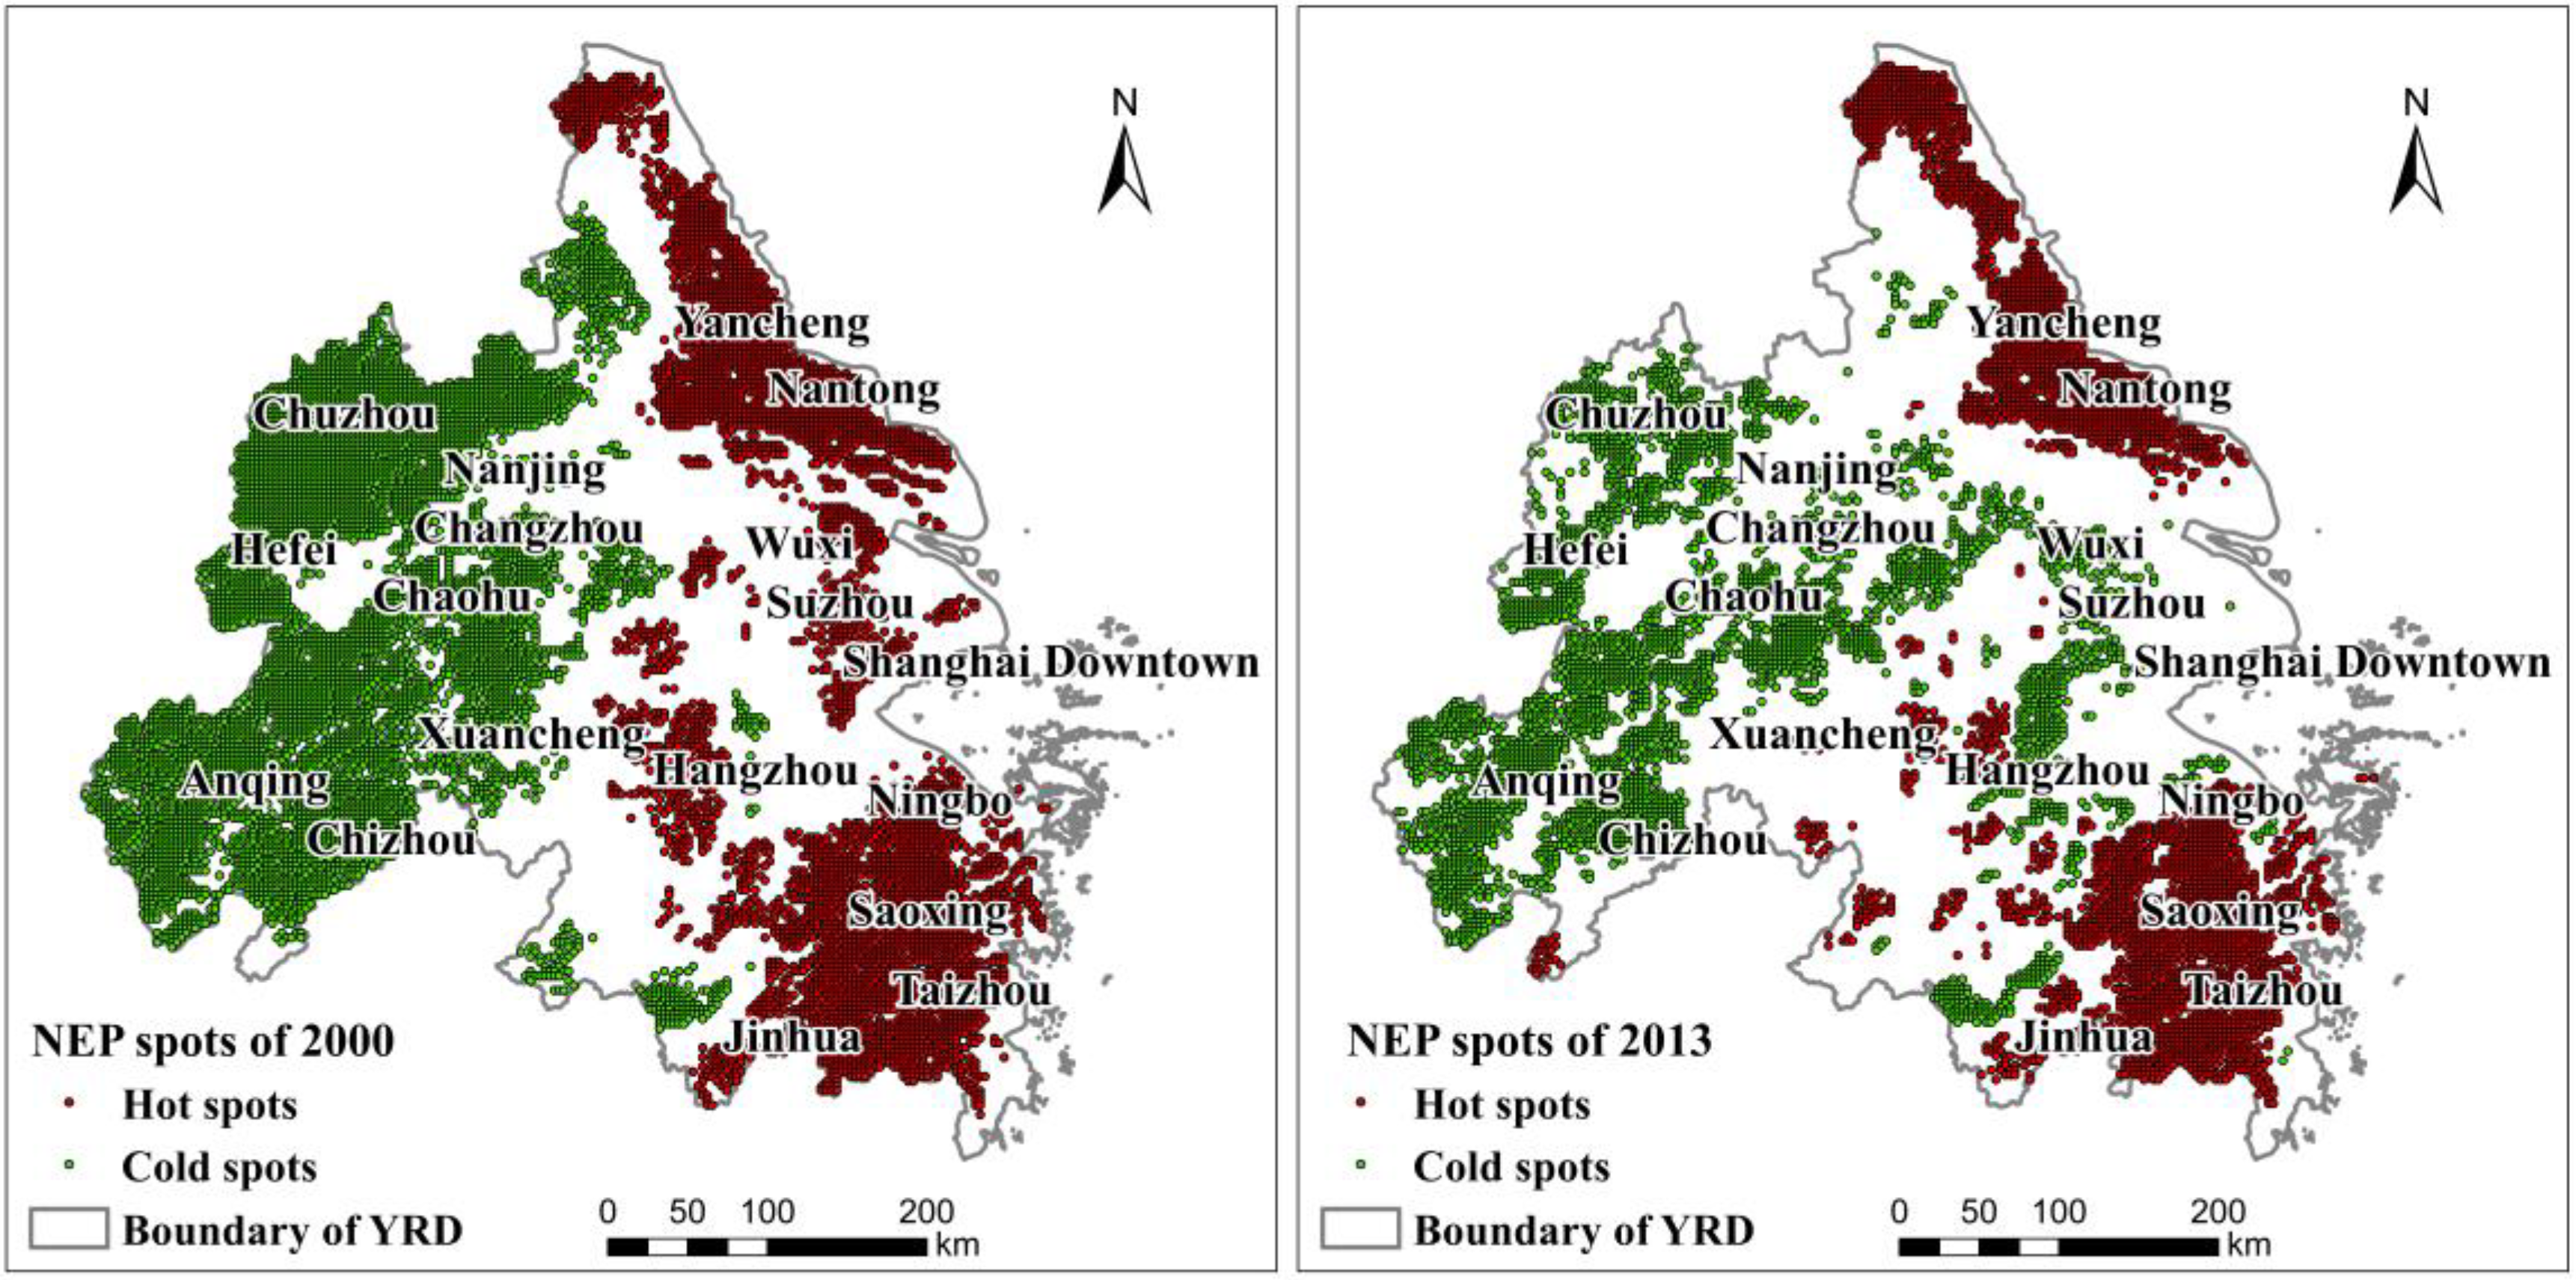
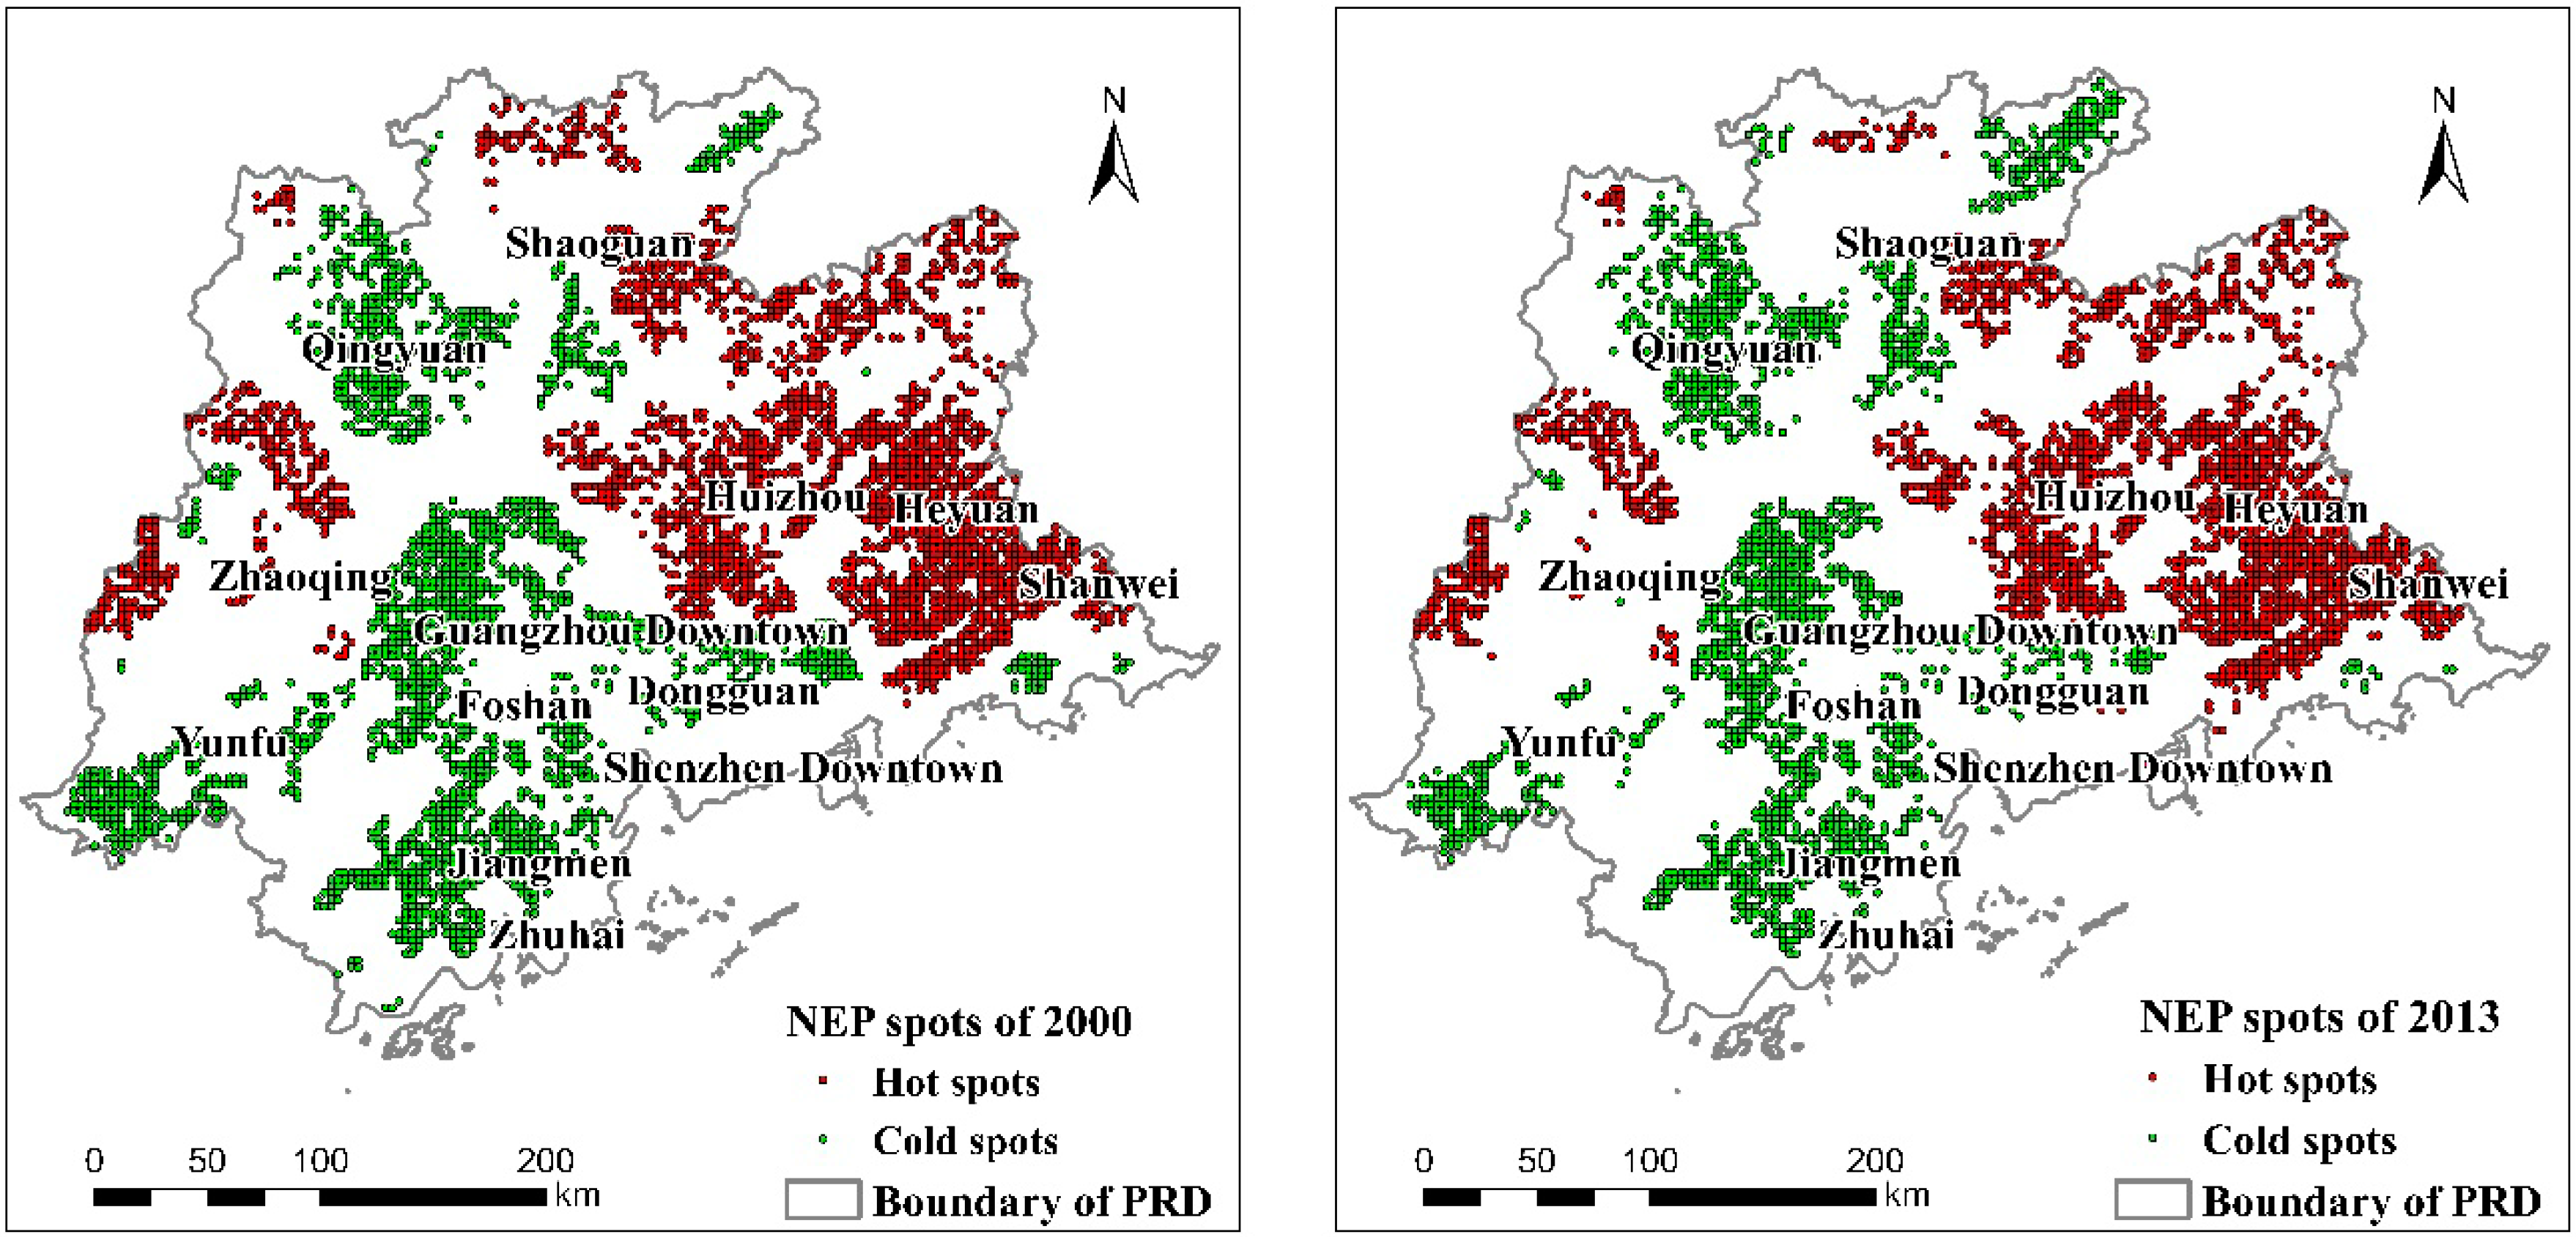
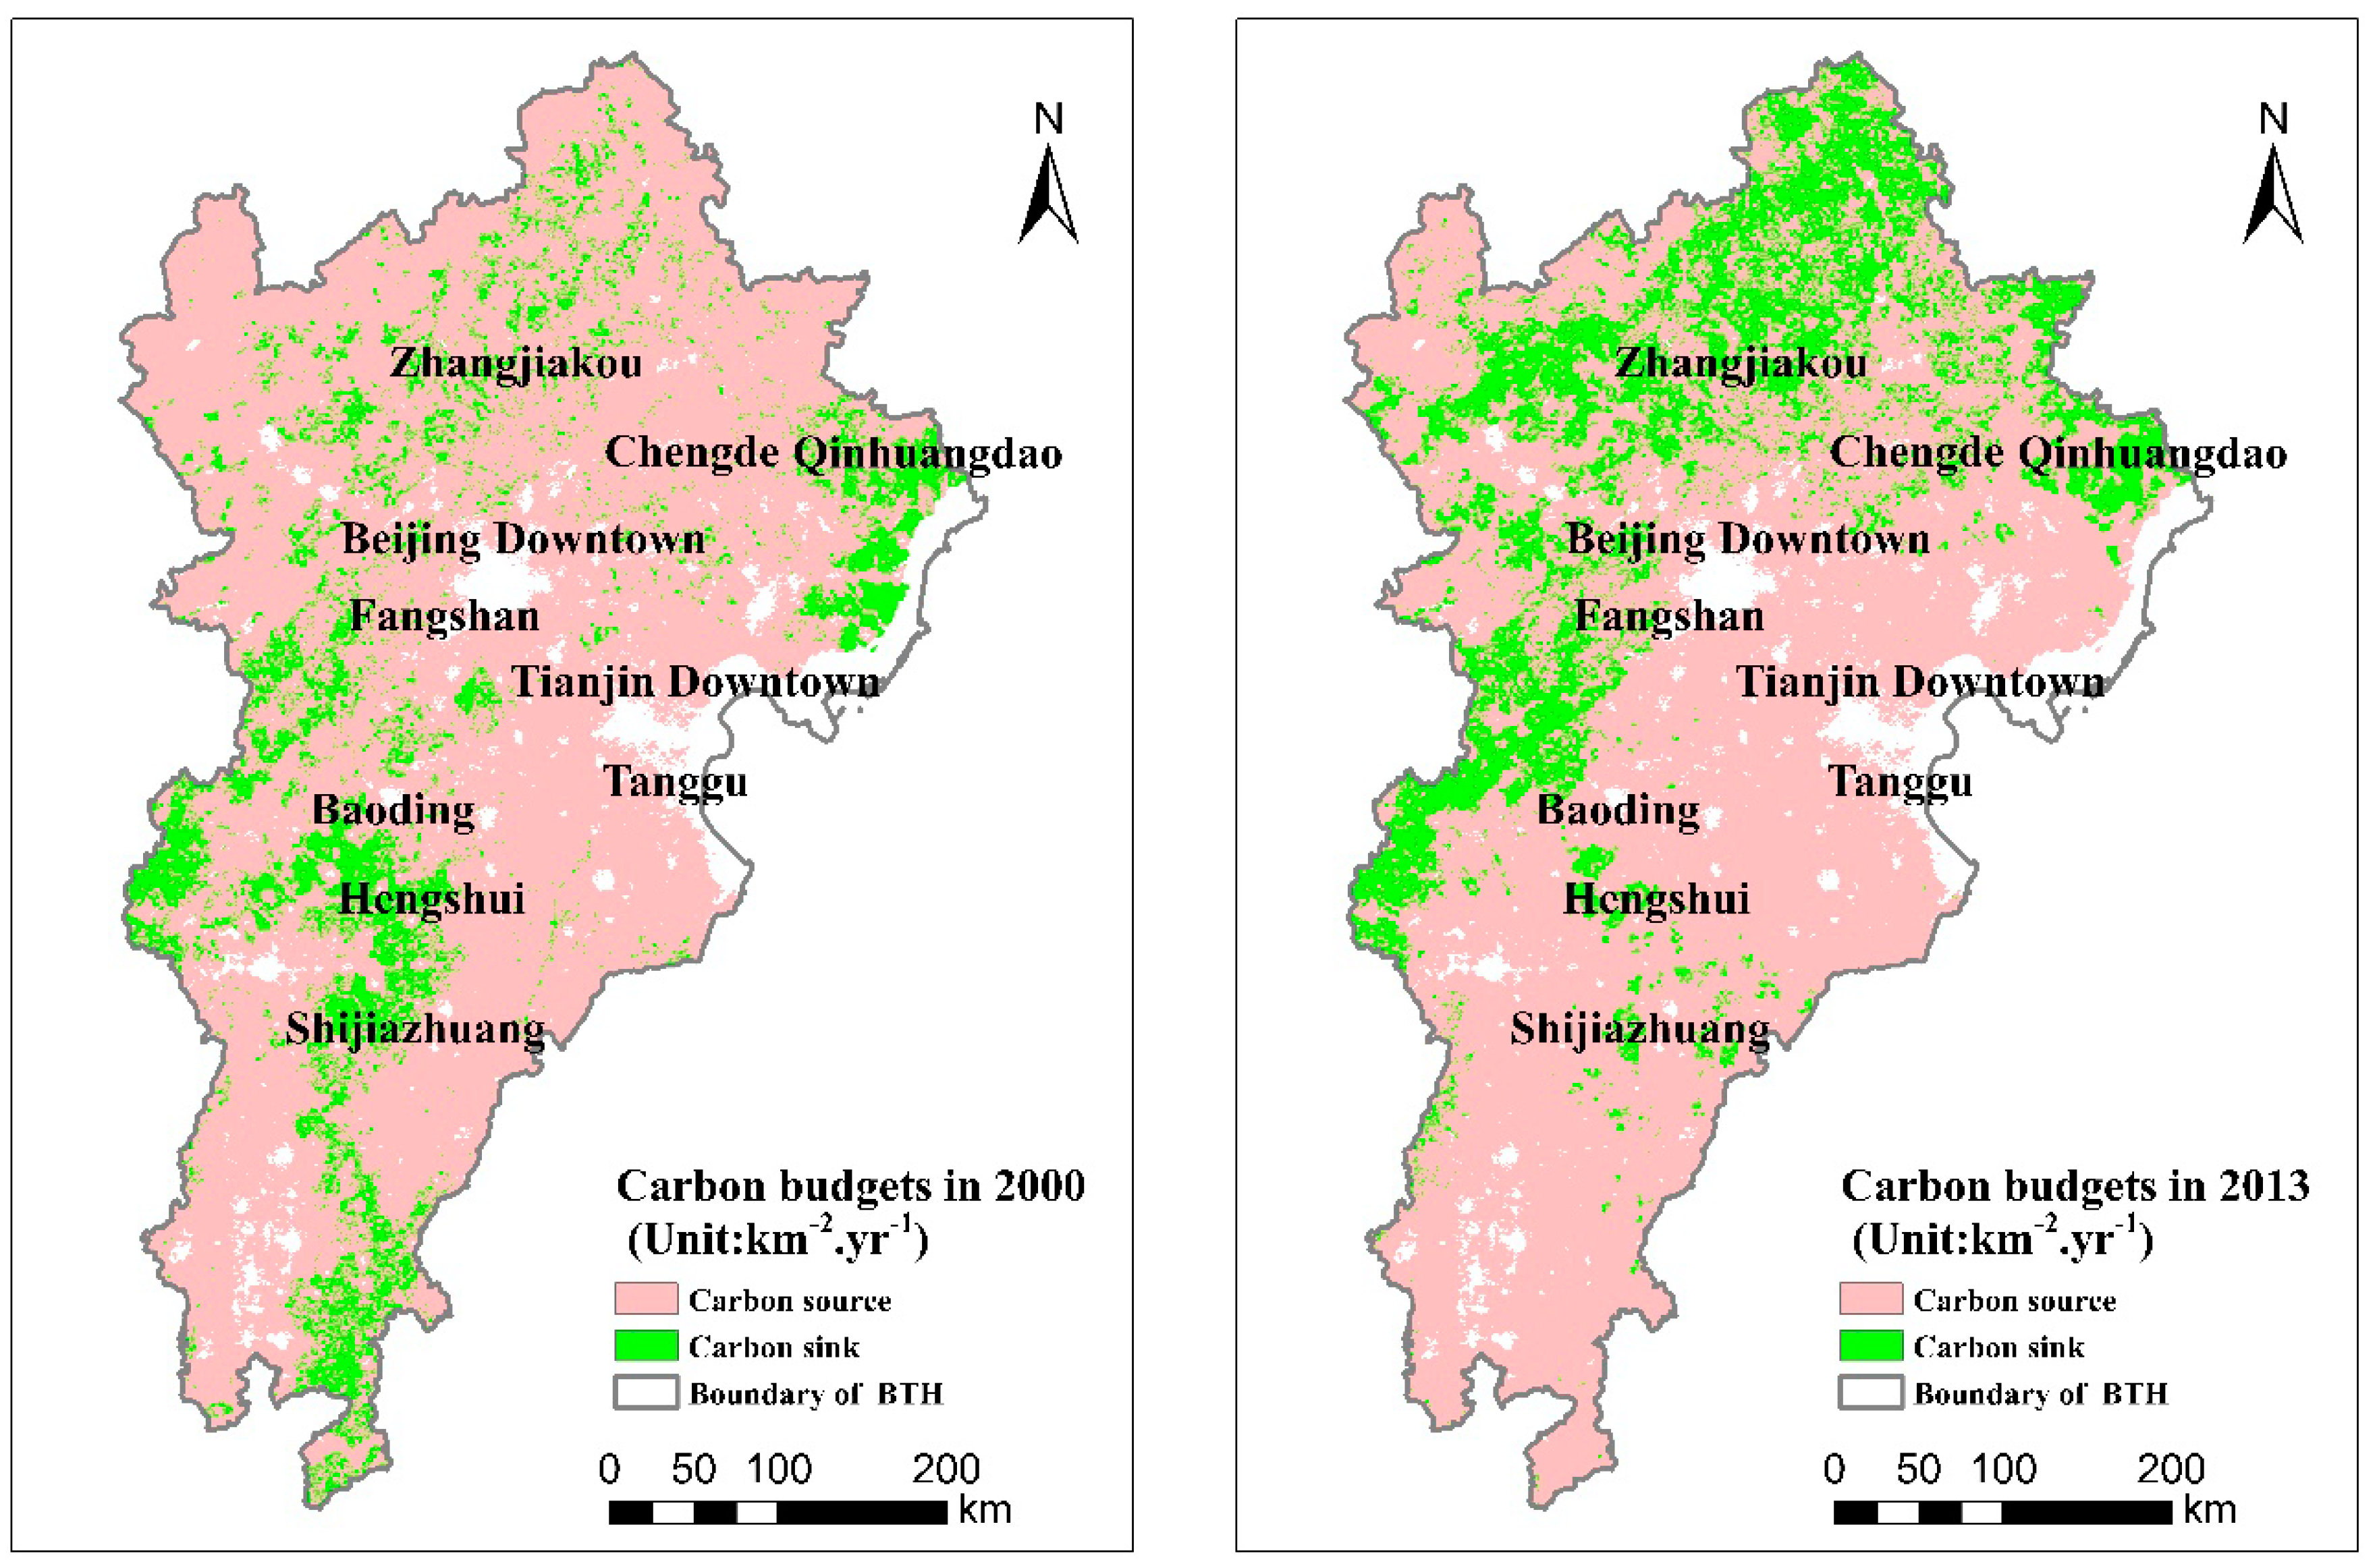
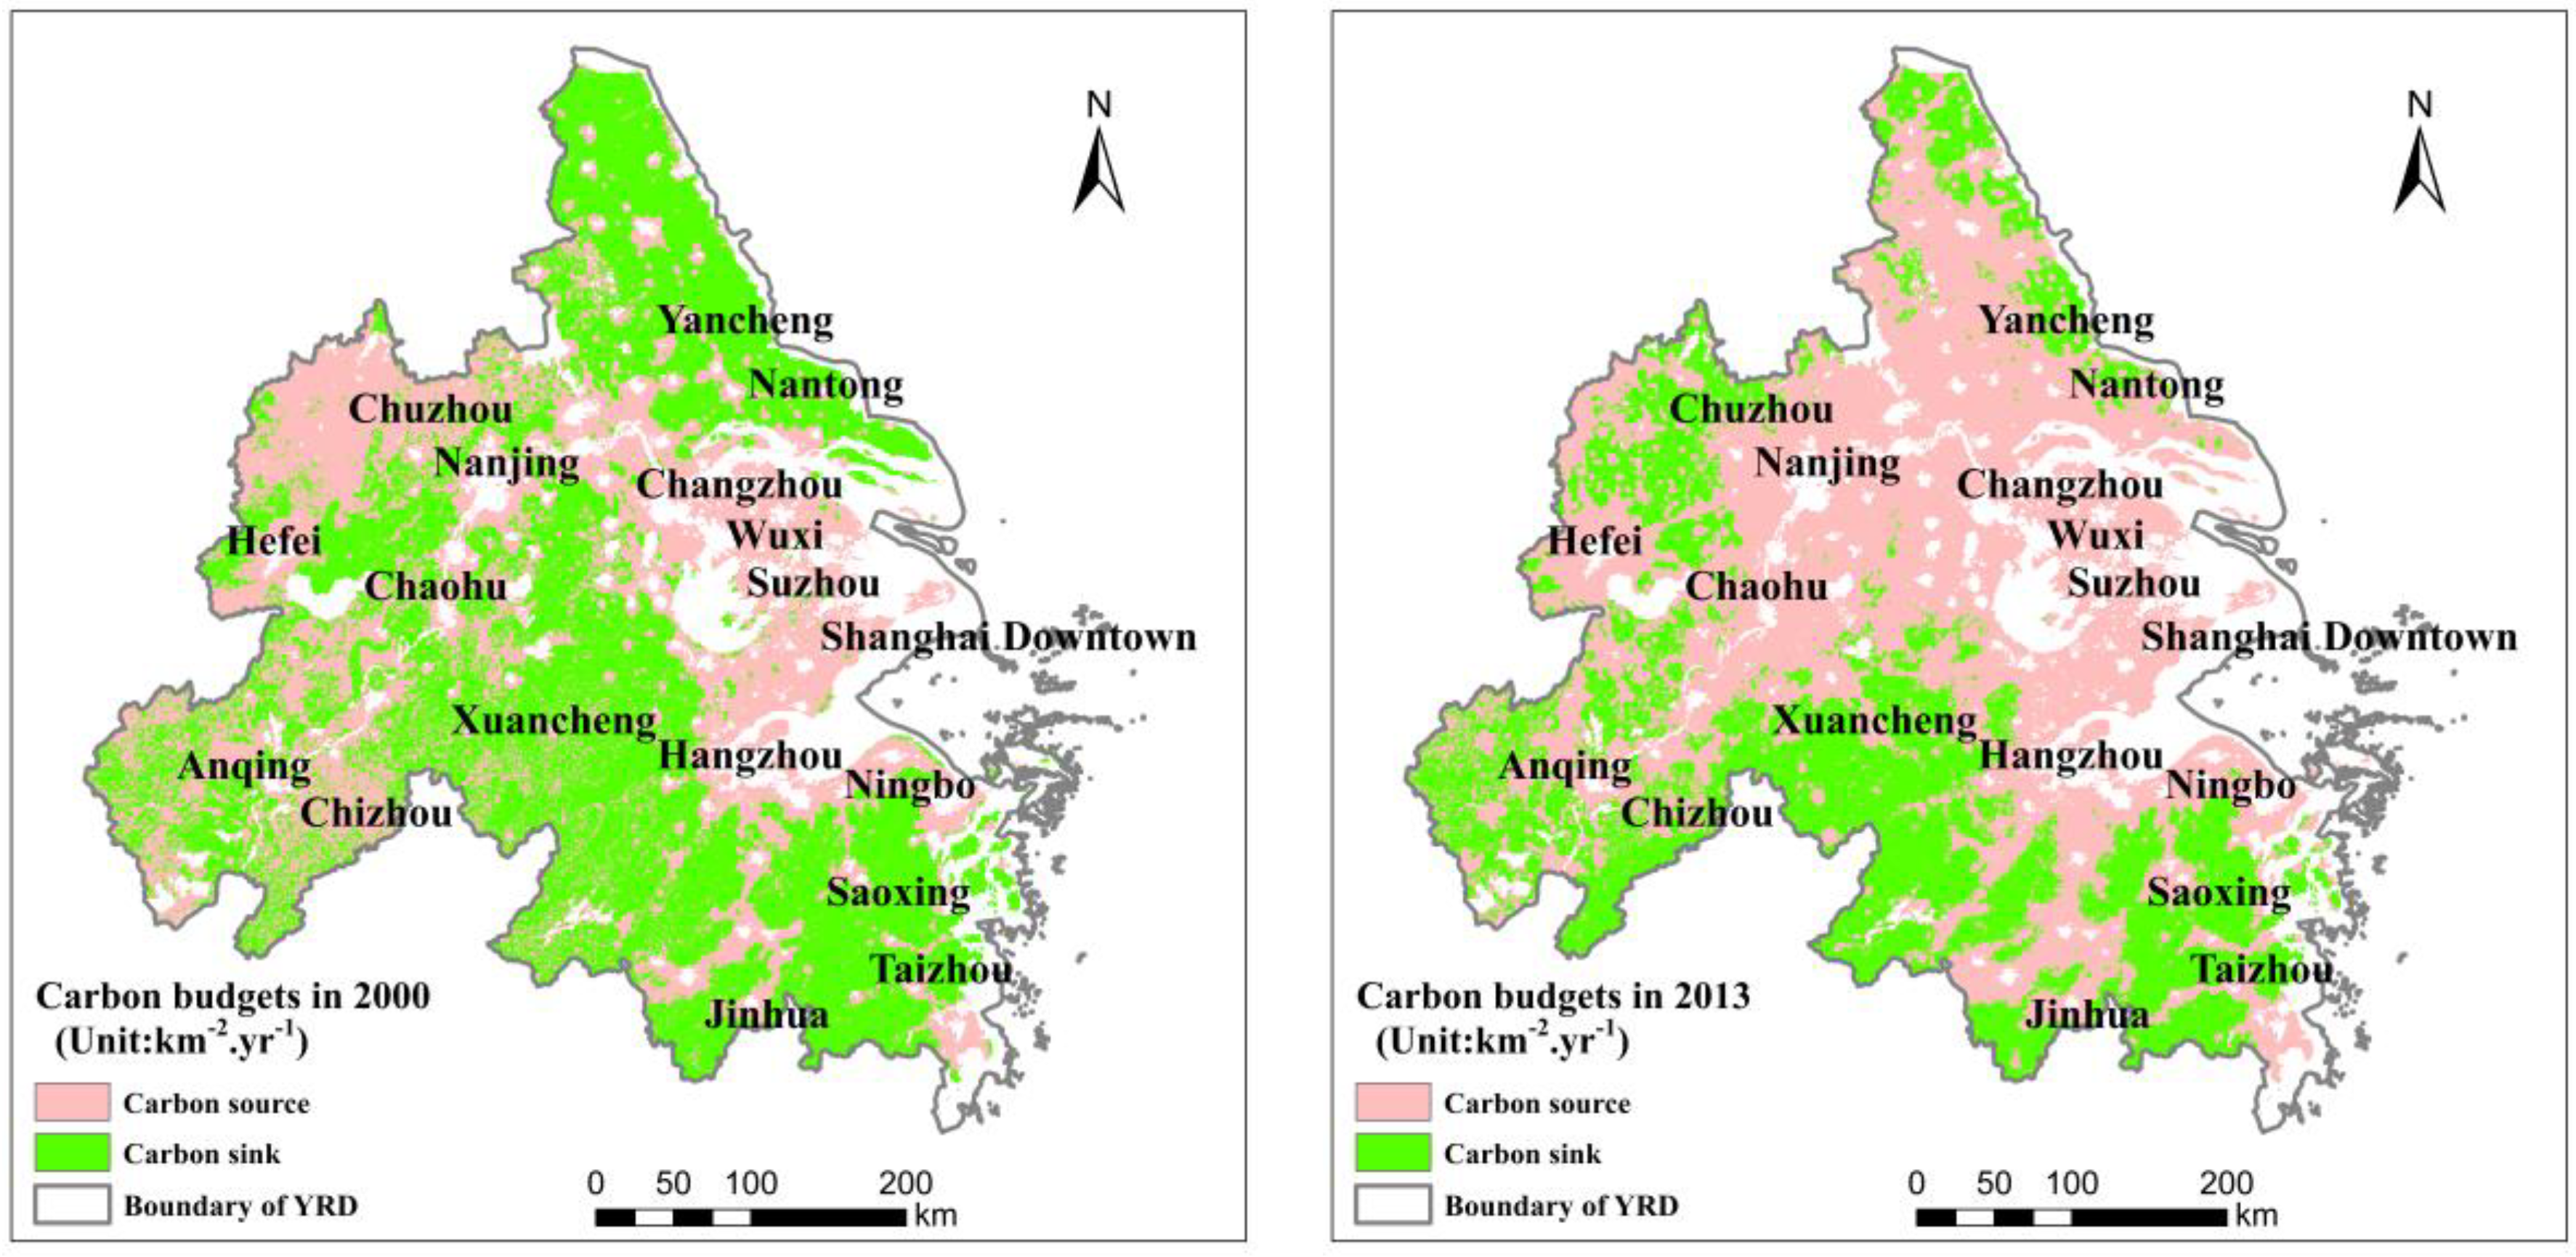
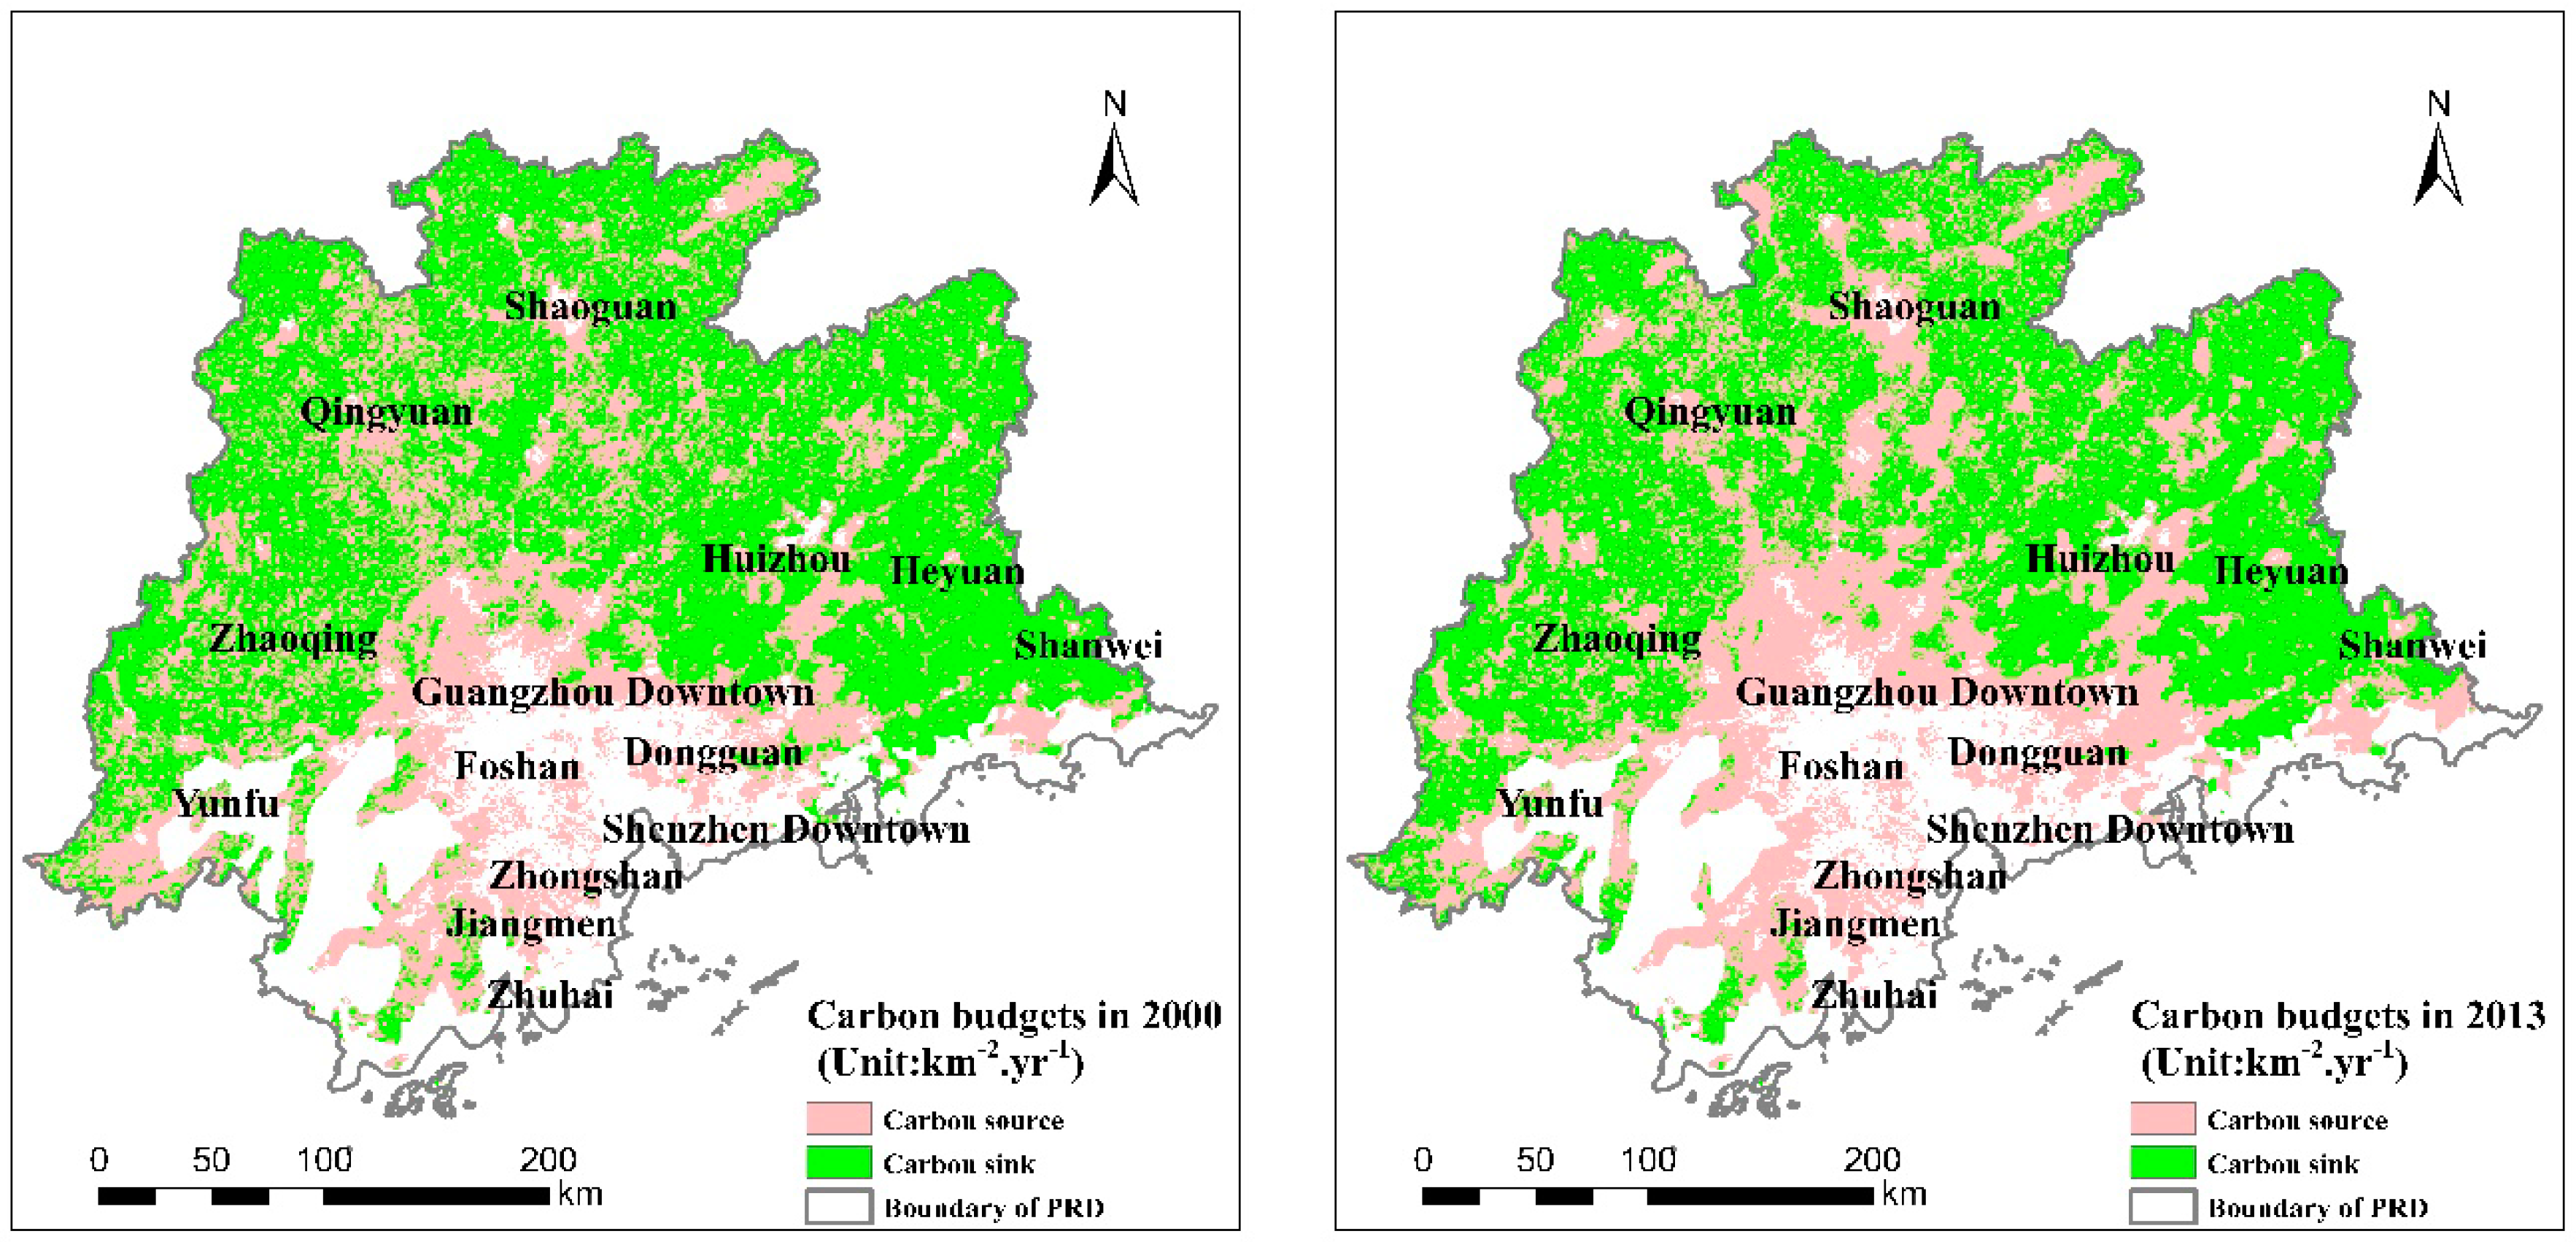
4.3. Spatial Pattern of Carbon Source and Sink

The carbon emission spatial patterns in the three urban agglomerations are consistent with their economic development to a certain extent, with increasing trends and gradual development [53]. In BTH (Figure 6), hot spots concentrate in the downtown of each major city, particularly Beijing and Tianjin. In southern BTH, hotspots are not obvious in 2000, while in 2013, Shijiazhuang, Handan and Anyang appear to be hot regions. In the YRD (Figure 7), hot spots mainly occur in Shanghai and the surrounding areas, southern Jiangsu Province (Suzhou, Wuxi, Changzhou and Nanjing City) and northern Zhejiang Province (Hangzhou City). Downtown Hefei city is also a hotspot. The YRD hot regions are much larger and more contiguous in 2013 than in 2000. In the PRD (Figure 8), hot spots are concentrated in the core of the Pearl River Estuary in the south, downtown Guangzhou, Shenzhen and Zhuhai and the area among them. Cold spots are spread over the periphery of the north, east and west in 2000, but with some hotspots occurring in 2013.
However, the NEP spatial patterns in the three urban agglomerations are very different from the carbon emission patterns. In BTH (Figure 9), the hot spots are mainly in Qinhuangdao counties in the east and the junction of Shijiazhuang, Baoding and Hengshui in the south. Cold spots mainly occur on the outskirts of Beijing and southern Chengde. In the YRD (Figure 10), hot spots occur along the northern coastal areas, such as Yancheng and Nantong in Jiangsu Province, and the southern areas, such as the junction of Taizhou, Ningbo and Shaoxing in Zhejiang Province. Cold spots occur around downtown areas in the western and northern Anhui Province and are dispersed in southern Jiangsu Province and northern Zhejiang Province. In the PRD (Figure 11), hot spots occur at the junction of Huizhou, Heyuan and Shanwei in the east. Cold spots mainly occur in the west, from Qingyuan in the north to Jiangmen in the south. The high NEP value is typically well determined by good vegetation growth status and moderate climatic conditions [54,55]. The aforementioned findings show that the junctions of the cities in the three agglomerations are well vegetated. We are aware that cold spots of carbon sink do not appear in the core urban areas of the three urban agglomerations probably because of the government-managed greening measures.
By carbon budget calculation, we explored the spatial pattern of carbon source and sink in the three urban agglomerations with sources larger than sinks. In BTH (Figure 12), carbon sinks mainly occurred in Qinhuangdao; Zhangjiakou in the north and Baoding, Hengshui, Shijiazhuang in the southwest. From 2000 to 2013, carbon sinks in BTH seem to move from the south to north. In the YRD (Figure 13), the carbon sinks mainly occur in Chuzhou, Chaohu, Anqing, Chizhou, and Xuancheng in the west; the outskirts of Hangzhou, Jinhua, Shaoxing, Taizhou, Ningbo in the south and Yancheng in the north. From 2000 to 2013, the carbon sink in the central and the northern YRD greatly decreased. In the PRD (Figure 14), carbon sinks occur on the periphery, mainly Yunfu, Zhaoqing, Qingyuan, Shaoguan, Hequan, Huizhou and Shanwei. From 2000 to 2013, carbon sinks in the PRD decreased but not significantly.

5. Discussion

Studies on the NEP and energy consumption as important indicators to understand the natural-human dual structure of carbon effects are not new [56,57,58]. The NEP and energy consumption calculations in this study have been effectively verified by previous studies [35,46,47,48]. Compared with previous studies, however, carbon budget estimations in this study have advantages. By unifying the spatial resolution (approximately 1 km), we provided the possibility to generate a carbon budget comparison in a locally regional scale, which is our main contribution different from other research.
BTH has the lowest NEP level and a high Moran’s I level because of its relatively dry environment that prevents vegetation growth [35,59]. In view of its vulnerable ecology, a favourable policy on ecological protection should be adopted here, particularly in the location where the NEP is low. Carbon emission here is the highest of the three urban agglomerations and highly concentrated in the core zone. Industry should be optimized and upgraded to reduce carbon emission. For example, the iron and steel industry is a main carbon source, and its energy efficiency should be improved [60,61]. In the spatial allocation of urban planning, there is no doubt that Beijing and Tianjin are the core cities, which should be given greater roles in stimulating the development of surrounding areas. By the urban expansion pattern analysis, development could well be southward and seaward. In the north and the west where the carbon sink occurs, ecological conservation should be a priority to expand the regional eco-capacity.
The YRD has a high NEP and Moran’s I levels, indicating good vegetation growth status and moderate climatic conditions in the whole region [35]. The YRD has a high urbanization rate and a low level of carbon emission concentration. The YRD plays a leading role in Chinese economic growth, and considerable energy is needed for economic growth and social development [62]. The main industries of the YRD include electronic equipment manufacturing, transportation equipment manufacturing, electricity supply, ferrous metal smelting and processing, chemical materials and products manufacturing, and light industry such as the textile industry [63]. With flourishing tertiary industries and high-tech secondary industries, the ecological and environmental condition is better than that in BTH. However, the urban areas are expanding too rapidly, resulting in the destruction of rural arable land and natural resources [64]; thus, limiting construction land and using land more intensively should be a focus in this region. Shanghai is the core city, whose radiative effects are well exerted throughout the whole region. Nanjing and Hangzhou, sub-centres of the urban agglomeration, can more comprehensively develop to be a powerful force for regional development [65]. For the part in Anhui with a low NEP and unbalanced carbon emission, balanced development, industrial upgrading and ecological protection is required, on the prospect of integrating into the Yangtze River Area [66]. In northern coastal areas, such as Yancheng and Nantong, with high NEPs but also high carbon sources, industry improvement should be particularly considered.
The PRD has a high NEP level and low Moran’s I level because of the unbalanced vegetation growth status [35]. Urbanization occurred greatly according to policy guidance. For example, the coordinate development program released in 2004 deferred the local urban expansion [67], while the Asian Games in Guangzhou in 2011 greatly promoted urban land use in the surrounding regions [68]. The highest urban patch size suggests construction land clusters, such as new districts and development zones, which occupy too much land and exhibit low-efficiency utilization [69]. At the forefront of China’s reform and opening up, the PRD has become the largest global manufacturing base. The PRD has undergone manufacturing relocation because of severe land and labour shortages, as well as rising rent costs in urban core zones, such as Shenzhen and Guangzhou downtown areas [70]. Balanced economic development should be a focus here because the development gap between the south-central areas and other locations is great, with significant characteristics of a regional layer structure [71,72]. Guangzhou, Shenzhen and Zhuhai are the absolute poles in this region, and their radiative effects should be given full priority. Other locations, such as Huizhou, Heyuan and Shanwei, can properly develop tourism with green hills and waters to bridge the economic gap [73,74]. Although the ecological and environmental conditions are fine, a protective policy should be assured, particularly in the west.
As the three urban agglomerations underwent rapid urban expansion between 2000 and 2013, it became urgent to optimize the urban size and structure and bring about positive economic and social impacts. Consistent with the urban planning policy, a balance should be sought between construction land for economic development and other land for ecological protection in the three urban agglomerations. For BTH, a regional synergetic strategy should be implemented, particularly in the promotion of joint industries and cooperative ecological protection. The YRD, which has world-class development prospects, should focus on limiting construction land and optimizing resource allocation. The PRD, the whole region in the same province, should realize integration development with a unified advantage.

6. Conclusions

BTH, YRD and PRD are three of the coastal urban agglomerations in China. As population growth and economic development have been concentrated in these regions during the past 20 years, these regions are typical developed regions in China. We presented an analytical framework to study the spatial and temporal pattern of regional carbon budgets in the three regions and made a comparison. By unifying the spatial-temporal resolution of carbon source and sink data, we made it possible to compare carbon budgets in different urban agglomerations. The adoption of the carbon effect study in these three regions is representative of other developing countries, which is supposed to be generalized to the other carbon budgets’ calculation in a locally regional scale. But some problems remain to be solved. For example, parameters used in NEP calculations should be proved to be reliable or adjustable and can be extended to other regions. So, additional research ought to be conducted to test the practical application of the analytical framework.
In conclusion, as discussed above, urban expansion and carbon source and sink patterns are different among these three regions. The built-up area in BTH gradually expanded and combined with the surrounding clusters. Carbon liabilities are the most evident in BTH, with its ecological vulnerability and carbon-intensive industries. The built-up area in the YRD rapidly grew and generated many new urban core zones. Despite good ecological status, carbon emissions and liabilities in the YRD show high spatial aggregation. There is great polarization in the carbon budget pattern of the PRD between the urban core zone and its periphery. Nevertheless, industrial growth, regional equilibrium and ecological protection are common goals. Therefore, a land-use policy in the whole of the three urban agglomerations should be sought to balance the construction land for economic development and other land for ecological protection.

Author Contributions

X.C. designed the study and supervised the project. X.C. outlined the manuscript and conducted the statistical analysis. J.W. collected data, finished model running and wrote and revised the manuscript. S.L. finished model running and revised the manuscript. S.S. advised on the project and revised the manuscript. Y.L., M.W. and S.W. revised the figures. All of the authors reviewed the manuscript.

Funding

This work was funded by the Youth Innovation Talent Humanities and Social Science Project of the Guangdong Provincial Education Department (2016WQNCX040), and the Ministry of Education, Humanities, and Social Science Fund of China (19YJAZH008 and 19YJCZH186).

Conflicts of Interest

The authors declare no conflict of interest.

References

  1. Luo, Y.; Weng, E. Dynamic disequilibrium of the terrestrial carbon cycle under global change. Trends Ecol. Evol. 2011, 26, 96–104. [Google Scholar] [CrossRef] [PubMed]
  2. Baldocchi, D.; Kelliher, F.M.; Black, T.A.; Jarvis, P. Climate and vegetation controls on boreal zone energy exchange. Glob. Chang. Biol. 2008, 6, 69–83. [Google Scholar] [CrossRef]
  3. Haverd, V.; Ahlström, A.; Smith, B.; Canadell, J.G. Carbon cycle responses of semi-arid ecosystems to positive asymmetry in rainfall. Glob. Chang. Biol. 2017, 23, 793–800. [Google Scholar] [CrossRef] [PubMed]
  4. Willeit, M.; Ganopolski, A.; Dalmonech, D.; Foley, A.M.; Feulner, G. Time-scale and state dependence of the carbon-cycle feedback to climate. Clim. Dyn. 2014, 42, 1699–1713. [Google Scholar] [CrossRef]
  5. Gao, X.; Schlosser, A.; Sokolov, A.P.; Anthony, K.W.; Zhuang, Q.L.; Kicklighter, D.W. Permafrost degradation and methane: Low risk of biogeochemical climate-warming feedback. Environ. Res. Lett. 2013, 8, 035014–035020. [Google Scholar] [CrossRef]
  6. Raupach, M.R.; Canadell, J.G.; Ciais, P.; Friedlingstein, P.; Rayner, P.J.; Trudinger, C.M. The relationship between peak warming and cumulative CO2 emissions, and its use to quantify vulnerabilities in the carbon-climate-human system. Tellus Ser. Bn Chem. Phys. Meteorol. 2011, 63, 145–164. [Google Scholar] [CrossRef]
  7. Alton, P.B. Reduced carbon sequestration in terrestrial ecosystems under overcast skies compared to clear skies. Agric. For. Meteorol. 2008, 148, 1641–1653. [Google Scholar] [CrossRef]
  8. Miles, L.; Kapos, V. Reducing greenhouse gas emissions from deforestation and forest degradation: Global land-use implications. Science 2008, 320, 1454–1455. [Google Scholar] [CrossRef] [PubMed]
  9. Morita, M. Quantification of increased flood risk due to global climate change for urban river management planning. Water Sci. Technol. J. Int. Assoc. Water Pollut. Res. 2011, 63, 2967–2974. [Google Scholar] [CrossRef]
  10. Alam, A. Nuclear energy, CO2 emissions and economic growth: The case of developing and developed countries. J. Econ. Stud. 2013, 40, 822–834. [Google Scholar] [CrossRef]
  11. Shahbaz, M.; Hye, Q.M.A.; Tiwari, A.; Leitao, N.C. Economic growth, energy consumption, financial development, international trade and CO2 emissions in Indonesia. Renew. Sustain. Energy Rev. 2013, 25, 109–121. [Google Scholar] [CrossRef]
  12. Grimm, N.B.; Faeth, S.H.; Golubiewski, N.E.; Redman, C.L.; Wu, J.G.; Bai, X.M.; Briggs, J.M. Global change and the ecology of cities. Science 2008, 319, 756–760. [Google Scholar] [CrossRef] [PubMed]
  13. Zhang, W.T.; Huang, B.; Luo, D. Effects of land use and transportation on carbon sources and carbon sinks: A case study in Shenzhen, China. Landsc. Urban Plan. 2014, 122, 175–185. [Google Scholar] [CrossRef]
  14. Pan, A. Foreign Trade, Interregional Trade and Carbon Emissions Transfer: Analysis Based on China’ Regional Input output Tables. J. Financ. Econ. 2017, 43, 57–69. [Google Scholar]
  15. Wang, Z.F.; Chen, P. Unbalanced Economic Development and Coordinated Development of Eastern and Western China. J. Jishou Univ. 2010, 31, 111–115. [Google Scholar]
  16. Wu, X.Y. An Empirical Study on the Unbalance Development of China’s Insurance Industry across Provinces: 1997–2007. J. Quant. Tech. Econ. 2009, 6, 99–114. [Google Scholar]
  17. Shen, L.; Sun, Y.Z. Review on carbon emissions, energy consumption and low-carbon economy in China from a perspective of global climate change. J. Geogr. Sci. 2016, 26, 855–870. [Google Scholar] [CrossRef] [Green Version]
  18. Chuai, X.W.; Huang, X.J.; Zhang, M.; Lu, Q.L.; Zhao, R.Q.; Lu, J.Y. Spatiotemporal Changes of Built-Up Land Expansion and Carbon Emissions Caused by the Chinese Construction Industry. Environ. Sci. Technol. 2015, 49, 13021–13030. [Google Scholar] [CrossRef]
  19. Chen, B.; Yang, S.; Xu, X.D.; Zhang, W. The impacts of urbanization on air quality over the Pearl River Delta in winter: Roles of urban land use and emission distribution. Theor. Appl. Climatol. 2014, 117, 29–39. [Google Scholar] [CrossRef]
  20. Diao, Y.W.; Huang, J.P.; Liu, C.; Cui, J.; Liu, S.D. A Modeling Study of CO_2 Flux and Concentrations over the Yangtze River Delta Using the WRF-GHG Model. Chin. J. Atmos. Sci. 2015, 39, 849–860. [Google Scholar]
  21. Wang, H.; Chen, C.C.; Pan, T.; Liu, C.L.; Chen, L.; Sun, L. County scale characteristics of CO2 emission’s spatial-temporal evolution in the Beijing-Tianjin-Hebei Metropolitan Region. Huan Jing Ke Xue 2014, 35, 385–393. [Google Scholar]
  22. Zha, D.L.; Zhou, D.Q.; Zhou, P. Driving forces of residential CO2 emissions in urban and rural China: An index decomposition analysis. Energy Policy 2010, 38, 3377–3383. [Google Scholar]
  23. Sun, L.Y.; Li, L.; Chen, Z.Z.; Wang, J.Y.; Xiong, Z.Q. Combined effects of nitrogen deposition and biochar application on emissions of N2O, CO2 and NH3 from agricultural and forest soils. Soil Sci. Pl. Nutr. 2014, 60, 254–265. [Google Scholar] [CrossRef]
  24. Haas, J.; Ban, Y. Urban growth and environmental impacts in Jing-Jin-Ji, the Yangtze, River Delta and the Pearl River Delta. Int. J. Appl. Earth Obs. Geoinform. 2014, 30, 42–55. [Google Scholar] [CrossRef]
  25. Xie, H.; Wang, W. Spatiotemporal differences and convergence of urban industrial land use efficiency for China’s major economic zones. J. Geogr. Sci. 2015, 25, 1183–1198. [Google Scholar] [CrossRef]
  26. Li, J.; Wang, Z.L.; Lai, C.G.; Wu, X.Q.; Zeng, Z.Y.; Chen, X.H.; Lian, Y.Q. Response of net primary production to land use and land cover change in mainland China since the late 1980s. Sci. Total Environ. 2018, 639, 237–247. [Google Scholar] [CrossRef]
  27. He, L.Y.; Huang, X.F.; Xue, L.; Hu, M.; Lin, Y.; Zheng, J.; Zhang, R.Y.; Zhang, Y.H. Submicron aerosol analysis and organic source apportionment in an urban atmosphere in Pearl River Delta of China using high-resolution aerosol mass spectrometry. J. Geophys. Res. Atmos. 2011, 116. [Google Scholar] [CrossRef]
  28. Tian, Z.H.; Liu, R.H. Inter-annual Variations of the Carbon Footprint in Beijing Tianjin and Hebei Agro-ecosystem. J. Agric. Resour. Environ. 2018, 35, 167–173. [Google Scholar]
  29. Yi, B.L.; Han, J.; Zhou, X.; Yang, F.; Meng, X.; Cao, W.X.; Huang, L.X.; Xiang, W.N. Spatiotemporal pattern of carbon sources and sinks in Yangtze River Delta region, China. Chin. J. Appl. Ecol. 2015, 26, 973–980. [Google Scholar]
  30. Morton, P.A.; Andreas, H. Vegetation matters: Correcting chamber carbon flux measurements using plant volumes. Sci. Total Environ. 2018, 639, 769–772. [Google Scholar] [CrossRef]
  31. Amiro, B.D.; Tenuta, M.; Gervais, M.; Glenn, A.J.; Gao, X. A decade of carbon flux measurements with annual and perennial crop rotations on the Canadian Prairies. Agric. For. Meteorol. 2017, 247, 491–502. [Google Scholar] [CrossRef]
  32. Ng, B.; Hutyra, L.R.; Nguyen, H.T.; Cobb, A.R.; Kai, F.M.; Harvey, C.F.; Gandois, L. Carbon fluxes from an urban tropical grassland. Environ. Pollut. 2015, 203, 227–234. [Google Scholar] [CrossRef] [Green Version]
  33. Rahman, M.M.; Kashem, M.A. Carbon emissions, energy consumption and industrial growth in Bangladesh: Empirical evidence from ARDL cointegration and Granger causality analysis. Energy Policy 2017, 110, 600–608. [Google Scholar] [CrossRef]
  34. Cao, Q.R.; Kang, W.; Sajid, M.J.; Cao, M. Measuring China’s carbon emissions based on final consumption. Energy Procedia 2018, 152, 853–862. [Google Scholar] [CrossRef]
  35. Chuai, X.; Qi, X.; Zhang, X.; Li, J.; Yuan, Y.; Guo, X.; Huang, X.; Park, S.; Zhao, R.; Xie, X.; et al. Land degradation monitoring using terrestrial ecosystem carbon sinks/sources and their response to climate change in China. Land Degrad. Dev. 2018, 29, 3489–3502. [Google Scholar] [CrossRef]
  36. Abdalla; Fadul, R.A. Assessment and Mapping of Urban Forest Cover and Carbon Emission in Khartoum Locality Using Remote Sensing and GIS. Available online: http://khartoumspace.uofk.edu/handle/123456789/20912 (accessed on 1 May 2016).
  37. Meng, L.; Crijns, W.H.; Worrell, E.; Huang, B. Estimating CO2 emissions at urban scales by DMSP/OLS nighttime light imagery: Methodological challenges and a case study for China. Energy 2014, 71, 468–478. [Google Scholar] [CrossRef]
  38. Zhang, Y.J.; Yu, G.R.; Yang, J.; Wimberly, M.C.; Zhang, X.Z.; Tao, J.; Jiang, Y.B.; Zhu, J.T. Climate-driven global changes in carbon use efficiency. Glob. Ecol. Biogeogr. 2014, 23, 144–155. [Google Scholar] [CrossRef]
  39. Heinsch, F.A.; Zhao, M.S.; Running, W.R.; Kimball, J.S.; Nemani, R.R.; Davis, K.J.; Bolstad, P.V.; Cook, B.D.; Desai, A.R.; Ricciuto, D.M.; et al. Evaluation of Remote Sensing Based Terrestrial Productivity From MODIS Using Regional Tower Eddy Flux Network Observations. IEEE Trans. Geosci. Remote Sens. 2006, 44, 1908–1925. [Google Scholar] [CrossRef]
  40. Cao, Z.Y. Estimating the Spatial Distribution of GDP Based on Nighttime Light Image and Analysis of Correlation Between It and PM2.5 Concentration; Guangzhou Institute of Geochemistry, CAS: Guangzhou, China, 2016. [Google Scholar]
  41. Liu, Z.F.; He, C.Y.; Zhang, Q.F.; Huang, Q.X.; Yang, Y. Extracting the dynamics of urban expansion in China using DMSP-OLS nighttime light data from 1992 to 2008. Landsc. Urban Plan. 2012, 106, 62–72. [Google Scholar] [CrossRef]
  42. Li, Z.A.; Kurz, W.; Banfield, E. Temporal changes of forest net primary production and net ecosystem production in west central Canada associated with natural and anthropogenic disturbances. Can. J. For. Res. 2003, 33, 2340–2351. [Google Scholar] [CrossRef]
  43. Yu, G.; Zheng, Z.; Wang, Q.; Fu, Y.; Zhuang, J.; Sun, X. Spatiotemporal pattern of soil respiration of terrestrial ecosystems in China: the development of a geostatistical model and its simulation. Environ. Sci. Technol. 2010, 44, 6074–6080. [Google Scholar] [CrossRef]
  44. Shao, L.; Chen, G.Q.; Chen, Z.M.; Guo, S.; Han, M.Y.; Zhang, B.; Hayat, T.; Alsaedi, A.; Ahmad, B. Systems accounting for energy consumption and carbon emission by building. Commun. Nonlinear Sci. Numer. Simul. 2014, 19, 1859–1873. [Google Scholar] [CrossRef]
  45. Shahzad, J.; Kumar, R.R.; Zakaria, M.; Hurr, M. Carbon emission, energy consumption, trade openness and financial development in Pakistan: A revisit. Renew. Sustain. Energy Rev. 2017, 70, 185–192. [Google Scholar] [CrossRef]
  46. Letu, H.; Hara, M.; Yagi, H.; Tana, G.; Nishio, F. Estimating the energy consumption with nighttime city light from the DMSP/OLS imagery. In Proceedings of the Urban Remote Sensing Joint Event, Shanghai, China, 20–22 May 2009. [Google Scholar] [CrossRef]
  47. Wu, J.S.; Niu, Y.; Peng, J.; Wang, Z.; Huang, X.L. Research on energy consumption dynamic among prefecture-level cities in China based on DMSP/OLS Nighttime Light. Geogr. Res. 2014, 33, 625–634. [Google Scholar]
  48. Xie, Y.; Weng, Q. World energy consumption pattern as revealed by DMSP-OLS nighttime light imagery. Mapp. Sci. Remote Sens. 2016, 53, 265–282. [Google Scholar] [CrossRef]
  49. Mitchell, A. The ESRI Guide to GIS Analysis; ESRI Pres: Redlands, CA, USA, 2005; Volume 2. [Google Scholar]
  50. Thompson, E.S.; Saveyn, P.; Declercq, M.; Meert, J.; Guida, V.; Eads, C.; Robles, E.; Britton, M.M. Characterisation of heterogeneity and spatial autocorrelation in phase separating mixtures using Moran’s I. J. Coll. Interface Sci. 2018, 513, 180–187. [Google Scholar] [CrossRef]
  51. Tyralis, H.; Mamassis, N.; Photis, Y.N. Spatial Analysis of Electricity Demand Patterns in Greece: Application of a GIS-based Methodological Framework. Energy Procedia 2016, 97, 262–269. [Google Scholar] [CrossRef]
  52. Vessella, F.; Salis, A.; Scirè, M.; Piovesan, G.; Schirone, B. Natural regeneration and gender-specific spatial pattern of Taxus baccata in an old-growth population in Foresta Umbra (Italy). Dendrobiology 2015, 73, 75–90. [Google Scholar] [CrossRef] [Green Version]
  53. Liao, H.; Cao, H.S. How does carbon dioxide emission change with the economic development? Statistical experiences from 132 countries. Glob. Environ. Chang. 2013, 23, 1073–1082. [Google Scholar] [CrossRef]
  54. Grant, R.F.; Baldocchi, D.; Ma, S. Ecological controls on net ecosystem productivity of a seasonally dry annual grassland under current and future climates: Modelling with ecosys. Agric. For. Meteorol. 2012, 152, 189–200. [Google Scholar] [CrossRef]
  55. Price, J.; Quaife, T.; Woodward, I. Using MODIS Vegetation Index Data to Test Land Cover Parameterisation in a Global Vegetation Model Across Europe. In Proceedings of the EGU General Assembly, Vienna, Austria, 7–12 April 2013. [Google Scholar]
  56. Cai, H.Y.; Di, X.Y.; Chang, S.X.; Wang, C.K.; Shi, B.K.; Geng, P.F.; Jin, G.Z. Carbon storage, net primary production, and net ecosystem production in four major temperate forest types in northeastern China. Can. J. For. Res. 2015, 46, 620–623. [Google Scholar] [CrossRef]
  57. Chang, C.C. A multivariate causality test of carbon dioxide emissions, energy consumption and economic growth in China. Appl. Energy 2010, 87, 3533–3537. [Google Scholar] [CrossRef]
  58. Randerson, J.T.; Chapin, F.S.; Harden, J.W.; Neff, J.C.; Harmon, M.E. Net Ecosystem Production: A Comprehensive Measure of Net Carbon Accumulation by Ecosystems. Ecol. Appl. 2002, 12, 937–947. [Google Scholar] [CrossRef]
  59. Zhang, L.; Guo, H.D.; Jia, G.; Wylie, B.; Gilmanov, T.; Howard, D.; Ji, L.; Xiao, J.F.; Yuan, W.P.; Zhao, T.B.; et al. Net ecosystem productivity of temperate grasslands in northern China: An upscaling study. Agric. For. Meteorol. 2014, 184, 71–81. [Google Scholar] [CrossRef]
  60. Guo, Z.C.; Fu, Z.X. Current situation of energy consumption and measures taken for energy saving in the iron and steel industry in China. Energy 2010, 35, 4356–4360. [Google Scholar] [CrossRef]
  61. Duan, W.J.; Lang, J.L.; Cheng, S.Y.; Jia, J.; Wang, X.Q. Air Pollutant Emission Inventory from Iron and Steel Industry in the Beijing-Tianjin-Hebei Region and Its Impact on PM (2.5). Environ. Sci. 2018, 39, 1445–1454. [Google Scholar]
  62. Tao, Y.; Zhang, S.L. Environmental efficiency of electric power industry in the Yangtze River Delta. Math. Comput. Model. 2013, 58, 927–935. [Google Scholar] [CrossRef]
  63. Zheng, Y.B.; Gu, Y.R.; Zhang, M.; Wang, K.; Huang, Z.L.; Lin, C.S.; Gao, Z.L. Health care workers in Pearl River Delta Area of China are not vaccinated adequately against hepatitis B: A retrospective cohort study. BMC Infect. Dis. 2015, 15, 542–548. [Google Scholar] [CrossRef]
  64. Han, J.; Meng, X.; Zhou, X.; Yi, B.L.; Liu, M.; Xiang, W.N. A long-term analysis of urbanization process, landscape change, and carbon sources and sinks: A case study in China’s Yangtze River Delta region. J. Clean. Prod. 2017, 141, 1040–1050. [Google Scholar] [CrossRef]
  65. Gu, C.L.; Hu, L.Q.; Zhang, X.M.; Wang, X.D.; Guo, J. Climate change and urbanization in the Yangtze River Delta. Habitat Int. 2011, 35, 544–552. [Google Scholar] [CrossRef]
  66. Chen, M.X.; Gong, Y.H.; Lu, D.D.; Ye, C. Build a people-oriented urbanization: China’s new-type urbanization dream and Anhui model. Land Use Policy 2019, 80, 1–9. [Google Scholar] [CrossRef]
  67. Zhang, Y.H.; Hu, T.; Zhong, L.J.; Wiedensohler, A.; Liu, S.C.; Andreae, M.O.; Wang, W.Z.; Fan, S.J. Regional integrated experiments on air quality over Pearl River Delta 2004 (PRIDE-PRD2004): Overview. Atmos. Environ. 2008, 42, 6157–6173. [Google Scholar] [CrossRef]
  68. He, S.J.; Liu, Z. A follow-on study on the impact of urban redevelopment on local residents induced by the Asian Games: An investigation in three affected communities in Guangzhou. Geogr. Res. 2013, 32, 1046–1056. [Google Scholar]
  69. Yue, W.; Liu, Y.; Fan, P. Measuring urban sprawl and its drivers in large Chinese cities: The case of Hangzhou. Land Use Policy 2013, 31, 358–370. [Google Scholar] [CrossRef]
  70. Li, Y.; He, C.F. Characteristics and mechanism of manufacturing industry shift in the Pearl River Delta during 1998–2009. Progress Geogr. 2013, 32, 777–787. [Google Scholar]
  71. Liu, Z.J.; Huang, H.Q.; Werners, S.E.; Yan, D. Construction area expansion in relation to economic-demographic development and land resource in the Pearl River Delta of China. J. Geogr. Sci. 2016, 26, 188–202. [Google Scholar] [CrossRef]
  72. Zhang, D.J.; Liu, K.W.; Chen, Z.N.; Wang, L.B. The Ubuffer Spatial Analysis on Economic Growth of the Pearl River Delta Urban Agglomerations Based on UGIS. Progress Geogr. 2009, 28, 259–263. [Google Scholar]
  73. Wang, T.Y.; Luo, S.M. Tourism Resources in West and East Guangdong and Their Exploitation. Trop. Geogr. 2007, 27, 76–80. [Google Scholar]
  74. Zhu, F.B.; Lu, L. Spatial Tourism Equilibrium Development in the Pearl River Delta Metropolitan Area. J. Nat. Resour. 2010, 25, 1565–1576. [Google Scholar]
Figure 1. Spatial distributions of the three coastal urban agglomerations in China.
Sustainability 11 04590 g001
Figure 2. Built-up area proportion of the three urban agglomerations.
Sustainability 11 04590 g002
Figure 3. Mean patch size of the three urban agglomerations.
Sustainability 11 04590 g003
Figure 4. Shape index of built-up area in the three urban agglomerations.
Sustainability 11 04590 g004
Figure 5. Urban expansion from 2000 to 2013 in the three urban agglomerations. (a) BTH; (b) YRD; (c) PRD.
Sustainability 11 04590 g005aSustainability 11 04590 g005b
Figure 6. Carbon emissions in 2000 and 2013 in BTH.
Sustainability 11 04590 g006
Figure 7. Carbon emissions in 2000 and 2013 in the YRD.
Sustainability 11 04590 g007
Figure 8. Carbon emissions in 2000 and 2013 in the PRD.
Sustainability 11 04590 g008
Figure 9. NEP spots in 2000 and 2013 in BTH.
Sustainability 11 04590 g009
Figure 10. NEP spots in 2000 and 2013 in the YRD.
Sustainability 11 04590 g010
Figure 11. NEP spots in 2000 and 2013 in the PRD.
Sustainability 11 04590 g011
Figure 12. Carbon budgets in 2000 and 2013 in BTH.
Sustainability 11 04590 g012
Figure 13. Carbon budgets in 2000 and 2013 in the YRD.
Sustainability 11 04590 g013
Figure 14. Carbon budgets in 2000 and 2013 in the PRD.
Sustainability 11 04590 g014
Table 1. Geostatistics of net ecosystem production (NEP) in the three urban agglomerations (gC·m−2·year−1). Mean indicates annual mean value, Std dev. is the standard deviation and Moran’s I measures the spatial autocorrelation.
YearBeijing–Tianjin–Hebei (BTH)Yangtze River Delta (YRD)Pearl River Delta (PRD)
MeanStd dev.Moran’s IMeanStd dev.Moran’s IMeanStd dev.Moran’s I
NEP in the whole urban agglomeration (gC·m−2·year−1)2000−55.6069.580.493493.89149.570.5146144.37260.960.2511
2001−67.5472.080.4797183.11157.130.5221190.66279.220.2840
2002−28.1874.550.4543190.65156.090.4995158.89261.690.2627
200317.8180.950.4629133.76169.500.5961211.01280.730.2563
200460.2279.570.4706168.96172.050.5799261.87302.110.2713
2005−6.9480.890.438794.85166.800.5977143.11263.490.2408
20066.3176.550.4528165.93163.250.5418169.50272.060.2583
2007−49.6185.650.4824160.23175.590.5778177.33289.280.2716
200817.0983.230.4451177.74160.100.5168161.17287.090.2695
2009−26.5782.450.4373128.76167.130.5687166.49299.780.3142
2010−40.7678.510.5014163.94157.560.4697164.00275.040.2991
2011−12.6882.860.4579118.85158.940.5474165.32281.920.3023
201214.6081.750.4218195.46160.260.4826184.98272.350.2736
2013−17.2584.810.4291163.53164.500.5094196.18268.110.2551
NEP in built-up area (gC·m−2·year−1)2000−75.3150.400.34415.20136.840.39960.70238.530.1643
2001−72.0448.050.246560.56154.250.4197−8.72247.470.1816
2002−42.7950.750.278585.87132.060.37911.90238.230.2004
2003−4.5855.620.248034.46143.340.415935.19231.180.2271
200418.5264.480.251154.31143.520.419013.49235.240.3363
2005−47.5658.300.26823.19129.370.3946−35.93225.640.2018
2006−47.6858.950.264110.98122.490.2706−24.27225.920.1935
2007−81.9655.470.327617.19130.620.314836.57242.900.2439
2008−25.2560.680.324246.54132.140.2474−15.68235.540.3130
2009−65.0558.060.4171−0.94130.040.2502−3.90226.960.3085
2010−78.7552.920.325524.98131.370.2479−17.86227.230.3717
2011−62.6260.600.29135.32125.060.3208−51.40219.060.3129
2012−37.0062.960.297661.54131.310.2793−76.95205.480.2837
2013−53.0259.040.231733.05124.410.2619−48.01217.390.3123
Table 2. Geostatistics of carbon emissions in the three urban agglomerations (gC·m−2·year−1). Mean indicates annual mean value, Std dev. is the standard deviation and Moran’s I measures the spatial autocorrelation.
YearBTHYRDPRD
MeanStd dev.Moran’s IMeanStd dev.Moran’s IMeanStd dev.Moran’s I
2000463.041442.780.9469490.941367.930.6669259.40666.370.8523
2001544.521505.500.9477475.541173.070.6799277.57669.770.8546
2002566.061482.580.9433506.951089.180.6858297.70681.580.8706
2003636.431550.600.9434552.181056.890.7010366.93769.930.8606
2004701.951637.050.9453656.461228.020.7085400.48826.350.8601
2005826.181895.500.9461589.901082.930.7178483.27991.790.8609
2006891.891945.320.9487838.931447.070.7439553.741106.910.8671
2007982.722092.430.9482929.471565.340.7424611.721206.120.8692
2008977.992023.760.9490992.531622.940.7499650.881265.790.8693
20091038.982105.400.94991044.971695.250.7501693.791341.060.8693
20101085.692133.880.95131082.261669.760.7604725.161372.460.8732
20111176.122261.820.94961128.701677.150.7531762.401395.200.8681
20121215.772283.050.94971161.78681.980.7523778.471413.510.8687
20131307.462290.700.94881255.881718.910.7491755.931306.510.8676
Table 3. Geostatistics of carbon budgets in the three urban agglomerations (gC·m−2·year−1). Mean indicates annual mean value, Std dev. is the standard deviation and Moran’s I measures the spatial autocorrelation.
YearBTHYRDPRD
MeanStd dev.Moran’s IMeanStd dev.Moran’s IMeanStd dev.Moran’s I
2000−292.93697.230.7417−121.39631.510.396847.56458.910.6916
2001−378.56843.500.7226−52.72640.530.445076.91504.670.7106
2002−369.61909.610.7712−100.28716.320.493327.94512.830.7357
2003−388.111030.010.7358−216.66769.760.526929.09612.820.7522
2004−401.201116.090.7489−253.63901.760.539559.78671.610.7629
2005−554.171301.450.8038−287.32797.430.5468−102.03746.420.7961
2006−600.731374.110.8175−395.271112.470.5986−119.06837.920.8151
2007−724.381490.150.8185−470.811204.860.5941−146.48902.690.8184
2008−663.781454.820.8221−509.841288.660.6137−189.19954.620.8267
2009−758.611533.960.8264−597.941343.250.6133−208.971004.110.8302
2010−822.631611.030.8370−617.011396.820.6380−235.181032.730.8441
2011−871.291739.100.8348−713.791416.760.6244−270.961079.810.8448
2012−885.311780.580.7931−670.431437.130.6230−252.591030.910.8505
2013−1008.621792.540.7226−795.521483.990.6260−262.841105.340.8436

