Article

Features of R&D Teams and Innovation Performances of Sustainable Firms: Evidence from the “Sustainability Pioneers” in the IT Hardware Industry

1
Biancaffè S.R.L., 84095 Giffoni Valle Piana SA, Italy
2
Department of Industrial Engineering, University of Salerno, 34997 Fisciano SA, Italy
*
Author to whom correspondence should be addressed.
Sustainability 2019, 11(17), 4524; https://doi.org/10.3390/su11174524
Submission received: 28 June 2019 / Revised: 13 August 2019 / Accepted: 18 August 2019 / Published: 21 August 2019
(This article belongs to the Special Issue Product Innovation and Sustainability)

Abstract

:
The aim of this work is to characterize the R&D teams of sustainable companies and analyze how they perform in terms of patent quality. The study is based on 13,355 patents filed by leading companies in the IT hardware industry. Team of inventors are characterized in terms of size, mobility, experience and openness. Sustainability is measured in terms of its environmental dimension. Patent quality is defined using ex ante and post hoc indicators. Innovation and financial performances, together with some contextual features, are also considered. One-way ANOVA is performed using “sustainability” as a discriminating factor to analyze whether significant differences are found between sustainable and not sustainable companies. Correlations between team features and patent quality are calculated. Results show that the R&D teams of sustainable companies feature a higher degree of mobility but less experience than those of non-sustainable firms; moreover, a less receptive attitude toward open innovation is observed. Even if, on average, sustainable companies develop less patents, the quality is higher regarding most attributes: scope, architectural capability, scientific and technological value; moreover, superior financial performances are achieved. The features that have a more significant impact on patent quality are the size of the R&D team and the presence of inventors who have published on Scopus.

1. Introduction

In recent years, the availability of information and knowledge and the progress achieved in all science fields have allowed the achievement of extraordinary scientific and technological results. The competitiveness and complexity of markets has increased considerably, and companies and scientific communities have become the cornerstone of the development of world economies. Innovation has become the keyword for achieving sustainable success in such a socio-economic context, and companies’ survival has always been linked to the preservation of the “environment”, in a broad sense, in which they operate. Over the last few years, in fact, time horizons for companies have considerably expanded, moving from a short-term logic, focused on maximizing economic results, to a long-term logic, with the aim of creating stable relationships with the external environment that allow the company to survive for a long time.
In this perspective, one of the main drivers of current innovation is sustainability, understood as a dynamic socio-economic-environmental balance that guarantees a perspective of continuity.
The adaptation to regulations on pollution and the reduction of environmental impact, the need to design sustainable services and products and the need to collaborate in order to achieve higher level scientific results represent a difficult challenge but also a great opportunity for sustainable success and survival [1]. Indeed, innovation in environment-friendly, ’green’, technologies is crucial to ensure sustainable growth [2].
The introduction of the Sustainable Development Goals (SDO) Agenda 2030 [3] is inevitably changing companies’ strategies and objectives; however, on closer inspection, the focus on reducing environmental impact has influenced the governance of entire nations, global strategies and scientific research.
As a matter of fact, innovation has to be considered the obligatory step for significant and sustainable competitive advantage and global economic growth of companies: growth and development that must ensure long-term survival. Therefore, innovating not only allows companies to grow and improve but also to survive over time. The company’s ability to successfully innovate in a lasting manner represents a decisive goal, and attention must be placed on the factors determining such success.
The effectiveness of an innovation process that leads to the development of a patent is linked to many strategic, economic and social factors, but the analysis of the features of the team of inventors undoubtedly also constitutes an interesting issue for the literature on the subject (see, e.g., [4,5]).
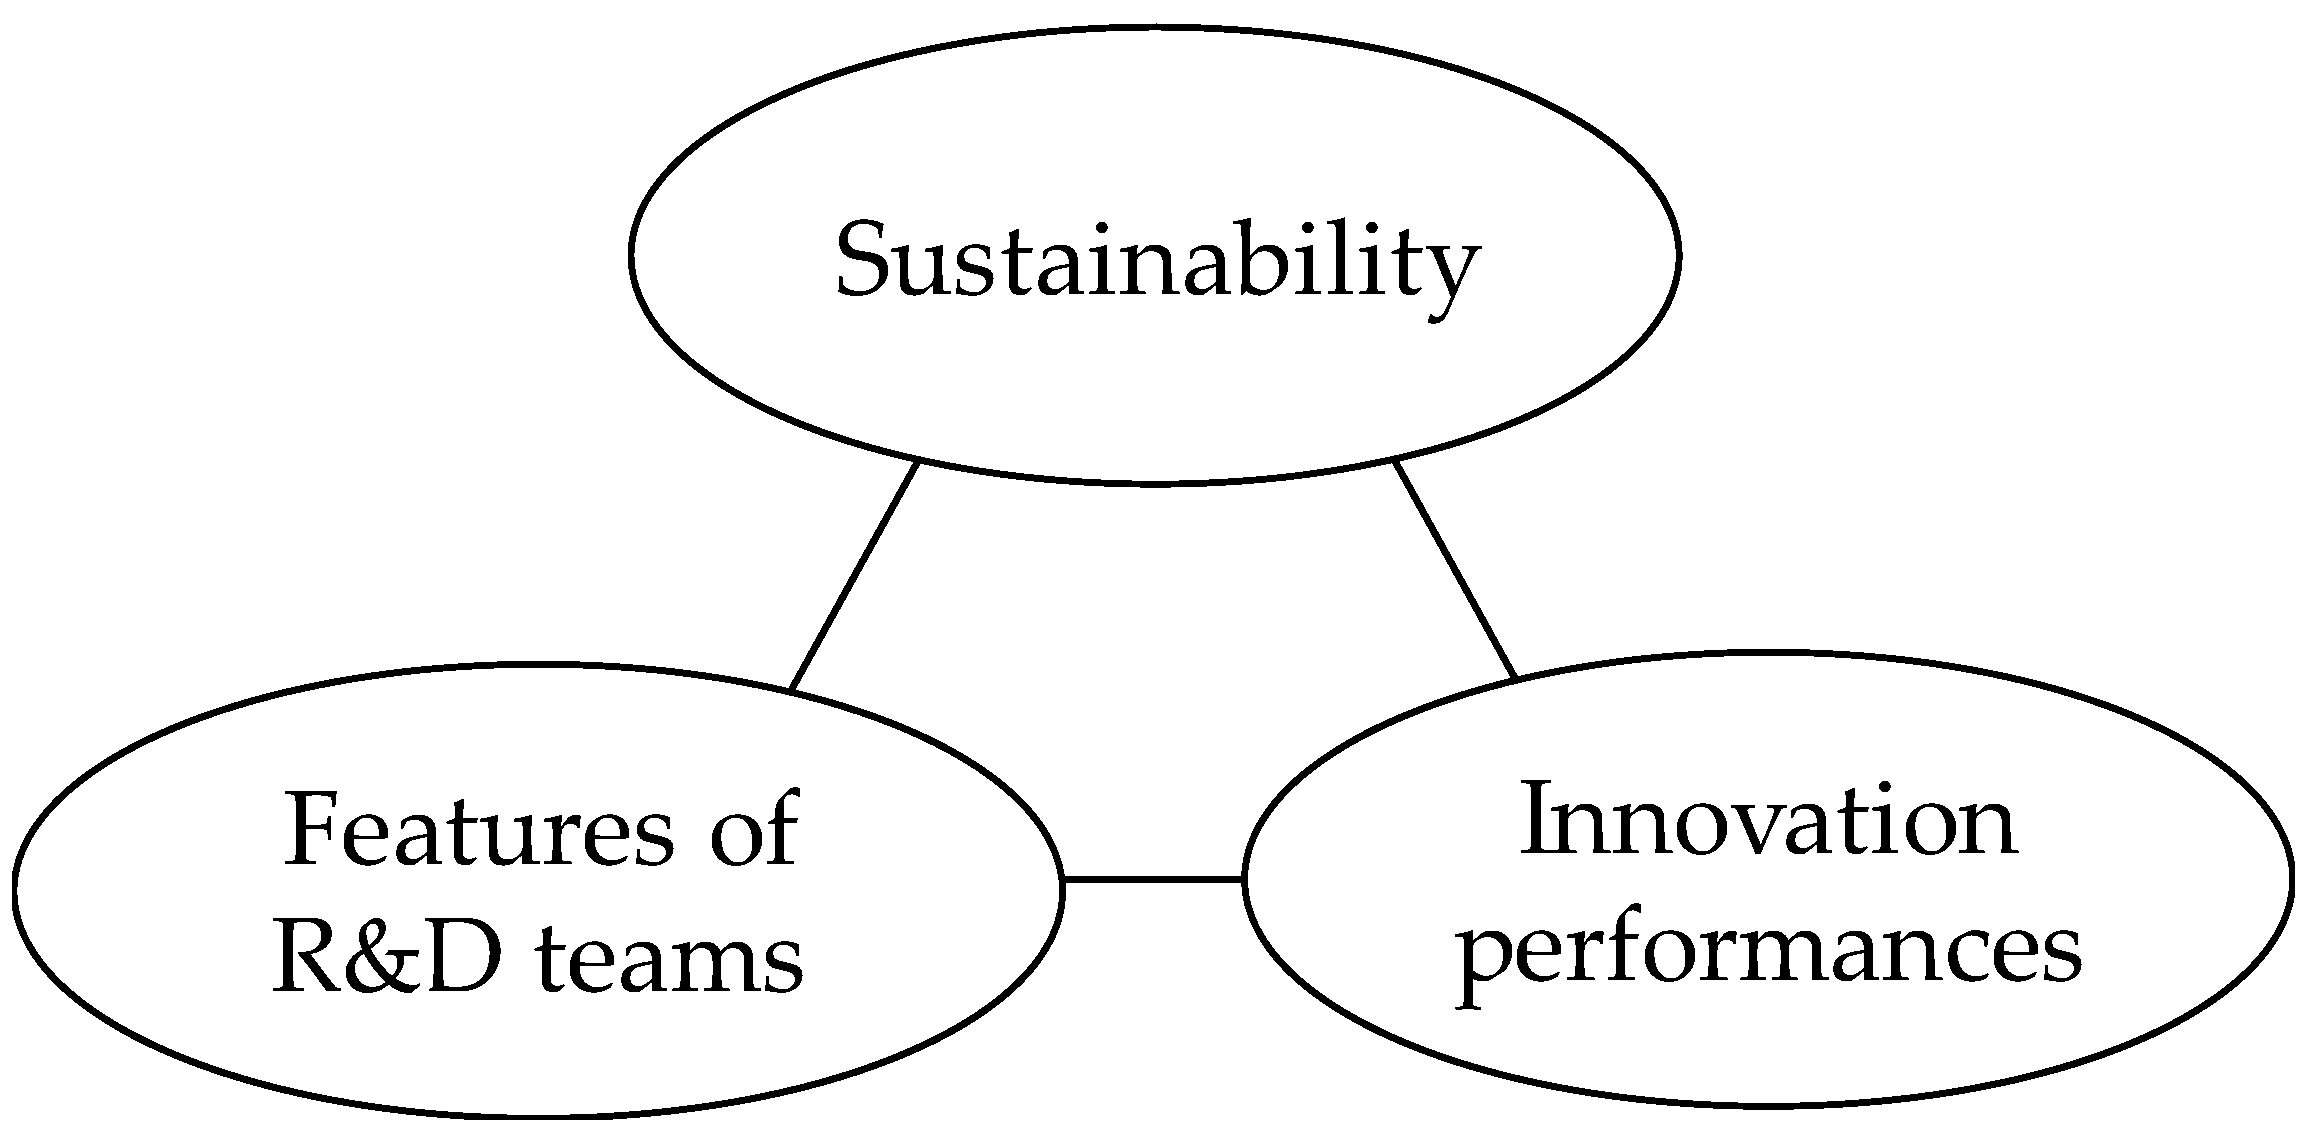
The aim of this work is therefore to characterize the team of inventors and to identify the distinctive elements responsible for virtuous processes of idea generation that have resulted in patents, with the firm conviction that the patent is the maximum expression of a company’s innovative capacity, and that it can be considered as a tool for sustainable success and business survival. The paper aims at answering the following question: how do sustainable companies achieve better innovation performances through the composition of their R&D teams?
This work analyzes 13,355 patents filed by leading companies in the IT hardware industry and characterizes the teams of inventors in terms of mobility, experience and openness. The companies are classified according to their focus on environmental sustainability issues as of 2005, distinguishing “sustainability pioneers” from the other firms. The features of the two clusters are compared, and the relationships between R&D team characteristics and patent quality are investigated.
In what follows, after a brief review on the main characteristics of the team of inventors influencing innovation quality, methodological issues with regard to data sampling, variable definition and statistical methods are reported. Thereafter, results are presented and discussed. Conclusions close the work.

2. Background and Framework

The measure of the innovative capacity of a company is a topic widely debated in the literature [6,7]; patents are certainly the most common measure of a company’s innovative capacity [8]. Recognizing the value of a patent as a tool of innovation and, therefore, of corporate sustainability, one can wonder which are the features of the inventors producing high-quality innovation. In what follows, scientific contributions regarding (1) which characteristics of inventors affect the innovative capability of R&D teams and (2) which are the most relevant innovation performances are analyzed. Therefore, the theoretical framework relating such issues with the sustainability concept is presented.

2.1. R&D Team Features

The literature is rich in contributions investigating the characteristics of patent inventors who have an impact on innovation performances.
A first stream of studies investigates the experience of team members. The basic idea is that inventors’ background, especially if obtained in institutional contexts such as universities, contributes to the availability of resources and ultimately increases the quality of results that can be achieved. Indeed, the level of education and knowledge of team members, as well as belonging to large companies with larger R&D projects, positively influences the number of patents [5]. Some studies highlight the importance of individuals’ background and history and their impact on innovative and inventive activities [9,10], and the role of key inventors in obtaining valuable results is underlined [11,12,13].
Within the broader area of team experience, particular emphasis is given to scientific experience: Zucker et al. [14] believe that the involvement of academics and researchers from universities can be an opportunity to launch and carry out valid research, from the scientific point of view. The quality of the scientists and their need to achieve high-quality objectives also push them to leave research institutions and universities to migrate to companies.
High-quality innovations are supported by highly relevant scientific knowledge and generate high expected economic value [15]; this implies a positive association between the quality of the knowledge base held by an inventor and the interfirm mobility [16]. In fact, the innovative activities underlying the processes of invention/innovation involve practical activities and learning-by-doing but also scientific knowledge forfeited by subjects who have followed a formalized education process [17]. The presence of subjects with a higher level of knowledge is evaluated in terms of scientific publications that the team members present [14,18].
A second set of contributions focuses on the mobility of team members: Trajtenberg [4] confirms the positive impact of R&D employees’ mobility on innovative output and invention value; Hoisl [19] shows how a relationship exists between the inventor’s mobility and his/her productivity: “movers” are in fact more productive. The general idea is that greater knowledge favors the process of knowledge transfer and, therefore, the possibility of reaching a higher level of knowledge. Lewis et al. [20] argue that large corporations characterized by freedom of movement attract talented individuals, triggering a virtuous circle. Fallick et al. [21] believe that mobility represents the possibility of reallocating resources characterized by high levels of innovation. Yet, the result is controversial: as a matter of fact, Klepper [22] verifies that the most productive inventors are less inclined to travel and change employers.
A third stream of studies concentrates on the presence of external sources of knowledge deriving from opening the development process to third parties. Indeed, a growing number of contributions is examining the topic of knowledge sources and the mechanisms necessary to find such knowledge [23,24,25]. The creation of formal or informal networks, collaborations, affiliations and exchanges between companies and institutions goes in this sense; this is particularly true and simpler in cases of geographical proximity [26].
The patent is usually the result of a team’s work and never that of an individual; “open science” reveals an increasing importance of finding knowledge from external organizations, in a general sense, and in particular from universities [27,28].
The main argument is that the cultural background and the availability of resources differ substantially between the heterogeneous contexts of organizations and institutions, involving ways of learning, operating and generating fundamentally different knowledge [29,30].
Rosenkopf and Almeida [31] confirm that knowledge flows between the companies involved in the process lead to a higher overall technological level, reducing distances. However, the potential linked to the transfer of knowledge, and therefore to the effectiveness of the collaboration, is linked to the type of knowledge and to how it is embedded in the team and in the organizational structure [16]. In fact, the value of a researcher’s expertise can depend on his/her interaction with colleagues within the team and be the source of the knowledge generation process.
Related to the presence of external sources, a specific research area concerns team diversity, which is analyzed in literature with contradictive results. If creating teams with diverse talents is definitely an effective human resources strategy [32,33], the use of diverse teams could bring suboptimal performances: positive organizational synergies between diverse expertise and experiences can be counterbalanced by significant difficulties in terms of coordination, tension, and intra/intergroup conflict [34]. Considering such conflicting issues, it is not surprising that some authors found no consistent effects of team diversity on organizational performance [35].
A further issue is team maturity: Katzenbach and Smith [36] introduced a team performance curve that shows how team performance varies with maturity, from medium at the starting phase (working group) to low in an intermediate phase, in which old ties and relationships are broken and new ones are established (pseudo-team), to increasing levels (potential, real and high performing team) when maturity is high. Also, Elrod and Tipped [37] confirmed the general form of Katzenbach and Smith’s team performance curve with some empirical measurements and pointed out that the ultimate performance level of high performing teams is higher than the one attained during the initial step of implementing teams.
Finally, another element that can affect patent productivity and quality is the average age of team members. Actually, the age of the inventor is surely related to his/her experience and mobility: the higher these two features, the older the inventor. Consistently with such an assumption, it is generally believed that the average age of quality inventors is relatively high [38].

2.2. Innovation Performances

The issue of how to measure innovation performances is widely investigated in literature, and many different indicators are proposed. The main distinction can be made between patent indicators and non-patent indicators. Such a dichotomy reflects the complex nature of innovation, which is obviously related to technological issues, but not only to them.
The recourse to patent indicators is justified by the fact that patent documents are a valuable source for the analysis of innovation: indeed, they are publicly available, allow access to a wide range of objective and standardized information, are continuously updated [39], cover decades of innovation activities [6] and are widely acknowledged by scientific literature [40,41,42,43]. Therefore, patent indicators are able to provide objective measures for the output of innovation activities, covering many different aspects of technological information [44].
Among patent indicators, a distinction can be made between ex ante and post hoc measures. The former can be determined at the application date and contain information on the potential value of the patented technology: the number of claims, determining the boundaries of the exclusive right and defining the scope of the patent [44]; the absence of citations to previous patents, determining the originality of the technology [45]; the presence of citations to non-patent literature (NPL) and research papers, defining the scientific content of the patent [46]; and the novelty of the combination of technological areas [47] included in the patent, denoting the capability of creating new architectures [48,49]. The latter can be defined only some years after publication, determining the actual impact of the patent in terms of technological acknowledgment, registered by the number of citations received from other patents [50,51,52], and of market success, defined by the number of patents generated by the applicant after the focal patent and recalling it as a priority [44,53]. Moreover, post hoc indicators also ascertain the fact that, after the application, the patent was actually granted by the receiving patent office and not lapsed by the assignee, i.e., renewal fees were paid to maintain the exclusive right [44,54].
Within non-patent indicators, a variegated set of indicators are used to measure the resources and the inputs employed in the innovation process, the performances of the process itself and the outputs and benefits deriving from it, in terms of both monetary and non-monetary results. The Boston Consulting Group [55] defined funds invested in innovation projects, revenues from new products, projected vs. actual performances, average development time per project, number of projects that meet planned targets, percentage of new ideas funded, number of projects killed at each milestone, and the cannibalization of existing product sales by new offerings as the most important metrics used by companies; however, they also included customer satisfaction, number of new offerings, consumer adoption rate, cost savings, innovation return on investments, gross margin and time to market as indicators that orient executives’ behavior towards innovation projects. The same study reports an input-process-output perspective, where number of new ideas, business unit investments by type of innovation, R&D as a percentage of sales, and full-time technical staff are used to assess the inputs of innovation. Furthermore, idea to decision time, decision to launch time, projects by type and launch date, and the sum of projected net present value provide metrics for the process, while patents granted, launches by business segment, percentage of sales and profit from new products, and innovation return on investments define the outputs of innovation.

2.3. Theoretical Framework

All the elements emerging from the literature review as key features in determining the quality of innovation can be related to sustainability, if this is defined as the ability of efficiently manage scarce resources to achieve positive results. Indeed, the development of a new technology is an extremely complex and time-consuming process, where the knowledge resource is critical. A peculiarity of knowledge is that, even if it is a scarce resource, it is not extinguished by use, but rather strengthened. Indeed, technological learning is past-dependent: through past-dependent learning, a firm can produce new knowledge at a lower cost [56], i.e., in a more sustainable way.
Involving highly educated inventors can reduce development time and ensure high-quality results. Many previous working experiences of inventors translate into a wide set of technical and technological skills that can be effectively employed in current R&D efforts. The same goes when such skills come from diverse and variegated talents. The recourse to inventors with an academic background allows easy access to relevant scientific knowledge. Relying on knowledge networks and other inter-firm collaboration forms optimizes the use of internal and external knowledge resources, reducing times if compared to the exclusively internal development. Resorting to teams of inventors who have already worked together allows companies to skip the running-in phase and to make the most of already developed synergies.
In synthesis, from a sustainability perspective, team experience, mobility, openness, diversity and maturity are all related to the efficient use and re-use of knowledge sources to achieve high-quality results with less effort and in less time and, at the same time, to further developing and strengthening the same sources for future use. For this reason, we believe that companies with higher sustainable propensity might achieve better innovation performances from the composition of their R&D teams (Figure 1).

3. Materials and Methods

3.1. Data and Sample

The research is performed on patents filed by R&D-intense IT hardware companies from 2000 to 2005 and thereafter granted. This industry was selected since intellectual property plays a central role in this sector: patents are a means of appropriation of innovation [57] and can be employed to study innovation practices [58]. The choice of the years of analysis depends on the need for evaluating post hoc patent quality indicators, with 2005 being the latest period for which information is available in PATSTAT 2013 version: indeed, data from 2006 to 2013 were used to define the quality of the patents applied. The firms were selected from The EU Industrial R&D Investment Scoreboard, which annually reports the ranking of the worldwide top R&D spending companies. In particular, only those repeatedly included in the scoreboards from 2005 to 2013 were considered in order to include the firms showing a continuous commitment to innovation. As a whole, 99 companies meet the requirements.
Once companies were identified, all their patents were extracted from PATSTAT together with the list of inventors. Indeed, with the R&D team being a focal point of the research, particular attention was dedicated to the analysis of the curriculum vitae of each inventor. Searching on social networks such as LinkedIn, Xing, ZoomInfo, ResearchGate, and Academia, not only for the current affiliation, but also for each previous working experience of the inventor, was registered. If the inventor had any Scopus publication, it was registered. Data collection was performed for more than 24 man-months, performing searches of the names of inventors and matching data such as the inventor’s address from PATSTAT. The authors preferred to rely on hand-made data collection performed using skilled resources, rather than using automatic tools, in order to reduce issues related to name disambiguation and loss of linkage due to typing errors within PATSTAT. By means of the web search, false positives were detected and eliminated. Moreover, double counting issues were avoided by relying on the standard names of inventors available on PATSTAT.
Complete and unequivocal data were found for the inventors of 13,355 patents applied for by 55 companies, which represented the final sample for the study. The complete list of companies is reported in Appendix A.

3.2. Variable Definition and Measurement

3.2.1. Sustainability

The literature studying environmental innovation has mainly focused on price- and regulation-induced innovation [2]. For the purpose of this study, voluntary measures are introduced. This is due to fact that, as stated before, the period of analysis spans from 2000 to 2005, and during these years the topic of sustainability was not as hot as it is today. For this reason, by the use of voluntary measures, the authors aim to define “sustainability pioneers”. Indeed, in order to identify the companies with a greater focus on environmental sustainability issues, three indicators were considered: the sustainability report, the compliance to ISO 14001, and the registration in the Global Reporting Initiative (GRI) database.
Sustainability report: born to respond to the need for transparency regarding corporate sustainability strategies, it represents the document with which a company reports on its sustainability initiatives and performances, from the point of view of its impact in social, environmental and economic terms. Through this document, the company can communicate its policies and strategies to stakeholders, in relation to the environment, employees and community, as well as information regarding its corporate social responsibility. Even if today drafting a sustainability report is mandatory, it was not in 2005; therefore, companies that prepared it in 2005 can be defined as pioneering.
ISO 14001: voluntary adherence to certification relating to the environmental management system does not indicate any particular environmental performance, but certainly demonstrates the company’s commitment to controlling the environmental impacts of its activities by implementing and continuously updating an adequate management system, especially with reference to the year of analysis.
GRI: a non-profit organization created to provide support for reporting on the sustainable performances of organizations of any size, belonging to any sector and country in the world. It is relevant as it establishes the indexes that are used by companies for drafting their sustainability reports.
Starting from these three indicators, a synthetic indicator is proposed: sustainability is a dummy variable, defined at the firm level, assuming a value of 1 if the company was compliant to all three indicators in 2005, and 0 otherwise. This is a strict definition of sustainability, which allows us to distinguish “sustainability pioneers” from other companies.

3.2.2. R&D Team Features

Most of the characteristics that emerged from the literature review are considered in the study:
  • team mobility, calculated as the average number of different working experiences of the members of the team before the current one, i.e., the number of working turnovers;
  • team openness, calculated as the percentage of team members who are not employees of the company;
  • team working experience, defined as the average number of years of working experience of team members;
  • team scientific experience, i.e., the average percentage of working experiences of team members in scientific entities, research centers and academia out of the total working experiences;
  • team Scopus experience, calculated as the percentage of team members who have scientific publications on Scopus;
  • team patenting experience, defined as the average number of patents developed by the team members before the year of analysis.
Within team experience, the literature review also reports the level of education of team members. Given that this study relies on data collected from the curricula vitae of inventors and not on macroeconomic statistics, this information was not easy to standardize and therefore was not included. The same goes for team maturity and diversity, which typically require a qualitative approach in order to be analyzed. On the other hand, a further feature, which does not appear in the literature, is introduced: team size, defined as the number of members in the team. Indeed, a larger team can more easily reach a critical mass in terms of knowledge and skills that can be profitably used in the innovation process.

3.2.3. Innovation Performances

From the literature review, a wide variety of innovation performance indicators emerge, each capturing only a specific aspect of the very complex theme of innovation. Therefore, in order to have a comprehensive view of the phenomenon, more indicators should be used. In particular, both patent and non-patent indicators should be used to capture both technological and non-technological issues. Indeed, three sets of indicators are included in the study for defining the innovation process performance, the patent quality and the overall financial performance of the company.
Indicators of innovation process performance take into account the costs sustained and the benefits achieved. Among all the indicators suggested in the literature, data available from PATSTAT and The EU Industrial R&D Investment Scoreboard allowed us to measure:
  • R&D intensity, defined as the ratio between R&D investment and net sales, and denoting the effort put into the innovation process compared to the total business of the company;
  • R&D per patent, defined as R&D investment in the year of analysis divided by the number of patents developed in the same year, and representing the average cost of a patent;
  • patent portfolio, calculated as the number of patents developed by the company in the 20 years preceding the year of analysis that are still active in that year, representing the overall innovation capability of the company;
  • patents per employee, calculated as the number of patents developed in the year of analysis divided by the number of employees in the same year.
Consistently with the literature, the following patent quality indicators are defined:
  • originality, a dummy variable assuming a value of 1 if no patent backward citations are reported in the application, 0 otherwise;
  • architectural capability, a dummy variable assuming a value of 1 if the combination of cooperative patent classification (CPC) codes reported in the application is new-to-the-world, 0 otherwise;
  • scope, defined as the number of claims reported in the application;
  • scientific value, calculated as the number of NPL backward citations reported in the application;
  • technological value, defined as the number of external forward citations received 5 years after publication;
  • market value, defined as the number of family patents, i.e., the number of patents applied within 5 years from application defining the focal patent as a priority;
  • internal value, a dummy variable assuming a value of 1 if renewal fees are paid 8 years after publications, 0 otherwise.
Notably, only granted patents were included in the sample and therefore this feature was not discriminated.
Finally, three financial performance indicators are considered—sales per employee, profit on sales and market capitalization—taken from The EU Industrial R&D Investment Scoreboard. From a sustainability perspective, sales per employee represents how well the resources are employed to produce results, whereas market capitalization provides a measure of sustainable competitive advantage in the future. Even if these indicators are very general and do not depend exclusively on the innovative capacity of a company, they are included in the study to evaluate whether implemented innovations are actually able of producing economic results.

3.2.4. Context Features

A number of features are included to contextualize the results. Three variables are defined at the firm level:
  • segment, defined according to the industry classification benchmark (ICB) reported in The EU Industrial R&D Investment Scoreboard: three dummies are defined for companies belonging to computer hardware and electronic office equipment (ICB 9572 and 9574), semiconductors (ICB 9576) and telecommunication equipment (ICB 9578);
  • age, calculated as the number of years from the establishment of the company to the year of analysis;
  • size, defined as the number of employees, according to The EU Industrial R&D Investment Scoreboard.

3.3. Statistical Methods

All the analyses are performed at the patent-level, i.e., 13,355 units of analysis are considered. After describing the sample, two different analyses are performed. First, in order to evaluate the differences between sustainable and not sustainable companies in terms of R&D team features, innovation performances and context features, one-way ANOVA is performed using sustainability as the discriminating factor. Second, relationships between R&D team features and patent quality for sustainable companies are evaluated through correlation, limiting the analysis to the 1,743 patents applied by sustainable pioneers.

4. Results

In Table 1, the sample description is provided in terms of the number of companies and patents for each industry segment: a prevalence of semiconductor companies and patents is observed, but the most productive segment in terms of average number of patents per company is computer hardware and electronic office equipment.
In Table 2, the distribution of companies and patents according to the sustainability indicators is provided. Among the three environmental sustainability indicators considered, the most widespread is the compliance to ISO 14000, characterizing more than 70% of the sample. Even if only a very limited number of companies had all three indicators in 2005, the percentage of patents developed by such companies, i.e., the patents that can be defined as “sustainable”, are more than 10% of the total sample, providing statistical significance to further analyses. The four companies meeting all three requirements in 2005 are Cisco Systems, Dell, Nokia and Xerox.

4.1. Sustainability and R&D Team Features

In Table 3 and Table 4, one-way ANOVA results are shown with regard to R&D team features, using sustainability as a discriminating factor: all the results are significant at least at the 0.05 level, meaning that significant differences are found between the R&D teams of sustainability pioneers and those of other companies.
On average, the teams of inventors developing patents for sustainability pioneers are larger (1.68 vs. 1.45 members in the team) and less open (12% vs. 43% of the members are not employees of the focal company). Furthermore, they have less years of working experience (12 vs. 16 years) but a higher number of different working experiences before the current one (1.36 vs. 0.81). A lower number of inventors’ working experiences is related to scientific entities (4% vs. 14%), less members in the team have published in Scopus journals (26% vs. 52%) and a lower number of patents was developed by team members in previous years (9.75 vs. 16.91).

4.2. Sustainability and Innovation Performances

Table 5 shows the results of ANOVA regarding innovation process performances: all analyses are significant at the 0.001 level. Sustainability pioneers have smaller portfolios (about 2100 vs. 5400 patents), higher values of R&D investment per patent (25.47 vs. 10.90 k€), less patents per employee (0.005 vs. 0.019) and lower R&D intensity (11% vs. 13%) when compared to not sustainable companies.
In Table 6 and Table 7, quality indicators are discriminated on the basis of sustainability: all results are significant at least at the 0.05 level.
While the originality of patents filed by sustainability pioneers is lower (11% vs. 12%), the other three ex ante indicators show higher values: a higher percentage of patents contain a new-to-the-world combination of CPC codes (47% vs. 43%); further, more claims (24.14 vs. 19.73) and more NPL citations (4.79 vs. 2.95) are reported in the application. As to post hoc indicators, higher technical and internal value but lower market value are uncovered for patents applied by sustainability pioneers: on one hand, a higher number of forward citations is received (11.42 vs. 10.56) and all the patents are renewed at the eighth year; on the other hand, a lower number of family patents is generated (1.34 vs. 2.79).
In Table 8, results of ANOVA are shown with regard to financial performances: all results are significant at the 0.001 level. Higher performances are obtained for sustainability pioneers in all three indicators: 587 vs. 401 k€ of sales per employee, 25% vs. 16% profit on sales and almost 80,000 vs. 46,500 M€ of market capitalization.

4.3. Sustainability and Context Features

In Table 9 and Table 10, the context features are discriminated on the basis of sustainability: all analyses are significant at least at the 0.005 level. About half of the patents in the total sample are developed by semiconductor companies, but none of them is accounted within the sustainable cluster. On the contrary, while only one quarter of the total sample is constituted by patents developed by telecommunication equipment companies, three quarters of them are developed by sustainability pioneers. The computer hardware and electronic office equipment segment has an intermediate behavior, with a slightly higher percentage of patents developed by sustainability pioneers vs. other firms (23% vs. 19%). Moreover, sustainability pioneers are younger (19.74 vs. 42.93 years in 2005) and smaller (about 44,500 vs. 64,500 employees).

4.4. R&D Team Features and Innovation Performances for Sustainability Pioneers

In Table 11, results are provided regarding correlations between team features and patent quality indicators, limiting the analysis to only the 1743 patents developed by sustainability pioneers. Given that renewal fees were paid for all such patents at the eighth year from application, the internal value is identically equal to 1 and therefore correlations cannot be calculated.
Within sustainability pioneers, the size of the R&D team positively affects all the indicators except for originality: larger teams cite more prior art which turns into lower originality, but the critical mass reached by more inventors allows the development of more product architectures, the production of wider intellectual property protection, the exploitation of more relevant scientific knowledge and the achievement of higher technological and market value. The sustainable approach is clear: by recalling already patented technologies, new, high-quality technologies are developed.
When in the development team, some inventors are not employees of the applicant company but come from different organizations; thus, a broader scope is obtained for the patent: more claims are declared, granting wider protection. This is probably due to the broader points of view of inventors who overcome the boundaries of the firm. Sustainable companies seem to effectively employ external knowledge sources to strengthen the exclusivity of their competitive advantage.
While the number of different working experiences of inventors has no influence on the quality of the patented technology, the total years of experience, no matter in how many different organizations, positively affects both technological and market value: experienced inventors are capable of developing technologies that are acknowledged as more relevant and that are able to produce more subsequent releases of products. For sustainable companies, the accumulation of knowledge deriving from previous experience turns into high-quality results.
While the formalized experience of inventors in academia and other research institutes has no effect on patent quality, inventors publishing in Scopus journals produce higher quality patents in terms of almost all the indicators. Even if such inventors have never worked in academic entities, they probably collaborate with researchers and are able to effectively transform their scientific knowledge into high-value technical applications.
Lastly, when inventors in the R&D teams of sustainable companies have already patented in the past, they are capable of producing technologies with new architectures, broader scope and higher scientific value. Here again, the sustainable proclivity is featured in terms of using and re-using the previous knowledge in new, original ways.

5. Discussion

In Table 12, a synthesis of the ANOVA results is provided: for each variable, a plus means that the average value of the specific feature is greater for sustainability pioneers than for the other companies, whereas a minus means that the average value of the variable for sustainability pioneers is smaller when compared to not sustainable companies.
The R&D teams of sustainability pioneers are larger and feature higher mobility, whereas experience and openness are lower. Less years of working experience also denotes younger inventors. Consistently with the literature, high mobility ensures heterogeneity of knowledge, even if experience is low [19,20]. This means that sustainable companies prefer to resort to teams of young and dynamic inventors who make up for their lack of meaningful experience with their ability to adapt to different working contexts. A separate discussion should be made concerning openness: introducing inventors from outside the company in the R&D team can be considered an easy way of quickly incorporating external knowledge. Yet, in the long term, such a strategy could result in a loss of competencies that might threaten corporate survival. Therefore, sustainable firms adopt a more closed model, preferring to keep most of the knowledge within the company.
Regarding patent quality indicators, lower originality and higher scientific value of patents developed by sustainability pioneers suggest that their R&D teams are more inclined to draw on prior art when developing new technologies: they cite both more patents (lower originality) and more NPL (higher scientific value). Indeed, starting from prior art is a low resource consumption way to achieve faster results thanks to technological learning [56]. Furthermore, broader scope and original architectures are obtained, resulting in an overall higher technological value. This result is consistent with the literature [4,19] signaling the positive impact of inventors’ mobility on the quality of innovation output. The heterogeneity of competencies accumulated by inventors in their previous working experiences leads to better performances. Higher levels of internal value reflect the attitude of sustainable firms of exploiting all their results following a “zero-waste” logic.
Sustainability pioneers seem to be performing less with regard to the innovation process: indeed, they develop less patents (both as a whole and per employee) and have a higher average cost per patent. Yet, a lower R&D intensity ratio denotes a lower effort in the R&D process, which could affect such a result. Moreover, higher values of financial indicators are obtained for sustainability pioneers: higher profitability, higher productivity and more sustainable competitive advantage characterize these firms. This denotes the ability of these firms to achieve global corporate results, even when single processes are not optimized: it is the overall management of the company, rather than those of specific areas, that can produce sustainable advantage.
The industries in which sustainability pioneers operate are those directly related to final customers, whereas firms in the semiconductor segment operate mainly in business to business (B2B). This result can be explained by the reputation and image that can derive from sustainable policies in the eyes of the general public. Finally, lower firm age and size denotes the higher propensity of younger and smaller companies to adapt to a phenomenon that in 2005 was still emerging.
Regarding the correlation analysis, the two features that have a significant impact on almost all patent quality indicators are team size and the presence of inventors who have published on Scopus. The first result has no feedback in the literature, since, to our knowledge, the size of the team is not investigated. Studies exist on the size of the whole company, arguing that big companies have more resources to invest in R&D, have more structured and numerous teams and therefore are catalysts for innovation [59]. We can assume that the presence of more members in a team certainly brings more diverse and variegated knowledge and can therefore produce better results. As for the publications on Scopus, this is consistent with literature findings that identify star scientists as engines for innovation [18].
Other features of the R&D team are able to influence only specific quality indicators: the presence of external inventors broadens the scope of the patent, longer working experience of inventors affects technological and market value, whereas inventors who have already patented in the past develop new product architectures, with broader scope and higher scientific value. The findings are consistent with literature contributions suggesting that openness [31] and experience [5] positively affect the innovative capabilities of teams.

5.1. Implications

The paper has both theoretical and practical implications.
From a theoretical point of view, our study is set between sustainability and innovation management literature. Starting from the assumption that the heart of a firm’s innovation is the R&D department, and that all companies have to focus on sustainability, we decided to explore the intersection between the two areas, although the literature in this sense is not extensive. Our contribution to the literature, therefore, is to shed light on the linkages among the composition of R&D teams and their outputs, in terms of patent quality, from a sustainability perspective.
The findings prove that there is a linkage between sensitivity to sustainability issues and innovation performances, i.e., sustainability is actually related to achieved outputs: for companies, being sustainable is not only a conscious choice, but also an effective one which provides better innovative results and, ultimately, provides competitive advantage in the long term.
Moreover, the paper contributes to the analysis of human resource management for the R&D department from a sustainable perspective: a linkage between sustainable consciousness and the choice of specific R&D team characteristics exists. Indeed, the literature on the theme is not very extensive, and we have found some relevant elements to contribute to it, also calling for further analysis in the area of sustainable management of human resources. Currently, sustainability issues are mainly considered within manufacturing processes, but we suggest enlarging them also to knowledge management, deepening the theme of how knowledge produced in the past can be used and re-used to obtain valuable results.
Finally, unlike the other contributions found in the literature, this work suggests the use of non-mandatory measures for sustainability, which helps in understanding the phenomenon from the point of view of the companies that have voluntarily and independently chosen this path.
From a managerial perspective, the paper contributes to the definition of the optimal inventor profile capable of producing high-quality patents; therefore, significant practical implications result for recruitment teams. Choosing one personal profile instead of another could be a significant and performing choice. The level of education, the background and the experience are parameters to be taken into consideration if one wishes to pursue higher innovative performances.
The study suggests, one one hand, what are the levers of human resource management within the R&D department that sustainable businesses adopt (large teams and inventors who have published on Scopus) and, on the other hand, what are the benefits that can be achieved by adopting sustainability within its own innovation strategy (architectural capacity, broad patent protection, scientific and technological value of new technologies, but also productivity, profitability and shareholder value).
In general, the work shows how important it is to take into account the characteristics of the R&D team in order to obtain certain results in terms of innovation and therefore suggests the appropriate choices of inventors’ profiles within the team in order to give companies greater assurance of the results deriving from the R&D effort.

5.2. Limitations and Future Research

Some limitations can be identified for the study, which will direct future research.
First, the work does not analyze features such as team diversity and team maturity, which are suggested in the literature as affecting the innovative capability of teams. Ways of operationalizing these measures through the use of extensive patent data are under study: the diversity might be analyzed through content analysis of the working experiences and background of inventors, whereas in order to define maturity, the composition of inventors’ teams for the patents applied before the years of analysis should be investigated.
Second, the sample obtained is only partially representing innovative companies in the IT hardware industry, since complete and exhaustive data were only found for 55 firms out of 99 (56%). Indeed, the major problems were related to the data collecting process for the curricula vitae of the inventors, which was time consuming and not always easy. Most problems incurred for Asian inventors, where many cases of homonymy were detected. For this reason, Asian companies are under-represented in the sample. The development of an artificial intelligence tool for limiting the problems deriving from homonymy is under study.
The third limitation of the research is the constraint of the year of analysis to 2005, due to the need for evaluating post hoc patent quality indicators. A new version of PATSTAT is now being acquired and therefore, in the future, a widening of the analysis could be possible. Yet, such a limitation allowed us to analyze the behaviors of companies that can be defined as pioneering as to their sustainability attitude. Nowadays, the need to undertake sustainable development paths seems obvious and mandatory. At the time of the data employed in the work, these choices were at the forefront, which induced us to focus on companies that have voluntarily chosen green paths in the search of new technological opportunities [2]. Therefore, the current analysis can provide useful insights as to what happened when sustainability was an emerging trend. If the same definition of “sustainability” were used today, a far larger percentage of sustainable firms in the same sample would be expected. A longitudinal analysis from 2005 to more recent years could determine the evolution of behaviors of sustainability pioneers versus other companies.
Indeed, when framing the work, different hypotheses were made as to the definition of sustainability: the one provided is the strictest, defining as sustainable only companies meeting all three requirements, but considering the firms meeting at least one or at least two of the indicators was also considered. However, this choice would have led to a number of “sustainable patents” equal to 12,953 (97% of total patents) and 8117 (61%), respectively: such percentages were considered too high for the period of analysis. As a future development, by extending the years of analysis and therefore widening the sample of sustainable companies, it will also be possible to define a “fuzzier” variable, which can assume values between 0 and 1 depending on the number of requirements met.
A final consideration must be made as to the four companies that were defined as “sustainability pioneers”: Dell, Nokia, Cisco Systems and Xerox. These companies are among the world leaders as of 2005, ranked in the top ten in the industry for total sales. Some of the findings of the study might be affected by such a condition, even if the other six leaders (Hewlett-Packard, Intel, Motorola, Ericsson, Apple and Texas Instrument) were included in the sample as not sustainable. A future development could be the comparative analysis of these top ten players.

6. Conclusions

The paper characterizes the R&D teams of sustainable companies and analyzes their performances in terms of patent quality. The study is based on 13,355 patents filed by leading companies in the IT hardware industry. Sustainability is measured in terms of its environmental dimension, through the use of three indicators: the drawing up of a sustainability report, the compliance to ISO 14001, and the registration in the GRI database. Indeed, such elements are evaluated in 2005, when sustainability was still an emerging phenomenon. Therefore, the companies meeting all three requirements can be considered as pioneering.
The size, mobility, experience and openness of R&D teams are analyzed. Patent quality is defined using ex ante and post hoc indicators. Results show that the R&D teams of sustainability pioneers feature a higher degree of mobility but less experience than those of other companies; moreover, a less receptive attitude toward open innovation is observed. Even if, on average, sustainability pioneers develop less patents, the quality is higher with regard to most attributes: scope, architectural capability, scientific and technological value; moreover, superior financial performances are achieved. Among sustainability pioneers, the features that have a more significant impact on patent quality are the size of the R&D team and the presence of inventors who have published on Scopus.
The conceptualization of the linkage between sustainability and R&D team features contributes to literature in innovation management, defining a new perspective for the management of knowledge resources in the innovation process. From a managerial perspective, the work provides insights as to how to compose an R&D team in order to obtain high value patents.

Author Contributions

Conceptualization, methodology, formal analysis, F.B. and M.V.; writing—original draft preparation, visualization, M.V.; writing—review and editing, supervision, F.B.

Funding

This research received no external funding.

Conflicts of Interest

The authors declare no conflict of interest.

Appendix A. List of Companies

AdtranHarmonic
Advanced Micro DevicesHarris
AlteraHewlett-Packard
Analog DevicesInfineon Technologies
AppleIntegrated Device Technology
Applied MaterialsIntel
ARMInternational Rectifier
ArrisIntersil
ASM InternationalInventec
ASML HoldingJuniper Networks
AtmelLam Research
AvayaLSI Corp
BroadcomMacronix International
Brocade Communications SystemsMarvell Technology
CienaMotorola
Cisco SystemsNokia
CorningNVIDIA
CreeOmniVision Technologies
Cypress SemiconductorON Semiconductor
DellPitney Bowes
Dialog SemiconductorQualcomm
Electronics for imagingResearch in motion
ELMOS SemiconductorSanDisk
EmulexSoitec
EricssonTexas Instruments
Fairchild SemiconductorWestern Digital
FEIXerox
Finisar

References

  1. Nidumolu, R.; Prahalad, C.K.; Rangaswami, M.R. Why sustainability is now the key driver of innovation. Harv. Bus. Rev. 2009, 43, 85–91. [Google Scholar]
  2. Laurens, P.; Le Bas, C.; Lhuillery, S.; Schoen, A. The determinants of cleaner energy innovations of the world’s largest firms: The impact of firm learning and knowledge capital. Econ. Innov. New Technol. 2017, 26, 311–333. [Google Scholar] [CrossRef]
  3. United Nations Sustainable Development Goals. Available online: https://www.un.org/sustainabledevelopment/sustainable-development-goals/ (accessed on 8 April 2019).
  4. Trajtenberg, M. Recombinant Ideas: The Mobility of Inventors and the Productivity of Research. In Proceedings of the CEPR Conference, Munich, DE, USA, 26–28 May 2005. [Google Scholar]
  5. Mariani, M.; Romanelli, M. “Stacking” and “picking” inventions: The patenting behavior of European inventors. Res. Policy 2007, 36, 1128–1142. [Google Scholar] [CrossRef]
  6. Griliches, Z. Patent Statistics as Economic Indicators: A Survey. Pat. Stat. Econ. Indic. A Surv. 1990, 28, 1661–1707. [Google Scholar]
  7. Patel, P.; Pavitt, K. Patterns of Technological Activity: Their Measurement and Interpretation. In Handbook of the Economics of Innovation and Technological Change; Stoman, P., Ed.; Blackwell: Oxford, UK, 1995; pp. 14–51. [Google Scholar]
  8. Michelino, F.; Cammarano, A.; Lamberti, E.; Caputo, M. Knowledge domains, technological strategies and open innovation. J. Technol. Manag. Innov. 2015, 10, 50–78. [Google Scholar] [CrossRef]
  9. Bercovitz, J.; Feldman, M. The mechanisms of collaboration in inventive teams: Composition, social networks, and geography. Res. Policy 2011, 40, 81–93. [Google Scholar] [CrossRef]
  10. Von Proof, S.; Dettmann, A. Inventor collaboration over distance: A comparison of academic and corporate patents. Scientometrics 2013, 94, 1217–1238. [Google Scholar] [CrossRef]
  11. Narin, F.; Breitzman, A. Inventive productivity. Res. Policy 1995, 24, 507–519. [Google Scholar] [CrossRef]
  12. Ernst, H.; Leptien, C.; Vitt, J. Inventors are not alike: The distribution of patenting output among industrial R&D personnel. IEEE Trans. Eng. Manag. 2000, 47, 184–199. [Google Scholar]
  13. Meyer, M. Are patenting scientists the better scholars? An exploratory comparison of inventor-authors with their non-inventing peers in nano-science and technology. Res. Policy 2006, 35, 1646–1662. [Google Scholar] [CrossRef]
  14. Zucker, L.G.; Darby, M.R.; Torero, M. Labor Mobility from Academe to Commerce. J. Labor Econ. 2002, 20, 629–660. [Google Scholar] [CrossRef] [Green Version]
  15. Harhoff, D.; Narin, F.; Scherer, F.M.; Vopel, K. Citation frequency and the value of patented innovation. Rev. Econom. Statist. 1999, 81, 511–515. [Google Scholar] [CrossRef]
  16. Palomeras, N.; Melero, E. Markets for Inventors: Learning-by-Hiring as a Driver of Mobility. Manag. Sci. 2010, 56, 881–895. [Google Scholar] [CrossRef] [Green Version]
  17. Hoetker, G.; Agarwal, R. Death hurts, but it isn’t fatal: The post-exit diffusion of knowledge created by innovative companies. Acad. Manag. J. 2007, 50, 446–467. [Google Scholar] [CrossRef]
  18. Zucker, L.G.; Darby, M.R. Star Scientists and institutional transformation: Patterns of invention and innovation in the formation of the biotechnology industry. Proc. Natl. Acad. Sci. USA 1996, 93, 12709–12716. [Google Scholar] [CrossRef]
  19. Hoisl, K. Tracing mobile inventors—The causality between inventor mobility and inventor productivity. Res. Policy 2007, 36, 619–636. [Google Scholar] [CrossRef]
  20. Lewis, T.R.; Yao, D. Innovation, Knowledge Flow, and Worker Mobility. 2006. Available online: http://www.people.hbs.edu/dyao/lewisyaomobility.pdf (accessed on 20 August 2019).
  21. Fallick, B.C.A.; Fleischmann, J.B.; Rebitzer, A. Job hopping in Silicon Valley: Some evidence concerning the micro-foundations of a high technology cluster. Rev. Econom. Statist. 2006, 88, 472–481. [Google Scholar] [CrossRef]
  22. Klepper, S. Employee start-ups in high tech industries. Ind. Corp. Chang. 2001, 10, 639–674. [Google Scholar] [CrossRef]
  23. Giuri, P.; Mariani, M.; Brusoni, S.; Crespi, G.; Francoz, D.; Gambardella, A.; Garcia-Fontes, W.; Geuna, A.; Gonzales, R.; Harhoff, D.; et al. Inventors and invention processes in Europe: Results from the PatVal-EU survey. Res. Policy 2007, 36, 1107–1127. [Google Scholar] [CrossRef]
  24. Cammarano, A.; Caputo, M.; Lamberti, E.; Michelino, F. Open innovation and intellectual property: A patent-based approach. Manag. Decis. 2017, 55, 1–27. [Google Scholar] [CrossRef]
  25. Michelino, F.; Cammarano, A.; Lamberti, E.; Caputo, M. Open innovation for start-ups. A patent-based analysis of bio-pharamceutical firms at the knowledge domain level. Eur. J. Innov. Manag. 2017, 20, 112–134. [Google Scholar] [CrossRef]
  26. Jaffe, A.B. Technological opportunity and spillovers of R&D: Evidence from firms’ patents, profits and market value. Am. Econ. Rev. 1986, 76, 984–1001. [Google Scholar]
  27. Powell, W.; Grodal, S. Networks of Innovators. In The Oxford Handbook of Innovation; Fagerberg, J., Mowery, D.C., Nelson, R.R., Eds.; Oxford University Press: Oxford, UK, 2005; pp. 56–85. [Google Scholar]
  28. Cohen, W.M.; Nelson, R.R.; Walsh, J.P. Links and Impacts: The Influence of Public Research on Industrial R&D. Manag. Sci. 2002, 48, 1–23. [Google Scholar] [Green Version]
  29. Trajtenberg, M.; Henderson, R.; Jaffe, A.B. University Versus Corporate Patents: A Window On The Basicness Of Invention. Econ. Innov. New Technol. 1997, 5, 19–50. [Google Scholar] [CrossRef]
  30. Jensen, M.B.; Johnson, B.; Lorenz, E.; Lundvall, B. Åke Forms of knowledge and modes of innovation. Res. Policy 2007, 36, 680–693. [Google Scholar] [CrossRef]
  31. Rosenkopf, L.P.; Almeida, B. Overcoming local search through alliances and mobility. Manag. Sci. 2003, 49, 751–766. [Google Scholar] [CrossRef]
  32. Cox, T.H.; Blake, S. Managing cultural diversity: Implications for organizational competitiveness. Acad. Manag. Perspect. 1991, 5, 45–56. [Google Scholar] [CrossRef]
  33. Easely, C.A. Developing, valuing, and managing diversity in the new millennium. Organ. Dev. J. 2001, 19, 38–50. [Google Scholar]
  34. Jehn, K.A.; Northcraft, G.B.; Neale, M.A. Why Differences Make a Difference: A Field Study of Diversity, Conflict, and Performance in Workgroups. Adm. Sci. Q. 1999, 44, 741–763. [Google Scholar] [CrossRef]
  35. Williams, K.Y.; O’Reilly, C.A. Demography and Diversity in Organizations. In Research in Organizational Behavior; Staw, B.M., Sutton, R.M., Eds.; JAI Press Inc.: Stamford, CT, USA, 1998. [Google Scholar]
  36. Katzenbach, J.R.; Smith, D.K. The Wisdom of Teams: Creating the High Performance Organization; Harper Business: New York, NY, USA, 1993. [Google Scholar]
  37. Elrod, D.P.; Tipped, D.D. An empirical study of the relationship between team performance and team maturity. Eng. Manag. J. 1999, 11, 7–14. [Google Scholar] [CrossRef]
  38. European Commission. European Commission Third European Report on Science & Technology Indicators; Towards a Knowledge-Based Economy; European Commission: Brussels, Belgium, 2003. [Google Scholar]
  39. Belderbos, R.; Faems, D.; Leten, B.; Van Looy, B. Technological Activities and Their Impact on the Financial Performance of the Firm: Exploitation and Exploration within and between Firms. J. Prod. Innov. Manag. 2010, 27, 869–882. [Google Scholar] [CrossRef]
  40. Burhan, M.; Singh, A.K.; Jain, S.K. Patents as proxy for measuring innovations: A case of changing patent filing behavior in Indian public funded research organizations. Technol. Forecast. Soc. Chang. 2017, 123, 181–190. [Google Scholar] [CrossRef]
  41. Caputo, M.; Lamberti, E.; Cammarano, A.; Michelino, F. Investigating technological strategy and relevance of knowledge domains in R&D collaborations. Int. J. Technol. Manag. 2019, 79, 60–83. [Google Scholar]
  42. Grupp, H. Dynamics of Science-Based Innovation; Springer: Berlin, Germany, 1992. [Google Scholar]
  43. Johnstone, N.; Hascic, I.; Poirier, J.; Hemar, M.; Michel, C. Environmental policy stringency and technological innovation: Evidence from survey data and patent counts. Appl. Econ. 2012, 44, 2157–2170. [Google Scholar] [CrossRef]
  44. Squicciarini, M.; Dernis, H.; Criscuolo, C. Measuring Patent Quality: Indicators of Technological and Economic Value; OECD Publishing: Paris, France, 2013. [Google Scholar]
  45. Cammarano, A.; Michelino, F.; Caputo, M. Open innovation practices for knowledge acquisition and their effects on innovation output. Technol. Anal. Strat. Manag. 2019, 31, 1–17. [Google Scholar] [CrossRef]
  46. Callaert, J.; Van Looy, B.; Verbeek, A.; DeBackere, K.; Thijs, B. Traces of Prior Art: An analysis of non-patent references found in patent documents. Science 2006, 69, 3–20. [Google Scholar]
  47. Lerner, J. The Importance of Patent Scope: An Empirical Analysis. RAND J. Econ. 1994, 25, 319–333. [Google Scholar] [CrossRef]
  48. Guan, J.C.; Yan, Y. Technological proximity and recombinative innovation in the alternative energy field. Res. Policy 2016, 45, 1460–1473. [Google Scholar] [CrossRef]
  49. Verhoeven, D.; Bakker, J.; Veugelers, R. Measuring technological novelty with patent-based indicators. Res. Policy 2016, 45, 707–723. [Google Scholar] [CrossRef] [Green Version]
  50. Hall, B.; Jaffe, A.B.; Trajtenberg, M. Market Value and Patent Citations: A First Look; National Bureau of Economic Research: Cambridge, MA, USA, 2000. [Google Scholar]
  51. Cammarano, A.; Michelino, F.; Lamberti, E.; Caputo, M. Accumulated stock of knowledge and current research practices: The impact on patent quality. Technol. Forecast. Soc. Chang. 2017, 120, 204–222. [Google Scholar] [CrossRef]
  52. Ahuja, G.; Lampert, C.M. Entrepreneurship in the large corporation: A longitudinal study of how established firms create breakthrough inventions. Strat. Manag. J. 2001, 22, 521–543. [Google Scholar] [CrossRef]
  53. Harhoff, D.; Scherer, F.M.; Vopel, K. Citations, family size, opposition and the value of patent rights. Res. Policy 2003, 32, 1343–1363. [Google Scholar] [CrossRef]
  54. Svensson, R. Commercialization, renewal, and quality of patents. Econ. Innov. New Technol. 2012, 21, 175–201. [Google Scholar] [CrossRef] [Green Version]
  55. The Boston Consulting Group. Measuring Innovation 2009: The Need for Action; The Boston Consulting Group: Boston, MA, USA, 2009. [Google Scholar]
  56. Cecere, G.; Rexhauser, S.; Schulte, P. From less promising to green? Technological opportunities and their role in (green) ICT innovation. Econ. Innov. New Technol. 2019, 28, 45–63. [Google Scholar] [CrossRef]
  57. Pavitt, K. Sectorial patterns of technical change: Towards a taxonomy and a theory. Res. Policy 1984, 13, 343–373. [Google Scholar] [CrossRef]
  58. Cammarano, A.; Caputo, M.; Lamberti, E.; Michelino, F. R&D Collaboration Strategies for Innovation: An Empirical Study Through Social Network Analysis. Int. J. Innov. Technol. Manag. 2017, 14, 1740001. [Google Scholar]
  59. Tödtling, F.; Lehner, P.; Kaufmann, A. Do different types of innovation rely on specific kinds of knowledge interactions? Technovation 2009, 29, 59–71. [Google Scholar] [CrossRef] [Green Version]
Figure 1. Theoretical framework.
Sustainability 11 04524 g001
Table 1. Sample description.
SegmentNo. of CompaniesNo. of PatentsAvg. No. of Patents Per Company
Computer hardware and electronic office equipment92650294
Semiconductors307217241
Telecommunication equipment163488218
Total sample5513,355243
Table 2. Sustainability indicators.
IndicatorNo. of Companies% of Companies out of 55No. of Patents% of Patents out of 13,355
Sustainability report1323%512438%
ISO 140004071%10,04075%
Global Reporting Initiative (GRI)1120%764957%
Sustainability pioneers47%174313%
Table 3. One-way ANOVA: team size, openness and mobility.
One-Way ANOVATeam SizeTeam OpennessTeam Mobility
Other companies (N = 11,612)mean1.4543%0.81
std. dev.0.7547%1.02
Sustainability pioneers (N = 1743)mean1.6812%1.36
std. dev.0.9429%1.07
Var. within/between0.0080.0010.002
F127686435
Significance0.0000.0000.000
Table 4. One-way ANOVA: team experience.
One-Way ANOVATeam Working ExperienceTeam Scientific ExperienceTeam Scopus ExperienceTeam Patenting Experience
Other companies (N = 11,612)mean16.4414%52%16.91
std. dev.76.0431%47%32.65
Sustainability pioneers (N = 1743)mean12.174%26%9.75
std. dev.11.5316%39%21.78
Var. within/between0.1830.0080.0020.013
F512847579
Significance0.0190.0000.0000.000
Table 5. One-way ANOVA: innovation process performances.
One-Way ANOVAR&D IntensityR&D Per Patent (k€)Patent PortfolioPatents Per Employee
Other companies (N = 11,612)mean13%10.9054120.019
std. dev.6%39.0044040.049
Sustainability pioneers (N = 1743)mean11%25.4721440.005
std. dev.5%196.0810530.003
Var. within/between0.0040.0200.0010.007
F24151951135
Significance0.0000.0000.0000.000
Table 6. One-way ANOVA: patent quality (ex ante indicators).
One-Way ANOVAOriginalityArchitectural CapabilityScopeScientific Value
Other companies (N = 11,612)mean12%43%19.732.95
std. dev.33%50%13.858.25
Sustainability pioneers (N = 1743)mean11%47%24.144.79
std. dev.31%50%15.939.67
Var. within/between0.2120.0890.0070.014
F51114871
Significance0.0270.0010.0000.000
Table 7. One-way ANOVA: patent quality (post hoc indicators).
One-Way ANOVATechnological ValueMarket ValueInternal Value
Other companies (N = 11,612)mean10.562.7999%
std. dev.16.388.8810%
Sustainability pioneers (N = 1743)mean11.421.34100%
std. dev.13.233.140%
Var. within/between0.2240.0220.067
F44617
Significance0.0350.0000.000
Table 8. One-way ANOVA: financial performances.
One-Way ANOVASales Per Employee (k€)Profit on SalesMarket Capitalization (M€)
Other companies (N = 11,612)mean40116%46,547
std. dev.16015%35,829
Sustainability pioneers (N = 1743)mean58725%79,823
std. dev.769%20,366
Var. within/between0.0000.0020.001
F22775891434
Significance0.0000.0000.000
Table 9. One-way ANOVA: segment.
One-Way ANOVAComputer Hardware and Office EquipmentSemiconductorsTelecommunication Equipment
Other companies (N = 11,612)mean19%62%18%
std. dev.40%49%39%
Sustainability pioneers (N = 1743)mean23%0%78%
std. dev.42%0%42%
Var. within/between0.1140.0000.000
F928623453
Significance0.0030.0000.000
Table 10. One-way ANOVA: age and size.
One-Way ANOVAAgeSize
Other companies (N = 11,612)mean42.9364,561
std. dev.33.0455,147
Sustainability pioneers (N = 1743)mean19.7444,537
std. dev.10.1011,196
Var. within/between0.0010.004
F847228
Significance0.0000.000
Table 11. Correlation (N = 1743; * sig. 0.05; ** sig. 0.01).
Team SizeTeam OpennessTeam MobilityTeam Working ExperienceTeam Scientific ExperienceTeam Scopus ExperienceTeam Pateting Experience
Originality−0.086 **−0.007−0.0070.017−0.002−0.0380.017
Architectural capability0.059 *−0.0320.0080.0300.0050.060 *0.073 **
Scope0.096 **0.067 **0.029−0.024−0.0180.069 **0.068 **
Scientific value0.136 **−0.0160.0040.014−0.0130.073 **0.054 *
Technological value0.048 *0.0060.0320.079 **0.020.066 **0.011
Market value0.146 **−0.0120.0070.069 **0.0120.070 **0.042
Internal value-------
Table 12. Characterization of R&D teams, innovation performances and context features of sustainability pioneers compared to the other companies.
R&D Team FeaturesInnovation Performances
Team size +R&D intensity −
Team openness −R&D per patent +
Team mobility +Patent portfolio −
Team working experience −Patents per employee −
Team scientific experience −Originality −
Team Scopus experience −New architectures +
Team patenting experience −Scope +
Scientific value +
Context featuresTechnological value +
Computer hardware and electronic office equip. +Market value −
Semiconductors −Internal value +
Telecommunication equipment +Sales on employee +
Age −Profit on sales +
Size −Market capitalization +

