Article

The Hydrosocial Cycle in Coastal Tourist Destinations in Alicante, Spain: Increasing Resilience to Drought

1
Department of Regional Geographical Analysis and Physical Geography, University of Alicante, 03690 Alicante, Spain
2
Interuniversity Institute of Geography, University of Alicante, 03690 Alicante, Spain
*
Author to whom correspondence should be addressed.
Sustainability 2019, 11(16), 4494; https://doi.org/10.3390/su11164494
Submission received: 21 June 2019 / Revised: 15 August 2019 / Accepted: 15 August 2019 / Published: 19 August 2019
(This article belongs to the Section Sustainability in Geographic Science)

Abstract

:
Tourism, and particularly residential tourism, has led to a change in the urban and demographic model of towns along the European Mediterranean coastline. Water as a resource limited and limiting for the growth of tourism is a popular topic in the scientific literature. However, the incorporation of non-conventional resources (desalination) has meant, in theory, that this limitation has been overcome. The aims of this paper are: (a) to identify the different tourism models existing in coastal towns in Alicante province and characterize them according to their water consumption from 2002–2017; and (b) analyse the hydrosocial cycle, highlighting the measures aimed at satisfying water demand and identifying the limitations related to these hydrosocial systems. To this end, different types of information have been processed, and various basic indicators have been analysed. The results revealed the increase in the resilience of this region to natural aridity and drought events. This was possible because the demand management and the use of desalinated water. However, this has generated other problems associated (energetics, environmental) due to maintenance of a non-sustainable territorial model based on an accelerated real estate development.

1. Introduction

Since the end of the Second World War, tourism has become one of the activities that best identifies the changes that have taken place in societies. Tourism over the last 60 years has become a highly dynamic activity despite cyclical behaviour linked to the global and regional economy [1]: such as successive cycles of boom and bust [2,3]; geopolitical events [4]; and natural disasters [5]. This growth has traditionally been measured in economic terms and with a quantitative focus based on the number of trips, tourists, and currency transfers. In this respect, tourism has grown from 25 million international journeys in 1950 to 1.3 billion in 2017; and is expected to reach 1.8 billion journeys in 2030. At present, it represents 10% of world GDP and mobilises 7% of international trade [6].
This perspective of quantitative development has also been read geographically. The evolution of mass tourism is interpreted as the constant incorporation of regions and countries into the global tourism system. This interpretation is the foundation for evolutionary models such as Gormsen’s pleasure peripheries [7]. Moreover, this geographic expansion of tourism has traditionally been understood as a key to economic progress for less developed countries: tourism is seen as a ‘passport to development’ [8].
Among the natural resources necessary for the development of tourism, water has been strategic, since it is fundamental for the supply of drinking water and recreational facilities (golf, waterparks, and so on) [9]. The growth of tourism and infrastructures is directly associated with the increase in water consumption, which has led to the introduction of water engineering projects to increase water availability. The consumption of water by tourism has generated a notable published scientific literature, including analyses that point to the need to reduce such consumption, both from the point of view of eco-efficiency (optimisation of supplies, price policies, incorporation of non-conventional resources, and the circular economy) and sufficiency (consumption patterns of tourists and awareness policies) [10]. These studies may be seen as part of a paradigm change in water policy. Policies designed to meet new demand by generating new resources have been replaced by policies managing demand with more sustainable actions [11]. These are policies based on the efficiency of supplies, uses and costs, which have already been raised since the end of the 20th century [12].
Tourist activity has led to a change in the urban and demographic model of towns along the European Mediterranean coastline. This scenario has, since the 1960s, led to increased water consumption for urban and tourism-related uses. The pressure on water resources has been accentuated by the fact that some of the major regions for ‘sun and sand’ tourism (for example, the Mediterranean basin) coincide with arid and semi-arid climates, now and much more in the future [13,14], as it also happens in the study area. In this spatial context, water has often been considered a scarce resource [15]. To meet growing demands, various initiatives have been aimed at increasing water resources and formulas for governance in the various processes of the water cycle. Both are reflected in the configuration of complex hydrosocial cycles [16]. Some authors also underline the role played by a high level of non-revenue water by water utilities in areas facing water scarcity, especially where these values exceed 50% of the System Input Volume [17,18]. The criticality and scarcity of resources for the tourism sector [19] are reflected in forecasts for climate change in the Mediterranean Basin. These point to a greater irregularity of rainfall, changes in its seasonal distribution, and more droughts [20,21,22,23]
This study focuses on the analysis of the effects of tourism and associated activities, especially linked to real estate development. Such activities since the 1960s have transformed the socioeconomic, demographic, and spatial structures of the province of Alicante regarding water resources. As rainfall ranges between 300 mm on the south coast and 450 mm in the north, droughts have given rise to serious water crises in the past [24].
The development of tourism in Alicante (south-east Spain) is confined to a narrow coastal strip that has occasionally overflowed into ‘second line’ spaces. That is, municipalities without coast but with quick access to the sea and with valuable landscape resources. In the studio area, San Fulgencio and Rojales are two clear examples. The coastal municipalities (20 out of 141) accommodate 59% of the population and concentrate a large proportion of the infrastructure, public and private services, and economic activity. The spatial distribution of tourist accommodation shows the pre-eminence of tourism in coastal towns, where 96% of hotels, 94% of regulated apartments, and 85% of campsites are concentrated [25]. Furthermore, there are more than 1.5 million beds in private homes, which constitute the principal accommodation supply, and comprise an assortment of types (apartments, bungalows, and detached houses) aimed at different tourism segments and holiday demand, as well as for use as second homes. Tourism activities have several models that make significant territorial impacts on land use and water resources [26]. In addition to the direct consumption of tourists and the water needs of recreational activities and equipment, water is also incorporated into the production cycle of different inputs needed in tourism production such as construction materials, fuels and food [27]. Besides the consumption by urban typology, in the scientific literature, various indicators are used to measure the pressure of tourism on the water resource. An approach to the problem is offered by the concept of the water footprint. Thus, in the case of one of the studied destinations (Benidorm, Spain), Cazcarro, Duarte and Sánchez established that WF at 58 hm3 compared to 53 of the residents [28].
The description of these models, in the sense of elementary theoretical patterns of occupation of space whose territorial expression is shown in a complex and mixed way, is based on the occupation density of the territory, building types, tourist accommodation offers, and segments of demand. There are two basic models, one concentrated and the other extensive. The first, clearly identified in the destination city of Benidorm, involves a high density of tall buildings. The presence of a major offer of regulated accommodation (hotels, apartments, and campsites) distributed through commercial channels, creates an important dynamism that enables the maintenance of tourism activity during most of the year. The other model is extensive and involves the construction of complex housing estates that have evolved from isolated or semi-detached family housing and are oriented to the market for holiday homes or rental. The economic repercussions are lesser than in the concentrated and commercial model and are focused on real estate. This latter model is more seasonal.
This intense process of occupation of the coastline, which has been called a ‘development tsunami’, and the real estate hyperproduction cycle in the 1996–2006 period [29] have resulted in the dilapidation of important environmental resources. This “tsunami” has been largely catalysed by the permissive Valencian urban regulations, implemented by neoliberal governments, and the absence of political will to comply with the provisions of the laws on land, environment and heritage [30]. Thus, 56% of the land in the first 500 metres from the coastal waterline in the province is being artificialized, a figure that reaches 42% for the 2-km strip [31]. In short, this has led to the generation of sharp social, economic, and demographic contrasts between coastal and inland areas. This process is also taking place in other Mediterranean regions such as Crete [32], Croatia [33] and the Bodrum Peninsula in Turkey [34].
The study area includes 13 coastal or near-coastal municipalities in the province of Alicante. Seven are located in the south of the province (Santa Pola, Guardamar del Segura, Orihuela, Rojales, San Fulgencio, Torrevieja, El Pilar de la Horadada) and six in the northern sector (Villajoyosa, Finestrat, Benidorm, La Nucia, Alfaz del Pi and Altea) (Figure 1). Their selection was decided by the following factors: (a) consideration as a mature ‘sun and sand’ tourist destination; (b) the importance that tourism has acquired in the coastal area, but also in near coastal areas as a result of coastal saturation; (c) existence of different tourism models with differing repercussions on water demand; (d) different rates of implantation in the provincial coast, both in the coastal and near the coastal sector; (e) the notable expansion of residential tourism in the 1997–2008 period, curbed by the bursting of the real estate bubble; (f) the insufficiency of water resources for climatic reasons and accentuated by the development of land uses with high demands; (g) the adoption of various actions to increase water resources and contain demand; and (h) the existence of models of governance and diverse sources of water resources.
The working hypotheses is articulated around the fact that despite the notable urban-tourist and residential growth recorded in this area since the 1960s, and accentuated in the period 1998–2007, the hydrosocial cycle has been able to provide the necessary water, and droughts have not caused cuts in supply. The resilience of the hydrosocial cycle is the result of measures affecting supply and demand.
The aims of this paper are: (a) identify the different tourism models implanted in this territory and describe them from the point of view of water consumption; (b) relate the water consumption of these models with the demand cycle from 2002 to 2017; (c) analyse the water cycle of these municipalities, highlighting the measures affecting supply and demand; and (d) identify the limitations associated with these hydrosocial cycles.

2. Materials and Methods

Various types of information are processed to achieve the aims stated in the Introduction section. Linked to water consumption, the primary data is obtained from databases on consumption (volume supplied and sources, conventional resources, desalination, etc.). Specifically, yearly volume supplied from 2002 to 2017 and the contribution of different sources according to years. This information has been provided by the wholesale water supply companies (Mancomunidad de los Canales del Taibilla [35,36], Consorcio de Aguas de la Marina Baja [37] and local authorities). This information has enabled a description of the hydrosocial cycle of the selected towns, specifically information on water resources and their origin, consumption and governance.
In these cycles, a distinction must be made between ‘raw water’ and ‘drinking water’. According to Spanish terminology, ‘raw water’ refers to water stored in reservoirs and aquifers or captured from rivers before its treatment in drinking water plants; while ‘drinking water’ is purified water flowing from the drinking water plants to domestic users. These flows may be under different management. Usually raw water is managed by relatively large regional and publicly owned wholesale companies (such as The Mancomunidad de los Canales del Taibilla or the Consorcio de la Marina Baja), whereas drinking water is managed by city-based retail companies (public, private, or mixed). It is also necessary to distinguish two concepts, namely ‘water supply’ and ‘water consumption’. Water supply refers to the total water entering the distribution network from treatment plants or storage. Water consumption refers to the water registered and distributed by type of user, in this case urban users. The information corresponds to the 2002–2017 period. This choice is determined by various factors: Firstly, the homogeneity of the data available for the study area, meaning gaps that could condition the results, have been avoided; and secondly, the representativeness of the period selected.
The year 2002 corresponds with a period of increasing demand—which peaked between 2004–2008 (depending on the municipality). The last year for which full information is available is 2017. These 15 years include a period of marked economic recession that affected consumption.
Information has been consulted relative to tourism uses (accommodation) for the study period, specifically, data related to tourism demand (number of tourist) and supply (number of beds). The primary data is obtained from databases of the Valencian Tourism Agency [25] (2002–2017) and the Spanish National Statistics Institute [38,39], specifically, data related to inhabitants and housing data by use (primary, second homes). With this information, municipalities are assigned to one of the identified tourism models. This is achieved by applying the non-permanent residential function index (RFI) and the relationship between hotel beds and registered population. The RFI reflects the relationship of proportionality between total properties and the resident population (census). Values above one mean that there are more dwellings than the registered population, and so the main function of the dwellings is residential. The relation between regulated accommodation and registered population is also studied. Values above one mean there are more beds in tourist accommodation than registered population, and this reveals the tourist function of the municipality.
A specific analysis is given the importance of residential tourism in the study area. An analysis of accommodation in private homes for holiday use is difficult, owing to a lack of sources, and to the fact that this is a complex phenomenon that includes various realities. These properties may be second homes, properties belonging to long-term foreign residents, or part of a large supply of holiday homes that are illegally marketed. Several indicators make it possible to estimate numbers, such as the non-permanent residential function index. Indices have been prepared to assess the efficiency and sufficiency of tourism from the point of view of water resources. Specifically, data on accommodation types (number of beds and l/inhabitant/day) in tourist models and l/inhabitant/day in tourist–residential models enable determining the differences between both models. An analysis of these indicators shows the changes registered by tourist consumption in the differing tourism models.
An analysis is also made of the regulatory and institutional framework of the hydrosocial water cycle (in terms of origin of resources) and the policies oriented to demand management adopted by various participants (hotel owners, utility companies, and users) through semi-structured interviews. We obtained 22 responses representing over a third of the total hotel beds in the resort in Benidorm. The rate of response by hotel category attained was: 65% of the total beds in the case of five-star hotels; 45% in the case of four-star hotels, and 30% for three-star hotels [40].
The originality of this research is related to: (a) The scale of the study case. It is not limited to the analysis of local cases. A supramunicipal or subregional scale has been preferred to analyze and characterize the different drinking water management systems; (b) it is the first analysis of the existing hydrosocial cycles with this scalar analysis that presents important differences for the management; and (c) the cycles of real estate sprawl are related to the changes in water planning and management in the analyzed areas, evaluating the pros and cons of the measures adopted to increase resilience to scarce rainfall and the short-term sequence of drought.

3. Results

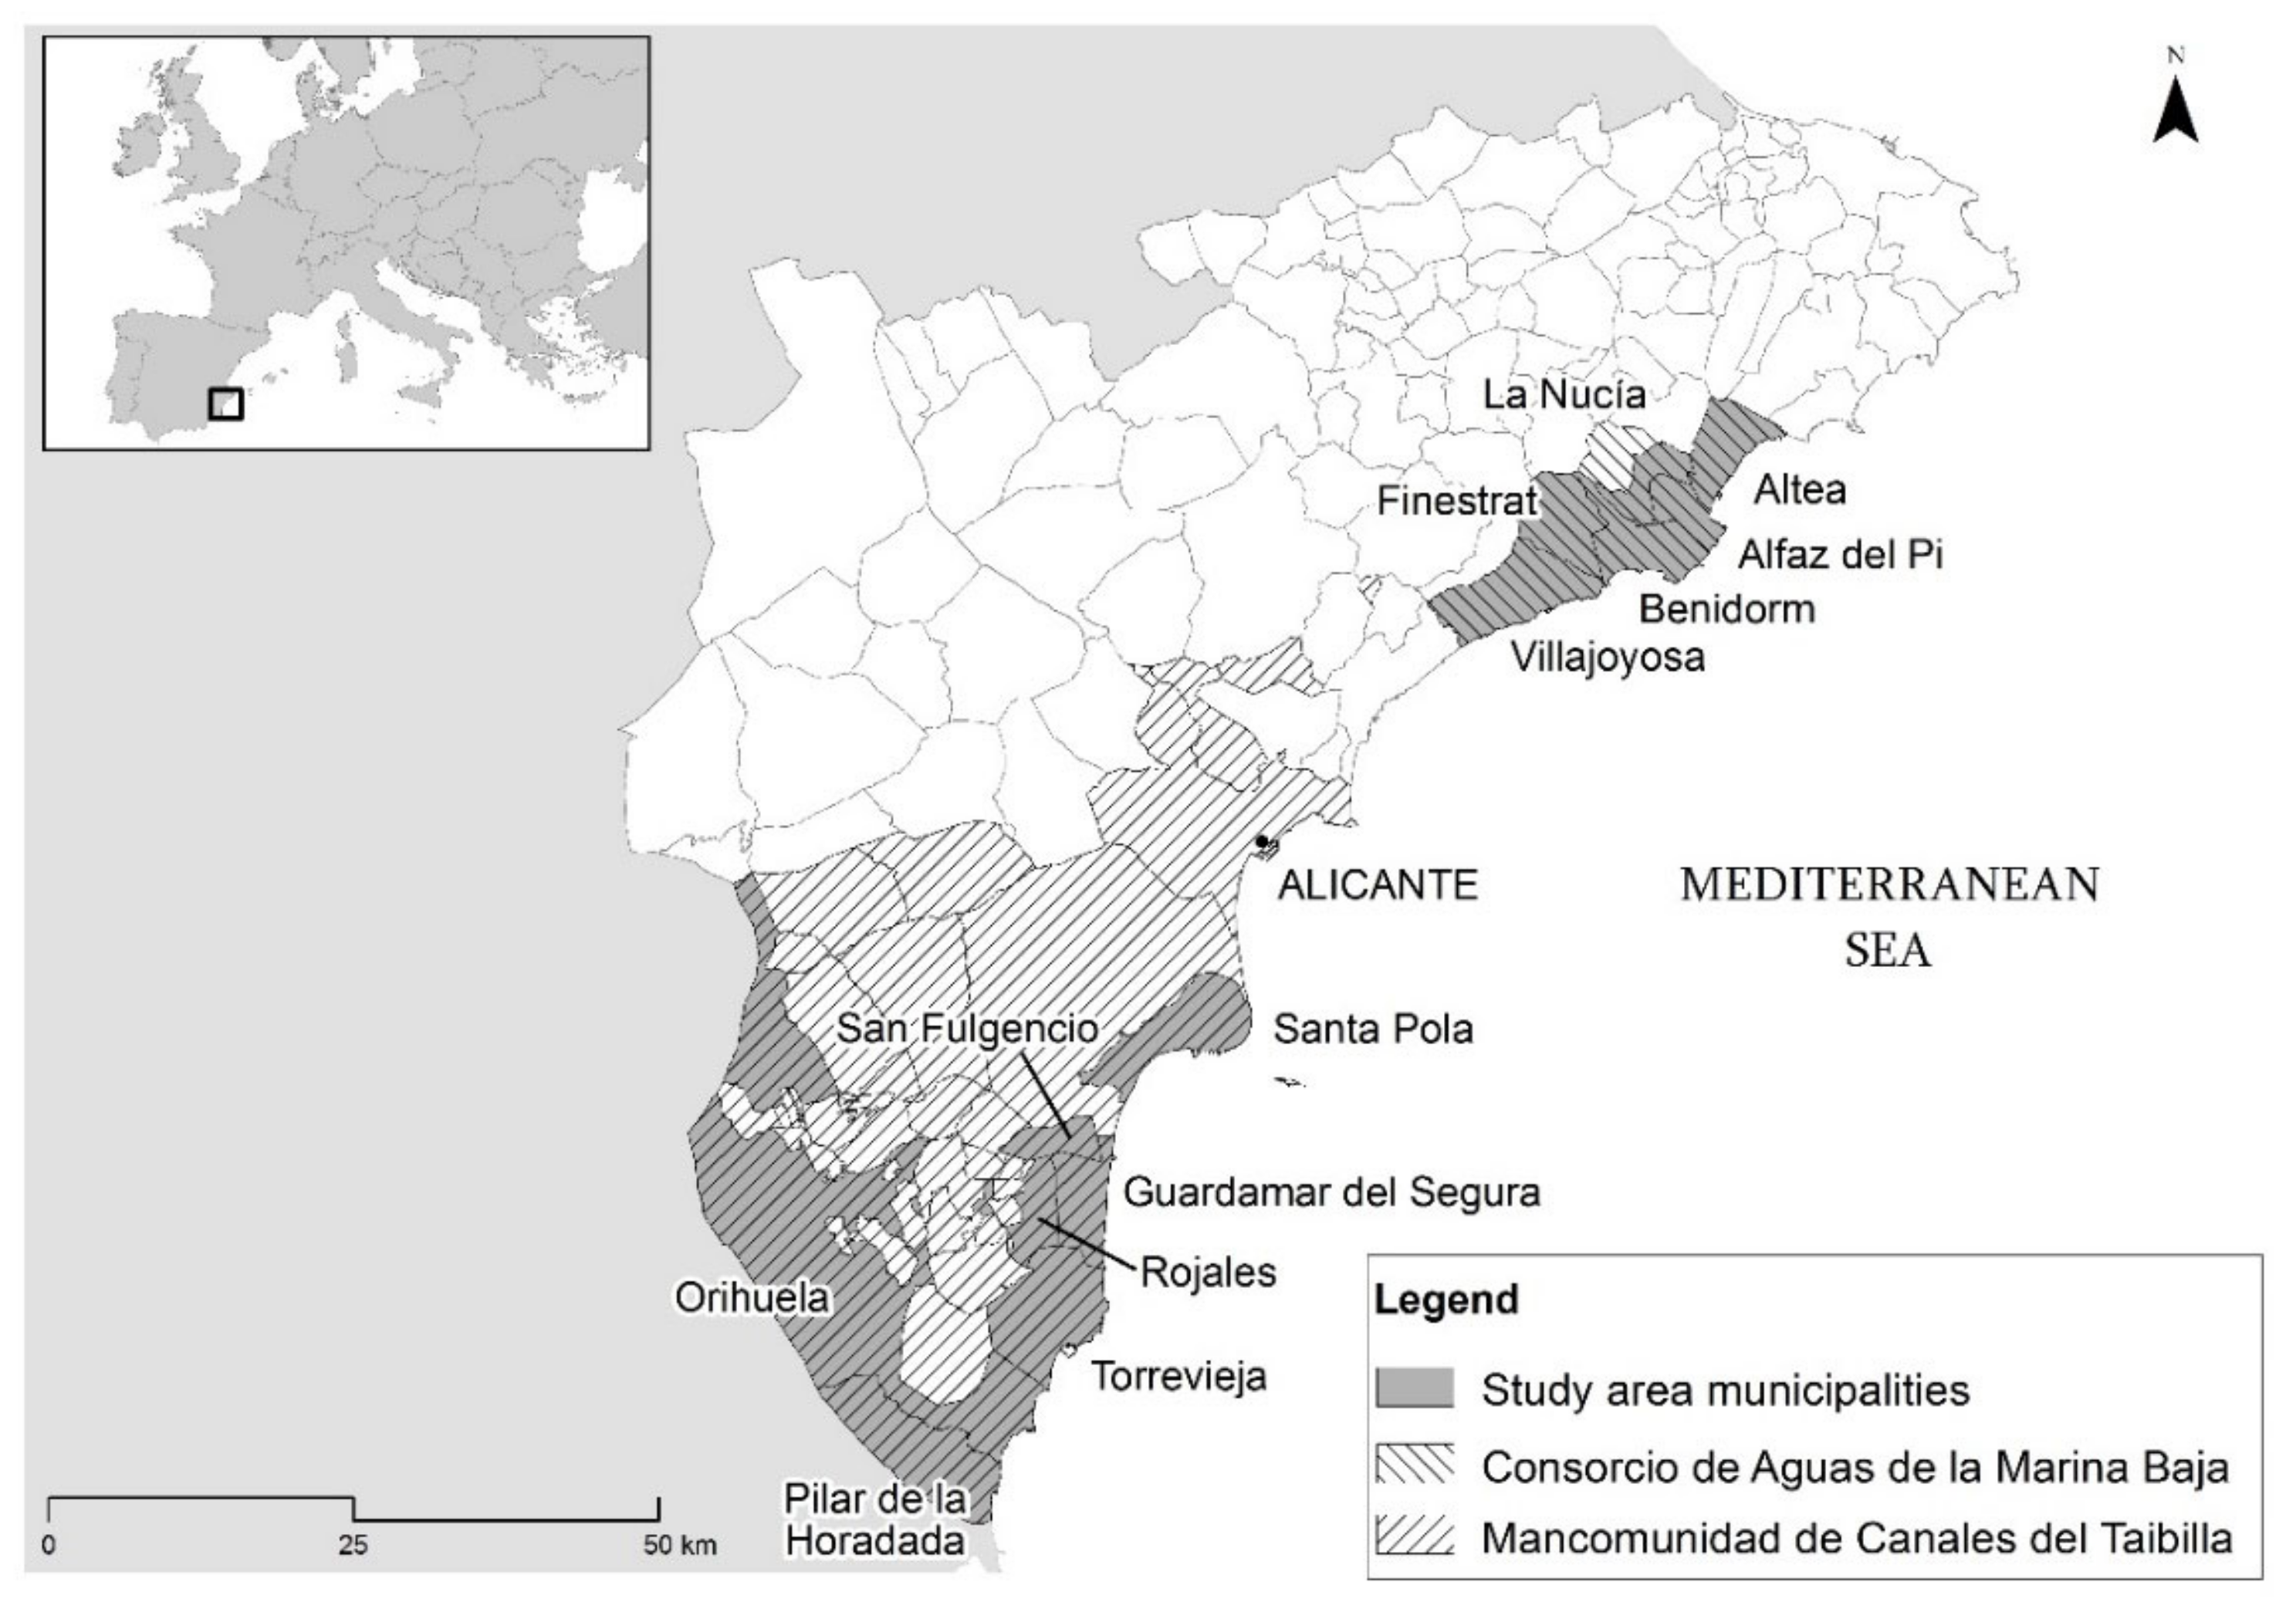
3.1. The Spatial Implementation Model

The 13 municipalities analysed represent 15% of the territory of the province, and 22.75% of the population. Altogether, tourism supply amounts to almost 150,000 regulated beds for tourist accommodation, representing 74% of the hotel beds in the province, 63.3% of campsites, and 44.80% of regulated apartments (Table 1). In total, these municipalities concentrate 53.9% of the regulated tourist accommodation in the province. This supply is distributed unevenly between the municipalities of the area and is notably concentrated in Benidorm (which contains more than 53% of those 150,000 beds and 81% of the hotel beds of the study area). El Tourism Specialisation Index (TSI) (Figure 2) relates the number of legal accommodation places with the census population. That is, it carries out an approximation to the commercial level of the holiday destination in front of areas specialized in residential tourism (second home tourism).
Based on the analysis of the population and a 2011 housing census [38], it is estimated that these 13 municipalities concentrate more than 250,000 properties for potential use as holiday homes. In some of these destinations, the capacity for accommodation in residential properties is three time greater than the number of registered residents. This is the case of Torrevieja (which concentrates some 250,000 beds of this type), Santa Pola, Guardamar del Segura, and El Pilar de la Horadada. The non-permanent residential function index (RFI), the value of which is situated at around 0.5 in conventional cities, is greater than 1 overall for the 13 municipalities, and in some cases reaches values of over 1.4. The relationship between habitual and non-habitual residences reflects this specialisation in residential tourism (Table 2, Figure 3 and Figure 4). The greater residential specialization in municipalities of the south of the province (Santa Pola, Guardamar, Torrevieja) with values close to 1.5 (FRI) is marked. These values are intensifies given the low percentages of main housing existing in these municipalities (29.55 Guardamar, 32.58 in Torrevieha, 31.71 in Santa Pola).
In the study area, three basic residential tourism development types are distinguished, according to the predominance of the basic urban holiday unit [40,41,42,43,44]:
  • Southern sector: Residential units formed by estates of terraced houses (26.25% of the built-up area) or detached properties, which generally occupy small plots (37.25% of the built-up area) [42,43].
  • Northern sector: Reduced presence of terraced estates and a greater presence of low-density residential estates, formed by detached houses. Morote [43] states that in this area, low-density housing represents almost 70% of developed land.
  • Benidorm: A highly concentrated urban model, a large supply of commercial accommodation distributed through international tour operators and with tourism and commercial activity maintained throughout the year. Private holiday homes (more than 100,000 beds) basically consist of apartments [40].

3.2. Water Consumption: General Tendency and Consumption for Specific Models

The evolution of water consumption over the last 15 years (2002–2017) presents a cyclical pattern in relationship with the behaviour of the tourism sector and real estate sectors. Since the end of the 20th century, the study area has constantly increased its consumption and this peaked between 2003 and 2008. This trend was broken after 2009, owing to the effects of the financial crisis. The tourism sector, despite having shown resilience to the crisis, reduced its growth considerably owing to restrictions in the flow of capital and reductions in family income. The bursting of the bubble had two effects on the holiday destinations in Alicante, as in other national and international destinations. Firstly, there was a reduction in the arrival of tourists and, secondly, a curbing of tourism real estate and related activities, which had become the economic motor of these municipalities. Both dynamics had an immediate effect on water consumption, which reproduced the trends set by tourism demand and the real estate market (Figure 5, Figure 6 and Figure 8). An analysis of the evolution of the number of stays and water consumption (raw water) in the municipalities of the study area synthesises several processes and phases:
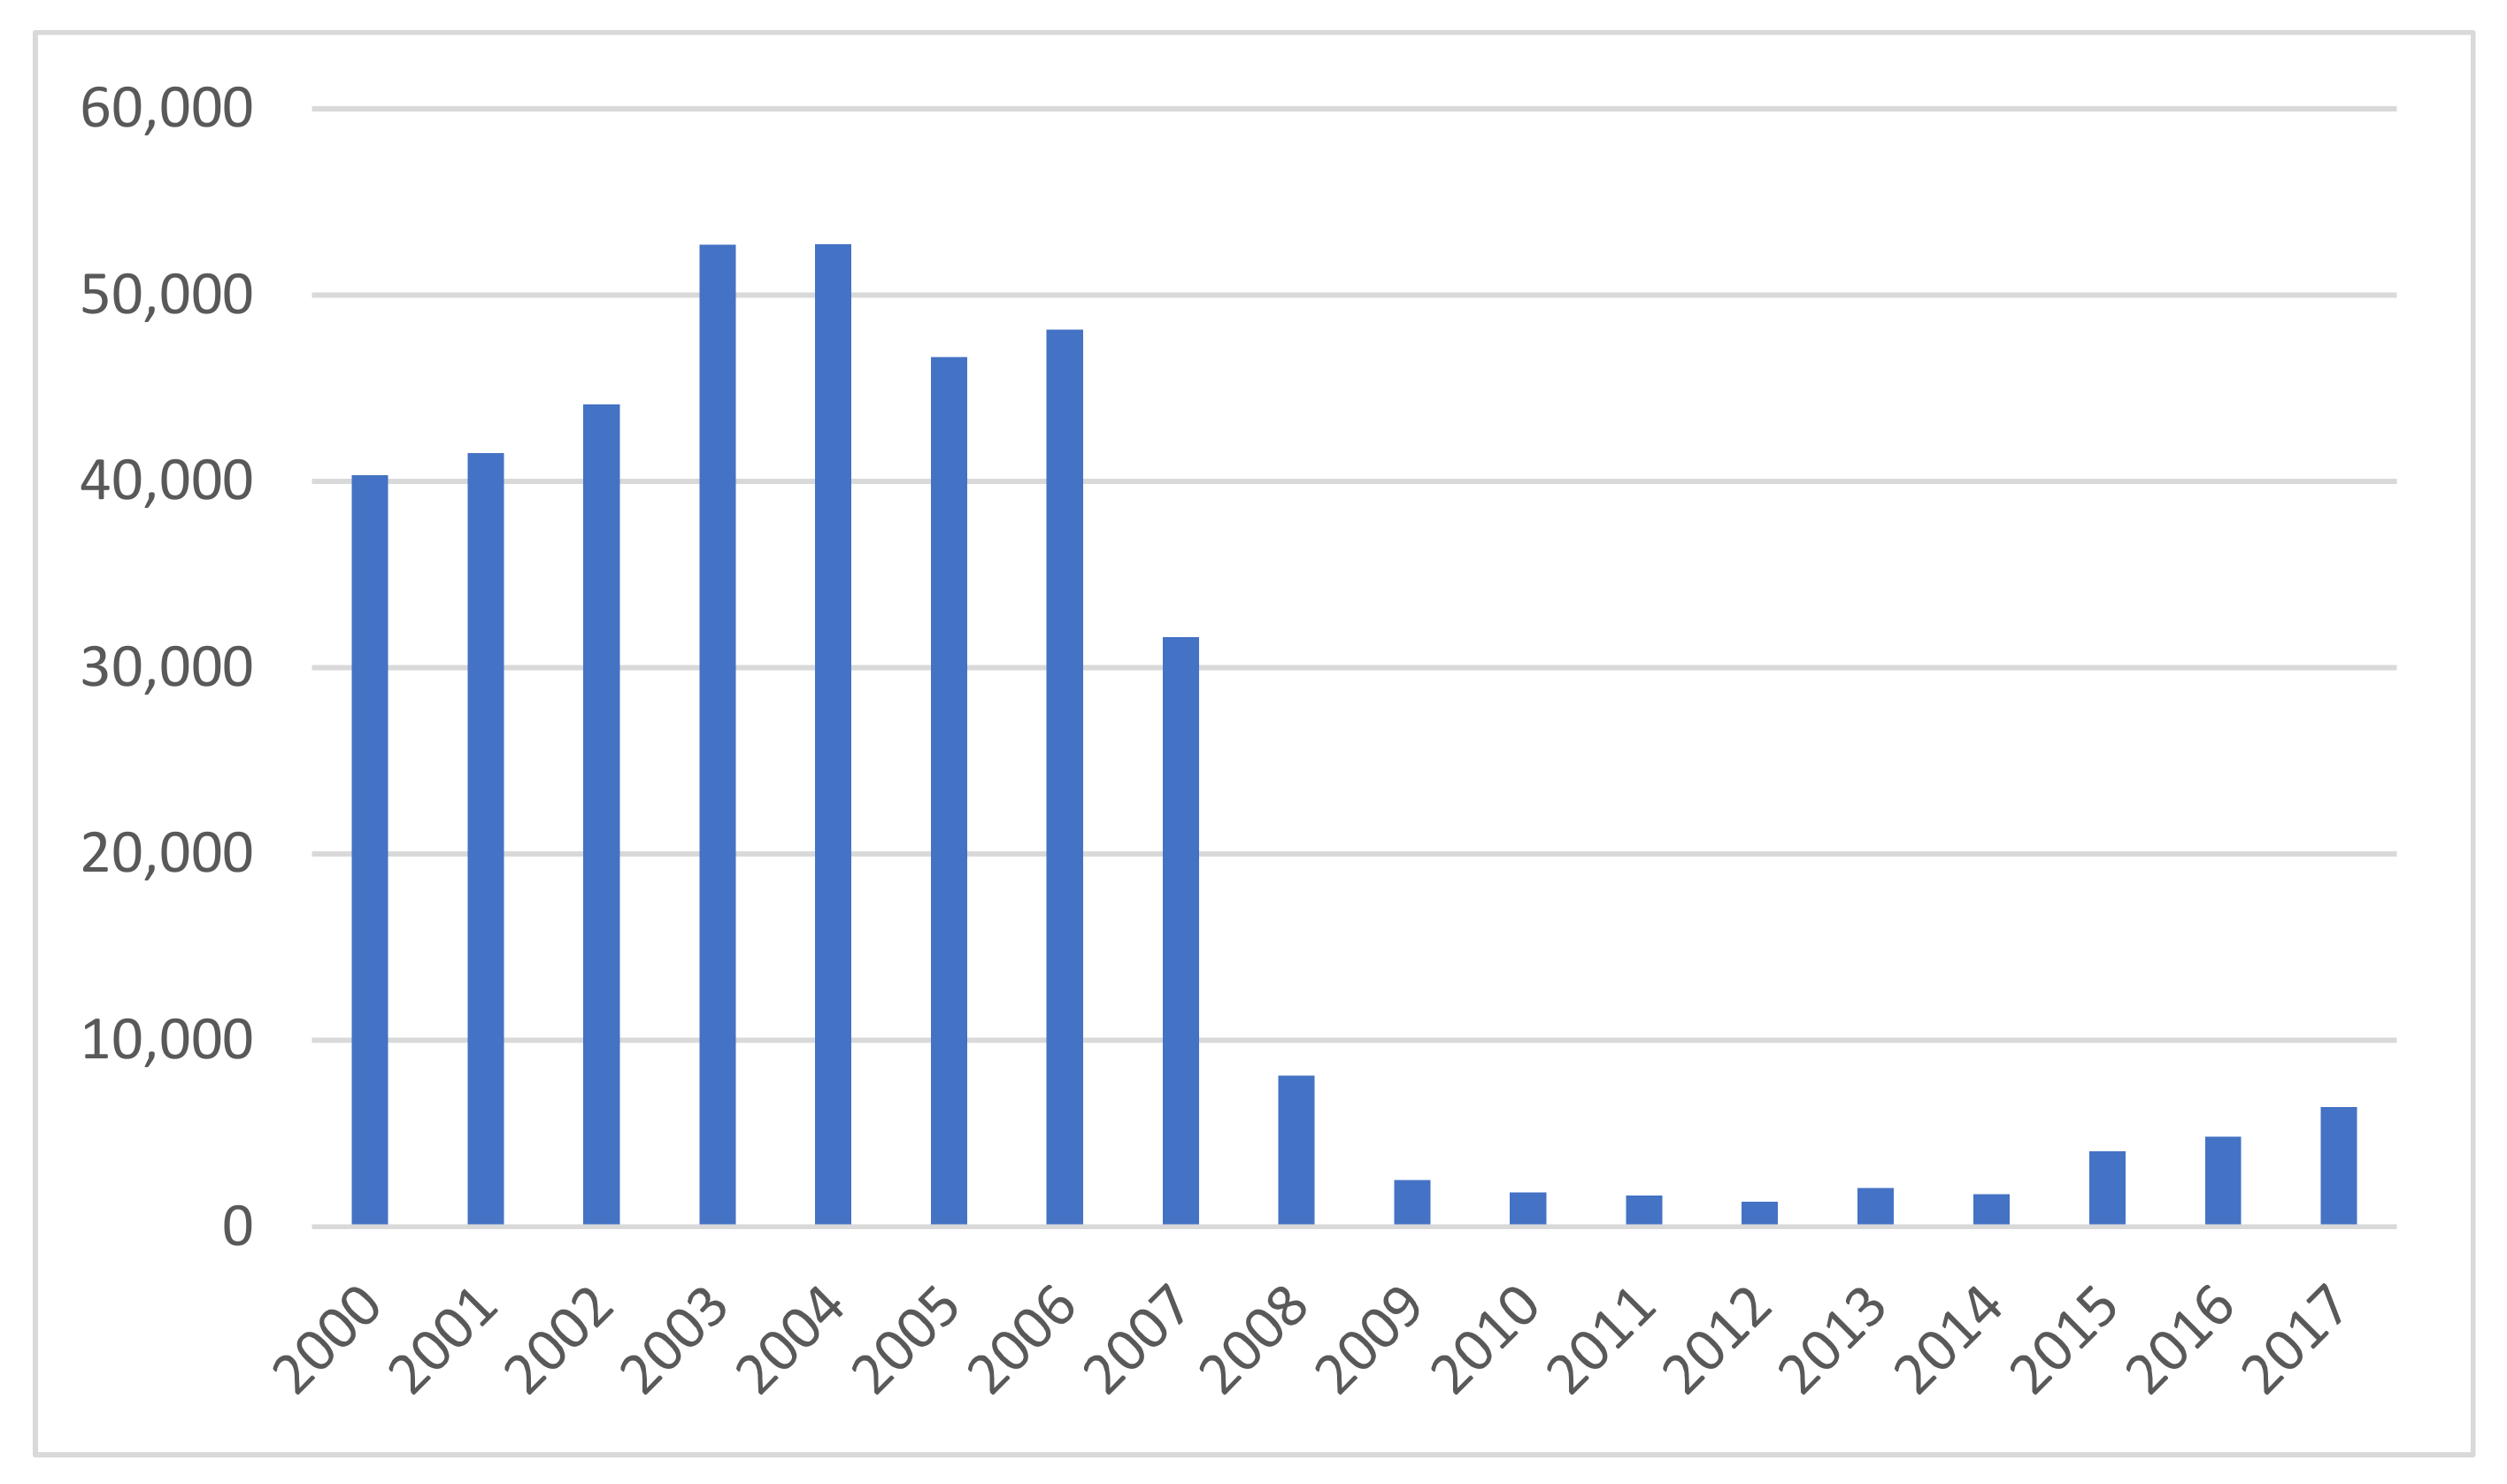
  • The peak in overall water consumption for the municipalities coincides with the peak in construction that took place during the first 5 years of this century. In the year 2006, the supplied volume reached 56 hm3. In eight of the municipalities (Guardamar, Orihuela, San Fulgencio, El Pilar, Finestrat, Benidorm, Alfaz, La Nucía), the maximum consumption in their historic series was reached between 2005 and 2006, and this is related to the construction of residential properties (Figure 6) and arrival of tourists. The year 2006, with 23.9 million overnight stays, was a record in the province until the end of the recession in 2013 (24.54 million) [25].
  • Between 2006 and 2013 (the low point of the series), the 13 municipalities reduced consumption by 17%. This reduction began before the crisis (2008), but was then accentuated by the crisis and the associated bursting of the real estate bubble and reduction in hotel stays as a consequence of a fall in the purchasing power of the middle classes. The reduction of consumption prior to 2008 is linked to initiatives aimed at reducing consumption (demand management and improvements in distribution network) as happens in many cities in developed countries [46].
  • The year 2013 saw the start of a slow but continuous increase in volume supplied. By 2017, nine municipalities (Santa Pola, Villajoyosa, Altea, Orihuela, El Pilar de la Horadada, Finestrat, Rojales, San Fulgencio and La Nucia) had exceeded the consumption of 2002. With the return of positive GDP figures and investment, new property development projects started popping up. Political instability in North Africa (Tunisia and Egypt) also led to a notable increase in the number of tourists visiting Alicante in recent years. The approval of plans that try to halt or limit the development of rural land have been met with strong opposition from business sectors (especially construction and real estate) and even from local residents. The reactivation of real estate development for tourism is more notable in the municipalities in the south of the province. Orihuela with 1.5 hm3 (+16.2%) and Rojales with 0.42 hm3 (+28%) have registered the largest increases. In the province of Alicante, the years 2015 (11.2 million), 2016 (11.9 million), and 2017 (13.5 million) registered record numbers of tourists, as a result of political instability in competing nations (Tunis and Turkey) and economic recovery. However, there has been a notable reduction in water consumption in Torrevieja, with a decrease of 0.8 hm3 (8.2%), and especially in Benidorm, which reduced consumption after 2002 by 1.9 hm3 (15%). These changes are related with measures to reduce demand and the nature of the dominant tourism models (hotels and compact estates) as analysed in the paragraphs below. The aspect to be highlighted is that consumption has increased in all the destinations since 2012–2015 which marks the end of the economic recession.
Basically, two urban types have been developed (Table 3): a concentrated model and an extensive model. In the latter, the varying degree of extensiveness means that there are sub-models, and these are largely determined by whether the houses are detached or terraced. The concentrated model (e.g., Benidorm) consumes much less water, since the management of its distribution in properties (blocks of flats) is easier and losses in the network are reduced. In the extensive model, where detached houses predominate (e.g., Alfas del Pi, Altea, and Villajoyosa), water use soars. This is due to: (a) losses in the distribution network; and (b) detached houses using water for outdoor uses (see, for example, Refs. [47,48]). In the extensive model with a predominance of terraced houses (Torrevieja, Rojales, Santa Pola, Orihuela and Pilar de la Horadada), the greater housing density, smaller plot sizes, and predominance of terraced housing means more moderate water consumption.

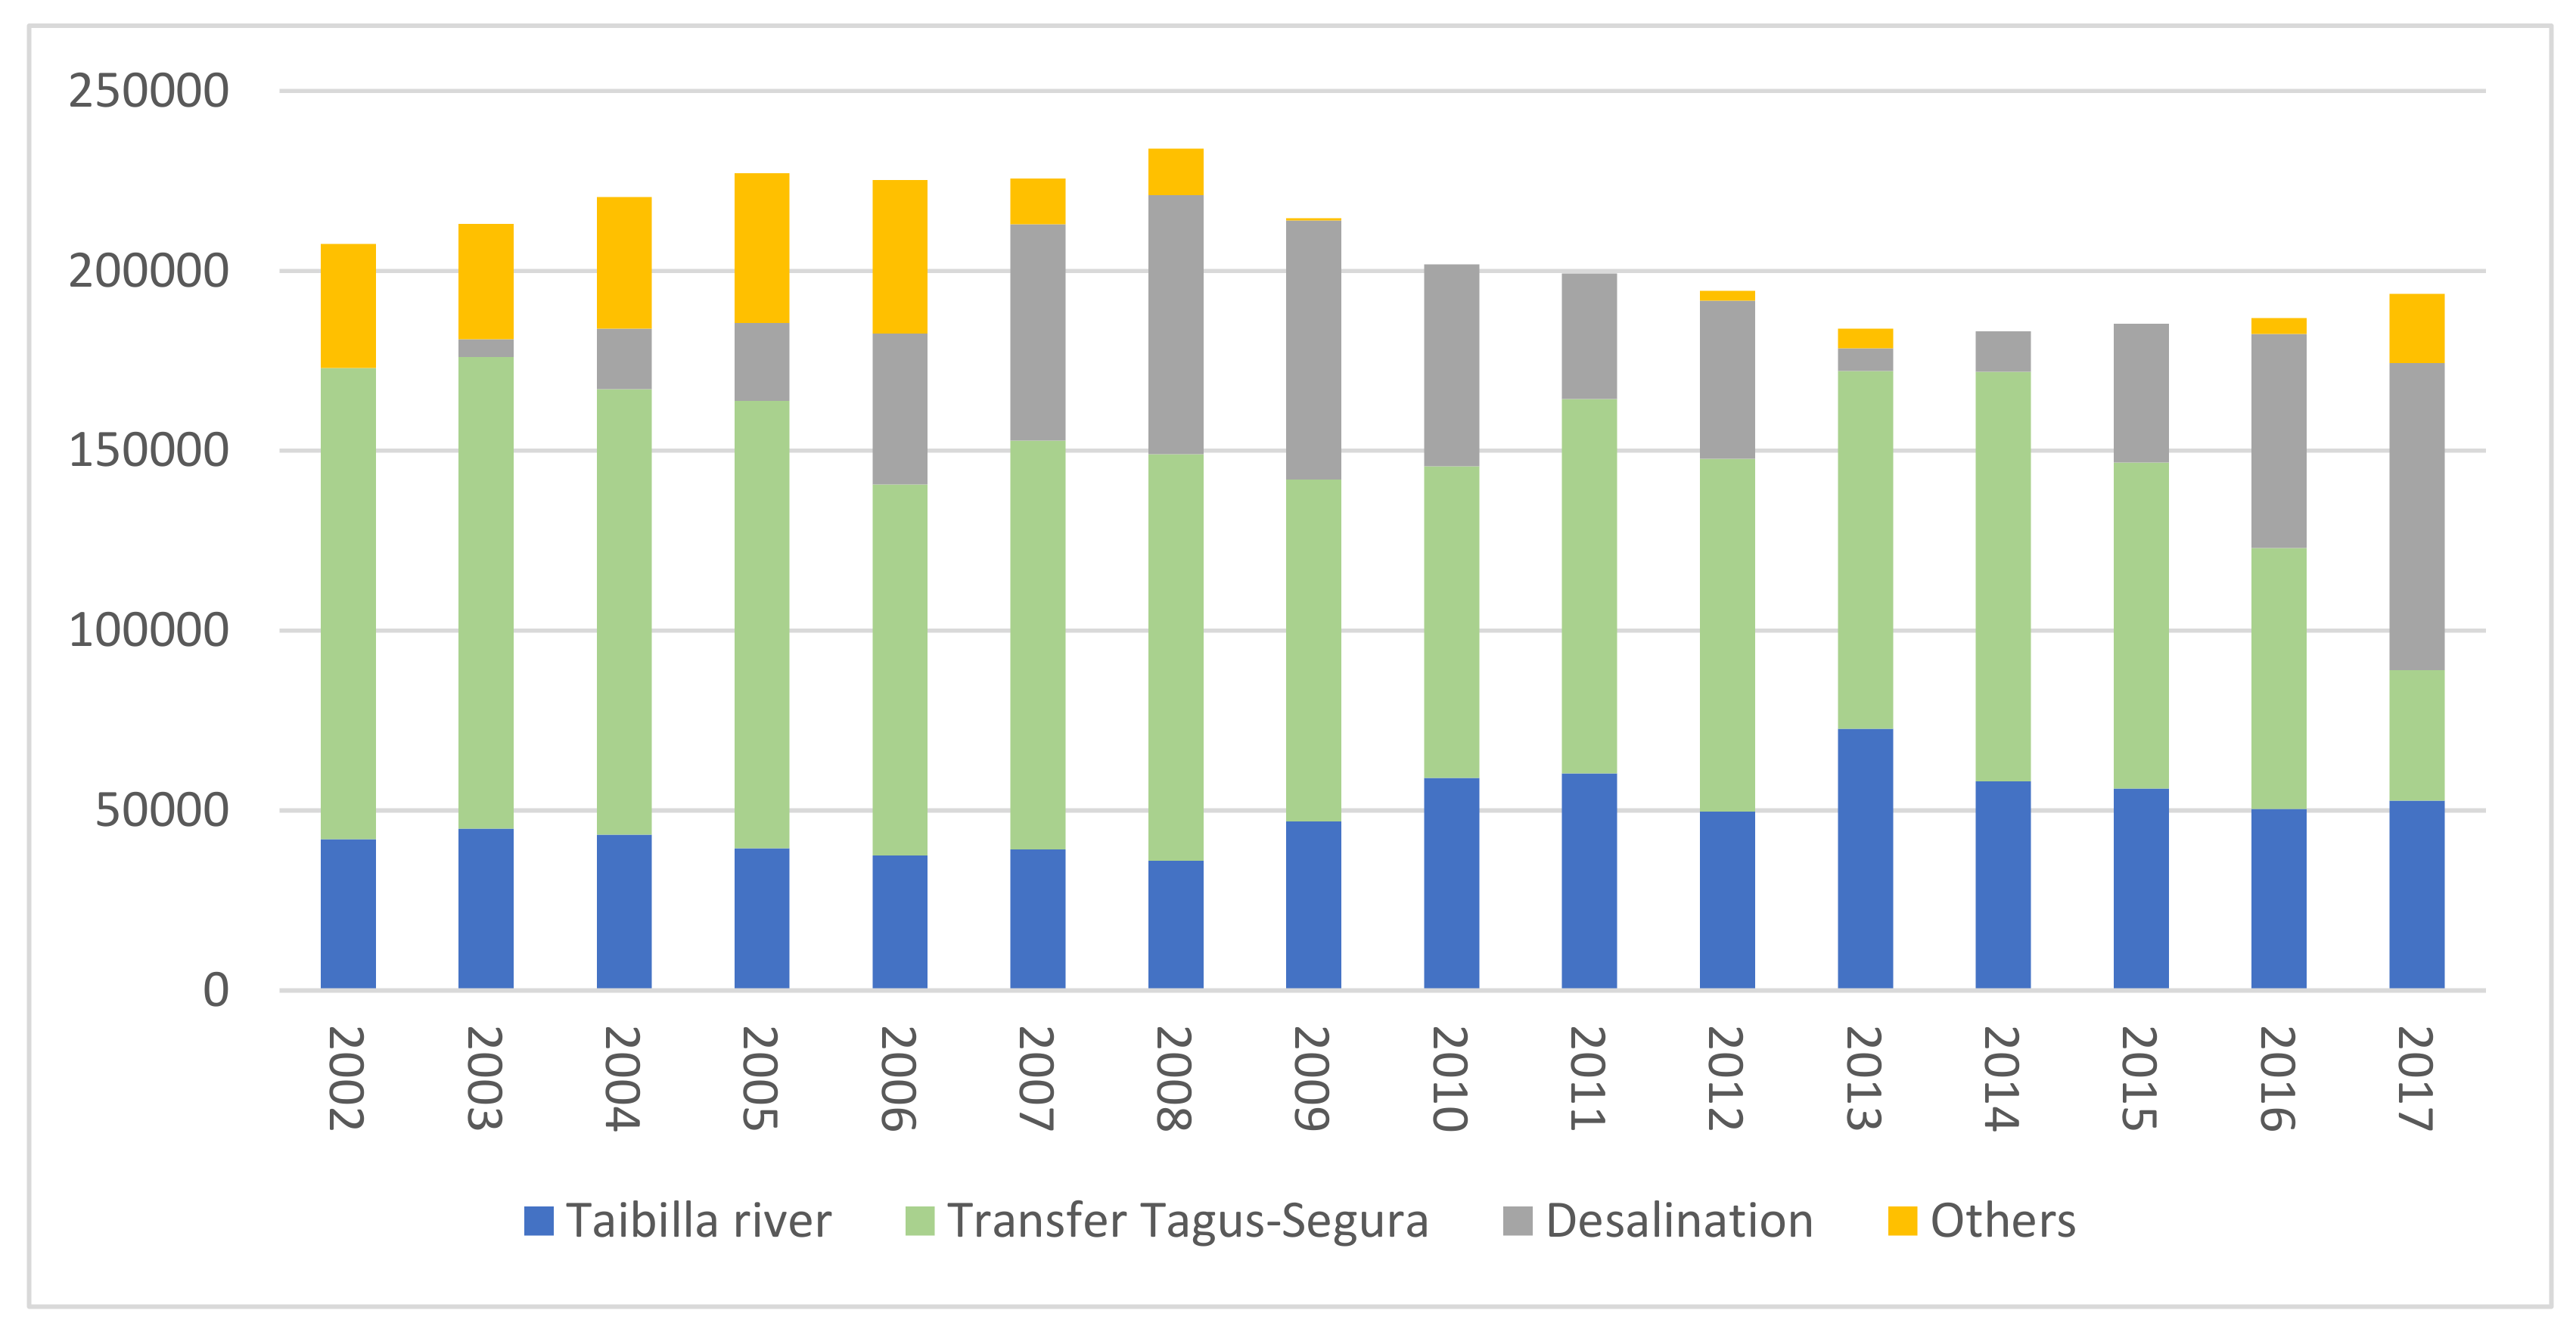
3.3. Supply Systems and Increase in Water Resilience

The availability and guaranteed supply of water have been decisive factors in the processes of tourism functionalisation and urbanisation of the territory [50]. In the light of the scarcity of water, tourist development of the municipalities on the coast of Alicante has depended on the integration of large-scale wholesale supply systems that collect and transport surface, ground, and desalinated waters, sometimes over long distances. This is the case of the Mancomunidad de los Canales del Taibilla (1927) and the Consorcio de Aguas de la Marina Baja (1977); both are public organisations. In many cases, the management of drinking water has been delegated to private companies, or mixed companies (Benidorm and Torrevieja). Mixed companies are formed by a public partner (a local authority) and a private company that provides the technology to improve the performance of the drinking water service.
The sharp increase in consumption has forced wholesale companies to diversify the available resources. The Mancomunidad de los Canales del Taibilla increased its supplies in the 1970s by obtaining water from the rivers Tagus and Segura (1979). Since the end of the 20th century, the new water requirements associated with the expansion of residential tourism have required a new diversification of sources (desalination) (Figure 7). The Mancomunidad de los Canales del Taibilla was able to guarantee urban, industrial and tourism supplies during the recent droughts of 2005–2009 and 2014–2017 by increasing supplies of desalinated water. These resources are added with the so-called ‘other’ sources that refer to waters from basin wells (extraordinary resources) and buying water contracts from others. The seven southern municipalities analysed represent 15.7% for 2017 of the total of the supplied volume by Mancomunidad de los Canales del Taibilla. This supply system is composed of a mix of sources (Tagus-Segura transfer, Taibilla River, desalination and extraordinary resources). It is very difficult to know which part of each water resource is supplied in some municipalities. However, it can be intuited that the desalinated water has a greater presence in the coastal settlements. The existing infrastructures to distribute desalinated water allow to do it especially in the Canal de Alicante (water infrastructure that distributes water in the coastal municipalities from the south of the province of Alicante to the provincial capital, Alicante). The characteristic features of these destinations compared to others of the Mancomunidad de los Canales del Taibilla would be: (1) seasonality and (2) the high consumption of second-line municipalities (non-coastal municipalities) [50].
In the case of the Consorcio de Aguas de la Marina Baja, the need to guarantee the growing demand for drinking water for tourism development concentrated in Benidorm led to successive actions aimed at an optimal regulation of surface resources, the sustainable use of aquifers, and the use of reclaimed water. To confront intense droughts, the Consorcio can access flows provided by the Mancomunidad de los Canales del Taibilla and the desalination plant at Muchamiel. The corner stone of this model has been a series of agreements with local farmers to enable the assignment of drinking water for the cities in exchange for supplying free-treated reclaimed water [38]. From 2002 to 2017, the volume of drinking water supplied per municipality has remained stable, with little variation (at between 22 and 19 hm3/year). Table 4 summarises these supply systems and reveals the growing complexity.
Initiatives to increase water resources have been accompanied in recent years by initiatives aimed at managing demand. These include improvements in techniques and leak management, the use of reclaimed water for the watering of gardens and green zones, and replacing thirsty vegetation. However, efficiency varies according to the tourism model implemented. This is very high in compact developments (for example, above 90% in Benidorm and Torrevieja) and decreases in the areas of extensive tourism due to the greater length of the networks (Table 3). Losses have been decreasing in recent years due to the efficiency of the network. From the beginning of the century to the present day, 10 of the 13 municipalities analysed have reached hydraulic performances (efficiency of drinking water network between raw water and billed water) above 80%. This rate is highly important and meaningful since the largest consumer (Benidorm), the efficiency is close to 95%. Even so, it is an issue in which administration and water utilities should continue to improve. It is worth emphasizing that the water utilities (as Hidraqua) have carried out an ongoing renewal of the distribution network and centralized control in real-time, in addition to the search for selective leaks. It has been possible by means of remote control and smart meters [49,51]. Furthermore, hotels in Benidorm have incorporated various measures aimed at reducing water consumption, such as awareness campaigns for clients and employees and technical improvements in bathrooms, kitchens, and swimming pools [40,52]. Evidence provided by researches conducted in the study area regarding the evolution of water consumption in the hotels of Benidorm appears to be somewhat contradictory, at least for the period included in the analysis. On the whole, water consumption in the city and water consumption in the sample of hotels examined declined during the period of analysis [40]. Similar actions have been carried out in hotels in the Costa Brava and the Balearic Islands [53,54,55]. Table 5 and Table 6 summarise the actions taken to optimise resources.

4. Discussion

The increase in water consumption because of mature tourism activities and in areas with a scarcity of water leads to a series of reflections regarding: (a) the sustainability of the spatial model; (b) the increase in water resources and actions to bolster the efficiency of available resources; and (c) future threats for tourist development associated with climate change. These are related to issues linked to the research hypothesis, namely, the ability of the hydrosocial cycle to adapt to the urban tsunami and, more specifically, how far it can reach in versatility and what are the limits of its resilience.

4.1. The Non-Sustainability of the Spatial Model

The occupation of the coastline of Alicante has been intensive over the last three decades and the same has occurred in other Mediterranean areas. Some 62% of the urban area of the province is concentrated at less than 10 km from the coast. At the peak of the spatial transformation of the Spanish coast (between 1987 and 2011) and until the start of the economic crisis, the coast of Alicante reached one of the highest indices of urban transformation in the whole of Spain (56% of the coastal strip from 0 to 500 m.) together with the provinces of Barcelona and Malaga. In 2018, 80% of the line behind the beaches was built on [31,56].
The spatial development policy followed in the Valencian region has not favoured the sustainable use of water, despite the fact that the spatial planning laws passed since 2002 (2004, 2014) favoured compact urban development over the low-density urban model. The key to this legislative failure has been the planning practices of the towns, which did not accept the compact planning management recommendation during the real estate ‘boom’ years. The recommendation was not accepted because property was considered a source of revenue with issues of licences and collection of taxes. To preserve the few remaining ‘windows’ of the Valencian coast from urban-tourism construction, the regional government approved (2018) a spatial plan that protects 52 areas of the coast selected on the basis of environmental, cultural, and heritage values and adaptation to climate change. This is the last opportunity for legislative spatial planning to preserve the few sectors of the Valencian coast that are not urban, and follows similar actions in Catalonia, the Basque Country and the Balearic Islands.
The bursting of the housing bubble significantly slowed the urbanisation process. However, since April 2014, the figures have shown an increase in the construction of new homes. Despite the negative impact in socio-economic terms (recession and increased unemployment) of dependence on construction, political leaders and constructors consider this activity as essential for the development of these spaces. This fact leads to a reflection on the non-sustainability of the system and how long a system based on new constructions can continue to be applied instead of more sustainable policies.
The increasing number of houses built since 2012 (Figure 8) further supports the existence of residential tourist models along much of the coastline of the province of Alicante (one of the objectives of this paper). The main development type on the coast of Alicante is low density urban sprawl (houses with gardens and swimming pools) which represents 57.3% of total built land, with differences between the northern sector of the province, where extensive urbanization reaches 69% of built land and the centre and south of the province where it only reaches 37% [43]. The predominance of a construction style that is highly demanding of water makes the model even less sustainable. A detached house (in Alfaz del Pi, for example) consumes some 710 l/hab./a day compared to 372 l/hab for an apartment in Benidorm. These figures have been reduced in the analysed period. In 2005, the consumptions amounted to some 872 l/hab./a day in Alfaz del Pi and 1043 in Benidorm [49].
In 2018, Alicante was the Spanish province with the second largest stock of new housing without selling after Madrid. Madrid had a stock of 41,248 (8.72%) and Alicante 40,765 (8.55%). Despite this, since 2016, the province of Alicante has been second in Spain in new housing transactions, bringing together almost 10% of the national total. In 2018, 6331 new dwelling units were approved. These figures are close to 2008, that is, before the burst of the housing bubble [57].

4.2. The Increase in Water Consumption and Actions Taken to Increase Efficiency of Available Resources

Water use in the tourist towns on the coast of Alicante is closely related to the spatial model which has been developed since the second half of the 20th century. Boom moments from the point of view of tourism activities are reflected in increased demand for water and vice versa (objective b of this article). The key years for the increase in water demands were between 1985 and 2004. During these years, municipal water consumption multiplied two or three times, compared to the demands of 1985. The origin of the current urban demand for water can be found in the periods of expansion of construction activity from 1985 to 1991 and a later period from 1998 to 2008. The reduction in the number of tourists and homes built is reflected in a reduction of consumption in the period of greatest intensity of the crisis. The existence of multiple factors that affect demand determines that demand contraction began years before the property crisis (2008). After 2000, measures for improving urban water management started to be implemented in many towns, and this led to a decline in water consumption [58,59,60]. Since 2015, after years of declining consumption, there was a slight increase in consumption in some coastal towns in Alicante owing to record numbers of tourists. To this, it must be added the recovery in real estate activity. Since 2016, the province of Alicante has been third nationally in the issue of construction permits (see Figure 8).
To respond to this increase in demand, various strategies have been developed in the last three decades for water planning and management. From the point of view of supply, the main action has been an increase in the production of non-conventional resources (treatment and desalination). The province of Alicante re-uses 87 hm3/year of treated water, especially in agricultural irrigation, recreation (golf courses), and urban uses (watering parks and gardens). This consumption represents 71% of the total treated volume, placing Alicante among the Spanish provinces that use the most wastewater [61]. Desalination capacity expanded considerably after the approval of the National Hydrological Plan (2001) and the A.G.U.A. Programme (2004) [62]. The province of Alicante has access to 173 hm3/year, thanks to the construction on the coast of five large desalination plants (Alicante I and II, Muchamiel, Torrevieja, Jávea and Denia). The incorporation of desalinated water has assured the supply of water to the tourist destinations regardless of droughts and so reduces consideration of water as a scarce resource. During the drought of 2015–2018, the availability of flows from desalination satisfied urban demands and so avoided cuts and restrictions in supply. Desalination has become a key water resource in arid and semi-arid areas. Its use has guaranteed the sufficiency of resources, but not efficiency [63]. Desalination has also generated other factors (high energy and environmental costs) that have been studied in the scientific literature [64,65,66,67]. The incorporation of desalination plants may lead to an increase in overall consumption since the supply is guaranteed, which would lead to the Jevons paradox.
The satisfaction of these demands has required the articulation of complex hydrosocial cycles (objective c) characterised by water resources from a variety of sources and also diverse systems of governance. This fact corroborates the research hypothesis of this investigation. In other words, despite the notable urban-tourist and residential growth registered in this area, the hydrosocial system has been able to provide the necessary water. In addition, water crises associated with drought since the mid-90s have not meant water cuts as happened in the 70s. The resilience of the hydrosocial system is the result of supply and demand measures.
From the point of view of managing demand, various measures have been adopted which aimed at promoting efficiency via the implementation of technical improvements in the wholesale and retail supply systems (increased efficiency of the network), in addition to the generalisation of saving habits in the domestic and non-domestic consumption sectors (hotel, recreational, commercial, and industrial) (see Table 5 and Table 6). These are policies based on the efficiency of supplies, uses and costs, which have already been raised since the end of the 20th century [12]. The reduction of consumption is linked to initiatives aimed at reducing consumption (demand management and improvements in distribution network) by water utilities companies. These actions are completed with those taken by users (for example, owners of hotels and second homes). The first ones have incorporated various measures aimed at reducing water consumption, such as awareness campaigns for clients and employees and technical improvements in bathrooms, kitchens, and swimming pools [40,48,49]. The second ones, the use of reclaimed water for the watering of gardens and green zones, and replacing thirsty vegetation.
This leads us to reflect on the limitations of these hydrosocial models (objective d) as a consequence of the recovery in demand following an upward swing in the economic cycle and forecasts associated with climate change [68] (see Section 4.3).

4.3. Future Threats for Tourism Development Associated with Climate Change

Climate change in the Mediterranean area will involve an increase in the irregularity of rain, as well as an increase in maximum and minimum temperatures, especially in the warmest months of the year during the tourist high season [69]. Climate modelling shows reductions in precipitation of between 10% (RCP 4.5) and 20% (RCP 8.5) towards the end of the century [70]. Also notable is the increase in the number of dry days per year. This means changes in surface run-off of 60% compared to the values for 2000 [70]. This fact will make it necessary to design drinking water management systems that guarantee the supply and respond to the principles of sustainable management in the framework of circular economies (use of rainwater, greywater, and treated water). The idea of the need to design urban water management models adapted to a greater irregularity in rainfall [12] is reinforced. The addition of new resources such as rainwater associated with changes in rainfall and runoff patterns and the use of purified water for garden irrigation and street cleaning constitute research lines to be developed in the future. Likewise, the use of greywater and the reuse of treated water should be embraced. This signifies compliance with the principles of sustainable spatial development and the circular economy [71,72].
The tourist municipalities on the coast of Alicante have developed measures for adapting to droughts in recent years, especially tourism companies (hotels) or drinking water management companies (which have improved the efficiency of water use, enabling a reduction in consumption that places water use in 2018 at levels seen in the 1980s [24]). In recent years, there has been a new upsurge in the real estate-tourism activity in the study area. This fact, together with the manifestations of climate change already evident in the irregularity of rainfall, will raise the need to carry out actions to improve drinking water supply and management systems.
Those systems based on the use of a single source of water supply from conventional resources (surface water or groundwater) will have to bet on new resources of unconventional types (wastewater treatment and desalination), and, especially, for the improvement in the management of existing resources (demand management). The local scale is fundamental in this issue, since at the regional scale (Valencian government), the policies of adaptation to climate change have not yet been implemented. Without doubt, the municipality of Benidorm has developed the greatest number of measures for adaptation to drought and, by extension, to the future effects of climate change. In many cases, hotel renovation processes and state-aid programmes have helped make this renovation possible. The result has been a reduction in the consumption of water and electricity [24,52] which has favoured a reduction of the annual running costs of the hotels.

5. Conclusions

Water is a basic input for the development of tourism. The growth of tourism activities and infrastructures is directly associated with an increase in water use. The scientific literature on the subject frequently refers to water as a limited and limiting resource for the growth of tourism, especially in those areas where it is scarce, owing to climatic factors. This has not been an obstacle for the development of tourism in semi-arid sectors; however, this has caused an intense spatial transformation and involved the consumption of considerable natural resources. The adoption of policies aimed at increasing the resources available and, to a lesser extent, demand management, has meant that water is no longer a limiting factor in the study area. Another issue is the sum of the environmental effects associated with maintaining the tourism-residential model. The key actions that have increased the resilience of these tourist destinations have been the increase of water resources (via desalination) and, mainly, the improvement of the efficiency of the drinking water network. In the latter, the ongoing renewal of the distribution network, the centralized control in real-time, and the search for selective leaks and smart meters have made it possible to increase network efficiency.
In the case of the province of Alicante, in view of the characteristics of the tourist destination (a mature destination with a high level of tourism demand that is well recognised in the markets) and the tourism model (characterised by considerable residential tourism), the agents involved have not come to terms with the idea of introducing policies for stabilisation and/or degrowth [67]. On the contrary, only the global financial crisis that occurred between 2007 and 2015, which affected the real estate sector in Spain, has curbed the growth of urban tourism. The success of the adopted measures explains that the water supply is guaranteed, even in situations of drought, which has increased the resilience against this natural risk. Nonetheless, one of the main keys resulting from this supply guarantee is to know how it affects the global sustainability of this model regarding other resources such as soil or energy. The risk of increasing pressure on these resources raises, but also the water footprint associated with tourism activities. An issue to consider in future research would be when the current model would be able to continue to develop, even more so if the forecasts associated with climate change are taken into account.
The future research directions are related to: (a) To go in-depth on the recent development of the water management system in the Valencian Community, the administrative region of reference; thus, concrete actions to be carried out by local and regional administrations can be proposed, which are the ones that have competences in water supply; (b) to examine the Emergency Plan for Droughts (plan at local level) to assess the effectiveness of the planned measures to guarantee supplies during droughts events; and (c) to deepen othe water-energy nexus to assess the efficiency of the supply systems based on the diverse water sources used in the study area (for example aquifers, desalination, or transfer Tagus-Segura) and the energy consumption linked to each one.

Author Contributions

All authors have contributed equally.

Funding

This research was funded by the Ministry of Economy and Competitiveness (Spain), grant number CSO2015-65182-C2-2-P (“Uses and management of non-conventional water resources on the coast of Valencia and Murcia as an adaptation strategy to drought”).

Conflicts of Interest

The authors declare no conflict of interest.

References

  1. Dekimpe, M.G.; Peers, Y.; Van Heerde, H.J. The Impact of the Business Cycle on Service Providers. Insights from International Tourism. J. Serv. Res. 2016, 19, 22–38. [Google Scholar] [CrossRef]
  2. Büscher, B.; Fletcher, R. Destructive creation: Capital accumulation and the structural violence of tourism. J. Sustain. Tour. 2017, 25, 651–667. [Google Scholar] [CrossRef]
  3. Murray, I. Capitalismo y Turismo en España. Del ‘Milagro Económico’ a ‘La Gran Crisis’ (Capitalism and tourism in Spain. From ‘economic miracle’ to ‘the great crisis’); Alba Sud, Investigación y comunicación para el desarrollo: Barcelona, Spain, 2015; p. 426. [Google Scholar]
  4. Hall, C.M. Crisis events in tourism: Subjects of crisis in tourism. Curr. Issues Tour. 2010, 13, 401–417. [Google Scholar] [CrossRef]
  5. Ritchie, B.W. Chaos, crises and disasters: A strategic approach to crisis management in the tourism industry. Tour. Manag. 2004, 25, 669–683. [Google Scholar] [CrossRef]
  6. World Tourism Organization (UNWTO). Tourism Highlights (2017 Edition). Available online: http://www2.unwto.org/publication/unwto-tourism-highlights-2017 (accessed on 15 December 2018).
  7. Gormsen, E. The impact of tourism in coastal areas. Geojournal 1997, 42, 39–54. [Google Scholar] [CrossRef]
  8. De Kadt, I. Tourism: Passport to Development? In Perspectives on the Social and Cultural Effects of Tourism on Developing Countries; Oxford University Press: Oxford, UK, 1979; p. 384. [Google Scholar]
  9. Gössling, S.; Peeters, P.; Hall, C.M.; Ceron, J.P.; Dubois, G.; Lehmann L., V.; Scott, D. Tourism and water use: Supply, demand, and security. An international review. Tour. Manag. 2012, 33, 1–15. [Google Scholar]
  10. Hall, C.M. Degrowing Tourism: Décroissance, Sustainable Consumption and Steady-State Tourism. Anatolia 2009, 20, 46–61. [Google Scholar] [CrossRef]
  11. Del Moral, L. Nuevas tendencias en gestión del agua, ordenación del territorio e integración de políticas sectoriales (New trends in water management, spatial planning and integration of sectorial policies). Scr. Nova 2009, 13, 281–309. [Google Scholar]
  12. Arrojo, P.; Naredo, J.M. La Gestión del Agua en España y California (Water management in Spain and California); Bakeaz: Bilbao, Spain, 1997; p. 192. [Google Scholar]
  13. Iglesias, A.; Garrote, L.; Flores, F.; Moneo, M. Challenges to manage the risk of water scarcity and climate change in the Mediterránean. Water Resour. Manag. 2007, 21, 775–788. [Google Scholar] [CrossRef]
  14. Lionello, P.; Abrantes, F.; Gacic, M.; Planton, S.; Trigo, R.; Ulbrich, U. The climate of Mediterranean region: Research progresos and climate change impacts. Reg. Environ. Chang. 2014, 14, 1679–1684. [Google Scholar] [CrossRef]
  15. Olcina, J.; Miró, J. Actividad Turística y Cambio Climático en la Comunidad Valenciana. Alicante: Universidad de Alicante. 2017. Available online: http://rua.ua.es/dspace/handle/10045/71827 (accessed on 9 January 2019).
  16. Essex, S.; Kent, M.; Newnham, R. Tourism Development in Mallorca: Is Water Supply a Constraint? J. Sustain. Tour. 2004, 12, 4–28. [Google Scholar] [CrossRef]
  17. Linton, J.; Budds, J. The hydrosocial cycle: Defining and mobilizing a relational-dialectical approach to water. Geoforum 2014, 57, 170–180. [Google Scholar] [CrossRef]
  18. Kanakoudis, V.; Tsitsifli, S.; Samaras, P.; Zouboulis, A. Water pipe networks performance assessment: Benchmarking eight cases across the EU Mediterranean basin. Water Qual. Expo. Health 2015, 7, 99–108. [Google Scholar] [CrossRef]
  19. Kanakoudis, V.; Tsitsifli, S.; Samaras, P.; Zouboulis, A. Assessing the performance of urban water networks performance assessment results across the EU Mediterranean area: The paradox of high NRW levels and absence of NRW reduction measures planning. Water Sci. Technol. Water Supply 2013, 13, 939–950. [Google Scholar] [CrossRef]
  20. UNWTO. Djerba Declaration on Tourism and Climate Change. 2003. Available online: http://sdt.unwto.org/sites/all/files/docpdf/decladjerbae.pdf (accessed on 9 January 2019).
  21. Kanakoudis, V.; Tsitsifli, S.; Papadopoulou, A.; Curk, B.C.; Karleusa, B. Estimating the Water Resources Vulnerability Index in the Adriatic Sea Region. Procedia Eng. 2016, 162, 476–485. [Google Scholar] [CrossRef] [Green Version]
  22. Kanakoudis, V.; Papadopoulou, A.; Tsitsifli, S.; Cencur Curk, B.; Karleusa, B.; Matic, B.; Altran, E.; Banovec, P. Policy recommendation for drinking water supply cross-border networking in the Adriatic region. J. Water Supply Res. Technol. Aqua 2017, 66, 489–508. [Google Scholar] [CrossRef]
  23. Intergovernmental Panel on Climate Change, IPCC. Special Report Global warming of 1.5 °C. 2018. Available online: https://www.ipcc.ch/report/sr15/ (accessed on 9 November 2018).
  24. Olcina, J.; Biener, S. ¿Está cambiando el clima valenciano? In Realidades e Incertidumbres”, in Climas y Tiempos del País Valenciano (Adaptation Measures to the Risk of Drought in the Hotel Sector of Benidorm (Alicante, Spain)); Olcina, J., Moltó, E., Eds.; Publicaciones de la Universidad de Alicante: Alicante, Spain, 2019; pp. 162–170. [Google Scholar]
  25. Agencia Valenciana de Turismo. El turismo en la Comunitat Valenciana 2017 (Tourism in the Valencian Community 2017). Available online: http://www.turisme.gva.es/tcv/tcv2017/1-CV_2017c.pdf (accessed on 9 January 2019).
  26. Villar, R.; Pérez, A. Factors Affecting Domestic Water Consumption on the Spanish Mediterranean Coastline. Prof. Geogr. 2018, 70, 513–525. [Google Scholar] [CrossRef]
  27. Gössling, S.; Hall, C.M.; Scott, D. Tourism and Water; Channel View Publications: Bristol, UK, 2015; p. 190. [Google Scholar]
  28. Cazcarro, I.; Duarte, R.; Chóliz, J.S. Tracking Water Footprints at the Micro and Meso Scale: An Application to Spanish Tourism by Regions and Municipalities. J. Ind. Ecol. 2016, 20, 446–461. [Google Scholar] [CrossRef]
  29. Gaja, F. El “Tsunami Urbanizador” en el Litoral Mediterráneo Español. El Ciclo de Hiperproducción Inmobiliaria 1996–2006 (The “Urban Tsunami” at the Mediterranean Coast. Real Estate Hyperproduction Cycle, 1996–2006). Scripta Nova 2008, 270. Available online: http://www.ub.edu/geocrit/sn/sn-270/sn-270-66.htm (accessed on 13 November 2018).
  30. Naredo, J.M.; Montiel, A. El Modelo Inmobiliario Español y Su Culminación en el Caso Valenciano (The Spanish Real Estate Model and Its Culmination in the Valencian Case); Icaria: Barcelona, Spain, 2011; p. 174. [Google Scholar]
  31. Observatorio de la Sostenibilidad (OSE). Cambios en la Ocupación del Suelo en la Costa (Changes in Land Occupation on the Coast). Costa 2016. Available online: http://www.observatoriosostenibilidad.com/documentos/COSTA%2016v01_a.pdf (accessed on 13 November 2018).
  32. Andriotis, K. Researching the development gap between the hinterland and the coast—Evidence from the island of Crete. Tour. Manag. 2006, 27, 629–639. [Google Scholar] [CrossRef]
  33. Jordan, P. Restructuring Croatia’s coastal resorts: Change, sustainable development and the incorporation of rural hinterlands. J. Sustain. Tour. 2000, 8, 525–539. [Google Scholar] [CrossRef]
  34. Idikut, A.C.; Edelman, D.J. Promoting sustainable tourism in coastal cities and their hinterland: The case of Turkey’s Bodrum Peninsula. Cmu J. 2003, 2, 125–136. [Google Scholar]
  35. Mancomunidad de los Canales del Taibilla. Mancomunidad de los Canales del Taibilla: El Organismo y su Evolución Histórica(La Mancomunidad de los Canales del Taibilla: the Institution and Its Historical Evolution); Ministerio de para la transición ecológica: Madrid, Spain, 2018; p. 46. [Google Scholar]
  36. Mancomunidad de los Canales del Taibilla. Available online: https://www.mct.es/ (accessed on 22 April 2019).
  37. El Consorcio de Aguas de la Marina Baja. Available online: http://www.consorciomarinabaja.org/ (accessed on 22 April 2019).
  38. INE. Censo de Población y Vivienda (Census Population and Buildings). 2011. Available online: https://www.ine.es/censos2011_datos/cen11_datos_resultados.htm (accessed on 13 November 2018).
  39. INE. Padrón Municipal de Habitantes (Municipal Register Population by Municipality). 2017. Available online: https://www.ine.es/dyngs/INEbase/es/categoria.htm?c=Estadistica_P&cid=1254735572981 (accessed on 13 November 2018).
  40. Rico, A.; Olcina, J.; Baños, C.; Garcia, X.; Sauri, D. Declining water consumption in the hotel industry of mass tourism resorts: Contrasting evidence for Benidorm, Spain. Curr. Issues Tour. 2019, 1–14. [Google Scholar] [CrossRef]
  41. Vera, J.F. Turismo y Urbanización en el Litoral Alicantino (Tourism and Urbanization in the Alicante Coast); Diputación provincial de Alicante: Alicante, Spain, 1987; p. 441. [Google Scholar]
  42. Rico, A.M. Tipologías de consumo de agua en abastecimientos urbano-turísticos de la Comunidad Valenciana (Water Consumption Patterns in Urban/Tourist Supplies in the Region of Valencia). Investig. Geográficas 2007, 42, 5–34. [Google Scholar] [CrossRef]
  43. Morote, A.F. Tipologías urbano-residenciales del litoral de Alicante: Repercusiones territoriales. Ciudad y Territorio (Urban-residential typologies on the coast of Alicante: territorial impacts). Estud. Territ. 2014, 181, 431–444. [Google Scholar]
  44. Ivars, J.; Rodríguez, I.; Vera, J.F. The evolution of mass tourism destinations: New approaches beyond deterministic models in Benidorm (Spain). Tour. Manag. 2013, 34, 184–195. [Google Scholar] [CrossRef] [Green Version]
  45. Colegio Oficial de Aparejadores Arquitectos Técnicos e Ingenieros de Edificación de Alicante. Resumen de Estadística de Visados (Summary of Visa Statistics). Available online: https://www.aparejadoresalicante.org/el-colegio/informacion/estadisticas/ (accessed on 9 January 2019).
  46. Morote, A.F.; Olcina, J.; Rico, A.M.; Hernández, M. Water Management in Urban Sprawl Typologies in the City of Alicante (Southern Spain): New Trends and Perception after the Economic Crisis? Urban Sci. 2019, 3, 7. [Google Scholar] [CrossRef]
  47. Hof, A.; Wolf, N. Estimating potential outdoor water consumption in private urban landscapes by coupling high-resolution image analysis, irrigation water needs and evaporation estimation in Spain. Landsc. Urban Plan. 2014, 123, 61–72. [Google Scholar] [CrossRef]
  48. Morote, A.F. Espacios ajardinados privados en España y su incidencia en el consumo de agua: Estado de la cuestión (Private gardens and their impact on water consumption in Spain. State of the matter). An. De Geogr. De La Univ. Complut. 2017, 37, 415–443. [Google Scholar]
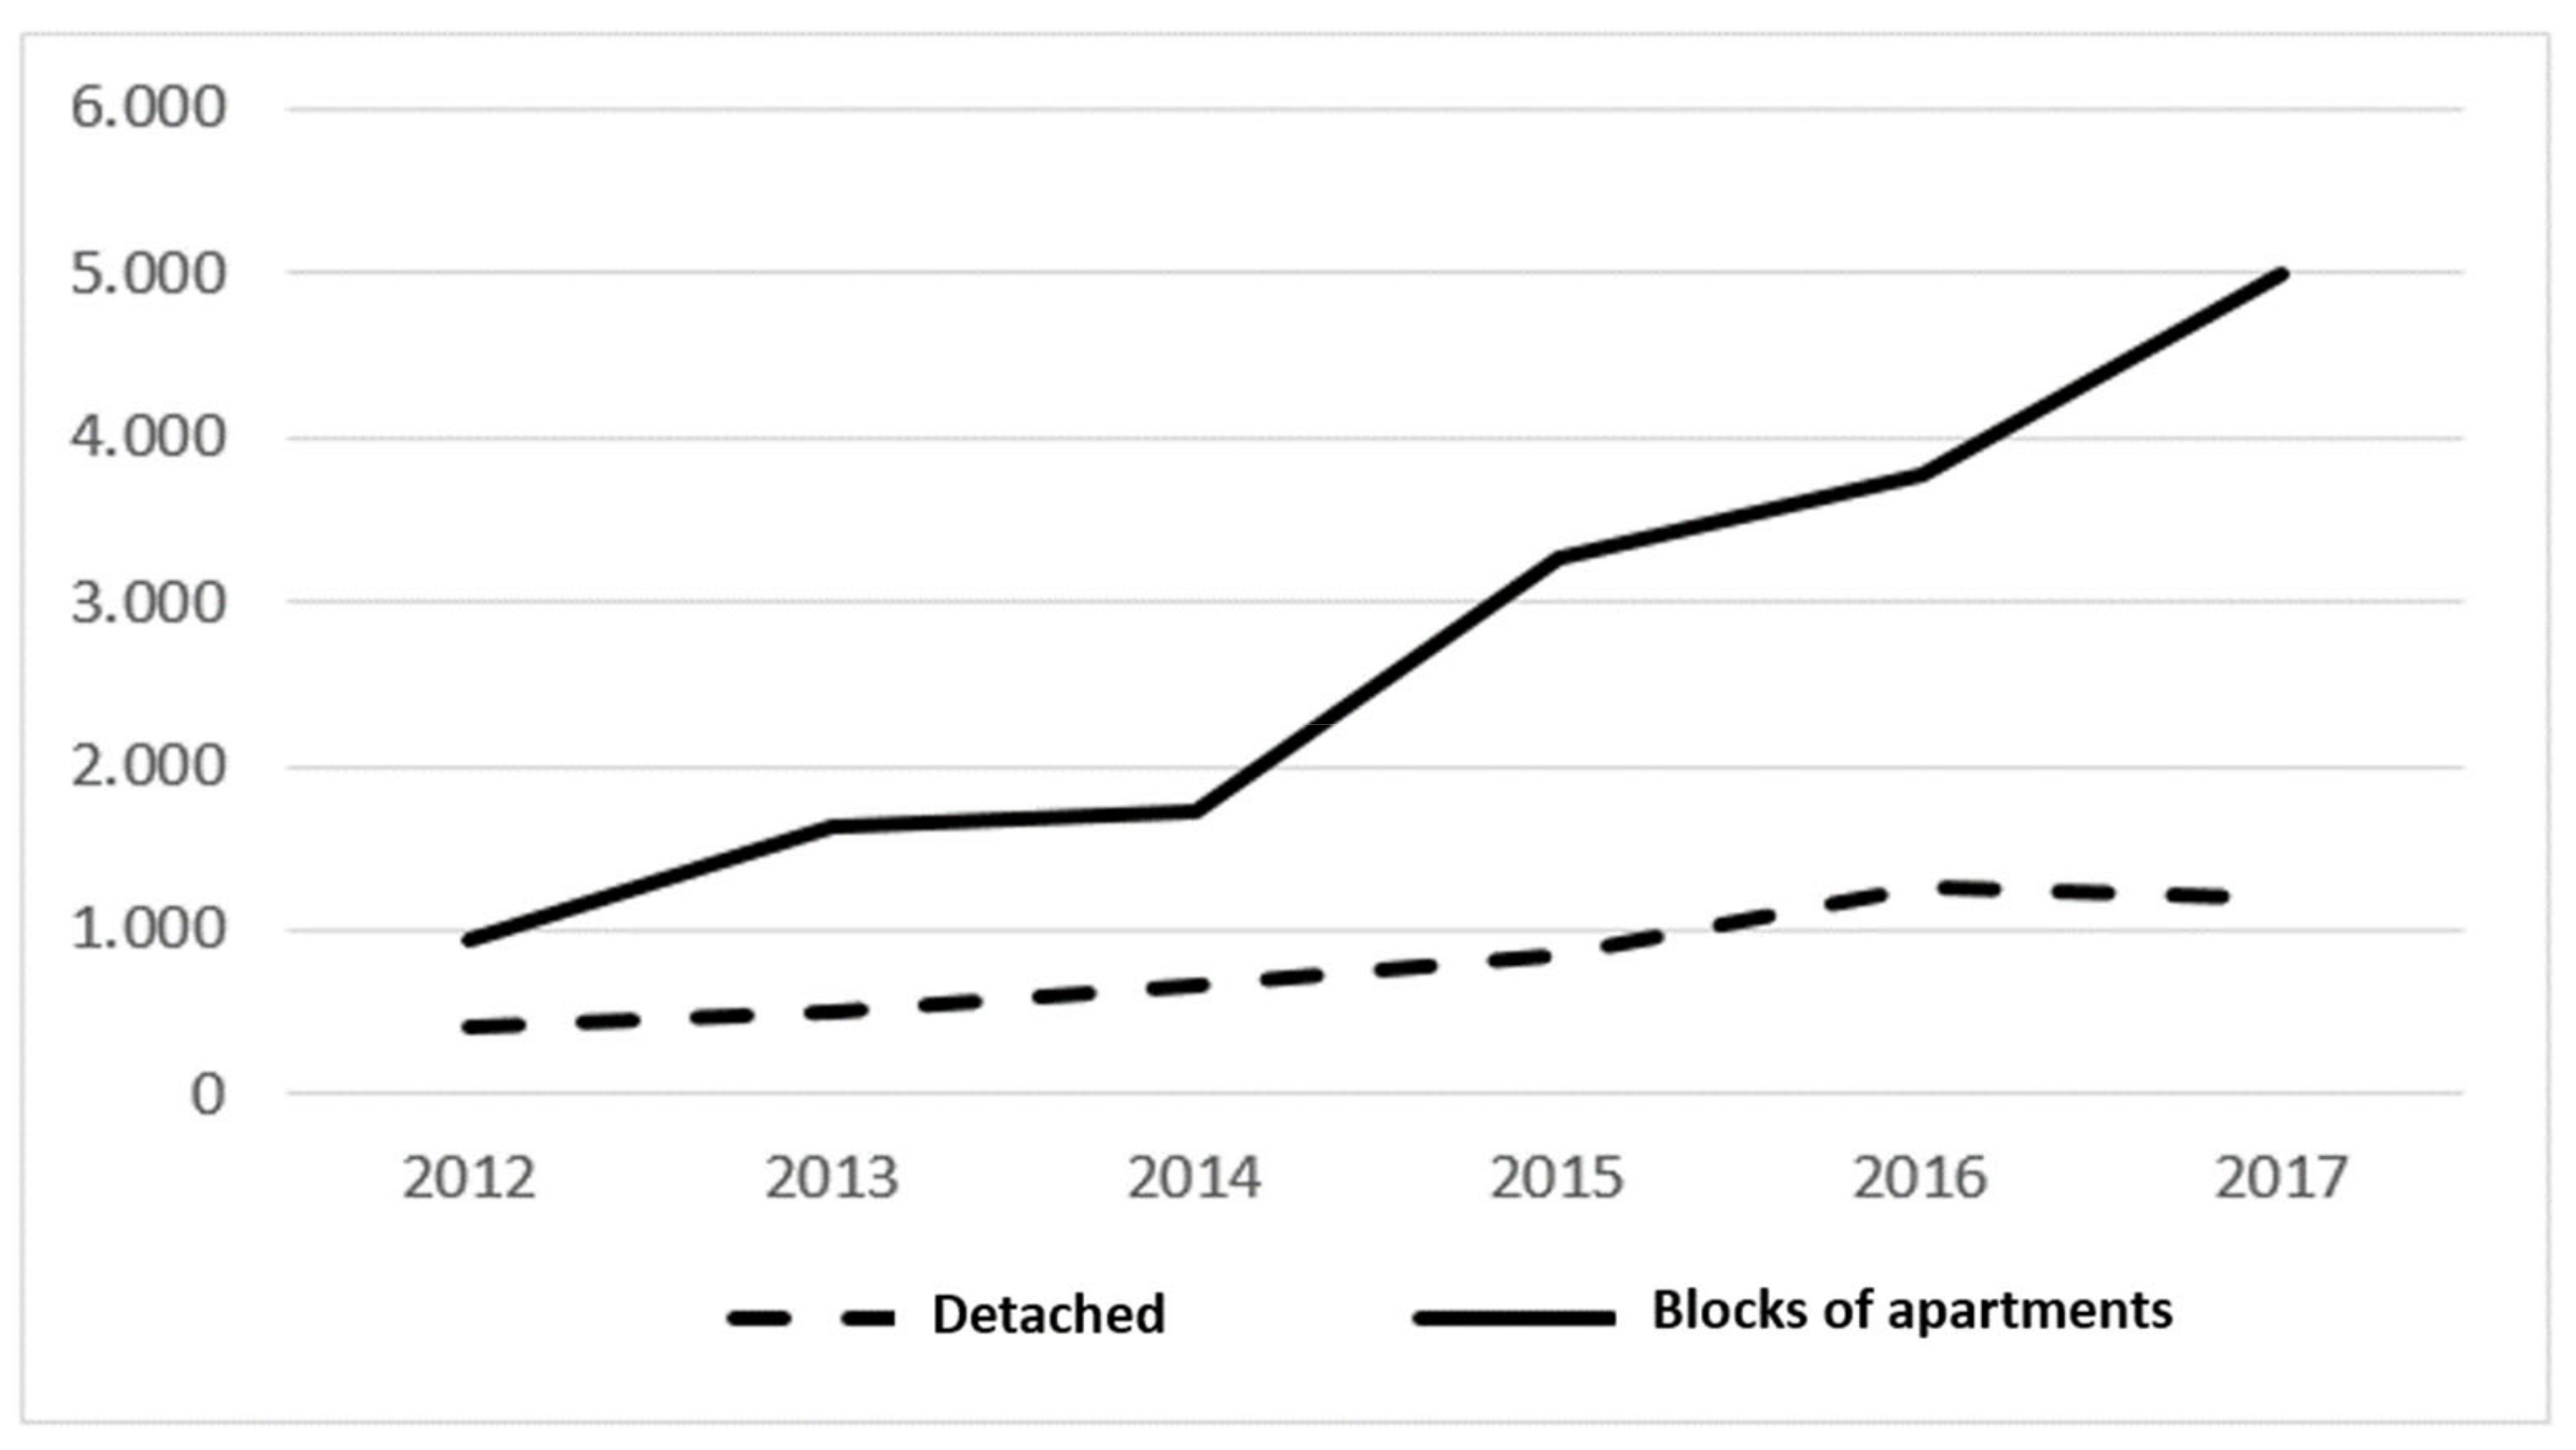
  49. Morote, Á.F.; Hernández, M.; Rico, A.M. Causes of Domestic Water Consumption Trends in the City of Alicante: Exploring the Links between the Housing Bubble, the Types of Housing and the Socio-Economic Factors. Water 2016, 8, 374. [Google Scholar] [CrossRef]
  50. Baños, C.J.; Vera, J.F.; Díez, D. El abastecimiento de agua en los espacios y destinos turísticos de Alicante y Murcia (Water supply in tourist spaces and destinations of Alicante and Murcia). Investig. Geográficas 2010, 51, 81–105. [Google Scholar]
  51. March, H.; Morote Álvaro, F.; Rico, A.M.; Saurí, D. Household Smart Water Metering in Spain: Insights from the Experience of Remote Meter Reading in Alicante. Sustainability 2017, 9, 582. [Google Scholar] [CrossRef]
  52. Yoon, H.; Saurí, D.; Amorós, A.M.R.; Amorós, A.R. Shifting Scarcities? The Energy Intensity of Water Supply Alternatives in the Mass Tourist Resort of Benidorm, Spain. Sustainability 2018, 10, 824. [Google Scholar] [CrossRef]
  53. Gabarda-Mallorquí, A.; Garcia, X.; Ribas, A.; Palom, A.R. Mass tourism and water efficiency in the hotel industry: A case study. Int. J. Hosp. Manag. 2017, 61, 82–93. [Google Scholar] [CrossRef]
  54. Hof, A.; Blázquez-Salom, M.; Garau, J.M. Domestic urban water rate structure and water prices in Mallorca, Balearic Islands. BAGE 2018, 77, 52–79. [Google Scholar] [CrossRef]
  55. Hof, A.; Blázquez, M.; Colom, M.C.; Périz, A.B. Challenges and Solutions for Urban-Tourist Water Supply on Mediterranean Tourist Islands: The Case of Majorca, Spain. In The Global Water System in the Anthropocene; Bhaduri, A., Bogardi, J., Leentvaar, J., Marx, S., Eds.; Springer Water. Springer Cham: Heidelberg, Germany, 2014. [Google Scholar]
  56. OSE & Greenpeace España. A Toda Costa. Análisis de la Evolución y Estado de Conservación de los Bienes y Servicios que Proporcionan las Costas (At all costs. Analysis of the evolution and conservation status of the goods and services provided by the coasts). 2018. Available online: https://es.greenpeace.org/es/sala-de-prensa/informes/a-toda-costa/ (accessed on 17 February 2019).
  57. Ministerio de Fomento. Database. 2017. Available online: https://www.fomento.gob.es/informacion-para-el-ciudadano/informacion-estadistica/vivienda-y-actuaciones-urbanas/estadisticas/vivienda-y-suelo (accessed on 22 April 2019).
  58. March, H.; Saurí, D. When sustainable may not mean just: A critical interpretation of urban water consumption decline in Barcelona. Local Environ. 2017, 22, 523–535. [Google Scholar] [CrossRef]
  59. Baldino, N.; Saurí, D. Characterizig the recent decline of water consumption in italien cities. Investig. Geográficas 2018, 69, 9–21. [Google Scholar]
  60. Saurí, D. The decline of water consumption in Spanish cities: structural and contingent factors. Int. J. Water Resour. Dev. 2019. [Google Scholar] [CrossRef]
  61. Rico, A.M.; Arahuetes, A.; Morote, A.F. Depuración y Reutilización de Aguas Residuales Regeneradas en las Regiones de Murcia y Valencia. In Paisaje, Cultura Territorial y Vivencia de la Geografía. Libro Homenaje al Profesor Alfredo Morales Gil; Vera, J.F., Olcina, J., Hernández, M., Eds.; Servicio de Publicaciones de la Universidad de Alicante: Alicante, Spain, 2016; pp. 1169–1202. [Google Scholar]
  62. Swyngedow, E. From Spain’s hydro-deadlock to the desalination fix. Water Int. 2016, 41, 54–73. [Google Scholar] [CrossRef]
  63. March, H.; Saurí, D.; Rico-Amorós, A.M. The end of scarcity? Water desalination as the new cornucopia for Mediterranean Spain. J. Hydrol. 2014, 519, 2642–2651. [Google Scholar] [CrossRef] [Green Version]
  64. Feitelson, E.; Rosenthal, G. Desalination, space and power: The ramifications of Israel’s changing water geography. Geoforum 2012, 43, 272–284. [Google Scholar] [CrossRef]
  65. McEvoy, J. Desalination and Water Security: The Promise and Perils of a Technological Fix to the Water Crisis in Baja California Sur, Mexico. Water Altern. 2014, 7, 518–541. [Google Scholar]
  66. Fragkou, M.C.; McEvoy, J. Trust matters: Why augmenting water supplies via desalination may not overcome perceptual water scarcity. Desalination 2016, 397, 1–8. [Google Scholar] [CrossRef] [Green Version]
  67. Gössling, S.; Hall, C.M.; Peeters, P.; Scott, D. The future of tourism: A climate change mitigation perspective. Tour. Recreat. Res. 2010, 35, 119–130. [Google Scholar]
  68. Valdes-Abellan, J.; Pardo, M.; Tenza-Abril, A.J.; Valdes-Abellan, J.; Tenza-Abril, A. Observed precipitation trend changes in the western Mediterranean region. Int. J. Clim. 2017, 37, 1285–1296. [Google Scholar] [CrossRef]
  69. Agencia Estatal de Meteorología (AEMET). Proyecciones Climáticas Para el Siglo XXI en España (Climate projections for the XXI Century). 2017. Available online: http://www.aemet.es/es/serviciosclimaticos/cambio_climat (accessed on 1 June 2018).
  70. CEDEX. Evaluación del Impacto del Cambio Climático en los Recursos Hídricos y Sequías en España (Evaluation of the impact of climate change on water resources and droughts in Spain); Ministerio de Agricultura y Pesca, Alimentación y Medio Ambiente y Ministerio de Fomento: Madrid, Spain, 2017; p. 346. [Google Scholar]
  71. Gikas, P.; Tchobanoglous, G. Sustainable use of water in the Aegean Islands. J. Environ. Manag. 2009, 90, 2601–2611. [Google Scholar] [CrossRef]
  72. Hall, C.M. Economic Greenwash: On the Absurdity of Tourism and Green Growth. In Tourism in the Green Economy; Reddy, M., Wilkes, K., Eds.; Earthscan: London, UK, 2015; pp. 1–18. [Google Scholar]
Figure 1. Location of the study area. Source: Own elaboration.
Sustainability 11 04494 g001
Figure 2. Tourism specialisation index. Own elaboration using data [25,38,39].
Sustainability 11 04494 g002
Figure 3. Percentage of habitual residences. Own elaboration using data [38].
Sustainability 11 04494 g003
Figure 4. Residential function index (RFI). Own elaboration using data [38,39].
Sustainability 11 04494 g004
Figure 5. Water consumption and overnight stays (2002–2017). Source: Own elaboration using data [25,35,36,37].
Sustainability 11 04494 g005
Figure 6. Number of new property constructions approved in the province of Alicante. Source: [45].
Sustainability 11 04494 g006
Figure 7. Volume (m3) distributed by the Mancomunidad de los Canales del Taibilla (2002–2017). Source: Own elaboration using data [35,36].
Sustainability 11 04494 g007
Figure 8. New residential properties in the province of Alicante, according to property type (2012–2017). Source: Own elaboration using data from [57].
Sustainability 11 04494 g008
Table 1. Regulated accommodation supply (2017).
Hotel BedsCampsitesRegulated Apartments Tourism Specialisation Index
Alfaz del Pi209827567910.498
Altea1298112549870.340
Benidorm41,09612,72925,8421.192
La Nucia008370.133
Finestrat53315531440.207
Villajoyosa682110741960.178
Santa Pola381136556080.236
Guardamar del Segura1615125718490.321
Torrevieja177276111,4080.167
Rojales226013010.094
San Fulgencio01564750.083
Orihuela836011,1440.157
Pilar de la Horadada07189990.081
Total/Average50,53719,64878,5810.358
Provincial total/Average69,55431,001175,3400.150
Source: Own elaboration using data [25,38,39].
Table 2. Indicators of residential tourism specialisation.
No. Properties% Habitual ResidencesPopulation
2017
FRI 2017
Alfaz del Pi12,40568.7618,3940.67
Altea16,43055.2921,8130.75
Benidorm58,01048.1166,8310.87
La Nucia 877075.5462921.39
Finestrat563551.2818,5480.30
Villajoyosa24,08554.3533,6070.71
Santa Pola43,86531.7131,1371.41
Guardamar del Segura22,26529.5514,7161.51
Torrevieja122,32532.5883,2521.47
Rojales14,26060.6216,2310.88
San Fulgencio866051.7976461.13
Orihuela69,48544.6476,0970.91
Pilar de la Horadada22,66036.9621,2021.07
Total/Average428,85542.20415,7661.03
Provincial total/Average1,274,09657.951,838,8190.69
Source: Own elaboration using data [38,39].
Table 3. Water use per property type and spatial model of the town (2015).
TownAverage Consumption Per Property
(m3/year)
% Performance (Efficiency) Drinking Water Network
Benidorm18295%
Alfaz del Pí71075%
Torrevieja28494%
Source: Refs. [48,49].
Table 4. Basic features of the drinking water supply systems on the coast of Alicante.
Sphere of ActionBackground & Characteristics
North coast
Consorcio de Aguas de la Marina Baja (1977)
Municipalities (7)
Population supplied (2017): 177,433 inhabitants which may rise to 700,000 in summer.
Functioning system operational and very efficient
  • System configured for the joint and flexible use of surface, ground and reclaimed water.
  • System based on agreements between farmers and consortium.
  • The emergency Rabasa-Fenollar pipeline enables transportation water from the Mancomunidad de los Canales del Taibilla and from the desalination plant at Muchamiel. Operational during the droughts of 1999–2002 and 2015–2016.
Central and south coast
Mancomunidad de los Canales del Taibilla (1927)
Municipalities (Total 79, Alicante 35)
Total population supplied (2017): 2.5 million inhabitants, rising to 3.5 million in summer.
Alicante has 1.1 million inhabitants, rising to 1.8 million in summer.
Functioning system operational and very efficient
  • Without its management model, the urban-tourism development of this coastal sector would not have been possible.
  • Constitutes one of the largest hydraulic complexes in Spain for the supply of drinking water with a capacity of 341 hm3/year.
  • Diversification of supply sources to manage droughts, based on the use of desalination (160 hm3/year); Tagus-Segura transfer (110 hm3/year), and River Taibilla (70 hm3/year).
Source: Own elaboration using data [35,36,37].
Table 5. Optimisation of resources in tourist accommodation units.
Hotels
  • Introduction of more efficient water-saving measures in hotel rooms and facilities
  • Awareness programmes for employees and clients
  • Outsourcing of services with high levels of consumption (laundry)
  • Gardens with local plants that require little water
  • Closed circuits in swimming pool purification
  • Systems for reduction of losses in low season
Apartments
  • Installation of individual meters, saving devices (mixer taps, aerators, ECO domestic appliances)
  • Environmental awareness
  • New tariffs
Detached Houses
  • Installation of individual meters and saving devices (mixer taps, aerators, ECO domestic appliances)
  • Environmental awareness
  • New tariffs
  • Installation of saving systems in gardens (drip irrigation)
  • Savings in swimming pool water (reduction of evapotranspiration, re-use of water)
Source: Own elaboration based on survey to hotel managers and maintenance technicians. [40].
Table 6. Water policy actions. Supply guarantee and optimisation of resources.
Raw water
(Consorcio de Aguas de la Marina Baja and/or MCT)
  • Regulation of reservoirs
  • Use and management of aquifers
  • Use of treated water
  • Connection between different systems of wholesale distribution
  • Incorporation of desalinated waters
  • Agreements with irrigators: exchange of drinking water for treated and reclaimed water
Drinking water. Integrated water cycle at destination
(HIDRAQUA)
  • Use of reclaimed water (watering of parks, gardens, vegetable gardens, golf courses)
  • Increased efficiency: sectorisation of the network, remote control systems, installation of individual smarts meters.
Source: Own elaboration based on survey with engineers and managers of raw water and drinking water utilities. [35,36,37].

