Article

Reducing Edible Oil Import Dependency in Tanzania: A Computable General Equilibrium CGE Approach

by
Charles Peter Mgeni
1,2,*,
Klaus Müller
1,2 and
Stefan Sieber
1,2
1
Department of Agricultural Economics, Humboldt University of Berlin, Rudower Chaussee 16, 10099 Berlin, Germany
2
SusLAND: Sustainable Land Use in Developing Countries, Leibniz Centre for Agricultural Landscape Research (ZALF e. V), Eberswalder Str. 84, 15374 Müncheberg, Germany
*
Author to whom correspondence should be addressed.
Sustainability 2019, 11(16), 4480; https://doi.org/10.3390/su11164480
Submission received: 26 July 2019 / Revised: 15 August 2019 / Accepted: 16 August 2019 / Published: 19 August 2019
(This article belongs to the Section Economic and Business Aspects of Sustainability)

Abstract

:
Reducing food imports and promoting domestically produced food commodities are long-standing goals for policymakers and other stakeholders in sub-Saharan African countries. For instance, Tanzania, after a long period of dependency on imported food commodities, such as sugar and edible oils, intends to meet its demand for these commodities through domestic production by transforming its agriculture sector to achieve this goal. Applying a general computable equilibrium (CGE) model, this study determines the multiplier effects of technological progress that is assumed to foster domestic edible oilseed crop production, other crops, and Tanzania’s economy in general. Findings from the model establish an increase in domestic production not only for the edible oilseed crops but also for other commodities from other sectors of the economy. In addition, there is a decrease in prices on domestically produced commodities sold in the domestic market, and an increase in disposable income is predicted for all rural and urban households, as well as government revenues. Based on model results, we recommend that the Tanzanian government invests in technological progress and interventions that increase production in sectors such as agriculture, where it has a comparative advantage. Interventions that increase smallholder farmer’s production, such as the use of improved seed and other modern technologies that reduce costs of production, are critical for reducing food imports and improving food security.

1. Introduction

Tanzania, after a long-standing dependency on imports for major food commodities, such as sugar and edible oils, intends to transform its agriculture sector to a level that meets local demand for food commodities through domestic production [1]. The agriculture transformation is seen as a crucial strategy for poverty reduction in Tanzania, considering that about 65% of the population is engaged in this sector [1,2]. Moreover, in Tanzania, the agricultural sector provides raw materials for the industrial sector [1,2,3]. Therefore, any transformation strategy that results in an increase in agricultural output is vital for feeding its growing population and meeting demand from the industrial sector. Additionally, it is expected that the increase in agricultural output will have wide multiplier effects on other economic sectors in the country.
Among the Tanzanian government initiatives aimed at revitalizing the agriculture sector is the perpetuation of the phased-out Agriculture Sector Development Program I (ASPD I) through the newly launched Agriculture Sector Development Program II (ASDP II), established in 2018. The main goal of both the former ASDP I and the current ASDP II is to revitalize the agriculture sector such that it increases both output and its contribution to the Tanzanian economy (United Republic of Tanzania (URT) [4]). This initiative is based on the economic policy theory of import substitution industrialization that advocates promoting domestic production such that it replaces imports, thus reducing foreign dependency and creating self-sufficient economies in the long-run [5,6,7,8,9,10]. To achieve the intended goal, many areas of intervention have been identified, including the improvement of production techniques, development of market infrastructure, training farmers to identify markets and value addition at the farm level, and supporting financial deepening among agricultural sector stakeholders [1,4]. All of these areas are poorly or under-developed, resulting in poor agricultural production and growth in the country [4].
Along with the identified areas of interventions and within the agricultural crops sub-sector, several strategic crops have been identified, including edible oilseeds. The choice of edible oilseed crops is supported by the fact that Tanzania’s large national demand for edible oil requires imports to meet about 60% of demand [1,11]. The demand for imported edible oils is increasing, resulting in about US$294 billion of foreign currency reserves being spent annually [1,11,12]. Further, Tanzania has diverse agroecological zones that are suitable for producing edible oilseed crops. The edible oilseed crops that can be grown in these agroecological zones include cotton, sunflower, palm, groundnuts, soya bean, and sesame. Consequently, the United Republic of Tanzania [1] determined that the edible oil sub-sector is a priority sub-sector. It invites both local and foreign investors to create not only jobs but also increase domestic edible oil production and processing, ultimately reducing dependency on imports.
Although the edible oil sub-sector, especially regarding sunflower oil, shows promise both in terms of seed production and processing, it still faces daunting challenges in realizing its full potential. These challenges include the availability of improved seeds, limited financial support, land-competition with maize, and stiff competition for the domestically produced edible oils from imports. For instance, farmers complain that the available hybrid seeds are sold at high prices because they are imported, while if such seeds were produced domestically, it could lower seed prices. Lowering prices and increasing the availability of hybrid seeds could result in lower-cost production and increased yield [13,14,15,16]. Thus, when production cost is minimized and yield is increased, then domestically produced edible oils become competitive with imports [12,13,17].
Studies on the use of improved seeds and agronomic practices for edible oilseed production show a tremendous increase in yields using minimum inputs [18,19,20,21]. For instance, a study by [20] reports that the use of fertilizer micro-dosing and tied-ridge technologies in the semi-arid environments in Tanzania show a yield increase of up to 400 percent per hectare for edible oil crops. According to [22], farmers producing sunflower using traditional varieties obtained 485 to 815 kg per hectare, while those using improved varieties obtained from 1950 to 2435 kg per hectare. This indicates that using improved seeds increases output 4 to 5 times more than that of traditional seeds.
In addition, to ensure the sustainability of the edible oil sub-sector, the use of improved seeds, inputs, and appropriate agronomic practices should be coupled with assured markets for the edible oil products. For instance, [23,24] argue that contract farming increases production for farmers producing both cotton and sunflower due to the assurance of markets for their products. However, these interventions cannot be achieved by farmers alone, and indeed deliberate government interventions are needed to facilitate the process [18,24]. The government has been imposing a tariff on imported edible oils at increasing rates, going from 10% in 2016 to 35% in 2018, which is considered an import substitution strategy aiming to protect and foster domestic production of edible oils [13]. Conversely, findings from studies by [9,13,17] indicate that tariff interventions did not yield the intended outcomes, as instead of promoting domestic production, they caused price escalation of edible oils in domestic markets. The previous studies highlighted above concentrated on the effects of various interventions on improving edible oil sub-sector production. There is a paucity of evidence on the multiplier effects of improving edible oil production on other sectors of the economy, an information gap that this study addresses.
By applying a computable general equilibrium model (CGE) as an ex ante evaluation approach, the light will be shed on the multiplier effects of the intervention on the edible oil sub-sector. By disaggregating the edible oil sub-sector from the agricultural sector and other sectors, it is possible to evaluate its multiplier effects on Tanzania’s economy following production increases. The study considers the hypothesis that an increase in edible oil production could improve domestically produced edible oils and reduce imports. The research questions are as follows. To what extent does an increase in production promote supply of domestic edible oil and other sectors commodities? What are the effects of increasing edible oil production to the Tanzania’s economy? Hence, to address this question, macroeconomic-specific indicator effects, such as the change in the gross domestic product (GDP), imports, exports, and commodity prices, are compared among the disaggregated sectors in response to the increase in edible oil sub-sector production.

2. Data and Methodology

2.1. Data

This study uses the 2015 Tanzania social accounting matrix (SAM) data developed by the International Food Policy Research Institute [25]. The 2015 SAM data is used as base year data to describe various sectors of the economy in Tanzania. The original 2015 SAM data is disaggregated into sixty-eight sectors and seventy commodities; however, for the purpose of this study, the SAM is aggregated into agriculture, industry, and services as the major economic sectors. Each major sector is further decomposed into sub-sectors. For instance, the agricultural sector is composed of cereals, oilseeds, roots and tubers, cotton, tobacco, tea, sisal, sugar, fruits and vegetables, other crops, fishery, forestry, and livestock sub-sectors. The industry sector consists of mining and gas, food processing, beverages, textiles, wood processing, chemical manufacturing, petroleum, and other manufacturing. The service sector comprises utilities (water and electricity), construction, trade, hotel and restaurants, transportation, real estates, public administration, and private services.
Furthermore, we broadly categorize the factors into labor, capital, and land, from which labor is further disaggregated into rural unskilled, rural skilled, urban unskilled, and urban skilled, while capital is disaggregated with respect to sectors (agricultural, industrial, and service). In addition, we consider an open economy where four agents are actively involved: the government, firms, households, and the rest of the world. To analyze how the increase in edible oil production impacts different categories of households, the households agent is further disaggregated into rural poor, rural attaining basic needs, rural uneducated, rural have completed primary education, rural have not completed secondary education, rural have completed secondary education, urban poor, urban attaining basic needs, urban uneducated, urban have completed primary school education, urban have not completed secondary education, and urban have completed secondary education. Moreover, the model requires exogenous data for calibration, including income, trade, and substitution elasticities, so that it can reproduce the base year economic situation in the economy before introducing the interventions [17,26]. We adopt the method used by [17] to obtain these elasticities, using elasticities from [17,27] in this study.

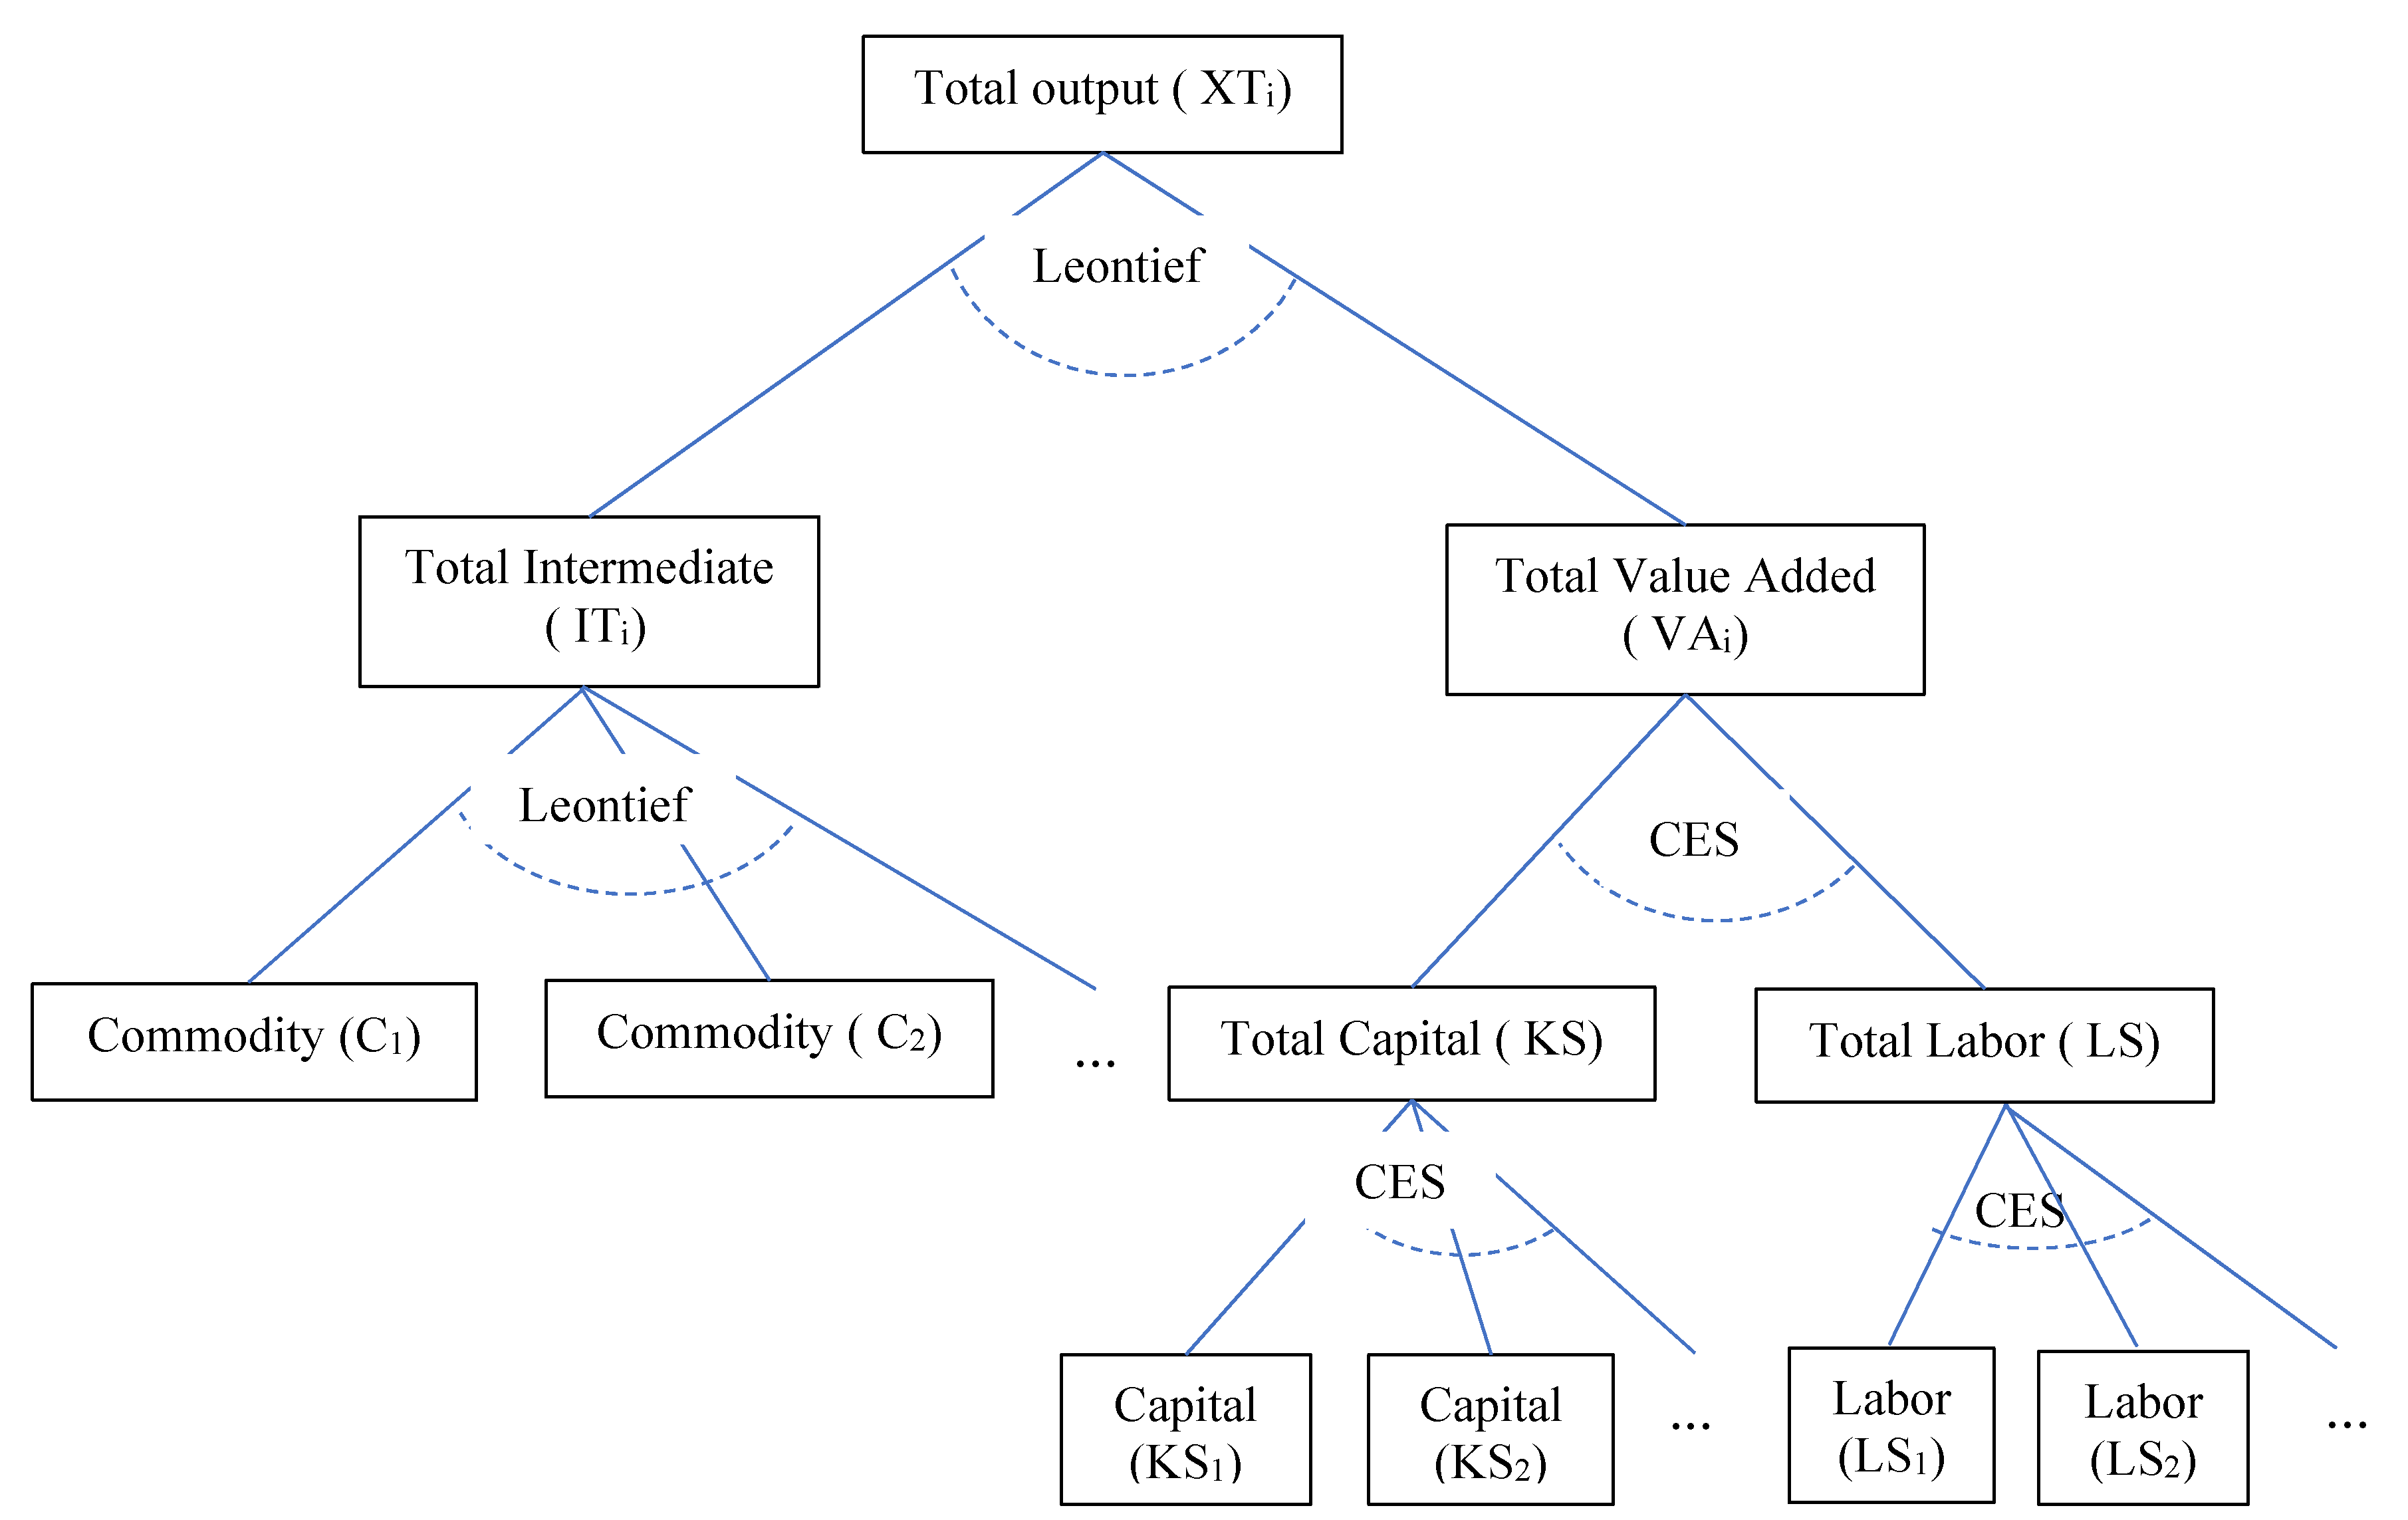
2.2. Model Description

As mentioned in the SAM description, in the model, we consider three main sectors: agriculture, industry, and service. It is expected that the government’s policy intervention will impact these sectors, manifested by the agents (government, households, firms, and the rest of the world) in the economy. The impact is considered in terms of production, consumption, income, and employment (labor demand). Therefore, this study uses a static standard CGE framework to describe the Tanzanian edible oil production components in the CGE. In this section we present the equations, where changes and assumptions reflect increases in production in the model; the full description of the equation blocks for the CGE model is presented in Appendix A (Table A2) attached to this paper. This model of Tanzania assumes a small open economy where the households maximize a nested-linear expenditure system (LES) utility function on commodities either produced domestically or imported from outside the country. These commodities are used in production and consumption. Factors used in production are capital and labor, which are combined using a constant elasticity substitution (CES) aggregator function (Equation (1)) to form the value-added input (Equation (2)).
V A i = α i V A [ δ i V A L D i p V A + ( 1 δ i V A ) K D i p i V A ] 1 / p i V A
V A i = v i X T i
where
  • VAi = Value added for each sector commodity
  • α i V A = Constant elasticity of substitution (CES) value added scale parameter,
  • δ i V A = CES value added share parameter,
  • ρ i V A = CES value added elasticity parameter: −1 < ρ i V A   < .
  • LDi = Labor demand for each sector commodity
  • KDi = Capital demand for each sector commodity
  • vi = coefficient Leontief of the value-added,
  • XTi = Total aggregate output for each sector commodity
The intermediate commodities combine through a Leontief aggregator function forming the intermediate inputs (Equation (3)).
Q I N T i = i o i X T i
where
  • QINTi = Intermediate inputs for each sector commodity
  • i o i = Leontief Intermediated commodity consumption coefficient
  • XTi = Total output of sector commodity.
The value-added and intermediate aggregate inputs are used by firms in the production process and combine through a Leontief technology aggregator function to form the domestic produced commodities (Equation (4)).
X T i = α i a · [ γ i a V A i p i a + ( 1 γ i a ) · Q I N T i p i a ] 1 / p i a . a A C E T
where
  • a A C E T = a set of activities for a commodity with a constant elasticity of transformation (CET) function at the top of the technology nest,
  • XTi = Total output of sector commodity,
  • VAi = Value-added for sector commodity,
  • QINTi = Intermediate inputs for each sector commodity,
  • α i a = Efficiency parameter in the CET activity function,
    γ i a = CET activity function share parameter, and
  • ρ i a = CET activity function exponent.
Also, a schematic description of the nested structure of the production is presented in Figure 1.
Moreover, in this model we assume a small open economy, where the commodities consumed and produced in Tanzania are from imports (Mi) and domestic production (XDDi), respectively. Consequently, commodities will differ with respect to their destination—they can be sold to either the domestic or export markets. The commodities sold on the domestic market will also differ in price depending on their origins, being either produced domestically or imported. Moreover, the strategy to increase production will not only improve food security but also promote industrialization through the provision of raw materials required by the industrial sector. This is assumed to influence capital, technology, and product inflow from outside the country, which is observed through payments from the rest of the world for imports and exports, as well as through changes to the domestic economy expenditures over the given period. In addition, we adopt macroeconomic closure rules, where the exchange rate is a numeraire. Further, we assume flexible mobility of capital and labor among sectors, which are exogenously fixed, non-tradeable, and are fixed at the household level, while the intermediate commodity inputs are tradeable but not substitutable in the production process. Government expenditures, saving-investment balances, and public sector investment are assumed to be fixed for the simulation. Therefore, the model comprises four blocks of equations: production, prices, income, and markets equilibrium. The parameters, variables, and equations are presented in Appendix A.

2.3. Scenario Description

As noted by [1,17,22], the use of improved technologies in the production of edible oilseeds, such as sunflower, results in yields increasing up to five times. Such an increase in production, which increases output and ultimately increases household income, can enable a sustainable reduction in poverty, reduce unemployment, and reduce other societal problems [28,29]. This raises a question—what are the multiplier effects in an economy when a sector experiences an increase in productivity? Therefore, in the model, we assume that the Tanzanian government chose a strategy for investing in technological progress that improves edible oil production by supporting the availability of seeds and processing technologies. Thus, there is a gradual increase in output by 50% from the base year output in 2015. Therefore, the model is first calibrated at the base year to mimic the economic structure of Tanzania’s 2015 SAM. Thereafter, a counterfactual simulation is run assuming that gradual technological progress takes place following the government’s intervention that helps Tanzanian farmers acquire improved seeds and trains them on the use of proper agronomic practices. In addition, import taxes are removed from imported processing equipment. Therefore, these interventions trigger technological progress in the edible oil sub-sector, increasing production. Generally, the parameters in the equations of the CGE model describe the behavior of the agents in terms of production technology as well as the structure of consumption and markets. Thus, a 50% rise in output is introduced in the efficient technology parameter in Equation (4), assuming an increase in production in the edible oilseed sector (Equation (5)).
α i t i m p a = α i a · [ 1 + t i m p ]
where
  • α i t i m p a = Efficiency parameter in the total output after technological progress,
  • α i a = Initial efficiency parameter in the total output,
  • t i m p = Percentage change in the efficiency parameter.
Hence, percentage changes in the macroeconomic variables hypothesized for this study are compared to the base period for the counterfactual simulation that is predicted by the model. It is expected that the feedback effects of the shock are observable not only in the edible oil sub-sector but also other sectors of the economy. It is hypothesized that the transmission of the shock, triggering a rise in production for the edible oil sub-sector, will lead to an increase in the supply of domestically produced edible oils. The increased supply, in turn, causes a decrease in prices of domestically produced edible oils, with consumers starting to purchase more of the cheap domestically produced edible oils. At the same time, suppliers are motivated to supply to export markets as a result of the increase in export prices relative to the domestic markets. Moreover, an increase in demand for domestically produced commodities leads to a decrease in imported commodities.
An increase in production is also expected to impact the income of economic agents (households, firms, government, and the rest of the world). Households depend on labor, capital returns, as well as transfers from the government, firms, and the rest of the world. Therefore, improving the edible oil sub-sector results in increasing demand for labor and capital, which results in increased household income. Government revenue is expected to increase as a consequence of the increase in revenue collection from direct taxes, indirect (sales) taxes, production taxes, import taxes, export taxes, and other corporate taxes. The increase in income for these economic agents leads to an increase in savings, which subsequently could drive investment, not only in the edible oil sub-sector but also in other sectors in the economy.

3. Results and Discussion

3.1. Multiplier Effects on Commodity Production

Results of the model, shown in Table 1, generally predict an increase in domestic production across all three major sectors: agriculture (25.10%), industry (5.48%), and service (1.95%). Specifically, the model predicts the greatest increase in production for the agricultural sector, followed by the industry sector, and lastly the service sector. This implies that the interventions impacting the domestic production of agricultural commodities subsequently increase the supply of raw materials to the industrial sector. In particular, results from the model indicate an increase in commodities from the industrial sectors that are related to the agricultural sector, such as food processing, beverages, and clothing. In addition, an increase in production in the services sector, consisting of utilities, construction, trade, hotel and restaurants, and real estate, is predicted. Conversely, a decline in production is predicted for some industrial commodities, such as mining and gas, wood products, chemicals, petroleum, and other manufacturing. The improvement in edible oilseed sector productivity in turn stimulates the production of other agricultural commodities and supplies of raw materials to the agro-related industries and services. The increase in supplies of raw materials from the agricultural sector to the agro-related industries and services leads to the reallocation of factors of production toward the agro-related industries and services, causing a decline in the production of non-agro-related industries and services. Similarly, an increase in agricultural commodity production positively affects industrialization, as it provides not only raw materials for the industry but also food for the industrial workforce [30,31,32,33,34]. This indicates interventions geared toward an increase in production, if they are sustained, could help the country produce at self-sufficient levels, thus reducing edible oil imports. This highlights that Tanzania, as the second-largest edible oilseed producer in Africa, has the potential to produce edible oils at a level that could not only fulfill domestic demand, but also result in exporting the surplus to neighboring countries [13]. Thus, instead of relying on traditional cash crops, such as tobacco, sisal, and tea, as sources of income for farmers, edible oilseed crops can be used as alternative cash crops in light of interventions that support increases in their output.
Moreover, results indicate an increase in domestic commodity production in the industrial sector, with a notable increase in the food processing sub-sector, which as mentioned earlier could result from the increase in raw material supplies from the agricultural sector. However, the model predicts a decrease in production for wood products, chemicals, and other manufacturing sectors. Similar reasoning holds for wood products, in particular; people are involved in selling wood products if there are no attractive alternative income sources. In this case, many individuals would switch to the edible oilseed sub-sector and other crops. Similarly, an increase in the provision of services is predicted in almost all service sub-sectors, except for a slight decrease predicted for the transportation sub-sector. A reason for the decrease in transportation is due to the decrease in imported edible oils that need to be transported to various markets around Tanzania.

3.2. The Effects of Increased Production on Commodity Prices

Table 1 shows the model prediction for the impact of increasing production in the edible oilseed sub-sector on the prices for the domestic and import markets. As the interventions affect the edible oilseed sub-sector, the model predicts a decrease in prices for edible oilseed in domestic markets. In addition, a decrease in prices is predicted for other agricultural commodities. This implies that the improvement in production results in increased domestically produced edible oilseed supply accompanied by an increase in other domestically produced commodities. The increase in domestic production of the other commodities leads to decreasing prices, which consequently result in increasing demand for domestically produced commodities. A fall in prices is also predicted in a study analyzing the policy options for supporting Kenyan agricultural growth [35]. In this study, a decrease in commodity prices is observed as a result of increasing production of agricultural commodities. Moreover, as the supply of domestically produced commodities increases in the domestic market, their prices become cheaper relative to imported commodities, as evidenced by model results predicting an increase in prices for all imported commodities. Furthermore, the model predicts an increase in domestic prices for industrial and services commodities. The increase in industrial commodity prices, such as mining and gas, wood products, chemicals, petroleum, and other manufacturing sectors, is aggravated by the decrease in domestic market supply, which is a result of the production decline. Similarly, an increase in domestic prices is predicted for service sector commodities, such as utilities, trade, hotels and restaurants, and real estate. These commodities are solely from domestic sources, thus the small changes in their production are insufficient for reducing prices relative to the agricultural sector commodities that are from both domestic and import sources. Similar findings indicate a corresponding rise in prices for industrial and service commodities that experience a small volume increase in production resulting from agricultural production improvement interventions [36,37].

3.3. The Effects of Increased Production on Domestically Produced Commodities Sales

Generally, the model predicts an increase in domestically produced commodity sales in the domestic agricultural (23.21%), industrial (6.03%), and services (3.53%) markets. For individual commodities, a large increase in domestic commodity sales is predicted for all agricultural sector commodities. This increase in sales for agricultural commodities is caused by an increase in domestic production and a decrease in domestic market prices. Similarly, findings from studies in Kenya, Burkina Faso, and Sudan indicate an increase in the sales of domestically produced commodities as a result of increased production [35,36,37,38,39].
Moreover, as noted earlier, the prices of imported commodities are relatively higher than those of domestically produced commodities. This situation raises real income for consumers, meaning they can buy more of the low-priced domestically produced commodities, hence the increase in domestic sales. Similarly, a decrease in sales for domestically produced industrial and service commodities, such as mining and gas, wood products, chemicals, in other manufacturing, and in other services, are predicted by the model. The decrease in domestic sales of wood products, chemicals, and in other manufacturing services is aggravated by both the decrease in their production from domestic sources and an increase in import prices.

3.4. The Effects of the Increase in Production on Import Commodities

The model predicts a decline of about 66% in imports of edible oilseeds. Similarly, for the other commodities in the agricultural sector, imports decrease. This implies that government interventions in the edible oilseeds sub-sector not only reduce imports for the targeted sub-sector, but also for other agricultural commodities. The increase in the supply of domestically produced edible oilseeds and other agricultural commodities causes importers to switch to importing commodities that have less supply than the agricultural commodities (Table 1). However, although one would expect a decrease in the import of agricultural- or industrial-related commodities, such as processed food, beverages, and clothing commodities, findings from the model indicate an increase in their imports. The reason is that the corresponding industrial sectors cannot adjust production quickly and reduce the amount supplied from the importation of these commodities. The government’s intention is to promote domestically produced edible oils, which in the long-term should result in a reduction in foreign currency reserve expenditures on imported edible oils. Similar findings show that increasing production of domestic commodities not only satisfies direct consumer demand but also supplies the raw materials demanded by agro-processing and extractive industries in developing countries [39,40]. Consequently, the increase in domestic output enables the commodity processing industries to achieve economies of scale in terms of quality, variety, and quantity, thus reducing the welfare losses that result from a fall in imports. Similarly, promoting the production of domestic commodities that support the expansion of agro-processing industries is an appropriate strategy for achieving industrialization for countries that rely on agriculture, such as Tanzania [1,2,3].

3.5. The Effects of the Increase in Production on Export Commodities

Results from the model, shown in Table 1, predict an increase in exports across the agricultural sector. The rise in exports for agricultural sector commodities is supported by the increase in their production. The increase in the supply of domestically produced edible oilseeds and agricultural commodities causes domestic market prices to decrease relative to export prices. The relatively high export market prices imply that it is more profitable for traders to sell to the export market, hence suppliers switch to export markets. This supports the findings that show that whenever the supply of domestically produced commodities increases in one sector of the economy, then in the short-term a decrease in exports is expected for other sectors, particularly the industrial and service sectors due to imbalances in domestic supply and demand [3,39,40,41,42,43,44]. This is the desired outcome—the increase in productivity for the target sector is geared toward fulfilling domestic demand, with a reduced focus on export markets. Similarly, in the long-term, when domestic demand is fulfilled by domestically produced commodities, the surplus from the industrial and services sectors can also be exported in exchange for the importation of capital and technologies that can further develop industrialization and economic welfare in general [45].

3.6. The Effects on Sector Capital Investment Demand

To achieve a 50% increase in production for the edible oil sub-sector, this has to go hand in hand with the increasing investment in capital for various sectors in the economy. Overall, the model predicts an increase of 37.6% in capital investment demand for all sectors (Table 2). A slight increase in capital investment demand is predicted for food commodities, which is aggravated by the fact that the increase in production increases the absorption of agricultural commodities, in turn increasing the capital investment demand in the food sector. Similarly, productivity growth in the agricultural sector leads to growth in capital investment demand for both agricultural and non-agricultural sectors in African countries [46]. This is in agreement with the conclusion that agricultural sector growth can stimulate equal growth in other non-agricultural sectors, meaning that growth in all sectors is significant in reducing poverty in developing countries [47,48,49]. It is well known that labor-intensive, large-scale manufacturing growth has failed to drive economic growth in many developing countries [50]. Investment in agriculture requires a large amount of both human and financial capital, such that the government has to collaborate with other development partners. Development partners play a significant role in supporting activities, such as the introduction of new technologies to farmers in rural areas that the government cannot reach through forms of government outreach [17]. Therefore, investing in the agricultural sector has significant positive effects in reducing poverty to a wide range of Tanzanian citizens.

3.7. The Effects of Increased Production on Household Income

In order to analyze the effects of improving production on various groups of Tanzanian citizens, households are categorized into two broad categories: rural and urban. The rural households were further divided into rural poor, rural attaining basic needs, rural uneducated, rural have completed primary education, rural have not completed secondary education, and rural have completed secondary education. A similar division is carried out for urban households. Findings from the model predict a general increase of about 15.42% in income for all household types, both rural and urban. This finding is in agreement with a study showing that of a 5% increase in technological progress for the agricultural sector resulted in a 0.6% increase in rural and urban household incomes in Botswana [51]. However, when looking at individual household types there is a slightly higher increase in income of about 16.07% in aggregate predicted for urban households compared to 15.1% for rural households. Moreover, the model predicts greater income gains for urban poor and rural households categorized as having not completed secondary education. A possible reason the incomes for these groups increase is related to their high dependence on labor income, the demand for which increases following the governmental support for technological progress, which increases the production of the edible oilseed sub-sector. This implies that technological support for edible oilseeds motivates farmers to increase production due to the increase in output for the domestically produced commodities, which in turn increase household incomes. A similar finding in a multiregional CGE model of Indian states indicates that increasing the outputs of agriculture-related industries leads to rising incomes for rural farming populations [52]. Overall, results predicted by the model suggest that technological progress that leads to increased productivity results in an aggregate increase in incomes across all household types. Similarly, it is argued that interventions in sectors such as agriculture, where developing countries have a comparative advantage, are critical for increasing the incomes and improving the livelihoods of rural and urban poor households [53]. Thus, interventions geared toward increasing production could help the government reduce income inequalities across Tanzania’s population. (Table 3).

3.8. The Effects of Increased Production on Government Revenues

Government revenues are collected from direct taxes, indirect (sales) taxes, production taxes, import taxes, and export taxes. The model results in Table 4 predict an increase in the government tax base following the increase in productivity. In addition, an increase in productivity leads to an increase in the gross domestic product (GDP). Similarly, an increase in agricultural production that expands the governmental tax base is the result of increases in outputs from the intended sector and its multiplier effects across other sectors of the economy [37,52,53,54,55]. This implies that investments in technological progress that lead to enhancing the level of production and outputs, particularly in the agricultural sector, are essential for economic growth. This highlights the increase in long-term productive capacity investment in the intended sectors. Similarly, increasing agricultural productivity enhances agricultural production, thus helping to improve food security and alleviate poverty in agriculturally based economies [36]. In addition, Tanzania, similar to most other developing countries, runs a budget deficit, such that it depends on development partners to support its annual budget. This is in line with the findings of the study on the contribution of aid to agriculture and economic growth in Africa, showing that the expansion and improvement of production in a sector where the country has a comparative advantage could lead to a reduction in foreign aid [15]. Likewise, technological progress leading to productivity improvement can be considered an import substitution strategy that can be adopted in developing economies [8,9,10,56]. Thus, an intervention leading to the expansion of the tax base is deemed beneficial, as it could reduce the government’s long-term dependence on development partner funds.

4. Conclusions and Policy Implications

Tanzania seeks to reduce its dependence on edible oil imports by supporting various interventions intended to promote and stimulate the domestic production of edible oilseeds. This paper evaluates the effects of a decision by the Tanzanian government to support technological progress for the edible oilseed crop sector in order to increase its production. A computable general equilibrium model is applied in order to discern the multiplier effects of the intervention in accelerating economic growth and improving peoples’ welfare. Findings show that increasing the production of the edible oilseeds indeed stimulates the domestic production of edible oils, other agricultural and related industries, and service sector commodities. Moreover, an increase in production is predicted for other commodities. Specifically, the model predicts that the intervention triggers an increase in the supply of edible oilseeds in the domestic market, which subsequently decreases prices. This decrease in prices creates a welfare gain in term of consumers surplus. Thus, from the model prediction, we conclude that the production enhancement intervention has the following outcomes: first, it incentivizes domestic producers to supply more due to the availability of improved inputs and technologies, ultimately increasing domestic production in order to meet domestic demand. This indicates that production improvement interventions in the agricultural sector could reduce dependence on edible oil imports, thus improving Tanzanian food security. Agricultural production improvements increase domestic outputs and enable the processing industries of these commodities to achieve economies of scale due to the availability of adequate raw materials from the agricultural sector. Secondly, the model predicts an increase in income for all domestic agents—rural households, urban households, and the government. This indicates that production improvement interventions motivate farmers to expand and employ more factors of production, such as labor and capital, to meet the demand for domestically produced commodities. This expansion, in turn, leads to increases in household income. For the government, the increase in production expands the tax base, which leads to an increase in government revenue. Therefore, the welfare gains resulting from the increase in incomes for the various household groups manifest both inclusive income growth and a reduction in food insecurity among citizens. Results of this model suggest that improving the production of the edible oilseeds sub-sector will cause an increase in the supply of domestically produced edible oils, which subsequently reduces imports. Indeed, such an intervention can be advocated as it could reduce the dependence of the country on imports, thus improving food security. In addition, the intervention creates a welfare gain for both consumers and producers by increasing domestic production in a sector that is increasingly efficient in terms of productivity. Based on the model results, we recommend that the government of Tanzania invests in technological progress and interventions that target the increase of production in sectors where it has a comparative advantage, such as agriculture. Interventions that increase production for smallholder farmers, such as the use of improved seed and other modern technologies that reduce costs of production, are critical and could reduce dependency on food imports. It is important to note that the model results do not establish the costs for implementing the highlighted technologies, rather provide insights into the impact of implementing technological progress interventions. Further studies are needed that could quantify the cost required by the government to implement interventions to attain the required level of production that reduces food insecurity and dependence on imports. In addition, the government needs to collaborate with other development partners through projects that are geared toward production improvement, particularly in the rural areas. Thus, to achieve competitiveness, increased support is needed, especially for farmers and processors, in terms of capital and the creation of a favorable business environment. This will help farmers and other stakeholders achieve the national vision of becoming food self-sufficient.

Author Contributions

All the authors were involved in the conceptualization of the study. C.P.M. did the data collection, management, analysis, model equation development, and writing of the manuscript draft. K.M. was involved in the interpretation of the results and revision of the manuscript. S.S. involved in the results interpretation, revision and editing of the manuscript draft for the final submission. All authors read and approved the final manuscript for submission.

Funding

This study was funded by the German Federal ministry of Food and Agriculture (BMEL) under the Federal Office for Agriculture and Food (BLE)

Acknowledgments

The authors thank the Federal Ministry of Food and Agriculture under the auspices of the Federal Office for Agriculture and Food, Germany, for their research grant. We also appreciate the support from the Leibniz Centre for Agricultural Landscape Research e.V (ZALF). Additional gratitude is due to the Partnership for Economic Policy (PEP) Network and the International Food Policy Research Institute (IFPRI)-Nexus project for providing the model code and Tanzania’s 2015 SAM data, respectively. Finally, we thank the anonymous reviewers and editors for their constructive comments, which substantially improved this study.

Conflicts of Interest

The authors declare no conflict of interest.

Appendix A

Table A1. Sets, Parameters, and Variables Description Used in the Computable General Equilibrium (CGE) Model.
SymbolParameter/VariableDescription
PKReturn to capital
PLWage rate
ERExchange rate
KSCapital endowment
LSSupply of labor
YIncome level
UUtility level for the household
PCINDEXConsumer price index (commodities)
FrischValue of Frisch parameter in the nested linear expenditure system (LES) utility function
PhillipsValue of Phillips parameter
S0Total initial savings
SHHousehold savings
SGGovernment savings
SFForeign savings
CBUDHousehold expenditure (commodities)
UNEMPInvoluntary unemployment
KGGovernment capital demand
LGGovernment labor demand
TRYIncome tax revenues
TAXRTotal tax revenues
tyThe tax rate on income
trepReplacement rate
TRFTotal transfers
TROOther transfers
PD0(sec)The initial price level of the domestic output of firm (sec)
P0(sec)The initial price level of domestic sales of composite commodities
PDD0(sec)The initial price of domestic output delivered to the home market
PWE0(sec)The initial global price of exports per sector
PWM0Z(sec)The initial global price of imports per sector
σAsigmaA(sec)Substitution elasticities of ARMINGTON function
σTsigmaT(sec)Constant elasticities of transformation (CET) function
σFsigmaF(sec)Constant elasticities of substitution (CES) capital-labor of the firm (sec)
elasY(sec)Income elasticities of demand for a commodity (sec)
X0(sec)The initial domestic sales of a composite commodity (sec)
XD0(sec)The initial gross domestic production (output) level firm (sec)
XDD0(sec)The initial domestic production delivered to home markets
KD0(sec)The initial capital demand per sector
LD0(sec)The initial labor demand per sector
C0(sec)The initial consumer demand for commodities and leisure per sec
I0(sec)The initial investment demand per sector
E0(sec)The initial export demand per sector
M0(sec)The initial import demand per sector
PM0(sec)The initial import price excluding tariffs in local currency per sector
PE0(sec)The initial price of exports in local currency per sector
IO0(sec,secc)The initial intermediate commodity demand per sector
CG0(sec)The initial government commodity demand per sector
TRC0(sec)The initial tax revenue on consumer commodities per sector
TRK0(sec)The initial tax revenue on capital use per sector
TRL0(sec)The initial tax revenue on labor use per sector
TRM0(sec)The initial tax revenue on imports per sector
Tc0(sec)The initial tax rate on consumer commodities in the Price index (PCINDEX)
tc(sec)The tax rate on consumer commodities
tk(sec)The tax rate on capital use
tl(sec)Tax rate on labor use
tm(sec)Tariff rate on imports
io(sec,secc)Technical coefficients
γFgammaF(sec)CES distribution parameter in the production function of the firm (sec)
aF(sec)Efficiency parameter of CES production function of firm (sec)
γAgammaA(sec)CES distribution parameter of ARMINGTON function of commodity (sec)
aA(sec)Efficiency parameter of ARMINGTON function of commodity (sec)
γTgammaT(sec)CET distribution parameter regarding the destination of domestic output
aT(sec)Shift parameter in the CET function of the firm (sec)
αHLESalphaHLES(sec)Power in the nested linear expenditure system (LES) household utility function
µHmuH(sec)Subsistence household consumption quantities (sec)
mpsHousehold’s marginal propensity to save
αIalphaI(sec)Cobb-Douglas power in the bank’s utility function
αCGalphaCG(sec)Cobb-Douglas power in government utility function (commodities)
αKGalphaKGCobb-Douglas power in the government utility function (capital)
αLGalphaLGCobb-Douglas power in the government utility function (labor)
Table A2. Equation Blocks in the CGE Model.
EquationDescription
Household block
C i = μ H i + α H L E S i · [ ( 1 + t c i ) · P D i ] 1 · [ C B U D j = 1 n ( 1 + t c j ) · P D j μ H j ] i = 1 , n Household commodity demand from each sector
S H = m p s · ( 1 t y ) · Y Household savings
( P L 1 / P C I N D E X 1 P L 0 / P C I N D E X 0 1 ) = e l a s t P L · ( U N E M P 1 / L S 1 U N E M P 0 / L S 0 1 )
P C I N D E X t = i = 1 n ( 1 + t c i t ) · P D i t · C i 0 i = 1 n ( 1 + t c i 0 ) · P D i 0 · C i 0 t = 0 , 1 Price index
Investment block
S = S H + P I N D E X · S G + E R · S F Total savings
I i = α I i · P i 1 · S Investment per sector
Firms block
K D i = γ F i σ F i · [ ( 1 + t l i ) · P K ] σ F i ( γ F i σ F i · [ ( 1 + t l i ) · P K ] 1 σ F i + ( 1 γ F i ) σ F i · [ ( 1 + t l i ) · P L ] 1 σ F i ) σ F i / ( 1 σ F i · ( X D i / a F i ) Capital demand per sector
L D i = ( 1 γ F i ) σ F i · [ ( 1 + t l i ) · P L ] σ F i ( γ F i σ F i · [ ( 1 + t l i ) · P K ] 1 σ F i + ( 1 γ F i ) σ F i · [ ( 1 + t l i ) · P L ] 1 σ F i ) σ F i / ( 1 σ F i · ( X D i / a F i ) Labor demand per sector
Foreign Sector block
X D D i = ( 1 γ A i ) σ A i · P D D i σ A i · [ γ A i σ A P M i 1 σ A i + ( 1 γ A i ) σ A i · P D D i 1 σ A i ] σ A i / ( 1 σ A i ) · ( X D i / a A i ) Gross domestic output
M i = γ A i · P M i σ A i · [ γ A i σ A i · P M i 1 σ A i + ( 1 γ A i ) σ A i · P D D i 1 σ A i ] σ A / ( 1 σ A ) · ( X i / a A i ) Total import per sector
X D D i = ( 1 γ T i ) σ T i · P D D i σ T i · [ γ T i σ T i P E i 1 σ T i + ( 1 γ T i ) σ T i · P D D i 1 σ T i ] σ T i / ( 1 σ T i ) · ( X D i / a T i ) Domestic produced commodity demand per sector
E i = γ T i σ T i · P E i σ T i · [ γ T i σ T i P E i 1 σ T i + ( 1 γ T i ) σ T i · P D D i 1 σ T i ] σ T i / ( 1 σ T i ) · ( X D i / a T i ) Export domestic commodity per sector
P M i = ( 1 + t m i ) · E R · P W M Z i Price import in local currency
P E i = E R · P W E Z i Price export in local currency
i = 1 n P W M Z i · M i = i = 1 n P W E Z i · E i + S F Total import commodity value
Government block
C G i = α C G i · P D i 1 · ( T A X R T R F P I N D E X · S G ) Government commodity demand
K G = α K G · P K 1 · ( T A X R T R F P I N D E X · S G ) Government capital demand
L G = α L G · P L 1 · ( T A X R T R F P I N D E X · S G ) Government labor demand
T A X R = i = 1 n ( t c i C i · P i + t k i K i · P K i + t l i L i · P L i + t m i · E R · P W M Z i · M i ) + t y · Y Total tax revenues
T R F = t r e p · P L · U N E M P + P C I N D E X · T R O Total government transfers
Market Clearing
i = 1 n K i + K G = K S Capital supply equilibrium
i = 1 n L i + L G = L S U N E M P Labor supply equilibrium
X i = i o i i · X D i + i o i j X D j + C G i + C i + I i Commodity supply equilibrium
Income block
Y = P K · K S + P L ( L S U N E M P ) + T R F Total household income
C B U D = ( 1 t y ) Y S H Household commodity expenditure
P D i · X D i = ( 1 + t k i ) · P K · K i + ( 1 + t l i ) · P L · L i + i = 1 n P i i o i i · X D i Total value domestic output
P i · X i = P M i · M i + P D D i · X D D i National commodity demand per sector
P D i · X D i = P D D i · X D D i + P E i · E i National commodity supply

References

  1. BoT. Bank of Tanzania Annual Report 2016/17. 254; BoT: Dar es salaam, Tanzania, 2018; Available online: https://www.bot.og.tz (accessed on 10 March 2019).
  2. Wangwe, S.; Mmari, D.; Alkaeli, J.; Rutatina, N.; Mboghoina, T.; Kinyondo, A. The Performance of the Manufacturing Sector in Tanzania: Challenges and Way Forward; Working Paper; UNU-WIDER: Helsinki, Finland, 2014. [Google Scholar]
  3. Mufuruki, A.A.; Mawji, R.; Kasiga, G.; Marwa, M. Tanzania’s Industrialisation Journey, 2016–2056, from an Agrarian to a Modern Industrialised State in Forty Years; Moran (E.A.): Nairobi, Kenya, 2017; Volume 1, p. 169. [Google Scholar]
  4. URT. Agricultural Sector Development Programme Phase Two (ASPD II), Government Programme Document; United Republic of Tanzania (URT): Dar es salaam, Tanzania, 2016; Available online: http://www.tzdpg.or.tz/fileadmin/documents/external/national_development_frameworks/ASDP2_Final_Document_20_May._2016__after_edit__1_.pdf. (accessed on 5 January 2019).
  5. Rekiso, Z.S. Economics of Late Development and Industrialization: Putting Gebrehiwot Baykedagn (1886–1919) in Context. Cambr. J. Econ. 2019, 43, 223–248. [Google Scholar] [CrossRef]
  6. Rougier, M.; Odisio, J. The “Swan Song” of Argentinian Industrialization. Performance and Alternatives in the Final Stage of ISI. Rev. Estud. Soc. 2019, 51–67. [Google Scholar] [CrossRef]
  7. Sandonato, S.; Willebald, H. Natural Capital, Domestic Product and Proximate Causes of Economic Growth: Uruguay in the Long Run, 1870–2014. Sustainability 2018, 10, 715. [Google Scholar] [CrossRef]
  8. Galiani, S.; Somaini, P. Path-dependent import-substitution policies: The case of Argentina in the twentieth century. Lat. Amer. Econ. Rev. 2018, 27, 53. [Google Scholar] [CrossRef]
  9. Omosegbon, O.; Okeke, C. The Integration of Africa: Commodity-Based Industrialization Examined. In Private Sector Development in West Africa; Seck, D., Ed.; Springer: Cham, Switzerland, 2014; pp. 111–128. [Google Scholar]
  10. Adewale, A.R. Does Import Substitution Industrialisation Strategy Hurt Growth? New Evidence from Brazil and South Africa. Afr. Asian Stud. 2012, 11, 288–314. [Google Scholar] [CrossRef]
  11. Weiss, J. Lewis on Industrialisation and Industrial Policy. J. Inter. Dev. 2018, 30, 61–79. [Google Scholar] [CrossRef]
  12. Kombe, C.; Mpemba, Z.; Yabu, N.; Kazi, M.; Machemba, J.; Kibesse, B.; Mwita, D.; Mgangaluma, E.; Mashine, S.; Chaula, A.; et al. The Potentiality of Sunflower Sub-Sector in Tanzania; Bank of Tanzania Working Paper; Bank of Tanzania (BoT): Dar es salaam, Tanzania, 2017; Volume 10. [Google Scholar]
  13. Balchin, N.; Kweka, J.; Mendez-Parra, M. Tariff Setting for Development of Edible Oil Sector in Tanzania. In Proceedings of the Agricultural State Actors Forum(ANSAF), Dar es salaam, Tanzania, 10 February 2018; p. 79. Available online: http://dev.ansaf.or.tz/wp-content/uploads/2018/04/I4ID-Tariff-setting-in-Tanzanias-edible-oil-sector_FINAL-Report_26-Feb-2018.pdf. (accessed on 5 January 2019).
  14. Khan, H.; Ali, S.; Ahmad, I.; Khan, I.; Hussain, S.; Khan, B.A.; Suhaib, M. Agronomic and Qualitative Evaluation of Different Local Sunflower Hybrids. Pak. J. Agric. Res. 2018, 31. [Google Scholar] [CrossRef]
  15. McArthur, J.W.; McCord, G.C. Fertilizing growth: Agricultural inputs and their effects on economic development. J. Dev. Econ. 2017, 127, 133–152. [Google Scholar] [CrossRef] [PubMed]
  16. Jonasson, E.; Filipski, M.; Brooks, J.; Taylor, J.E. Modeling the welfare impacts of agricultural policies in developing countries. J. Policy Mod. 2014, 36, 63–82. [Google Scholar] [CrossRef] [Green Version]
  17. Mgeni, C.P.; Müller, K.; Sieber, S. Tariff impact on industrialization in Tanzania: Evidence from edible oil sub-sector. J. Econ. Sust. Dev. 2019, 10, 15–30. [Google Scholar] [CrossRef]
  18. Ngenoh, E.; Kurgat, B.K.; Bett, H.K.; Kebede, S.W.; Bokelmann, W. Determinants of the competitiveness of smallholder African indigenous vegetable farmers in high-value agro-food chains in Kenya: A multivariate probit regression analysis. Agric. Food Econ. 2019, 7, 2. [Google Scholar] [CrossRef]
  19. Sani, S.; Kemaw, B. Analysis of households food insecurity and its coping mechanisms in Western Ethiopia. Agric. Food Econ. 2019, 7, 5. [Google Scholar] [CrossRef] [Green Version]
  20. Habtemariam, L.T.; Mgeni, C.P.; Mutabazi, K.D.; Sieber, S. The farm income and food security implications of adopting fertilizer micro-dosing and tied-ridge technologies under semi-arid environments in central Tanzania. J. Arid Environ. 2019, 166. [Google Scholar] [CrossRef]
  21. Kaliba, A.R.; Mazvimavi, K.; Gregory, T.L.; Mgonja, F.M.; Mgonja, M. Factors affecting the adoption of improved sorghum varieties in Tanzania under information and capital constraints. Agric. Food Econ. 2018, 6, 18. [Google Scholar] [CrossRef]
  22. Gabagambi, D.; George, V. Sunflower Production Situation in the Central Corridor of Tanzania; Final Report; Rural Livelihood Development Company: Tanzania, East Africa, 2010. [Google Scholar]
  23. Henningsen, A.; Mpeta, D.F.; Adem, A.S.; Kuzilwa, J.A.; Czekaj, T.G. The Effects of Contract Farming on Efficiency and Productivity of Small-Scare Sunflower Farmers in Tanzania. In Proceedings of the International Conference of Agricultural Economists, Milan, Italy, 8–14 August 2015. [Google Scholar]
  24. Paltasingh, K.R.; Goyari, P. Impact of farmer education on-farm productivity under varying technologies: The case of paddy growers in India. Agric. Food Econ. 2018, 6, 7. [Google Scholar] [CrossRef]
  25. International Food Policy Research Institute (IFPRI). 2015 Social Accounting Matrix for Tanzania; Dataverse, V1; IFPRI: Washington, DC, USA, 2017. [Google Scholar] [CrossRef]
  26. Decaluwé, B.; Lemelin, A.; Robichaud, V.; Maisonnave, H. The PEP 1-1 Standard Computable General Equilibrium Model: Single-country, static (Version 2.1). In Politique Économique et Pauvreté/Poverty and Economic Policy Network; Université Laval: Québec, QC, Canada, 2013. [Google Scholar]
  27. Laborde, D.; Traore, F. The Sensitivity of Computable General Equilibrium Models to Macroeconomics Closure Rules: Evidence from IFPRI Standard Model; AGRODEP Technical Notes; IFPRI: Washington, DC, USA, 2017. [Google Scholar]
  28. Hübler, M.; Pothen, F. Trade-induced productivity gains reduce incentives to impose strategic tariffs. Econ. Mod. 2017, 61, 420–431. [Google Scholar] [CrossRef]
  29. Pothen, F.; Welsch, H. Economic development and material use. Evidence from international panel data. World Dev. 2019, 115, 107–119. [Google Scholar] [CrossRef]
  30. Lectard, P.; Rougier, E. Can Developing Countries Gain from Defying Comparative Advantage? Distance to Comparative Advantage, Export Diversification and Sophistication, and the Dynamics of Specialization. World Dev. 2018, 102, 90–110. [Google Scholar] [CrossRef] [Green Version]
  31. Clapp, J. Food self-sufficiency: Making sense of it, and when it makes sense. Food Policy 2017, 66, 88–96. [Google Scholar] [CrossRef] [Green Version]
  32. Flentø, D.; Ponte, S. Least-Developed Countries in a World of Global Value Chains: Are WTO Trade Negotiations Helping? World Dev. 2017, 94, 366–374. [Google Scholar] [CrossRef] [Green Version]
  33. Bresnahan, L.; Coxhead, I.; Foltz, J.; Mongues, T. Does Freer Trade Really Lead to Productivity Growth? Evidence from Africa. World Dev. 2016, 86, 18–29. [Google Scholar] [CrossRef] [Green Version]
  34. Bezemer, D.; Headey, D. Agriculture, Development, and Urban Bias. World Dev. 2008, 36, 1342–1364. [Google Scholar] [CrossRef] [Green Version]
  35. Boulanger, P.; Dudu, H.; Ferrari, E.; Mainar Causape, A.J.; Balle, J.; Battaglia, L. Policy Options to Support. Agriculture Sector Growth and Transformation Strategy in Kenya: A CGE analysis, EUR 29231; Publications Office of the European Union: Luxembourg, 2018; ISBN 978-92-79-85949-6. [Google Scholar] [CrossRef]
  36. Zidouemba, P.R.; Gerard, F. Does Agricultural Productivity Actually Matter for Food Security in a Landlocked Sub-Saharan African Country? The Case of Burkina Faso. Can. J. Agric. Econ. 2018, 66, 103–142. [Google Scholar] [CrossRef]
  37. Wangari, M.J.; Richard, V.S.; Kemboi, K. A study of the impact of agricultural development and efficiency on Sudan Economy. Afr. J. Agric. Econ. Rural Dev. 2016, 4, 351–358. [Google Scholar]
  38. Page, J. Can Africa Industrialize? J. Afr. Econ. 2012, 21, 86–124. [Google Scholar] [CrossRef]
  39. Ivanic, M.; Martin, W. Sectoral Productivity Growth and Poverty Reduction: National and Global Impacts. World Dev. 2018, 109, 429–439. [Google Scholar] [CrossRef]
  40. Morris, M.; Fessehaie, J. Making the Most of Africa’s Commodities: Linkage Development, Value Addition, and Industrialization; Report for the United Nations Economic Commission on Africa: Economic Report of Africa 2013; University of Cape Town: Cape Town, South Africa, 2012. [Google Scholar]
  41. Mwang’onda, E.S.; Mwasebaand, S.L.; Juma, M.S. Industrialization in Tanzania: The Fate of the Manufacturing sector Lies upon Policies Implementations. Intern. J. Bus. Econ. Res. 2018, 7, 71–78. [Google Scholar] [CrossRef]
  42. Msami, J.; Wangwe, S. Industrial Development in Tanzania. In Manufacturing Transformation: Comparative Studies of Industrial Development in Africa and Emerging Asia. 6; Newman, C., Page, J., Rand, J., Shimeles, A., Söderbom, M., Tarp, F., Eds.; Oxford University Press: Oxford, UK, 2016; pp. 45–66. [Google Scholar] [CrossRef]
  43. Mkubwa, H.M.; Mtengwa, B.A.; Babiker, S.A. The Impact of Trade Liberalization on Economic Growth in Tanzania. Inter. J. Acad. Res. Bus. Soc. Sci. 2014, 4. [Google Scholar] [CrossRef]
  44. Chang, H.J. Kicking away the ladder: Neoliberalism and the ‘Real’ History of capitalism. In Developmental Politics in Transition—The Neoliberal Era and Beyond; Chang, K.-S., Weiss, L., Fine, B., Eds.; Palgrave Macmillan: Hampshire, UK, 2012; pp. 43–50. [Google Scholar]
  45. Samouel, B.; Aram, B. The Determinants of Industrialization: Empirical Evidence for Africa. Eur. Sci. J. 2016, 1, 219–239. [Google Scholar]
  46. Diao, X.; McMillan, M. Toward an understanding of economic growth in Africa: A reinterpretation of the Lewis Model. World Dev. 2018, 109, 511–522. [Google Scholar] [CrossRef]
  47. Christiaensen, L.; Martin, W. Agriculture, structural transformation and poverty reduction: Eight new insights. World Dev. 2018, 109, 413–416. [Google Scholar] [CrossRef]
  48. Dorosh, P.; Thurlow, J. Beyond agriculture versus non-agriculture: Decomposing sectoral growth–poverty linkages in five African countries. World Dev. 2018, 109, 440–451. [Google Scholar] [CrossRef]
  49. Le Billon, P.; Sommerville, M. Landing capital and assembling ‘investable land’ in the extractive and agricultural sectors. Geoforum 2017, 82, 212–224. [Google Scholar] [CrossRef]
  50. McMillan, M.S.; Rodrik, D.; Verduzco-Gallo, I. Globalization, structural change, and productivity growth, with an update on Africa. World Dev. 2017, 63, 11–32. [Google Scholar] [CrossRef]
  51. Tlhalefang, J.; Mangadi, K. Potential welfare benefits of agricultural transformation in Botswana: A computable general equilibrium model analysis. J. Afr. Stud. 2012, 26, 46. [Google Scholar]
  52. Naranpanawa, A.; Arora, R. Does Trade Liberalization Promote Regional Disparities? Evidence from a Multiregional CGE Model of India. World Dev. 2014, 64, 339–349. [Google Scholar] [CrossRef] [Green Version]
  53. Le Goff, M.; Singh, R.J. Does trade reduce poverty? A view from Africa. J. Afr. Trade 2014, 1, 5–14. [Google Scholar] [CrossRef]
  54. Emran, S.; Shilpi, F. Agricultural Productivity, Hired Labor, Wages, and Poverty: Evidence from Bangladesh. World Dev. 2017, 109, 470–482. [Google Scholar] [CrossRef]
  55. Dorward, A.; Morrison, J.; Wobst, P.; Lofgren, H.; Tchale, H. Modeling Pro-Poor Agricultural Growth Strategies in Malawi: Lessons for Policy and Analysis. African Development and Poverty Reduction: The Macro-Micro Linkage; Forum Paper: Somerset West, South Africa, 2004. [Google Scholar]
  56. Mgeni, C.P.; Sieber, S.; Amjath-Babu, T.S.; Mutabazi, K.D. Can protectionism improve food security? Evidence from an imposed tariff on imported edible oil in Tanzania. Food Secur. 2018, 10, 799–806. [Google Scholar] [CrossRef]
Figure 1. The nested structure of production.
Sustainability 11 04480 g001
Table 1. Changes in the economic variables (% change from the base).
Sectors/Sub-SectorsProductionImportExportDomestic SalesDomestic PricesImport Price
Agriculture25.1023.21
Cereals24.41−27.0869.7628.09−26.694.03
Oilseeds37.21−66.1995.0620.68−28.377.09
Roots and Tubers25.99−31.8937.9123.63−43.173.98
Cotton10.86−35.7925.551.78−13.237.08
Tobacco22.23−29.7930.5511.21−9.357.05
Tea20.59−7.9322.0718.34−4.066.45
Sisal1.43 1.43−29.22
Sugar27.54−8.5951.8425.64−10.233.45
Fruits and Vegetables26.09−43.1477.2622.44−28.057.40
Other crops29.91-8.5633.8717.99−10.463.89
Livestock21.62−61.4196.2818.73−37.252.82
Fishery26.65−10.3950.2521.21−22.442.85
Forestry26.79−11.8152.0021.19−30.033.17
Industry5.486.03
Mining and Gas−0.53−5.82−3.51−0.020.932.93
Food processing13.5834.43−12.2613.5612.361.93
Beverages7.5048.22−53.367.5626.556.22
Clothing1.4362.61−65.124.1817.742.16
Wood products−3.9811.27−24.05−3.215.921.67
Chemicals−19.6528.89−71.72−17.4214.081.73
Petroleum−3.9215.12−29.99−3.8211.852.83
Other manufacturing−8.947.91−30.75−7.985.831.59
Services 1.953.53
Utilities4.00 4.0027.88
Construction1.5526.98 1.5513.383.01
Trade9.96 9.9671.81
Hotels and Restaurants7.08 7.0824.19
Transportation−5.319.84−6.581.634.323.01
Real estate5.87 5.3161.43
Public Administration−3.1435.21−38.19−1.4919.313.01
Other Services−11.8225.96−29.86−1.9514.693.01
Table 2. Capital investment demand for various sectors (% change from the base year).
Sector% Change
Agriculture39.2
Food49.3
Agro-processing34.5
Industry28.5
Service39.2
Land35.4
Total investment demand37.6
Table 3. Household disposable income (% change from the base).
Household CategoriesSIM
Aggregate Rural15.10
 Rural Poor14.04
 Rural attain basic needs14.55
 Rural uneducated14.46
 Rural have completed primary education14.62
 Rural have not completed secondary education15.81
 Rural have completed secondary education15.25
Aggregate Urban16.07
 Urban Poor16.59
 Urban attain basic needs17.78
 Urban uneducated16.30
 Urban have completed primary education16.41
 Urban have not completed secondary education16.61
 Urban have completed secondary education14.29
Aggregate (Rural and Urban)15.42
Table 4. The effects of increased production on government revenues and GDP.
Revenue Sources% Change from the base
Direct taxes16.89
Indirect tax18.79
Tariff11.04
Tax on production 20.85
GDP2.7

