Removal of Pb(II) from Acid Mine Drainage with Bentonite-Steel Slag Composite Particles


Abstract
1. Introduction
2. Materials and Methods
2.1. Materials
2.2. Preparation of BSC
2.3. Effect of pH on Pb(II) Adsorption
2.4. Adsorption Kinetics
2.5. Effects of Temperature and Solute Concentration
2.6. Microstructure Characterization
3. Results and Discussion
3.1. Effect of pH on Pb(II) Adsorption and Associated Mechanisms
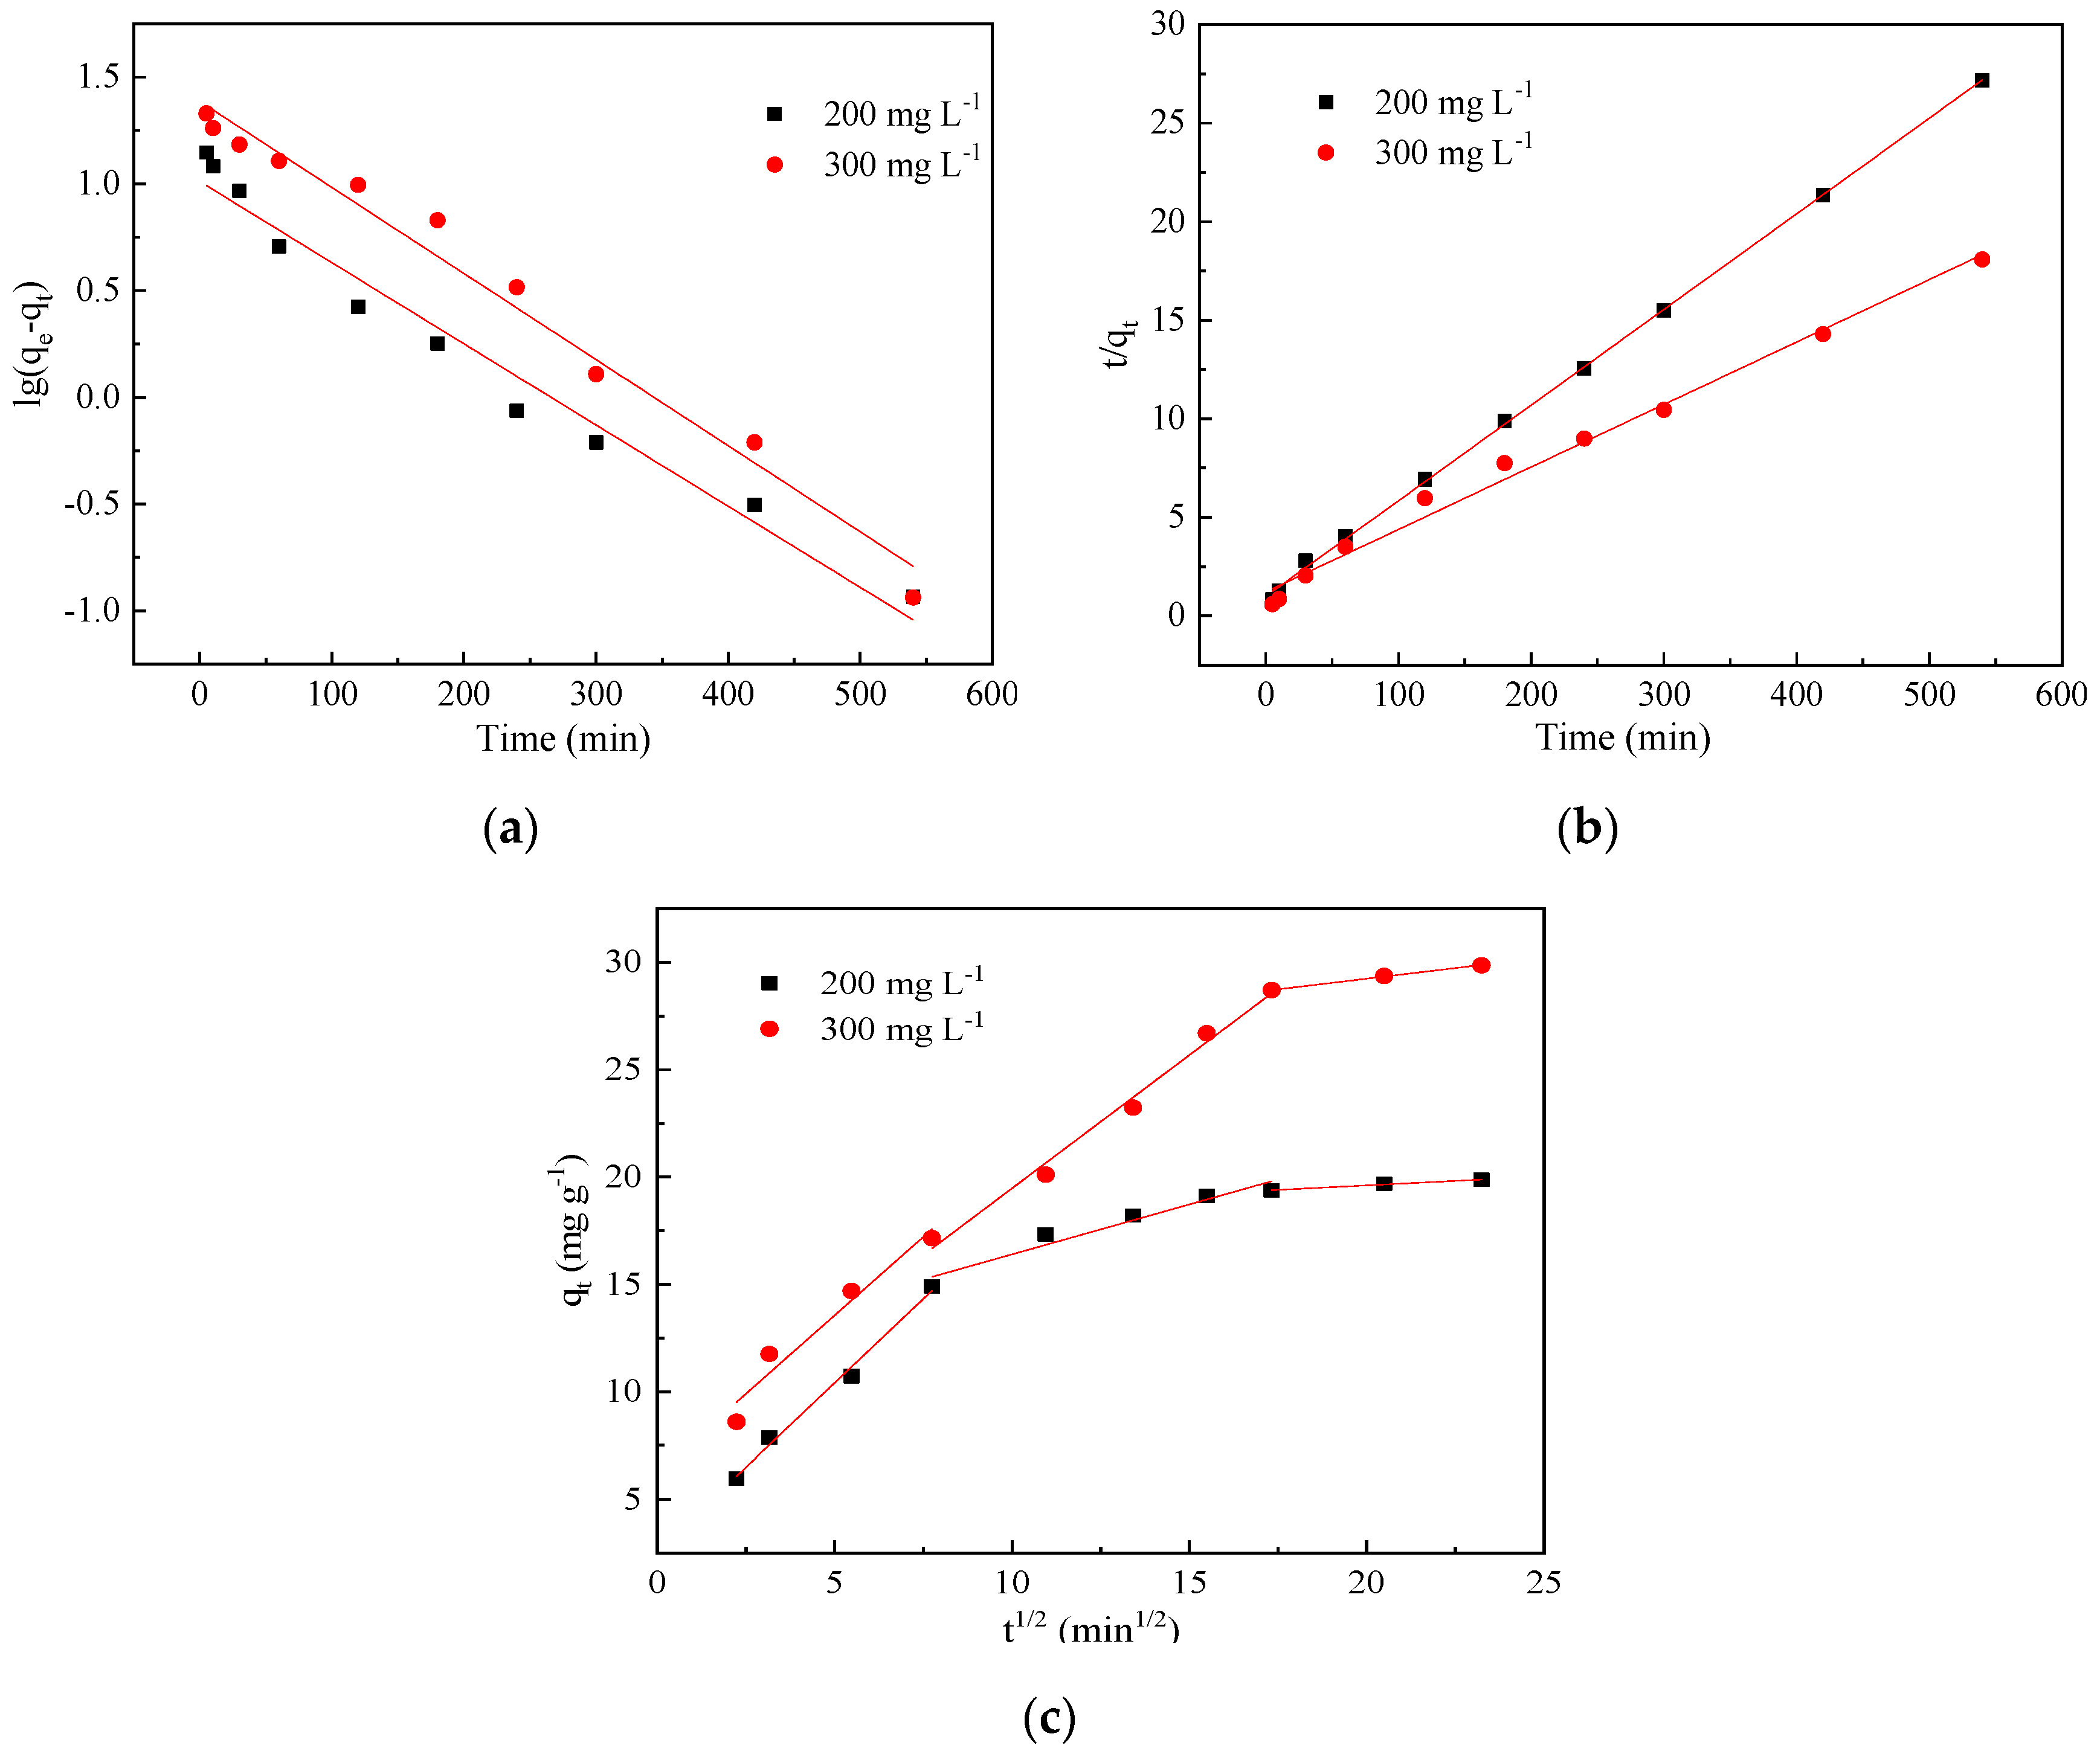
3.2. Effect of Contact Time and Adsorption Kinetics
3.3. Adsorption Isotherms
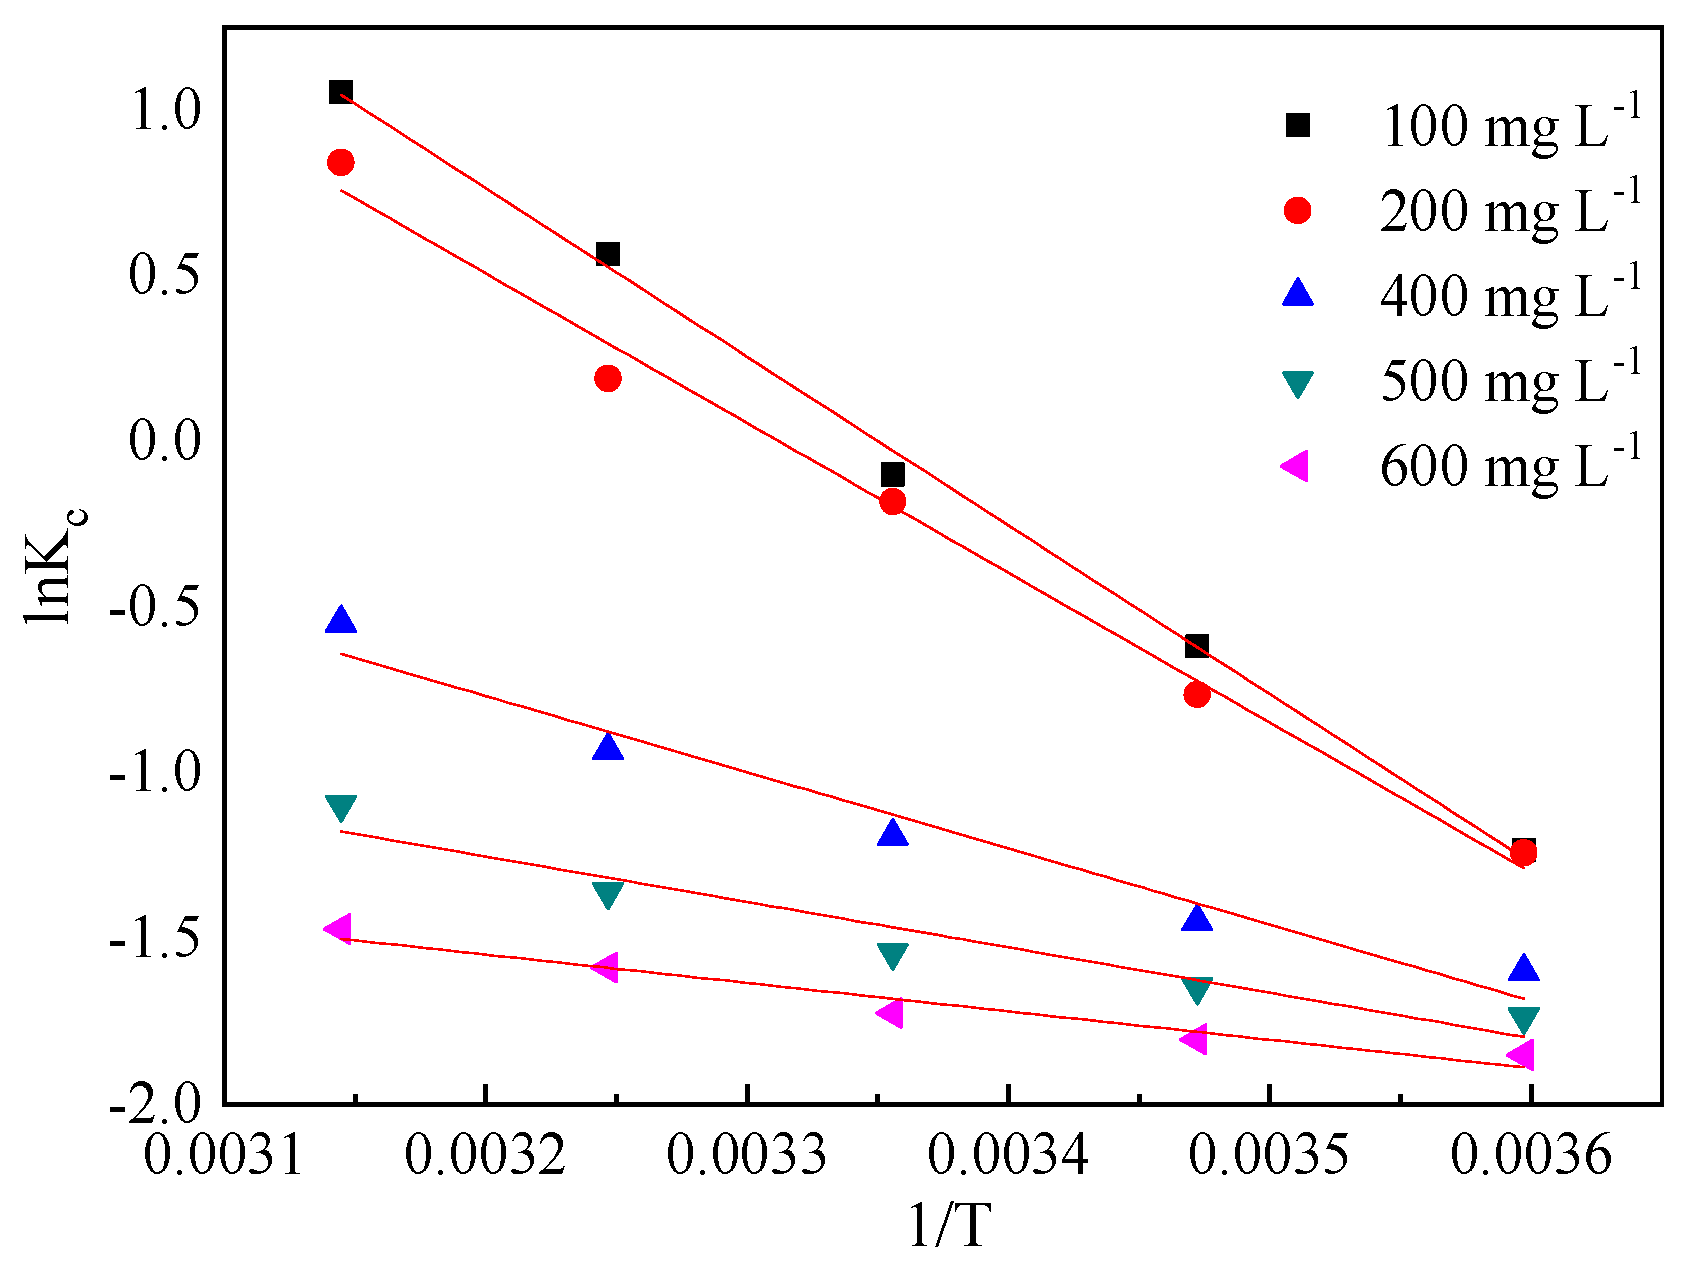
3.4. Adsorption Thermodynamics
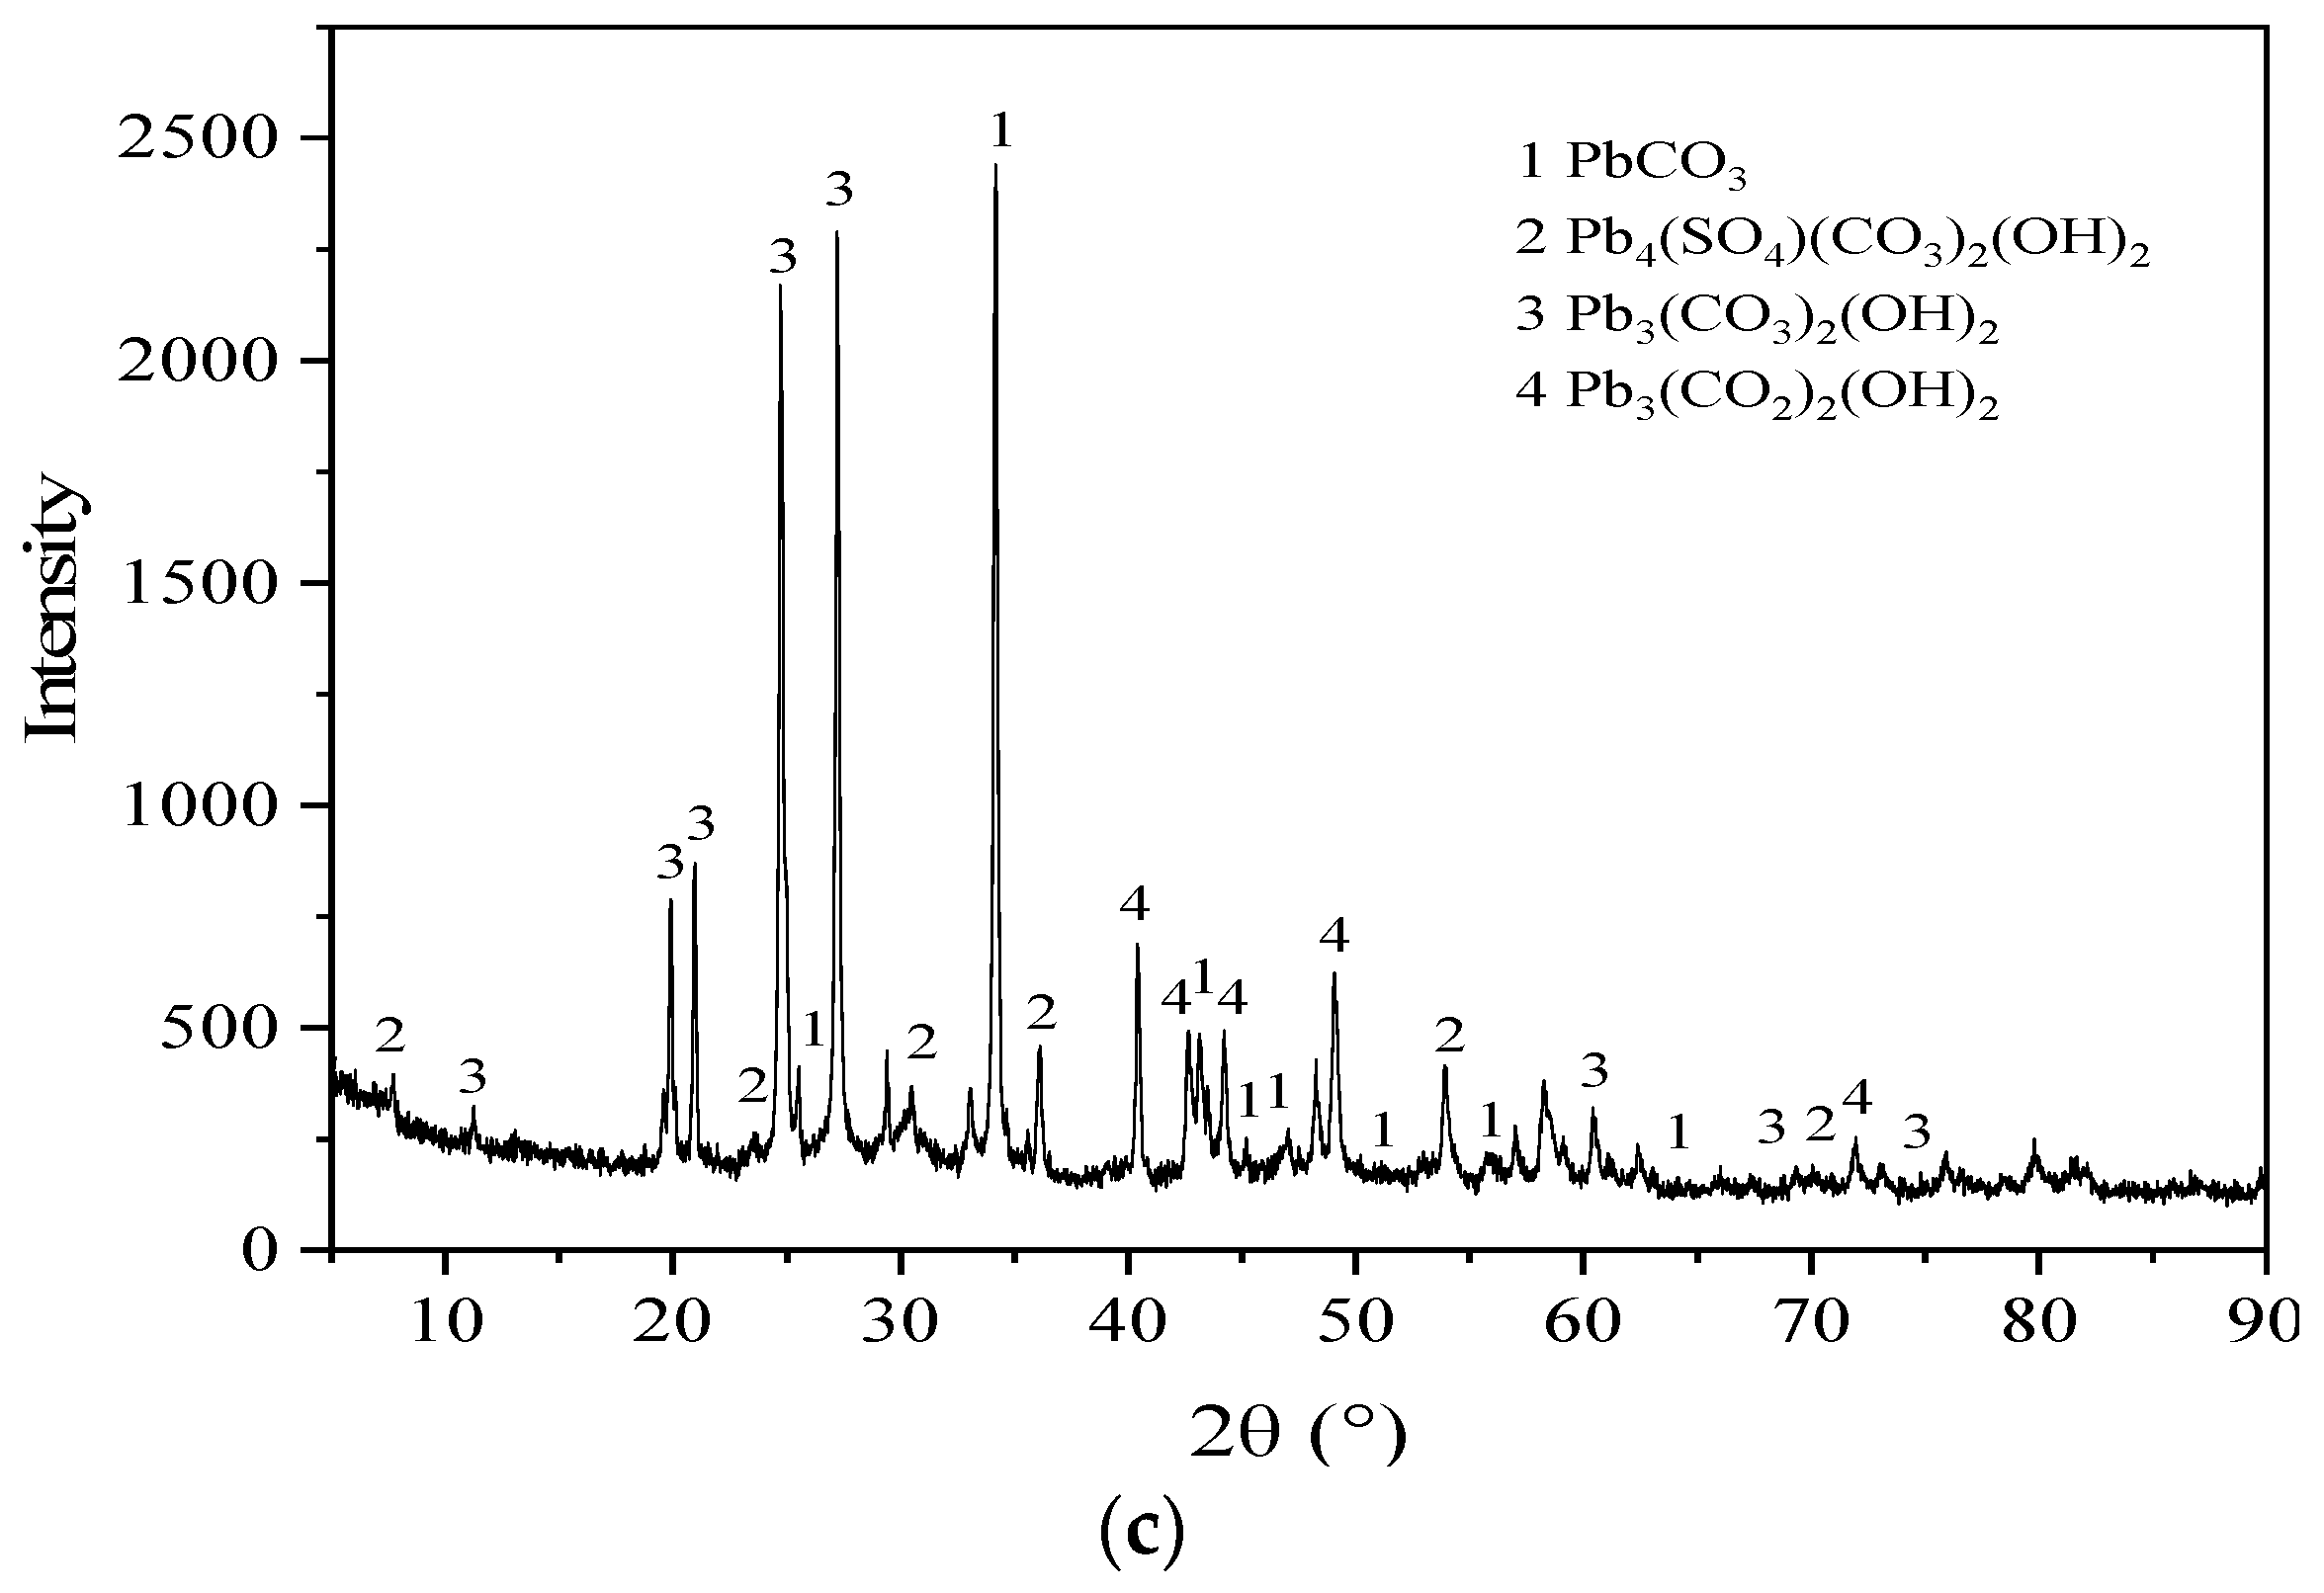
3.5. Microstructure Characterization Results
4. Conclusions
Author Contributions
Funding
Acknowledgments
Conflicts of Interest
References
- Kefeni, K.K.; Msagati, T.A.M.; Mamba, B.B. Acid mine drainage: Prevention, treatment options, and resource recovery: A review. J. Clean. Prod. 2017, 151, 475–493. [Google Scholar] [CrossRef]
- Qin, W.J.; Han, D.M.; Song, X.F.; Engesgaard, P. Effects of an abandoned Pb-Zn mine on a karstic groundwater reservoir. J. Geochem. Explor. 2019, 200, 221–233. [Google Scholar] [CrossRef]
- Balistrieri, L.S.; Seal, R.R.; Piatak, N.M.; Paul, B. Assessing the concentration, speciation, and toxicity of dissolved metals during mixing of acid-mine drainage and ambient river water downstream of the Elizabeth Copper Mine, Vermont, USA. Appl. Geochem. 2007, 22, 930–952. [Google Scholar] [CrossRef]
- Beygli, R.A.; Mohaghegh, N.; Rahimi, E. Metal ion adsorption from wastewater by g-C3N4 modified with hydroxyapatite: A case study from Sarcheshmeh Acid Mine Drainage. Res. Chem. Intermediat. 2019, 45, 2255–2268. [Google Scholar] [CrossRef]
- Gutierrez, M.; Mickus, K.; Camacho, L.M. Abandoned Pb-Zn mining wastes and their mobility as proxy to toxicity: A review. Sci. Total Environ. 2016, 565, 392–400. [Google Scholar] [CrossRef] [PubMed]
- Oldham, C.; Beer, J.; Blodau, C.; Fleckenstein, J.; Jones, L.; Neumann, C.; Peiffer, S. Controls on iron(II) fluxes into waterways impacted by acid mine drainage: A Damkohler analysis of groundwater seepage and iron kinetics. Water Res. 2019, 153, 11–20. [Google Scholar] [CrossRef] [PubMed]
- Sephton, M.G.; Webb, J.A. The role of secondary minerals in remediation of acid mine drainage by Portland cement. J. Hazard. Mater. 2019, 367, 267–276. [Google Scholar] [CrossRef]
- Mamelkina, M.A.; Tuunila, R.; Sillanpaa, M.; Hakkinen, A. Systematic study on sulfate removal from mining waters by electrocoagulation. Sep. Purif. Technol. 2019, 216, 43–50. [Google Scholar] [CrossRef]
- Aguiar, A.O.; Andrade, L.H.; Ricci, B.C.; Pires, W.L.; Miranda, G.A.; Amaral, M.C.S. Gold acid mine drainage treatment by membrane separation processes: An evaluation of the main operational conditions. Sep. Purif. Technol. 2016, 170, 360–369. [Google Scholar] [CrossRef]
- Vital, B.; Bartacek, J.; Ortega-Bravo, J.C.; Jeison, D. Treatment of acid mine drainage by forward osmosis: Heavy metal rejection and reverse flux of draw solution constituents. Chem. Eng. J. 2018, 332, 85–91. [Google Scholar] [CrossRef]
- Bai, H.; Kang, Y.; Quan, H.E.; Han, Y.; Sun, J.; Feng, Y. Treatment of acid mine drainage by sulfate reducing bacteria with iron in bench scale runs. Bioresour. Technol. 2013, 128, 818–822. [Google Scholar] [CrossRef] [PubMed]
- Yildiz, M.; Yilmaz, T.; Arzum, C.S.; Yurtsever, A.; Kaksonen, A.H.; Ucar, D. Sulfate reduction in acetate- and ethanol-fed bioreactors: Acidic mine drainage treatment and selective metal recovery. Miner. Eng. 2019, 133, 52–59. [Google Scholar] [CrossRef]
- Pat-Espadas, A.M.; Portales, R.L.; Amabilis-Sosa, L.E.; Gomez, G.; Vidal, G. Review of Constructed Wetlands for Acid Mine Drainage Treatment. Water 2018, 10, 1685. [Google Scholar] [CrossRef]
- Park, I.; Tabelin, C.B.; Jeon, S.; Li, X.L.; Seno, K.; Ito, M.; Hiroyoshi, N. A review of recent strategies for acid mine drainage prevention and mine tailings recycling. Chemosphere 2019, 219, 588–606. [Google Scholar] [CrossRef] [PubMed]
- Alakangas, L.; Andersson, E.; Mueller, S. Neutralization/prevention of acid rock drainage using mixtures of alkaline by-products and sulfidic mine wastes. Environ. Sci. Pollut. Res. 2013, 20, 7907–7916. [Google Scholar] [CrossRef] [PubMed]
- Madzivire, G.; Maleka, P.P.; Vadapalli, V.R.K.; Gitari, W.M.; Lindsay, R.; Petrik, L.F. Fate of the naturally occurring radioactive materials during treatment of acid mine drainage with coal fly ash and aluminium hydroxide. J. Environ. Manag. 2014, 133, 12–17. [Google Scholar] [CrossRef] [PubMed]
- Zuo, Q.; Zhang, Y.; Zheng, H.; Zhang, P.Y.; Yang, H.W.; Yu, J.; Tang, J.; Zheng, Y.D.; Mai, J.J. A facile method to modify activated carbon fibers for drinking water purification. Chem. Eng. J. 2019, 65, 175–182. [Google Scholar] [CrossRef]
- Mohan, D.; Pittman, C.U. Activated carbons and low cost adsorbents for remediation of triand hexavalent chromium from water. J. Hazard. Mater. 2006, 137, 762–811. [Google Scholar] [CrossRef]
- Li, H.; Zhou, M.; Han, Y.; Shi, B.C.; Xiong, Q.; Hou, H.B. Mechanism of red mud combined with steel slag conditioning for sewage sludge dewatering. Desalin. Water Treat. 2018, 135, 133–140. [Google Scholar] [CrossRef]
- Liu, L.; Yu, L.J.; Zhang, W.; Fan, J.H.; Zuo, Q.T.; Li, M.J.; Yan, Z.F.; You, Z.C.; Wang, R.Y. Adsorption performance of Pb(II) ions from aqueous solution onto a novel complex of coffee grounds and attapulgite clay. Desalin. Water Treat. 2019, 153, 208–215. [Google Scholar] [CrossRef]
- Li, Z.Y.; Pan, Z.D.; Wang, Y.M. Enhanced adsorption of cationic Pb(II) and anionic Cr(VI) ions in aqueous solution by amino-modified nano-sized illite-smectite clay. Environ. Sci. Pollut. Res. 2019, 26, 11126–11139. [Google Scholar] [CrossRef]
- Sun, L.M.; Wang, J.S.; Wu, J.S.; Wang, T.N.; Du, Y.C.; Li, Y.L.; Li, H.Y. Constructing nanostructured silicates on diatomite for Pb(II) and Cd(II) removal. J. Mater. Sci. 2019, 54, 6882–6894. [Google Scholar] [CrossRef]
- Ciosek, A.L.; Luk, G.K. Kinetic Modelling of the Removal of Multiple Heavy Metallic Ions from Mine Waste by Natural Zeolite Sorption. Water 2017, 9, 482. [Google Scholar] [CrossRef]
- Tomasz, K.; Anna, K.; Ryszard, C. Effective adsorption of lead ions using fly ash obtained in the novel circulating fluidized bed combustion technology. Microchem. J. 2019, 145, 1011–1025. [Google Scholar] [CrossRef]
- Koz, B.; Cevik, U. Lead adsorption capacity of some moss species used for heavy metal analysis. Ecol. Indic. 2014, 36, 491–494. [Google Scholar] [CrossRef]
- Dizadji, N.; Anaraki, N.A. Adsorption of chromium and copper in aqueous solutions using tea residue. Int. J. Environ. Sci. Technol. 2011, 8, 631–638. [Google Scholar] [CrossRef]
- Da Gama, B.M.V.; Do Nascimento, G.E.; Sales, D.C.S.; Rodriguez-Diaz, J.M.; Barbosa, C.M.B.D.; Duarte, M.M.M.B. Mono and binary component adsorption of phenol and cadmium using adsorbent derived from peanut shells. J. Clean. Prod. 2018, 201, 219–228. [Google Scholar] [CrossRef]
- Amin, M.T.; Alazba, A.A.; Shafiq, M. Adsorptive Removal of Reactive Black 5 from Wastewater Using Bentonite Clay: Isotherms, Kinetics and Thermodynamics. Sustainability 2015, 7, 15302–15318. [Google Scholar] [CrossRef]
- Mohajeri, P.; Smith, C.; Selamat, M.R.; Aziz, H.A. Enhancing the Adsorption of Lead (II) by Bentonite Enriched with pH-Adjusted Meranti Sawdust. Water 2018, 10, 1875. [Google Scholar] [CrossRef]
- Deng, G.R.; Ma, J.C.; Zhang, X.P.; Zhang, Q.F.; Xiao, Y.Q.; Ma, Q.L.; Wang, S.B. Magnetic natural composite Fe3O4-chitosan@bentonite for removal of heavy metals from acid mine drainage. J. Colloid Interface Sci. 2019, 538, 132–141. [Google Scholar]
- Tsai, T.T.; Kao, C.M.; Wang, J.Y. Remediation of TCE-contaminated groundwater using acid/BOF slag enhanced chemical oxidation. Chemosphere 2011, 83, 687–692. [Google Scholar] [CrossRef]
- Molahid, V.L.M.; Kusin, F.M.; Madzin, Z. Role of multiple substrates (spent mushroom compost, ochre, steel slag, andlimestone) in passive remediation of metal-containing acid mine drainage. Environ. Technol. 2019, 40, 1323–1336. [Google Scholar] [CrossRef]
- Reddy, K.R.; Gopakumar, A.; Chetri, J.K. Critical review of applications of iron and steel slags for carbon sequestration and environmental remediation. Rev. Environ. Sci. Bio Technol. 2019, 18, 127–152. [Google Scholar] [CrossRef]
- Xiao, L.P.; Liu, Z.; Bai, J.C.; Luan, X.F.; Li, Y.; Wei, B. Zn2+ removal mechanism by bentonite-steel slag composite particles. J. China Coal Soc. 2017, 42, 1005–1012. [Google Scholar]
- Naidu, G.; Ryu, S.; Thiruvenkatachari, R.; Choi, Y.; Jeong, S.; Vigneswaran, S. A critical review on remediation, reuse, and resource recovery from acid mine drainage. Environ. Pollut. 2019, 247, 1110–1124. [Google Scholar] [CrossRef]
- Yuan, L.; Liu, Y.S. Removal of Pb(II) and Zn(II) from aqueous solution by ceramisite prepared by sintering bentonite, iron powder and activated carbon. Chem. Eng. J. 2013, 215, 432–439. [Google Scholar] [CrossRef]
- Chen, G.N.; Shah, K.J.; Shi, L.; Chiang, P.C. Removal of Cd(II) and Pb(II) ions from aqueous solutions by synthetic mineral adsorbent: Performance and mechanisms. Appl. Surf. Sci. 2017, 409, 296–305. [Google Scholar] [CrossRef]
- Dimitrova, S.V.; Mehandgiev, D.R. Lead removal from aqueous solutions by granulated blast-furnace slag. Water Res. 1998, 32, 3289–3292. [Google Scholar] [CrossRef]
- Zhao, D.L.; Sheng, G.D.; Hu, J. The adsorption of Pb(II) on Mg2Al layered double hydroxide. Chem. Eng. J. 2011, 171, 167–174. [Google Scholar] [CrossRef]
- Wang, S.W.; Dong, Y.H.; He, M.L. Characterization of GMZ bentonite and its application in the adsorption of Pb(II) from aqueous solutions. Appl. Clay Sci. 2009, 43, 164–171. [Google Scholar] [CrossRef]
- Wang, Y.; Tang, X.W.; Chen, Y.M.; Zhan, L.T.; Li, Z.Z.; Tang, Q. Adsorption behavior and mechanism of Cd(II) on loess soil from China. J. Hazard. Mater. 2009, 172, 30–37. [Google Scholar] [CrossRef]
- Giles, C.H.; Smith, D.; Huitson, A. General treatment and classification of solute adsorption- isotherms. I. Theoretical. J. Colloid Interface Sci. 1974, 47, 755–765. [Google Scholar] [CrossRef]
- Tang, X.W.; Li, Z.Z.; Chen, Y.M.; Wang, Z.Q. Removal of Zn(II) from aqueous solution with natural Chinese loess: Behaviors and affecting factors. Desalination 2009, 249, 49–57. [Google Scholar] [CrossRef]


| Constituent | Mass Percentage (%) |
|---|---|
| SiO2 | 71.39 |
| Al2O3 | 14.4 |
| Na2O | 1.98 |
| Fe2O3 | 1.71 |
| MgO | 1.52 |
| CaO | 1.20 |
| K2O | 0.44 |
| TiO2 | <0.1 |
| Constituent | Mass Percentage (%) |
|---|---|
| Fe2O3 | 38.83 |
| CaO | 32.73 |
| SiO2 | 12.33 |
| MgO | 10 |
| MnO | 3.29 |
| P2O5 | 1.12 |
| Al2O3 | 0.18 |
| Constituent | Mass Percentage (%) |
|---|---|
| SiO2 | 43.34 |
| Al2O3 | 7.83 |
| CaO | 17.54 |
| MgO | 5.42 |
| MnO | 2.73 |
| P2O5 | 0.69 |
| Na2O | 1.42 |
| K2O | 0.19 |
| Fe2O3 | 18.98 |
| Surface area (m2 g−1) | 130.6 |
| pHpzc | 2.01 |
| C0 (mg L−1) | ||
|---|---|---|
| 200 | 300 | |
| Pseudo-first order kinetics | ||
| (mg g−1) | 10.26 | 24.36 |
| (×10−3 min−1) | 8.75 | 9.28 |
| 0.96 | 0.97 | |
| Pseudo-second order kinetics | ||
| (mg g−1) | 20.60 | 31.54 |
| (×10−3g mg−1 min−1) | 2.40 | 0.83 |
| 0.99 | 0.98 | |
| Intra-particle diffusion model | ||
| (mg g−1 min−1/2) | 1.56 | 1.46 |
| 2.58 | 6.24 | |
| R12 | 0.99 | 0.95 |
| (mg g−1 min−1/2) | 0.46 | 1.24 |
| 11.74 | 7.05 | |
| R22 | 0.94 | 0.99 |
| 278 K | 288 K | 298 K | 308 K | 318 K | |
|---|---|---|---|---|---|
| Langmuir isotherm | |||||
| (mg g−1) | 43.63 | 45.99 | 53.53 | 56.79 | 70.18 |
| (L mg−1) | 0.0047 | 0.0083 | 0.0105 | 0.0303 | 0.0856 |
| 0.999 | 0.999 | 0.997 | 0.995 | 0.996 | |
| Freundlich isotherm | |||||
| (L g−1) | 0.76 | 1.32 | 1.68 | 4.19 | 8.33 |
| 1.39 | 1.59 | 1.69 | 2.27 | 3.06 | |
| 0.992 | 0.987 | 0.986 | 0.971 | 0.955 | |
| D–R isotherm | |||||
| (mg g−1) | 107.06 | 146.99 | 214.69 | 238.96 | 310.42 |
| (mol2 kJ−2) | 0.0085 | 0.0068 | 0.0059 | 0.0039 | 0.0025 |
| (kJ mol−1) | −7.64 | −8.56 | −9.19 | −11.27 | −13.99 |
| 0.997 | 0.995 | 0.995 | 0.986 | 0.977 | |
| BET isotherm | |||||
| (mg g−1) | 43.61 | 45.97 | 53.46 | 56.69 | 70.00 |
| 0.999 | 0.999 | 0.997 | 0.995 | 0.996 |
| C0 (mg L−1) | T (K) | ΔG0 (kJ mol−1) | ΔH0 (kJ mol−1) | ΔS0 (J mol−1K−1) | R |
|---|---|---|---|---|---|
| 100 | 278 | −5.41 | 34.02 | 141.84 | 0.997 |
| 288 | −6.83 | ||||
| 298 | −8.25 | ||||
| 308 | −9.67 | ||||
| 318 | −11.09 | ||||
| 200 | 278 | −5.34 | 29.27 | 124.51 | 0.988 |
| 288 | −6.59 | ||||
| 298 | −7.83 | ||||
| 308 | −9.08 | ||||
| 318 | −10.32 | ||||
| 400 | 278 | −4.43 | 10.82 | 54.84 | 0.951 |
| 288 | −4.98 | ||||
| 298 | −5.53 | ||||
| 308 | −6.08 | ||||
| 318 | −6.62 | ||||
| 500 | 278 | −2.50 | 4.75 | 26.07 | 0.905 |
| 288 | −2.76 | ||||
| 298 | −3.02 | ||||
| 308 | −3.28 | ||||
| 318 | −3.54 | ||||
| 600 | 278 | −1.46 | 1.31 | 9.94 | 0.937 |
| 288 | −1.56 | ||||
| 298 | −1.65 | ||||
| 308 | −1.76 | ||||
| 318 | −1.85 |
© 2019 by the authors. Licensee MDPI, Basel, Switzerland. This article is an open access article distributed under the terms and conditions of the Creative Commons Attribution (CC BY) license (http://creativecommons.org/licenses/by/4.0/).
Share and Cite
Zhan, X.; Xiao, L.; Liang, B. Removal of Pb(II) from Acid Mine Drainage with Bentonite-Steel Slag Composite Particles. Sustainability 2019, 11, 4476. https://doi.org/10.3390/su11164476
Zhan X, Xiao L, Liang B. Removal of Pb(II) from Acid Mine Drainage with Bentonite-Steel Slag Composite Particles. Sustainability. 2019; 11(16):4476. https://doi.org/10.3390/su11164476
Chicago/Turabian StyleZhan, Xinhui, Liping Xiao, and Bing Liang. 2019. "Removal of Pb(II) from Acid Mine Drainage with Bentonite-Steel Slag Composite Particles" Sustainability 11, no. 16: 4476. https://doi.org/10.3390/su11164476
APA StyleZhan, X., Xiao, L., & Liang, B. (2019). Removal of Pb(II) from Acid Mine Drainage with Bentonite-Steel Slag Composite Particles. Sustainability, 11(16), 4476. https://doi.org/10.3390/su11164476