Closed-Loop Supply Chain Network Equilibrium Model with Subsidy on Green Supply Chain Technology Investment
Abstract
1. Introduction
2. Literature Review
2.1. Green Technsology Investment of Supply Chain
2.2. Government Subsidies Based on Technology Investment of the Green Supply Chain
2.3. Supply Chain Network Equilibrium
3. Problem Statement and Formulation
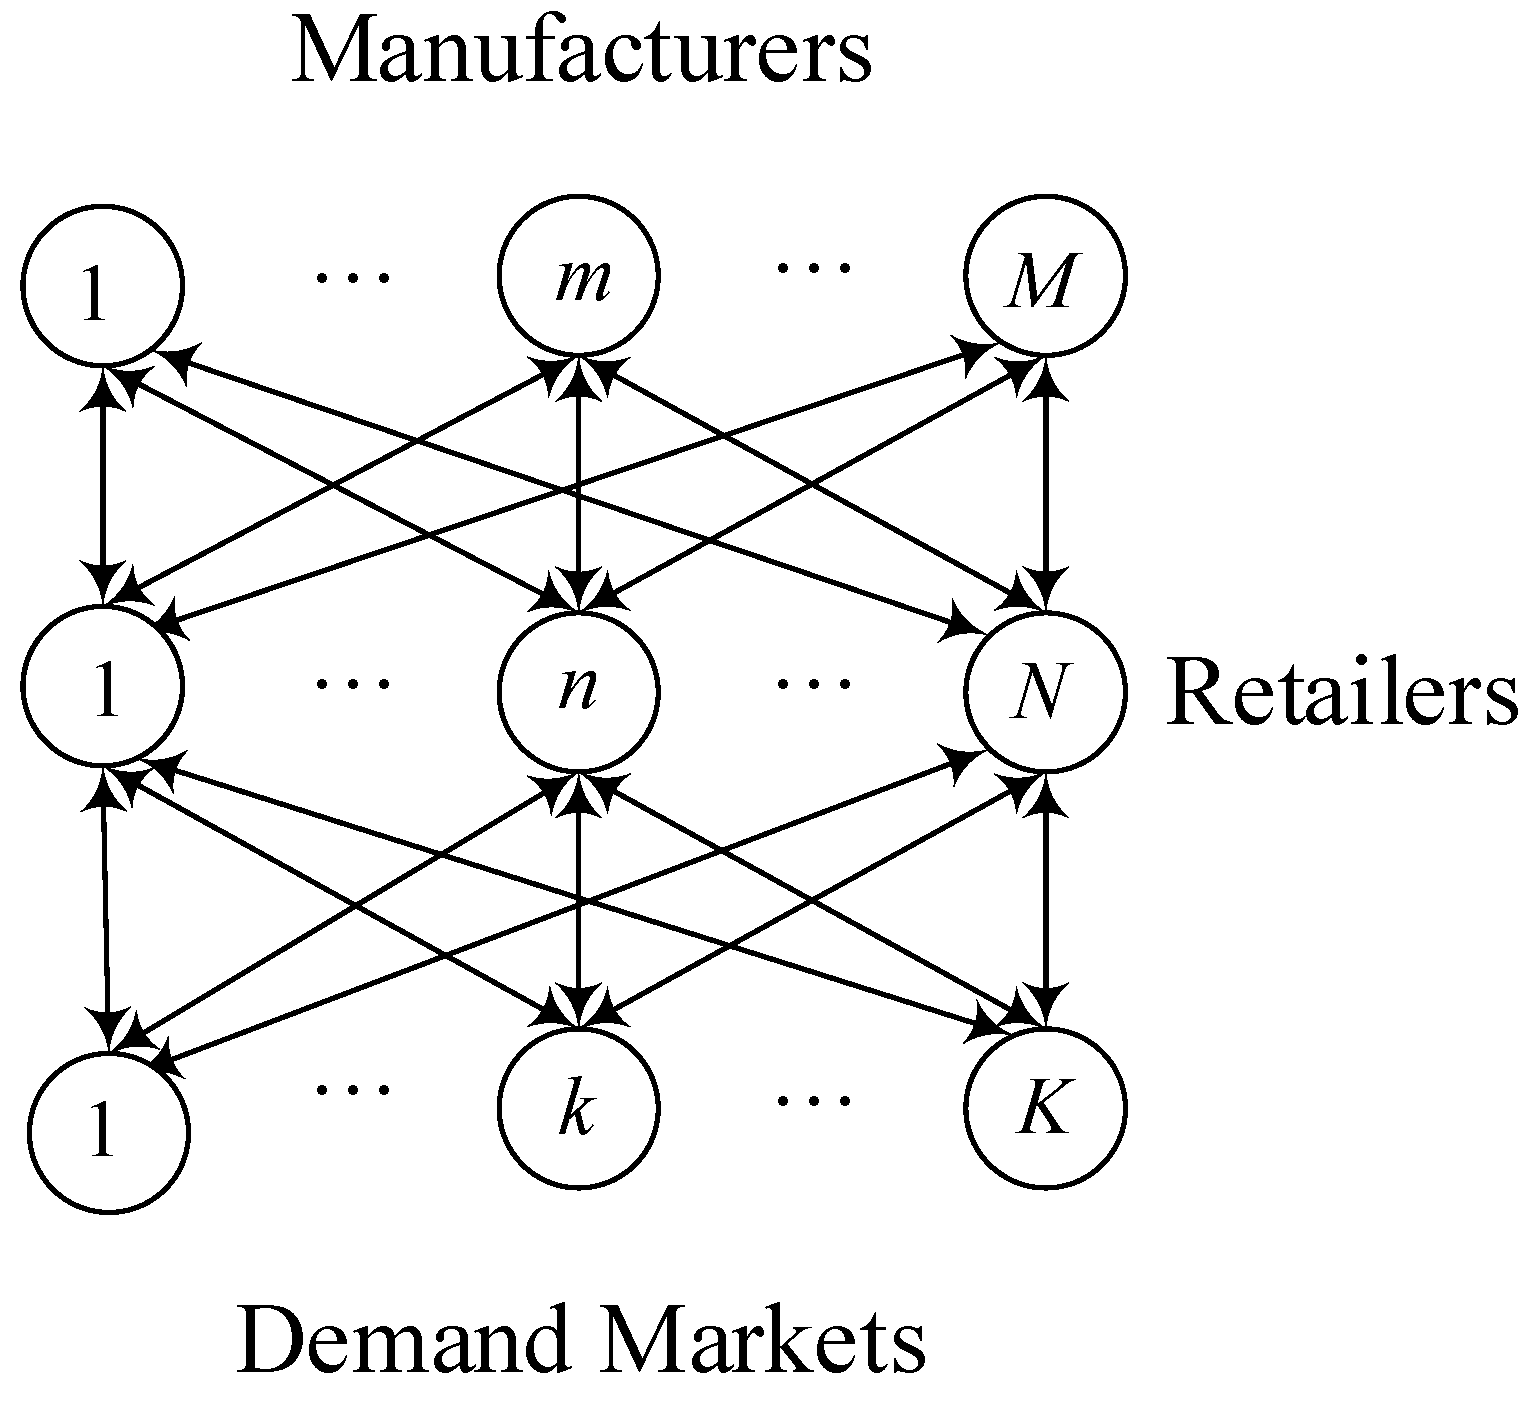
3.1. Problem Description
3.2. Model Assumptions
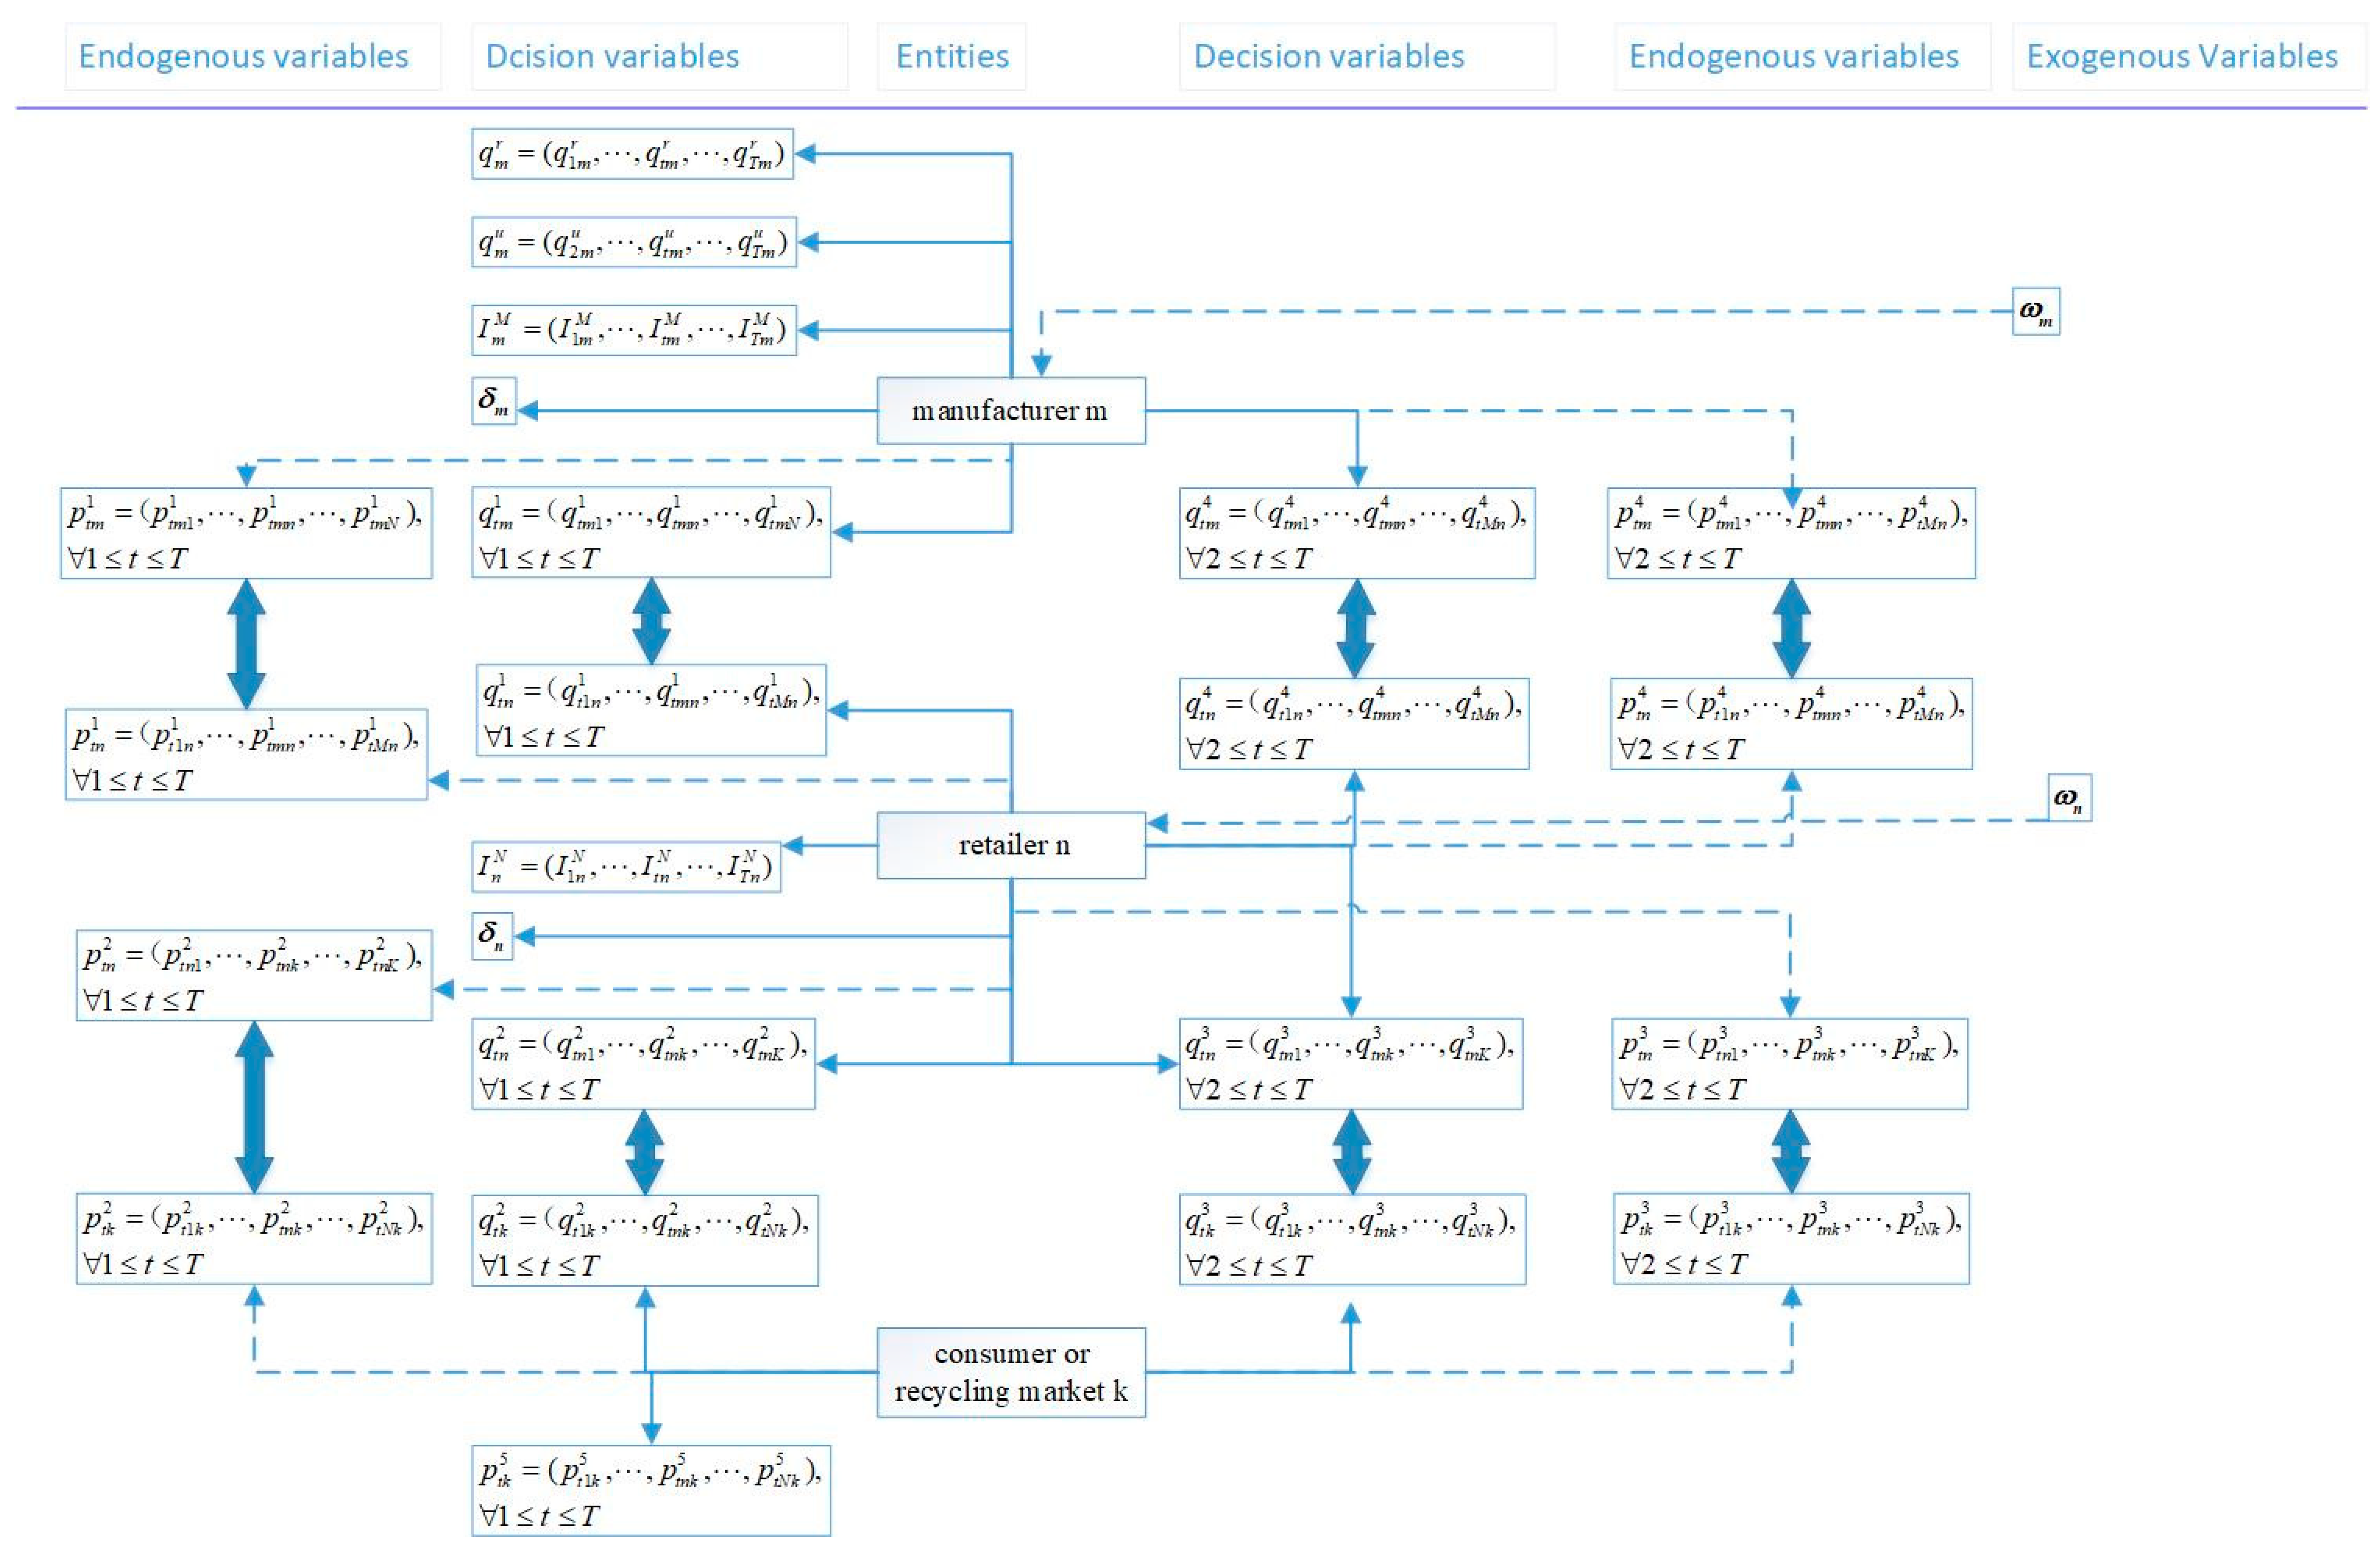
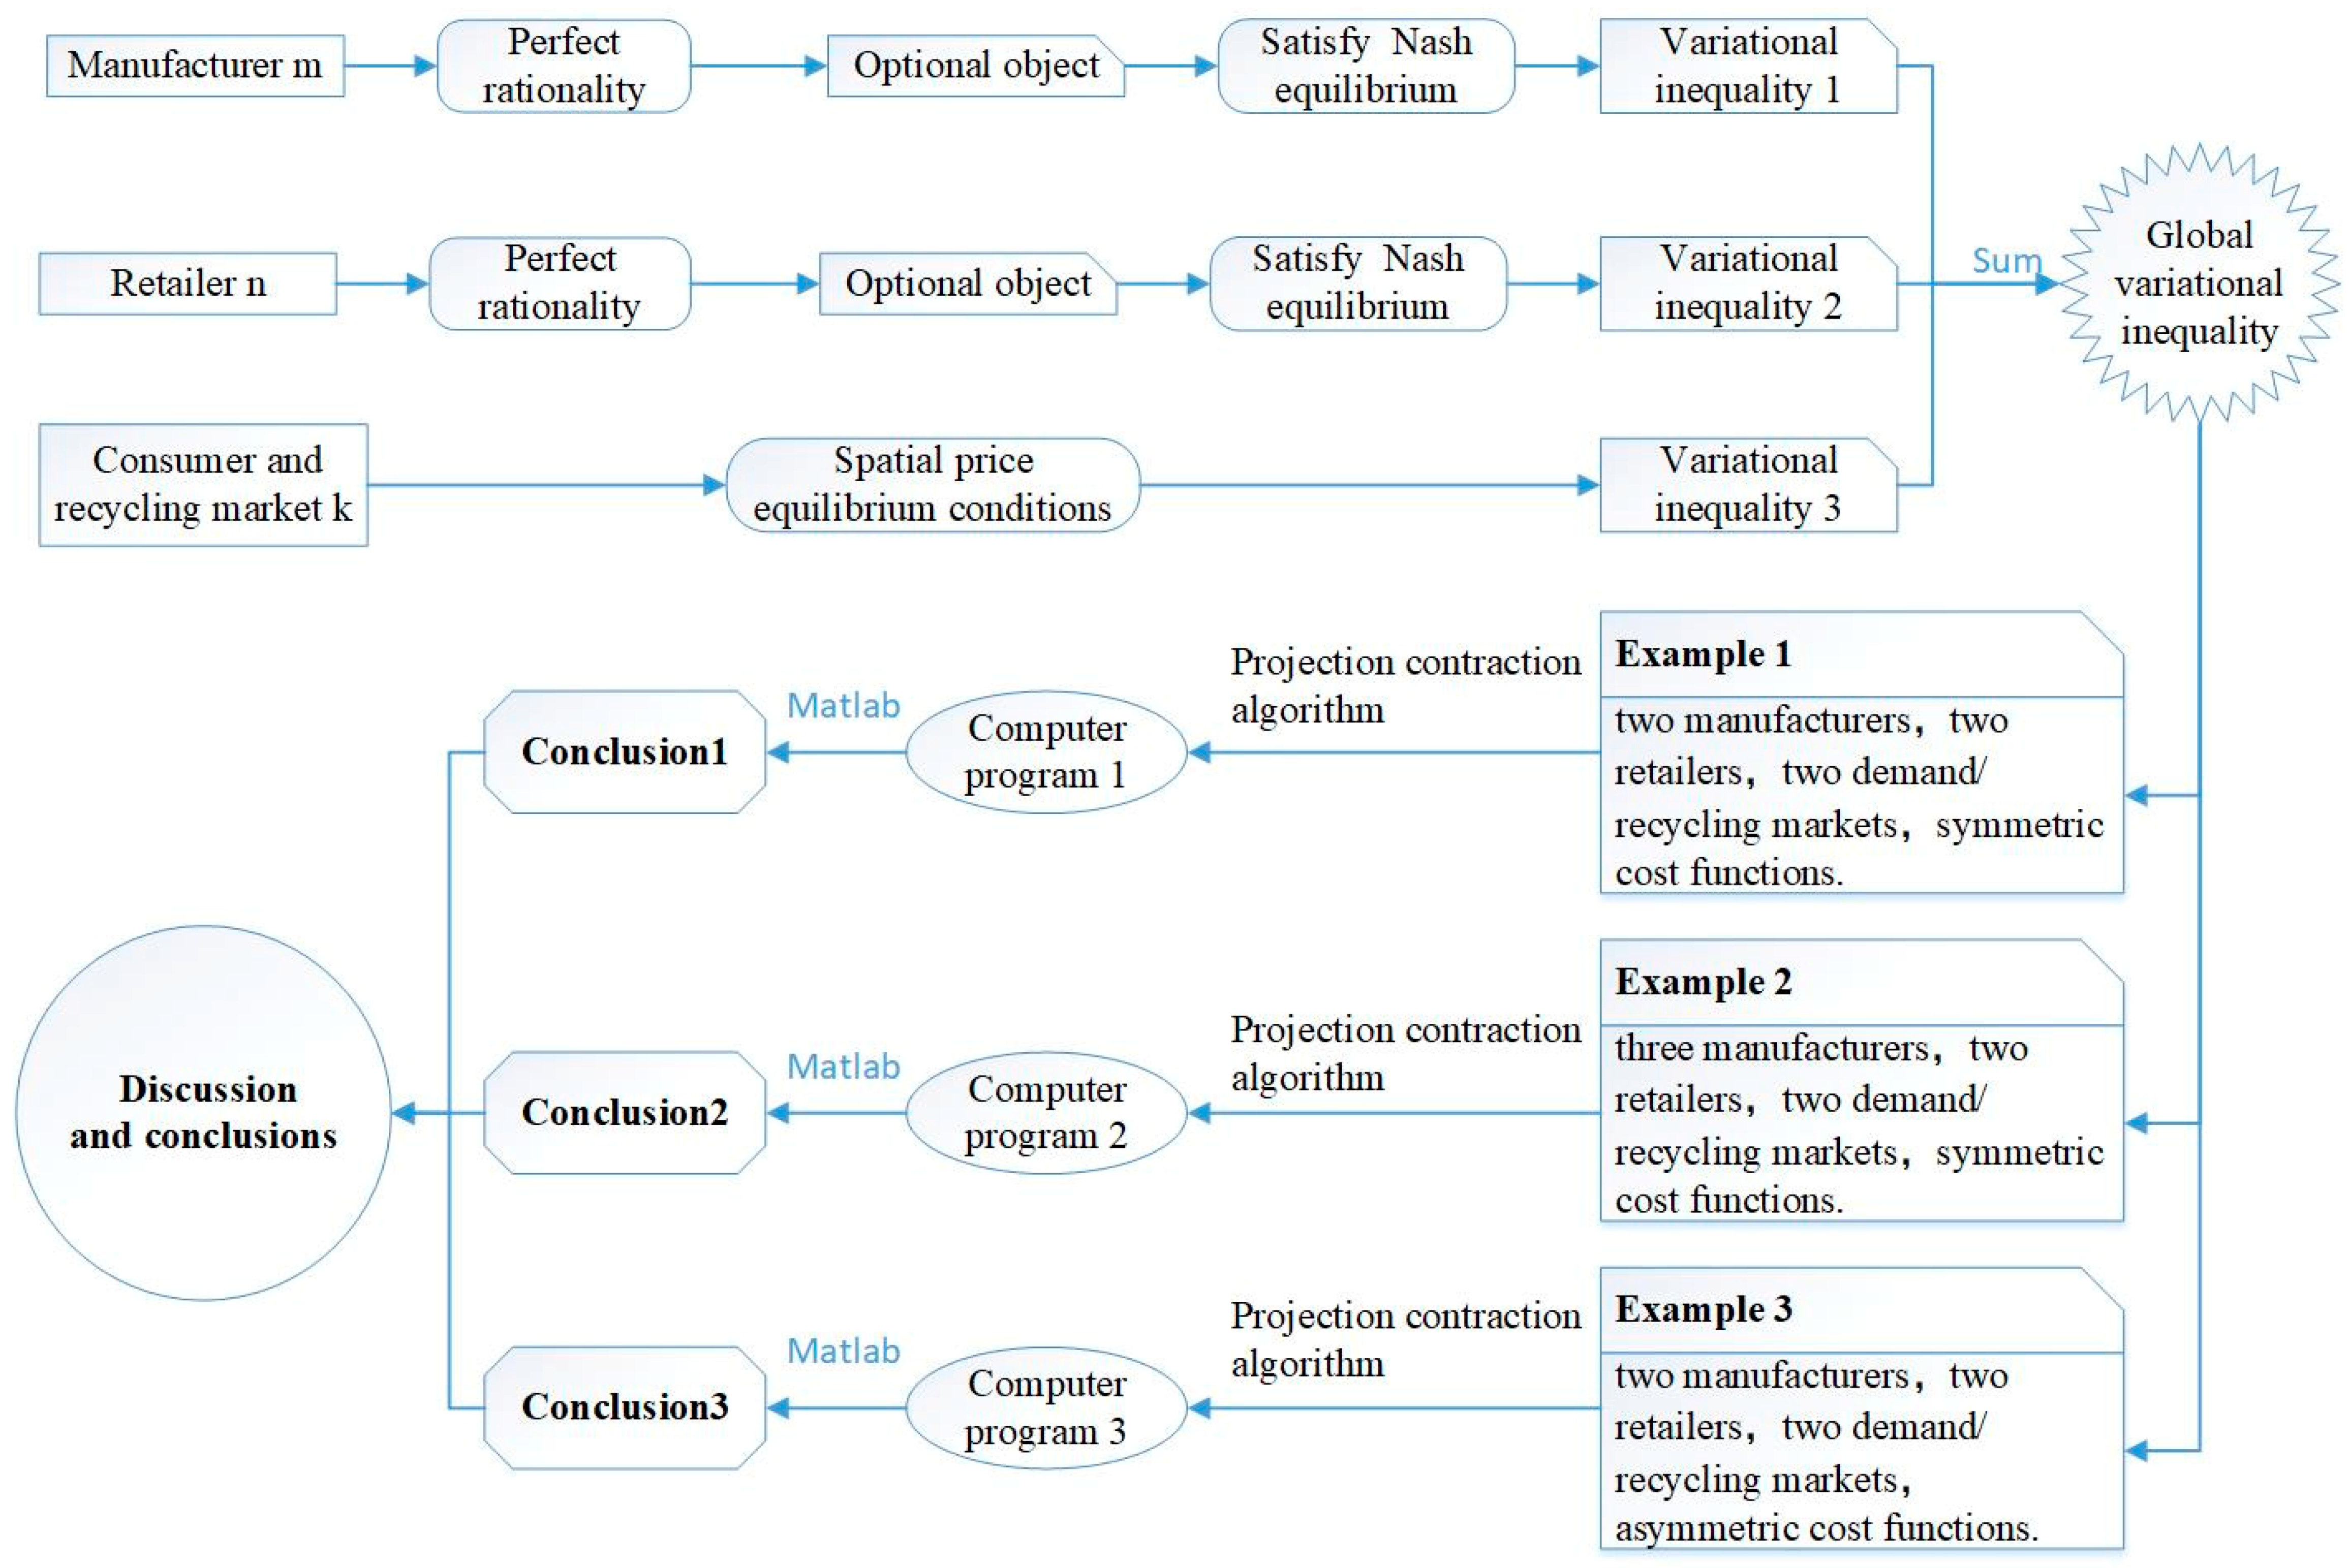
3.3. Notations and Technical Scheme
 ” means that when the model reaches equilibrium, the volumes and prices related to transactions between upper and lower layers must be coincident, the amount of material shipped out must be equal to the amount shipped in, and the price which is willingly paid must be equal to that willingly accepted.
4. Variational Inequality Equilibrium Model for Multi-Period Closed-loop Supply Chain Networks
4.1. Behavior of the Manufacturers and Their Equilibrium Conditions
4.2. Behavior of the Retailers and Their Equilibrium Conditions
4.3. Behavior of the Consumer Markets and Recycling Markets and Their Equilibrium Conditions
4.4. Multiphase Closed-Loop Supply Chain Network Equilibrium Model
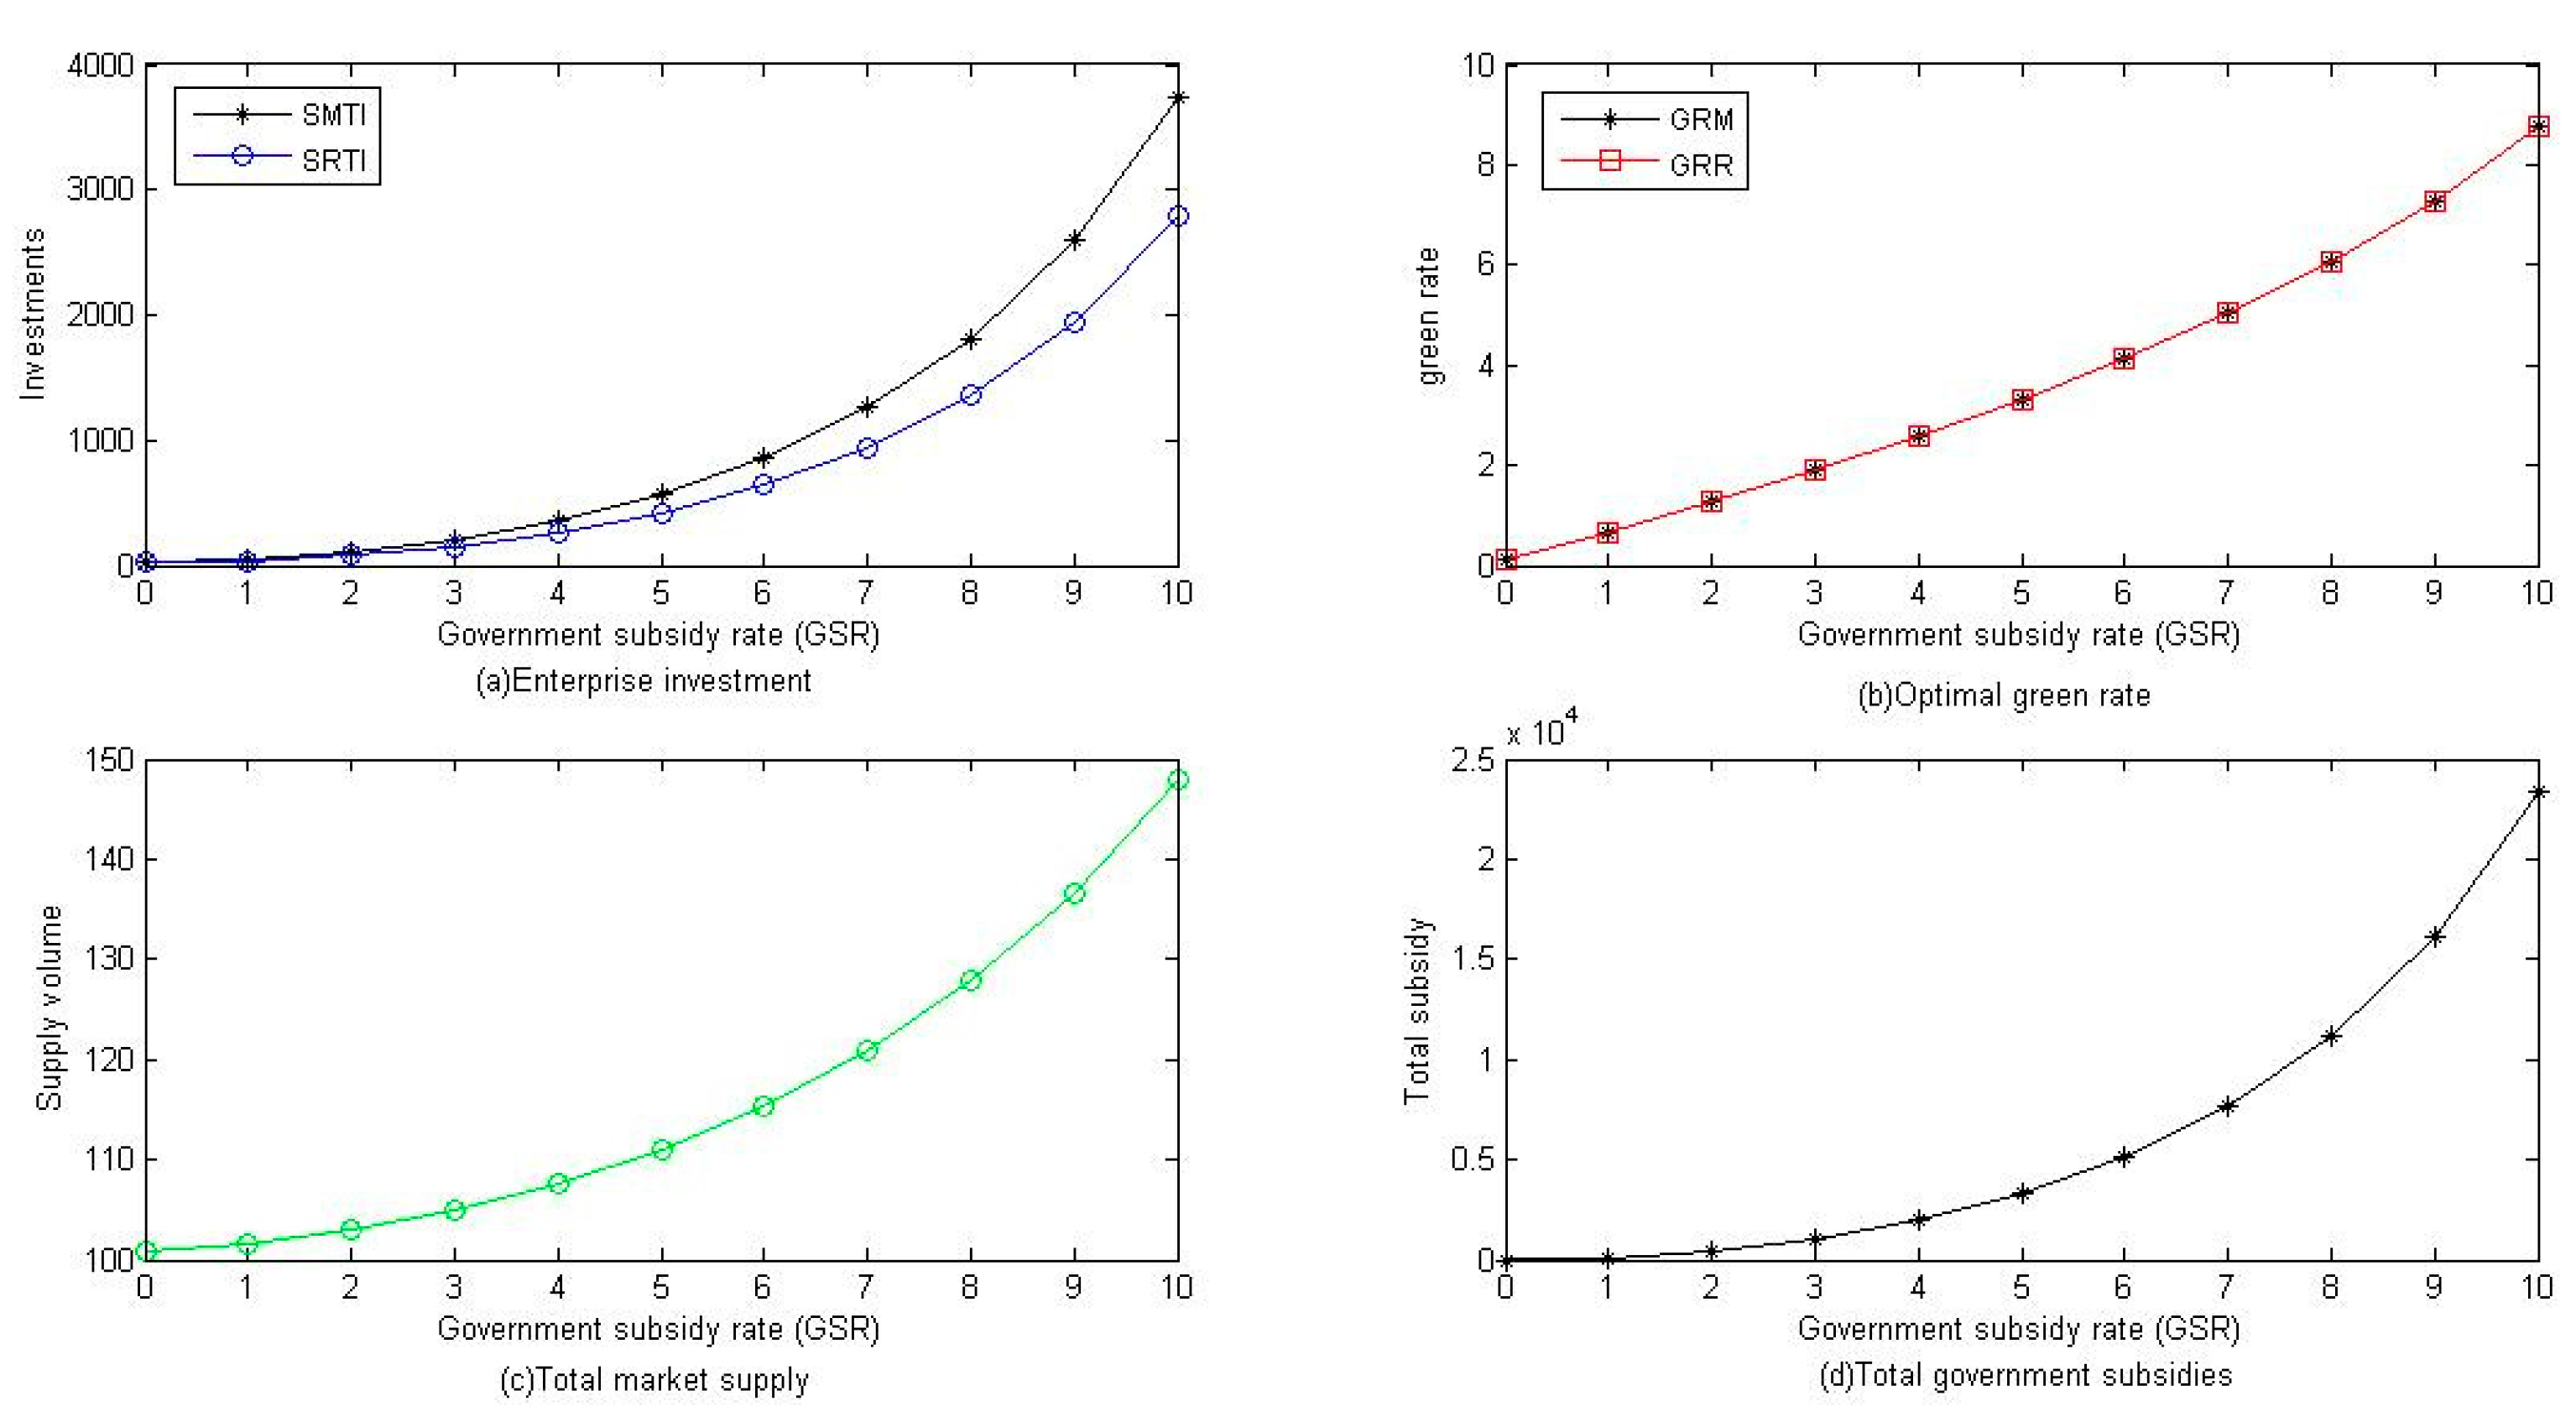
5. Numerical Analysis
6. Discussion
7. Conclusions
Author Contributions
Funding
Conflicts of Interest
References
- Saunila, M.; Rantala, T.; Ukko, J.; Havukainen, J. Why invest in green technologies? Sustainability engagement among small businesse. Technol. Anal. Strateg. Manag. 2018, 31, 653–666. [Google Scholar] [CrossRef]
- Li, G.; Wang, X.; Su, S.; Su, Y. How green technological innovation ability influences enterprise competitiveness. Technol. Soc. 2019. [Google Scholar] [CrossRef]
- Sarkis, J. Greening the Supply Chain; Springer: Berlin, Germany, 2006. [Google Scholar]
- Siemens. Sustainability Information. 2018. Available online: https://www.siemens.com/investor/pool/en/investor_relations/siemens_sustainability_information2018.pdf (accessed on 13 August 2019).
- Saberi, S.; Cruz, J.M.; Sarkis, J.; Nagurney, A. A competitive multiperiod supply chain network model with freight carriers and green technology investment option. Eur. J. Oper. Res. 2018, 266, 934–949. [Google Scholar] [CrossRef]
- Fehrenbacher, K. How big companies are reducing emissions and making money. Technical Report. 28 September 2015. Available online: https://fortune.com/2015/09/28/carbon-emissions-seimens-dell/ (accessed on 12 August 2019).
- Meng, B.; Liu, Y.; Andrew, R.; Zhou, M.; Hubacek, K.; Xue, J.; Peters, G.; Gao, Y. More than half of China’s CO₂ emissions are from micro, small and medium-sized enterprises. Appl. Energy 2018, 230, 712–725. [Google Scholar] [CrossRef]
- Giri, B.C.; Mondal, C.; Maiti, T. Analysing a closed-loop supply chain with selling price, warranty period and green sensitive consumer demand under revenue sharing contract. J. Clean. Prod. 2018, 190, 822–837. [Google Scholar] [CrossRef]
- Doval, E.; Negulescu, O. A Model of Green Investments Approach. Procedia Econ. Financ. 2014, 15, 847–852. [Google Scholar] [CrossRef]
- Gurnani, H.; Erkoc, M.; Luo, Y. Impact of product pricing and timing of investment decisions on supply chain co-opetition. Eur. J. Oper. Res. 2007, 180, 228–248. [Google Scholar] [CrossRef]
- Yang, D.; Xiao, T.; Huang, J. Dual-channel structure choice of an environmental responsibility supply chain with green investment. J. Clean. Prod. 2019, 210, 134–145. [Google Scholar] [CrossRef]
- Stucki, T. Which firms benefit from investments in green energy technologies—The effect of energy costs. Res. Policy 2019, 48, 546–555. [Google Scholar] [CrossRef]
- Ma, P.; Zhang, C.; Hong, X.; Xu, H. Pricing decisions for substitutable products with green manufacturing in a competitive supply chain. J. Clean. Prod. 2018, 183, 618–640. [Google Scholar] [CrossRef]
- Zhang, J.; Liu, G.; Zhang, Q.; Bai, Z. Coordinating a supply chain for deteriorating items with a revenue sharing and cooperative investment contract. Omega 2015, 56, 37–49. [Google Scholar] [CrossRef]
- Jin, W.; Zhang, H.; Liu, S.; Zhang, H. Technological innovation, environmental regulation, and green total factor efficiency of industrial water resources. J. Clean. Prod. 2019, 211, 61–69. [Google Scholar] [CrossRef]
- Yan, B.; Shi, S.; Ye, B.; Zhou, X.; Shi, P. Sustainable development of the fresh agricultural products supply chain through the application of RFID technology. Inf. Technol. Manag. 2015, 16, 67–78. [Google Scholar] [CrossRef]
- Yang, H.; Miao, L.; Zhao, C. The credit strategy of a green supply chain based on capital constraints. J. Clean. Prod. 2019, 224, 930–939. [Google Scholar] [CrossRef]
- Cai, W.; Lai, K.; Liu, C.; Wei, F.; Ma, M.; Jia, S.; Jiang, Z.; Lv, L. Promoting sustainability of manufacturing industry through the lean energy-saving and emission-reduction strategy. Sci. Total Environ. 2019, 665, 23–32. [Google Scholar] [CrossRef] [PubMed]
- Mitra, S.; Webster, S. Competition in remanufacturing and the effects of government subsidies. Int. J. Prod Econ. 2008, 111, 287–298. [Google Scholar] [CrossRef]
- Madani, S.R.; Rasti-Barzoki, M. Sustainable supply chain management with pricing, greening and governmental tariffs determining strategies: A game-theoretic approach. Comput. Ind. Eng. 2017, 105, 287–298. [Google Scholar] [CrossRef]
- Yi, Y.; Li, J. The effect of governmental policies of carbon taxes and energy-saving subsidies on enterprise decisions in a two-echelon supply chain. J. Clean. Prod. 2018, 181, 675–691. [Google Scholar]
- Wan, N.; Hong, D. The impacts of subsidy policies and transfer pricing policies on the closed-loop supply chain with dual collection channels. J. Clean. Prod. 2019, 224, 881–891. [Google Scholar] [CrossRef]
- Chen, J.; Dimitrov, S.; Pun, H. The impact of government subsidy on supply Chains’ sustainability innovation. Omega 2019, 86, 42–58. [Google Scholar] [CrossRef]
- Liu, Y.; Quan, B.; Xu, Q.; Forrest, J.Y. Corporate social responsibility and decision analysis in a supply chain through government subsidy. J. Clean. Prod. 2019, 208, 436–447. [Google Scholar] [CrossRef]
- Gao, J.; Xiao, Z.; Wei, H.; Zhou, G. Active or passive? Sustainable manufacturing in the direct-channel green supply chain: A perspective of two types of green product designs. Trans. Res. Part D Trans. Environ. 2018, 65, 332–354. [Google Scholar] [CrossRef]
- Giri, R.N.; Mondal, S.K.; Maiti, M. Government intervention on a competing supply chain with two green manufacturers and a retailer. Comput. Ind. Eng. 2019, 128, 104–121. [Google Scholar] [CrossRef]
- Sun, H.; Wan, Y.; Zhang, L.; Zhou, Z. Evolutionary game of the green investment in a two-echelon supply chain under a government subsidy mechanism. J. Clean. Prod. 2019, 235, 1315–1326. [Google Scholar] [CrossRef]
- Liu, C.; Huang, W.; Yang, C. The evolutionary dynamics of China’s electric vehicle industry—Taxes vs. subsidies. Comput. Ind. Eng. 2017, 113, 103–122. [Google Scholar] [CrossRef]
- Chen, W.; Hu, Z. Using evolutionary game theory to study governments and manufacturers’ behavioral strategies under various carbon taxes and subsidies. J. Clean. Prod. 2018, 201, 123–141. [Google Scholar] [CrossRef]
- Bai, Y.; Song, S.; Jiao, J.; Yang, R. The impacts of government RD subsidies on green innovation: Evidence from Chinese energy-intensive firms. J. Clean. Prod. 2019, 233, 819–829. [Google Scholar]
- Bai, Y.; Hua, C.; Jiao, J.; Yang, M.; Li, F. Green efficiency and environmental subsidy: Evidence from thermal power firms in China. J. Clean. Prod. 2018, 188, 49–61. [Google Scholar] [CrossRef]
- Yang, X.; He, L.; Xia, Y.; Chen, Y. Effect of government subsidies on renewable energy investments: The threshold effect. Energy Policy 2019, 132, 156–166. [Google Scholar] [CrossRef]
- Nicolini, M.; Tavoni, M. Are renewable energy subsidies effective? Evidence from Europe. Renew. Sustain. Energy Rev. 2017, 74, 412–423. [Google Scholar] [CrossRef]
- Huang, Z.; Liao, G.; Li, Z. Loaning scale and government subsidy for promoting green innovation. Technol. Forecasting Soc. Chang. 2019, 144, 148–156. [Google Scholar] [CrossRef]
- Xia, Q.; Jin, M.; Wu, H.; Yang, C. A DEA-based decision framework to determine the subsidy rate of emission reduction for local government. J. Clean. Prod. 2018, 202, 846–852. [Google Scholar] [CrossRef]
- Yu, Y.; Han, X.; Hu, G. Optimal production for manufacturers considering consumer environmental awareness and green subsidies. Int. J. Prod. Econ. 2016, 182, 397–408. [Google Scholar] [CrossRef]
- Nagurney, A.; Dong, J.; Zhang, D. A supply chain network equilibrium model. Trans. Res. Part E 2002, 38, 281–303. [Google Scholar] [CrossRef]
- Nagurney, A.; Loo, J.; Dong, J.; Zhang, D. Supply Chain Networks and Electronic Commerce: A Theoretical Perspective. Netnomics 2002, 4, 187–220. [Google Scholar] [CrossRef]
- Dong, J.; Zhang, D.; Nagurney, A. Supply Chain Networks with Multicriteria Decision Makers; Emerald Group Publishing Limited: Adelaide, Australia, 2002; pp. 179–196. [Google Scholar]
- Nagurney, A.; Toyasaki, F. Supply chain supernetworks and environmental criteria. Trans. Res. Part D Trans. Environ. 2003, 8, 185–213. [Google Scholar] [CrossRef]
- Cruz, J.M. Dynamics of supply chain networks with corporate social responsibility through integrated environmental decision-making. Eur. J. Oper. Res. 2008, 184, 1005–1031. [Google Scholar] [CrossRef]
- Dong, J.; Zhang, D.; Nagurney, A. A supply chain network equilibrium model with random demands. Eur. J. Oper. Res. 2004, 156, 194–212. [Google Scholar] [CrossRef]
- Chan, C.K.; Zhou, Y.; Wong, K.H. An equilibrium model of the supply chain network under multi-attribute behaviors analysis. Eur. J. Oper. Res. 2019, 275, 514–535. [Google Scholar] [CrossRef]
- Zhang, G.T.; Zhong, Y.G.; Sun, H.; Hu, J.S.; Dai, G.X. Multi-period closed-loop supply chain network equilibrium with carbon emission constraints. Resour. Conserv. Recycl. 2015, 104, 354–365. [Google Scholar]
- Nagurney, A.; Yu, M.; Floden, J. Supply chain network sustainability under competition and frequencies of activities from production to distribution. Comput. Manag. Sci. 2013, 10, 397–422. [Google Scholar] [CrossRef]
- Zakeri, A.; Dehghanian, F.; Fahimnia, B.; Sarkis, J. Carbon pricing versus emissions trading: A supply chain planning perspective. Int. J. Prod. Econ. 2015, 164, 197–205. [Google Scholar] [CrossRef]
- Hammond, D.; Beullens, P. Closed-loop supply chain network equilibrium under legislation. Eur. J. Oper. Res. 2007, 183, 895–908. [Google Scholar] [CrossRef]
- He, B. A Class of Projection and Contraction Methods for Monotone Variational Inequalities. Appl. Math. Optim. 1997, 35, 69–76. [Google Scholar] [CrossRef]
- Li, Y.; Zhang, Q.; Liu, B.; Mclellan, B.; Gao, Y.; Tang, Y. Substitution effect of New-Energy Vehicle Credit Program and Corporate Average Fuel Consumption Regulation for Green-car Subsidy. Energy 2018, 152, 223–236. [Google Scholar] [CrossRef]
| Notations | Descriptions |
|---|---|
| A specific period, a specific manufacturer, a specific retailer and a specific demand market, where: , , , . | |
| Supply chain net present value (NPV) discount rate. | |
| , , | The conversion rate of raw materials to products (manufacture conversion rate), the conversion rate of waste materials to new products (remanufacture conversion rate), and the ratio of rec products to reusable materials at retailers (reusable conversion rate), |
| The green rate of manufacturer m and retailer n respectively, and the minimum green degree that retailer must achieve in order to meet the government’s minimum environmental requirements. The higher the value of greenness, the more energy and resources are saved, and the less harmful to the environment. The first two constitute dimension column vectors and dimension column vectors respectively. | |
| The subsidization rates of the government to manufacturer and retailer per unit green degree product. | |
| Unit waste product or waste material treatment fee. | |
| The highest recovery rate of waste products in the consumer market k of the period t. | |
| Material utilization of manufacturer m in phase t. Such quantity of manufacturer m in each period constitutes dimension column vector , these category quantity of each manufacturer and each phase constitutes a dimension column vector , and these category quantity of phase t constitutes dimension column vector . | |
| Recycled material utilization of manufacturer m phase t. Such quantity of manufacturer m in each period constitutes a dimension column vector , the category quantity of each manufacturer and each phase constitutes a dimension column vector , and the category quantity of phase t constitutes an dimension column vector | |
| The volume and price of product transactions between manufacturer m and retailer n in period t, respectively. Such transaction quantity of manufacturer m in each period constitutes a dimension column vector . Such transaction quantity of retailer n in each period constitutes a dimension column vector . The category volume and price of transaction products between every pair of manufacturers and retailers in every period constitutes a dimension column vector and , respectively. The category volume and price of phase t also constitutes an dimension column vector and , respectively. | |
| The volume and price of product transactions between retailer n and consumers in demand market k in the period t, respectively. Such transaction quantity of retailer n in each period constitutes a dimension column vector , the category volume and price of transaction products between every pair of retailers and markets in every period constitutes a dimension column vector and , respectively, and the category volume and price of phase t constitutes an dimension column vector and , respectively. | |
| The volume and price of recycling product transactions between retailer n and consumers in market k in the period t, respectively. Such transaction quantity of retailer n in each period constitutes a dimension column vector , the category volume and price of transaction products between every pair of retailers and markets in every period constitutes a dimension column vector and , respectively, and the category volume and price of phase t constitutes an dimension column vector and , respectively. | |
| The volume and price of recycling material transactions between manufacturer m and retailer n in period t, respectively. Such transaction quantity of manufacturer m in each period constitutes a dimension column vector . Such transaction quantity of retailer n in each period constitutes a dimension column vector , and the category volume and price of transaction products between every pair of manufacturers and retailers in every period constitutes a dimension column vector and , respectively. The category volume and price of period t also constitutes an dimension column vector and , respectively. | |
| , | The prices of products that consumers in market k are willing to pay and the corresponding demand amount sold by retailers n. The price that consumers in all consumer markets are willing to pay in period t constitutes an dimension vector , and the category prices related to every retailer in every period constitutes a dimension column vector . is assumed to be a monotonic decreasing function of . In order to reflect consumers’ preference for green products, we assume that is a monotonic increasing function of green degree . |
| , | Inventory quantities of manufacturer m and retailer n in period t. The inventory of every manufacturer and every retailer in each period constitutes a dimension column vector and dimension column vector , respectively. The category inventory of period t constitutes an dimension column vector and dimension column vector , respectively. |
| The manufacturing cost function of the manufacturer m in period t, which is the continuous differentiable convex function of . It also depends on manufacture conversion rate and manufacturer m’s green degree . | |
| The remanufacturing cost function of manufacturer m from using raw materials in period t, which is assumed to be the continuous differentiable convex function of . It also depends on remanufacture conversion rate and manufacturer m’s green degree . | |
| The product transaction costs assumed by manufacturer m and retailer n, respectively, which are associated with the product transactions between them, and are assumed as the continuous differentiable convex functions of . | |
| The recycling material transaction costs assumed by manufacturer m and retailer n, respectively, which are associated with the recycling material transactions between them, and are assumed as the continuous differentiable convex functions of . | |
| The product transaction costs assumed by retailer n and consumers in market k, respectively, which are associated with the product transactions between them, and are assumed as the continuous differentiable convex functions of . | |
| The recycling product transaction costs assumed by retailer n, which are associated with the recycling product transaction between retailer n and consumers in market k, and are assumed as the continuous differentiable convex functions of . | |
| Retailer n’s product exhibition and advertising expenses in period t. In order to reflect competition, let it depend on , the entire product transaction vector between all retailers and consumers in period t, and which is the continuous differentiable convex function of , the product ship between retailer n and consumers on each market k in period t. | |
| The cost of disassembling, cleaning and picking of recycled products assumed by retailer n in period t. In order to reflect competition, suppose it depends on , the entire transaction volume vector on this layer, and is the continuous differentiable convex function of . | |
| The GSC technology investment of manufacturer m and retailer n, assumed as the continuous differentiable convex function of and , respectively. | |
| The inventory cost of manufacturer m and retailer n, assumed as the continuous differentiable convex function of and , respectively. | |
| The negative utility of consumers in market k when returning used products in period t, reflecting the consumers’ feeling of aversion at the above process, is a monotonic increasing function of . In order to reflect competition, it is assumed to depend on , a vector grouped by all the recycling products between retailers and consumers in period t. |
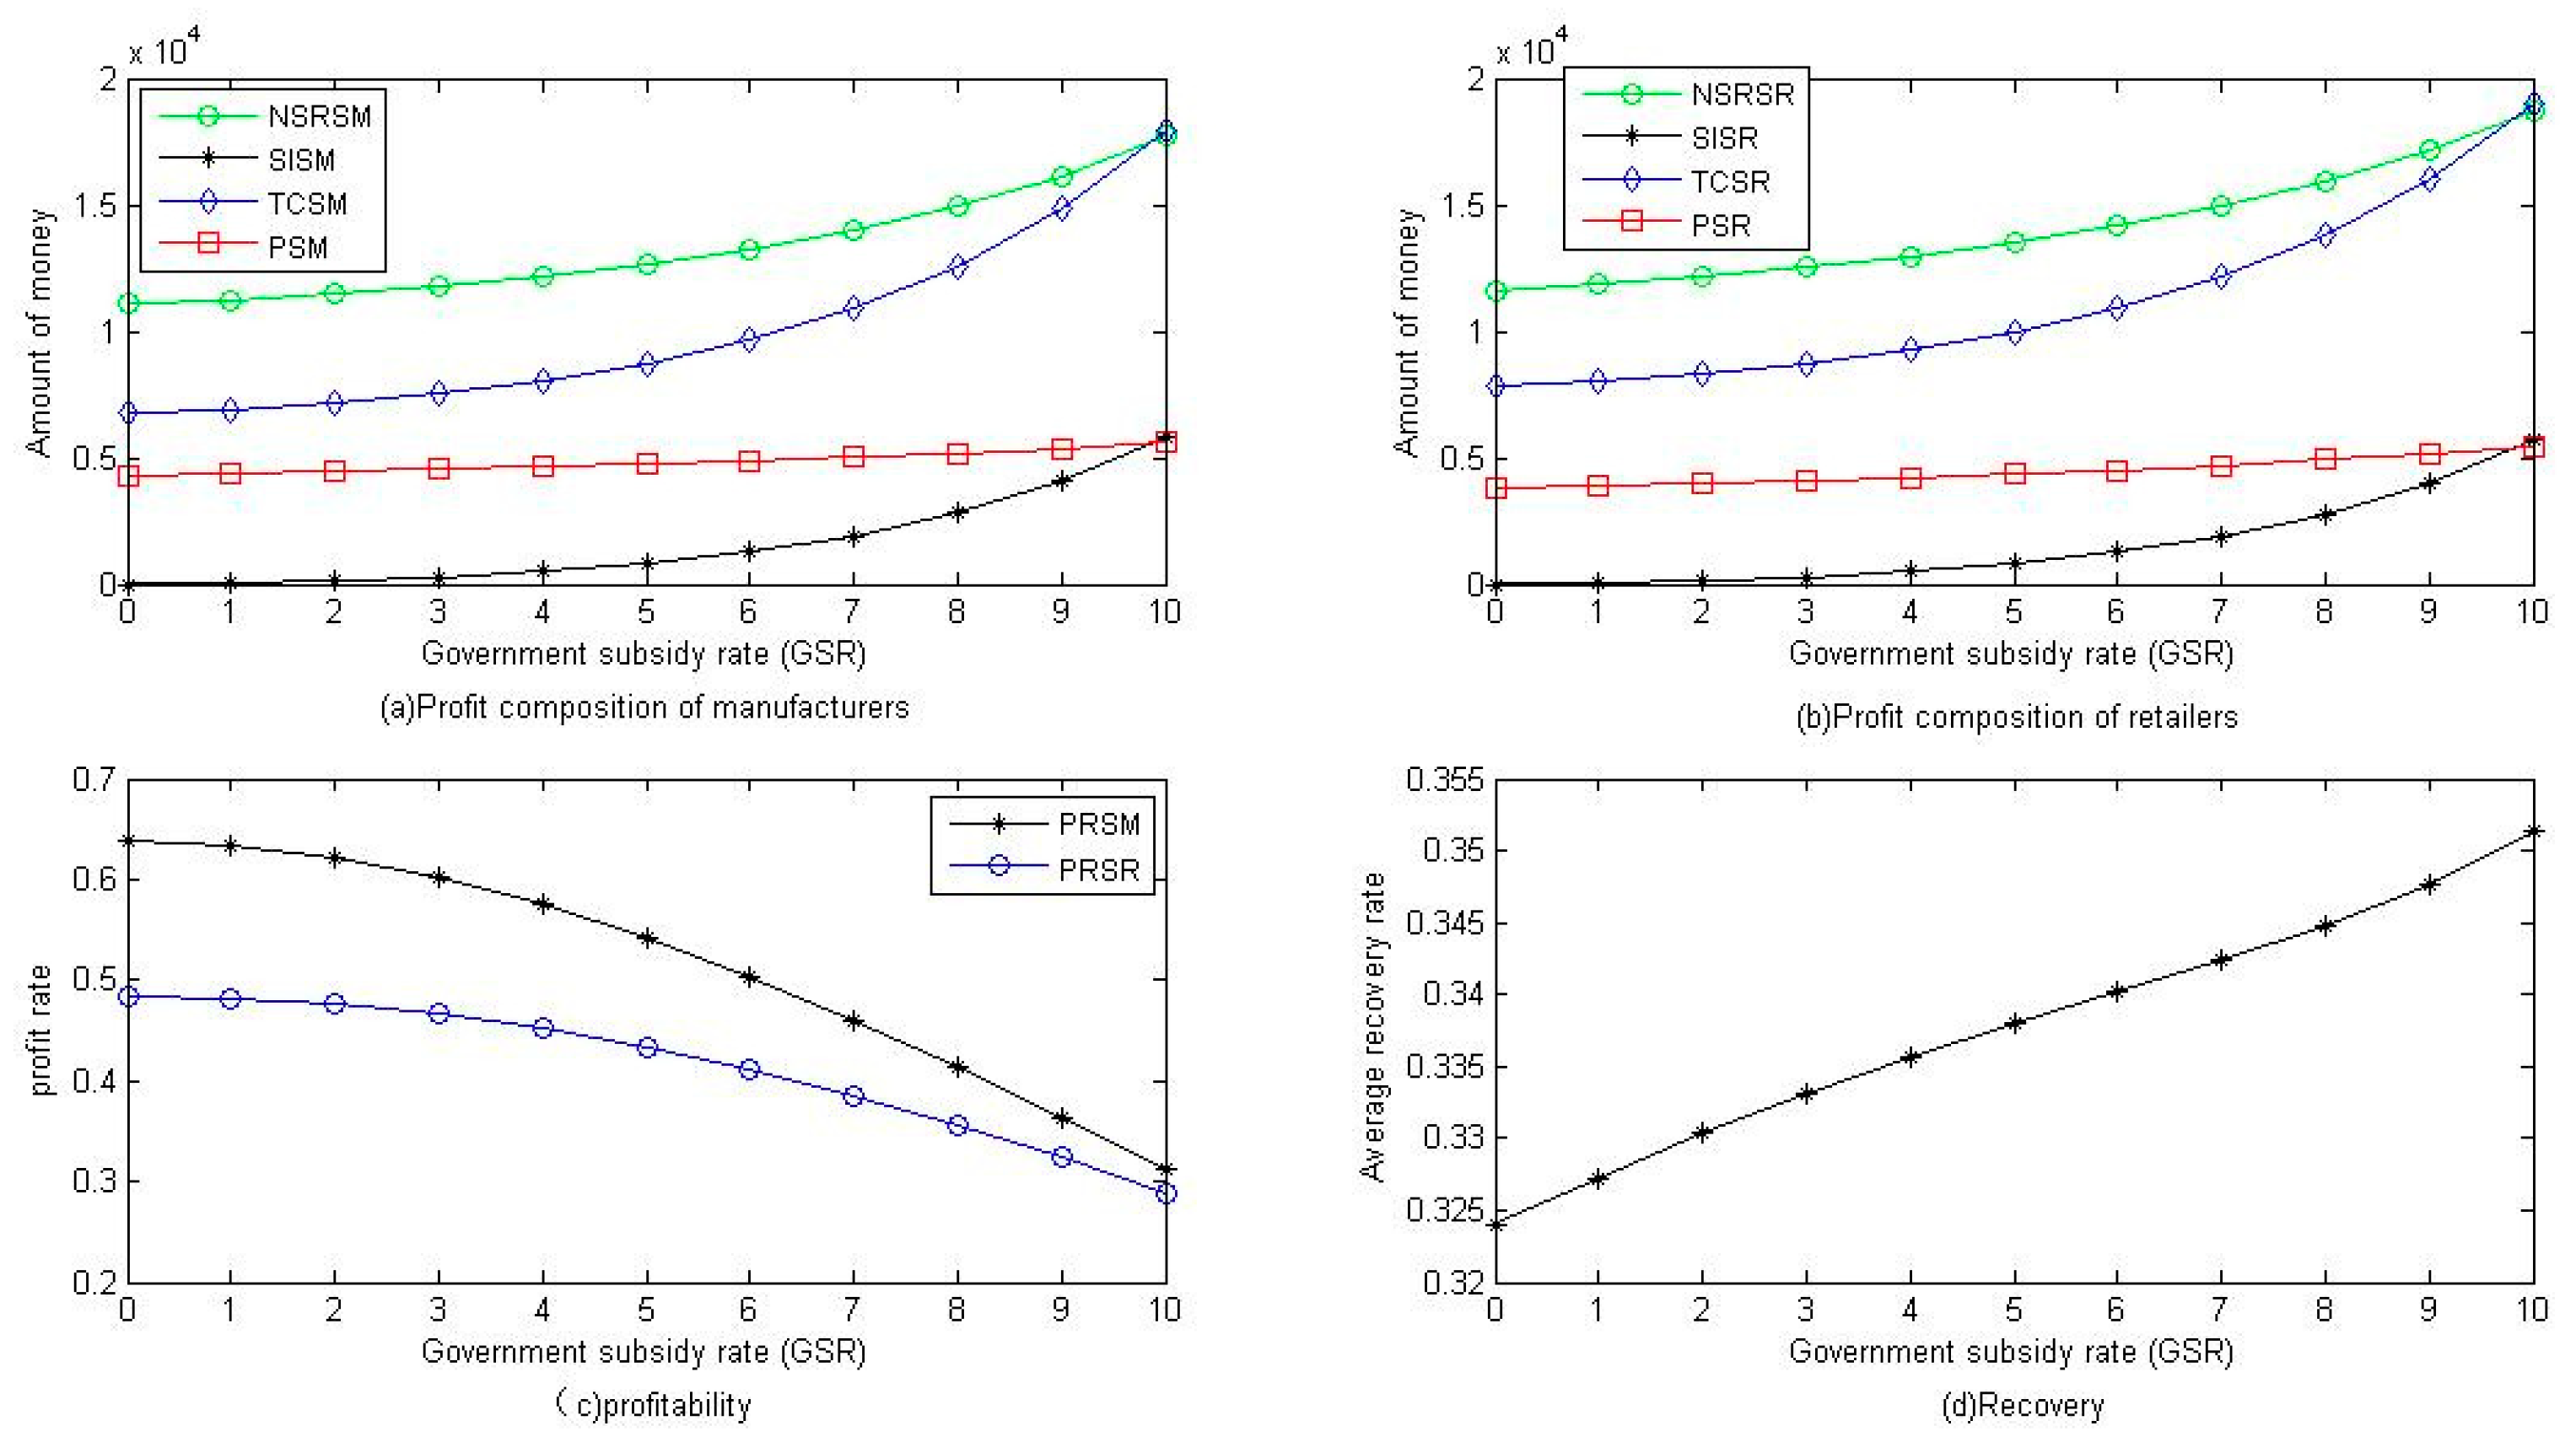
| TSP | I | 100.8139 | 101.5674 | 102.9350 | 104.9210 | 107.5950 | 111.0576 | 115.4512 | 120.9769 | 127.9212 | 136.7019 | 147.9473 |
| II | 121.2910 | 122.0623 | 123.4981 | 125.5791 | 128.3686 | 131.9568 | 136.4693 | 142.0793 | 149.0269 | 157.6497 | 168.4327 | |
| I | 555.4802 | 560.4887 | 566.0229 | 571.7340 | 577.7315 | 584.1453 | 591.1362 | 598.9119 | 607.7518 | 618.0479 | 630.3744 | |
| II | 553.0695 | 557.2947 | 562.1229 | 567.0695 | 572.2159 | 577.6558 | 583.5020 | 589.8956 | 597.0194 | 605.1191 | 614.5372 | |
| GR | I | 0.1000 | 0.6533 | 1.2703 | 1.9129 | 2.5938 | 3.3281 | 4.1350 | 5.0390 | 6.0736 | 7.2858 | 8.7446 |
| II | 0.1000 | 0.5694 | 1.1116 | 1.6734 | 2.2644 | 2.8957 | 3.5811 | 4.3377 | 5.1879 | 6.1621 | 7.3029 | |
| PSM | I | 4345.54 | 4394.91 | 4461.25 | 4542.24 | 4639.20 | 4753.59 | 4886.88 | 5040.35 | 5214.59 | 5408.36 | 5615.92 |
| II | 2614.00 | 2631.77 | 2644.86 | 2649.80 | 2644.55 | 2625.68 | 2587.78 | 2522.47 | 2416.61 | 2249.31 | 1986.31 | |
| PSR | I | 3808.98 | 3886.60 | 3981.87 | 4090.43 | 4214.56 | 4356.98 | 4521.09 | 4711.15 | 4932.62 | 5192.61 | 5500.60 |
| II | 4229.74 | 4302.77 | 4401.27 | 4519.19 | 4659.46 | 4825.96 | 5023.89 | 5260.22 | 5544.60 | 5890.61 | 6318.05 | |
| in type i | i=III, j = 1 | 53.5636 | 53.9879 | 54.7570 | 55.8770 | 57.3895 | 59.3557 | 61.8624 | 65.0338 | 69.0494 | 74.1756 | 80.8218 |
| i=III, j = 2 | 49.4914 | 49.8854 | 50.5986 | 51.6365 | 53.0379 | 54.8592 | 57.1812 | 60.1190 | 63.8391 | 68.5885 | 74.7472 | |
| i=I, j = 1/2 | 50.4070 | 50.78 | 51.4675 | 52.4605 | 53.7975 | 55.5288 | 57.7256 | 60.4884 | 63.9606 | 68.3510 | 73.9736 | |
| in type i | i=III, j = 1 | 261.33 | 263.35 | 265.68 | 268.19 | 270.96 | 274.04 | 277.52 | 281.54 | 286.25 | 291.90 | 298.83 |
| i=III, j = 2 | 264.52 | 266.58 | 268.96 | 271.55 | 274.40 | 277.60 | 281.24 | 285.44 | 290.39 | 296.33 | 303.64 | |
| i=I, j = 1/2 | 267.22 | 269.17 | 271.45 | 273.93 | 276.67 | 279.74 | 283.22 | 287.23 | 291.92 | 297.51 | 304.31 | |
| Enterprises’ GR in type III | 0.1000 | 0.6917 | 1.3476 | 2.0324 | 2.7607 | 3.5498 | 4.4221 | 5.4067 | 6.5440 | 7.8917 | 9.5367 | |
| PM1 in type III | 4579.18 | 4637.02 | 4718.49 | 4822.00 | 4950.27 | 5106.77 | 5295.98 | 5523.60 | 5796.80 | 6124.39 | 6516.44 | |
| PM2 in type III | 4144.07 | 4192.44 | 4253.67 | 4325.20 | 4407.56 | 4500.83 | 4604.31 | 4715.81 | 4830.18 | 4936.33 | 5010.63 | |
| TSP in type III | 103.05 | 103.87 | 105.36 | 107.51 | 110.43 | 114.21 | 119.04 | 125.15 | 132.89 | 142.76 | 155.57 | |
| in type III | 555.24 | 560.60 | 566.48 | 572.56 | 578.97 | 585.85 | 593.40 | 601.86 | 611.56 | 623.00 | 636.88 | |
| PSR in type III | 3939.46 | 4023.45 | 4125.80 | 4242.46 | 4375.94 | 4529.24 | 4706.09 | 4911.09 | 5150.11 | 5430.62 | 5762.32 | |
© 2019 by the authors. Licensee MDPI, Basel, Switzerland. This article is an open access article distributed under the terms and conditions of the Creative Commons Attribution (CC BY) license (http://creativecommons.org/licenses/by/4.0/).
Share and Cite
Wu, H.; Xu, B.; Zhang, D. Closed-Loop Supply Chain Network Equilibrium Model with Subsidy on Green Supply Chain Technology Investment. Sustainability 2019, 11, 4403. https://doi.org/10.3390/su11164403
Wu H, Xu B, Zhang D. Closed-Loop Supply Chain Network Equilibrium Model with Subsidy on Green Supply Chain Technology Investment. Sustainability. 2019; 11(16):4403. https://doi.org/10.3390/su11164403
Chicago/Turabian StyleWu, Haixiang, Bing Xu, and Ding Zhang. 2019. "Closed-Loop Supply Chain Network Equilibrium Model with Subsidy on Green Supply Chain Technology Investment" Sustainability 11, no. 16: 4403. https://doi.org/10.3390/su11164403
APA StyleWu, H., Xu, B., & Zhang, D. (2019). Closed-Loop Supply Chain Network Equilibrium Model with Subsidy on Green Supply Chain Technology Investment. Sustainability, 11(16), 4403. https://doi.org/10.3390/su11164403


