Article

Research on the Online Consumption Effect of China’s Urbanization under Population Aging Background

1
School of Economics and Management, China University of Geosciences, Wuhan 430074, China
2
School of Economics and Management, Northwest A&F University, Xianyang 712100, China
3
Centre Européen de Recherche en Economie Financière et Gestion des Entreprises, Universite de Lorraine, 54000 Nancy, France
*
Authors to whom correspondence should be addressed.
Sustainability 2019, 11(16), 4349; https://doi.org/10.3390/su11164349
Submission received: 29 June 2019 / Revised: 5 August 2019 / Accepted: 8 August 2019 / Published: 12 August 2019

Abstract

:
With the development of e-commerce, online consumption—a new sustainable consumption mode—has rapidly developed. Online shopping has become an important consumption method for Chinese residents, and the era of online consumption has arrived. Urbanization is an important foundation for the development of online consumption, and its impact on online consumption is becoming increasingly important. In addition, with the decline of fertility in China, the proportion of the elderly population is increasing. As the macro background of the current economic operation of China, population aging has long been a concern of the government. However, the existing research on urbanization, population aging and online consumption is insufficient. In this context, this study is of great significance to promote the sustainable development of the online consumption mode and enrich the theory of resident consumption in the era of the network economy. In this paper, by adopting the system generalized method of moments (GMM), we conducted an empirical analysis of the relationship between urbanization, population aging, and online consumption, based on panel data from 31 provinces in China from 2007 to 2017. Furthermore, we examined the regional heterogeneity of urbanization’s online consumption effect. The results reveal that, first, urbanization has a positive relationship with online consumption. Second, urbanization’s online consumption effect has regional differences, with the largest positive effect being in the western area of China, the second in the eastern area of China and the smallest in the central area of China. Third, aging inhibits the development of online consumption. Specifically, it mainly includes two aspects. On the one hand, aging has a direct negative impact on online consumption. On the other hand, aging has a moderating effect on urbanization’s online consumption effect, which weakens the impact of urbanization. The rising of urban residents’ income has significant explanatory power to the change of online consumption in the eastern and western regions. Therefore, the policy implications are as follows: promoting the strategic transformation of urbanization, giving full play to the online consumption effect of urbanization; adjusting and improving population policy to cope with the population aging; constantly raising people’s income level and enhancing consumption potential.

1. Introduction

At present, China’s social development has entered a new era, and the economy has shifted from a stage of high-speed growth to a stage of high-quality development. Since the 1997 Southeast Asian financial crisis, weak consumption and insufficient domestic demand have almost become the stubborn illness of China’s economic development. Although the situation has improved in recent years, the final consumption rate and the contribution rate of final consumption expenditure have rebounded, the imbalance and inadequacy of consumption development are still the shortcomings of high-quality development. In contrast, online consumption, as a sustainable consumption mode, has become an important consumption approach for Chinese residents, and the era of online consumption has arrived. In 2011, China was the second largest online retail market in the world, while in 2012 its growth rate was close to that of the world’s largest market, the United States. Since 2013, the amount of online consumption in China has exceeded that in the United States and China has become the world’s largest online consumer market. In September 2014, Alibaba, a Chinese e-commerce giant, was officially listed on the New York Stock Exchange, with a market value of more than 200 billion USD, which attracted worldwide attention. This indicates that China’s online consumption has achieved rapid development and is on a larger scale.
Figure 1 demonstrates that online retail market develops rapidly. The figures show that [1], in 2018, China’s online retail sales reached 1.4 trillion USD. In addition, the total consumption on e-commerce platform for physical products is 1.1 trillion USD, which contributes 45.2% to the growth of total social retail sales of social consumer goods. This shows that the prospects of China’s online consumption are huge. Moreover, China has the largest online shopping population and online shopping market in the world. According to statistics [2], in 2017, the total online shopping population reached 460 million in China, 2.6 times that of the United States. The total retail sales in the online consumer market have reached 851 billion USD, 2.2 times that of the United States. Hence, China’s consumer market has been highly digitized, and it leads the world in both user groups and market size. Online consumption will have a great impact on Chinese residents’ consumption and even on the entire Chinese economy.
Since 1978, the level of global urbanization has increased by 16.3 percentage points, with increases of 10 percentage points in high-income countries and 21.5 percentage points in middle-income countries [3]. China’s urbanization rate rose from 17.92% in 1978 to 59.58% in 2018. In the past 40 years, the urbanization rate of China has increased by 41.66 percentage points [4]. China’s urbanization level has achieved four transcendence periods: surpassing low-income countries, surpassing lower-middle-income countries, surpassing middle-income countries, and surpassing the world average [5]. In 2018, China’s permanent urban population reached 831.37 million, far exceeding the combined population of India and the United States, the world’s second and third largest countries, respectively [6]. Additionally, in 2001, the proportion of the elderly aged 65 and over was 7.1% in China. In 2017, the proportion reached 11.4%, an increase of 4.3 percentage points in 16 years. The general international view is that when a country or region accounts for 10% of the total population aged over 60, or 7% of the total population aged over 65, it means that the population of the country or region is in an aging society. This shows that at the beginning of the 21st century, China has entered an aging society, and the speed of aging is accelerating.
China has entered an aging society, which is the macro background of China’s current economic operation. Additionally, the urban population is the primary factor affecting the scale of netizens [7]. Thus, the relationship between aging, urbanization and online consumption is increasingly close. To study urbanization’s online consumption effect, we need to consider the background of aging. Therefore, the problems that arise are as follows. Does urbanization promote the development of online consumption? How great is the impact of urbanization on online consumption? If the online consumption effect of urbanization exists, what impact will aging have on it? Are there regional differences in the impact of urbanization on online consumption? The above questions have become the focus of our study and are also what current policy makers are highly concerned about.
Compared with existing studies, the contribution of this paper is mainly embodied in the following. (1) From the perspective of aging, this paper deeply analyzed the impact of urbanization on online consumption. (2) We empirically analyzed the impact of urbanization on online consumption, utilizing the panel data of 31 provincial-level administrative regions in China other than Hong Kong, Macau, and Taiwan. Furthermore, we validated the moderating effect of aging. (3) From the regional level, we compared and analyzed the heterogeneity of urbanization affecting online consumption in the eastern, central and western regions of China and systematically examined the online consumption effect of urbanization, which enriches the consumption theory in the era of the network economy and acts as beneficial supplement to the existing literature.
The remainder of our paper is organized as follows. Section 2 reviews the extant literature and puts forward relevant research hypotheses. Section 3 constructs econometric models, analyses data and explores the relationship between urbanization and online consumption using scatter plots. Section 4 adopts provincial panel data for empirical test. Section 5 indicates the regional differences in urbanization affecting online consumption. Finally, Section 6 concludes the paper and proposes some policy implications.

2. Literature Review

2.1. Research on the Factors Affecting Online Consumption

Bhatnagar et al. argued that, compared with convenience, the risk brought by network use is the main reason whether people carry out online consumption or not [8]. Similar to this view, Vellido et al. used the potential factor score as a variable to study and concluded that lack of trust among consumers is an important factor restricting people’s online consumption behavior. They believed that managers should guide people’s online consumption behavior from reducing consumer risk perception and improving consumer trust [9]. Joines et al. surveyed 59 undergraduates of Cornell University and 59 New York residents, and found that age and income are important factors affecting online consumption [10]. There is a positive relationship between young people, income level and online consumption behavior [11]. The more experienced they are with the Internet, the greater the probability of online consumption, and consumption habits have a positive correlation with online consumption [12]. Naseri and Elliott pointed out that age, education level, gender and other factors jointly explain 22.6% of the changes in Internet purchasing behavior [13]. Besides, the service quality of merchants [14] and the risk of different payment means [15] are also the factors that affect the re-purchase of Internet. In a study on Chinese residents’ online consumption, Tang et al. argued that disposable income, GDP per capita and the level of Internet development are important factors contributing to the spatial differences of online consumption in China [16]. Wei and Wang believed that the overall difference of residents’ online consumption shows a “U”-shaped change trend, which first declines and then rises [17].

2.2. Urbanization and Consumption

Different scholars hold different views on the relationship between urbanization and consumption, mainly including the following three viewpoints. First, urbanization is conducive to increasing consumption [18,19,20]. The process of urbanization is accompanied by the expansion of the labor market and the spillover of information technology, thereby promoting the expansion of consumer demand and economic growth [21]. In addition, large cities can increase the diversity and possibility of consumption and provide conditions for residents to increase consumption [22,23]. A considerable number of scholars believe that China’s urbanization level is positively related to residents’ consumption [24,25,26]. Lei and Gong established a theoretical framework including multiple types of consumers and local governments, and results showed that the improvement in the urbanization level could promote the growth of the consumption rate [27]. In different stages of urbanization, the development of consumer finance is also conducive to the improvement in household consumption [28]. Baker and Yannelis took service consumption in American cities as an example to analyze the driving effect of urbanization on the growth of residents’ consumption [29]. Second, urbanization has not significantly improved the consumption level and consumption rate of residents. For example, Fan and Xiang argued that since the reform and opening up, the improvement in the urbanization level in China has not correspondingly increased the share of residents’ consumption, and the contribution of urbanization to residents’ consumption rate is almost zero [30]. Compared to developed countries, China’s rapid urbanization has not stimulated domestic demand growth. At the same time, the scale, level, growth rate and structure of Chinese residents’ consumption are still far behind those of developed countries [31]. Based on China’s census data, Li et al. empirically analyzed the impact of urbanization on the consumption rate and found that, from 1978 to 2010, the urbanization in China had little effect on the improvement of the final consumption rate [32]. The research of Shi and Nie showed that urbanization is not directly related to consumption and the average propensity to consume. In fact, the improvement in the urbanization level does not drive the growth of residents’ consumption [33]. Third, the development of urbanization has staged characteristics and dynamic impacts on consumption growth. In the short term, urbanization has no positive effect on consumption demand, but in the long term, urbanization will play a significant role in promoting consumption growth [34]. Chen found that there is a U-shaped relationship between the urbanization rate and the consumption rate, which first declines and then rises after the minimum value [35]. The current decline in China’s consumption rate is only a temporary phenomenon. When the urbanization level reaches a certain value, the consumption rate will increase in line with urbanization [36].

2.3. Population Aging and Consumption

The research on the relationship between population aging and consumption mainly includes the following three aspects. First, the relationship between aging and savings rate and consumption rate. Leff studied the relationship between the dependency ratio and the saving rate with the econometric method. The study showed that the increase in child dependency ratio and the elderly dependency ratio would significantly reduce the savings rate and increase household consumption [37]. However, Ram argued that the impact of changes in the age structure of the population on the national saving rate has a threshold characteristic, that is, the influence of different population structure on the household saving rate is different [38]. Yasin took emerging market countries as the research object, and the research showed that the degree of population aging does not significantly affect household savings rate [39]. Based on the life cycle hypothesis, Curtis et al. studied the relationship between aging and household savings rate by constructing a family life cycle savings decision model. The conclusion was that population aging inhibits the household savings rate [40]. Second, the impact of aging on consumption tendency and consumption level. Senesi constructed an iteration model to propose a preference view about endogenous time and finite life, that is, the higher the proportion of the elderly population, the greater the total consumption tendency of society [41]. From the perspective of mechanism, aging affects the consumption level by reducing fertility [42]. Third, aging and consumption structure. Wang and Liu pointed out that aging promotes the upgrading of household consumption structure, which is mainly achieved by increasing the proportion of health care consumption [43]. However, Lin believed that the expenditure of elderly families on developmental and enjoyable consumption is much lower than that of young families. The higher the aging degree of families, the stronger the effect of consumption inequality [44].
To sum up, the level of urbanization has a certain impact on household consumption. Moreover, the geographical concentration of the population and economic activities brought about by urbanization will produce an external economy for various aspects [45], which will inevitably affect online consumption. In addition, with the deepening of population aging, compared with young people, the unique consumption habits and consumption psychology of the elderly will also have an impact on urbanization’s online consumption effect. Based on the above analysis, this paper proposes the following hypothesis:
Hypothesis 1 (H1).
The level of urbanization can significantly affect the development of online consumption in China.
Hypothesis 2 (H2).
Aging has a moderating effect on the online consumption effect of urbanization.

3. Model, Data Description, and Characteristic Fact

3.1. Model Settings

Based on the above analysis, in order to verify Hypothesis 1, we establish a basic econometric model:
ln p o s i t = α 0 + α 1 ln p o s i ( t 1 ) + α 2 u l i t + α 3 p a i t + α 4 ln i n c i t + α 5 i p r i t + α 6 u d i t + α 7 ln t d i t + μ i + ε i t
where ln p o s is the logarithm of online retail sales per capita. Additionally, considering the inertia of consumption [46,47], we add the first-order lag of online retail sales per capita to the explanatory variable in model (1). i and t represent the region and time, respectively; μ i represents the regional individual effects; and ε i t refers to random disturbance. In this paper, u l is the core explanatory variable, that is, the level of urbanization. Referring to the method of Poumanyvong et al. [48], we adopt the ratio of the urban population to the total population (permanent resident population) to represent the urbanization rate. The remaining variables are the control variables, including (1) p a is population aging. The proportion of the population aged 65 and over in the total population is used as the proxy variable for aging. (2) ln i n c is the logarithm of disposable income per capita of urban residents. According to the classical consumption theory, consumption is the function of income, so the influence of income on online consumption cannot be ignored. (3) i p r is the Internet penetration rate. Online consumption is a network-based consumption mode. The more netizens there are, the more potential network consumers there will be. The development of the Internet directly affects online consumption. (4) u d is the urban economic density. The economic development level of a region is closely related to online consumption. (5) t d is traffic line density. Transportation convenience is a direct factor affecting logistics distribution, so it is also an important factor in the development of online consumption. The calculation method refers to the practice of Cheng [49].
To verify Hypothesis 2, examining the impact of aging on urbanization’s online consumption effect, that is, the moderating effect of aging, we add the interaction term of aging and urbanization to construct the econometric model (2):
ln p o s i t = α 0 + α 1 ln p o s i ( t 1 ) + α 2 u l i t + α 3 p a i t + α 4 ul i t * pa i t + α 5 ln i n c i t + α 6 i p r i t + α 7 u d i t + α 8 ln t d i t + μ i + ε i t

3.2. Estimation Method and Endogenous Discussion

Because of the lag period of the dependent variable in the model, it will cause endogenous problems of the independent variable related to the random disturbance term. At this time, the conditions for OLS estimation cannot be satisfied. The estimation of OLS is biased and inconsistent, which will distort the actual economic meaning of parameters. The system GMM proposed by Blundell and Bond can solve the potential endogenous problem [50]. Moreover, compared with other methods to solve the endogenous problem, GMM has a better effect of deviation correction [51]. Furthermore, compared with the difference GMM, the system GMM contains the estimation of the horizontal equation, which can estimate the coefficients of variables that do not change with time, and improve the efficiency of the estimation. Therefore, we use the two-step system GMM method to estimate the parameters of model (1) and model (2), which is suitable for dynamic panel estimation. In order to further verify the validity of system GMM estimation results, besides Hansen test and AR test, pooled OLS estimation and fixed effect OLS estimation results are also presented in this paper to compare and improve the robustness of the estimation results.

3.3. Data Source and Statistical Description

We selected panel data for 31 provinces in China (excluding Hong Kong, Macao and Taiwan) during 2007–2017 as samples. All data come from the China Statistical Yearbook (2018) and EPS Database [52]. For the online retail sales of each province, since the China Statistical Yearbook only has data after 2014, this paper uses the method of Fang and Xing to measure the index [53]. The descriptive statistical analysis of variables is as follows (Table 1). From Table 1, it can be seen that the data of the three variables, p o s , i n c and t d , have large differences. To avoid the heteroscedasticity problem, these variables are logarithmic in the econometric model and are recorded as ln p o s , ln i n c and ln t d .

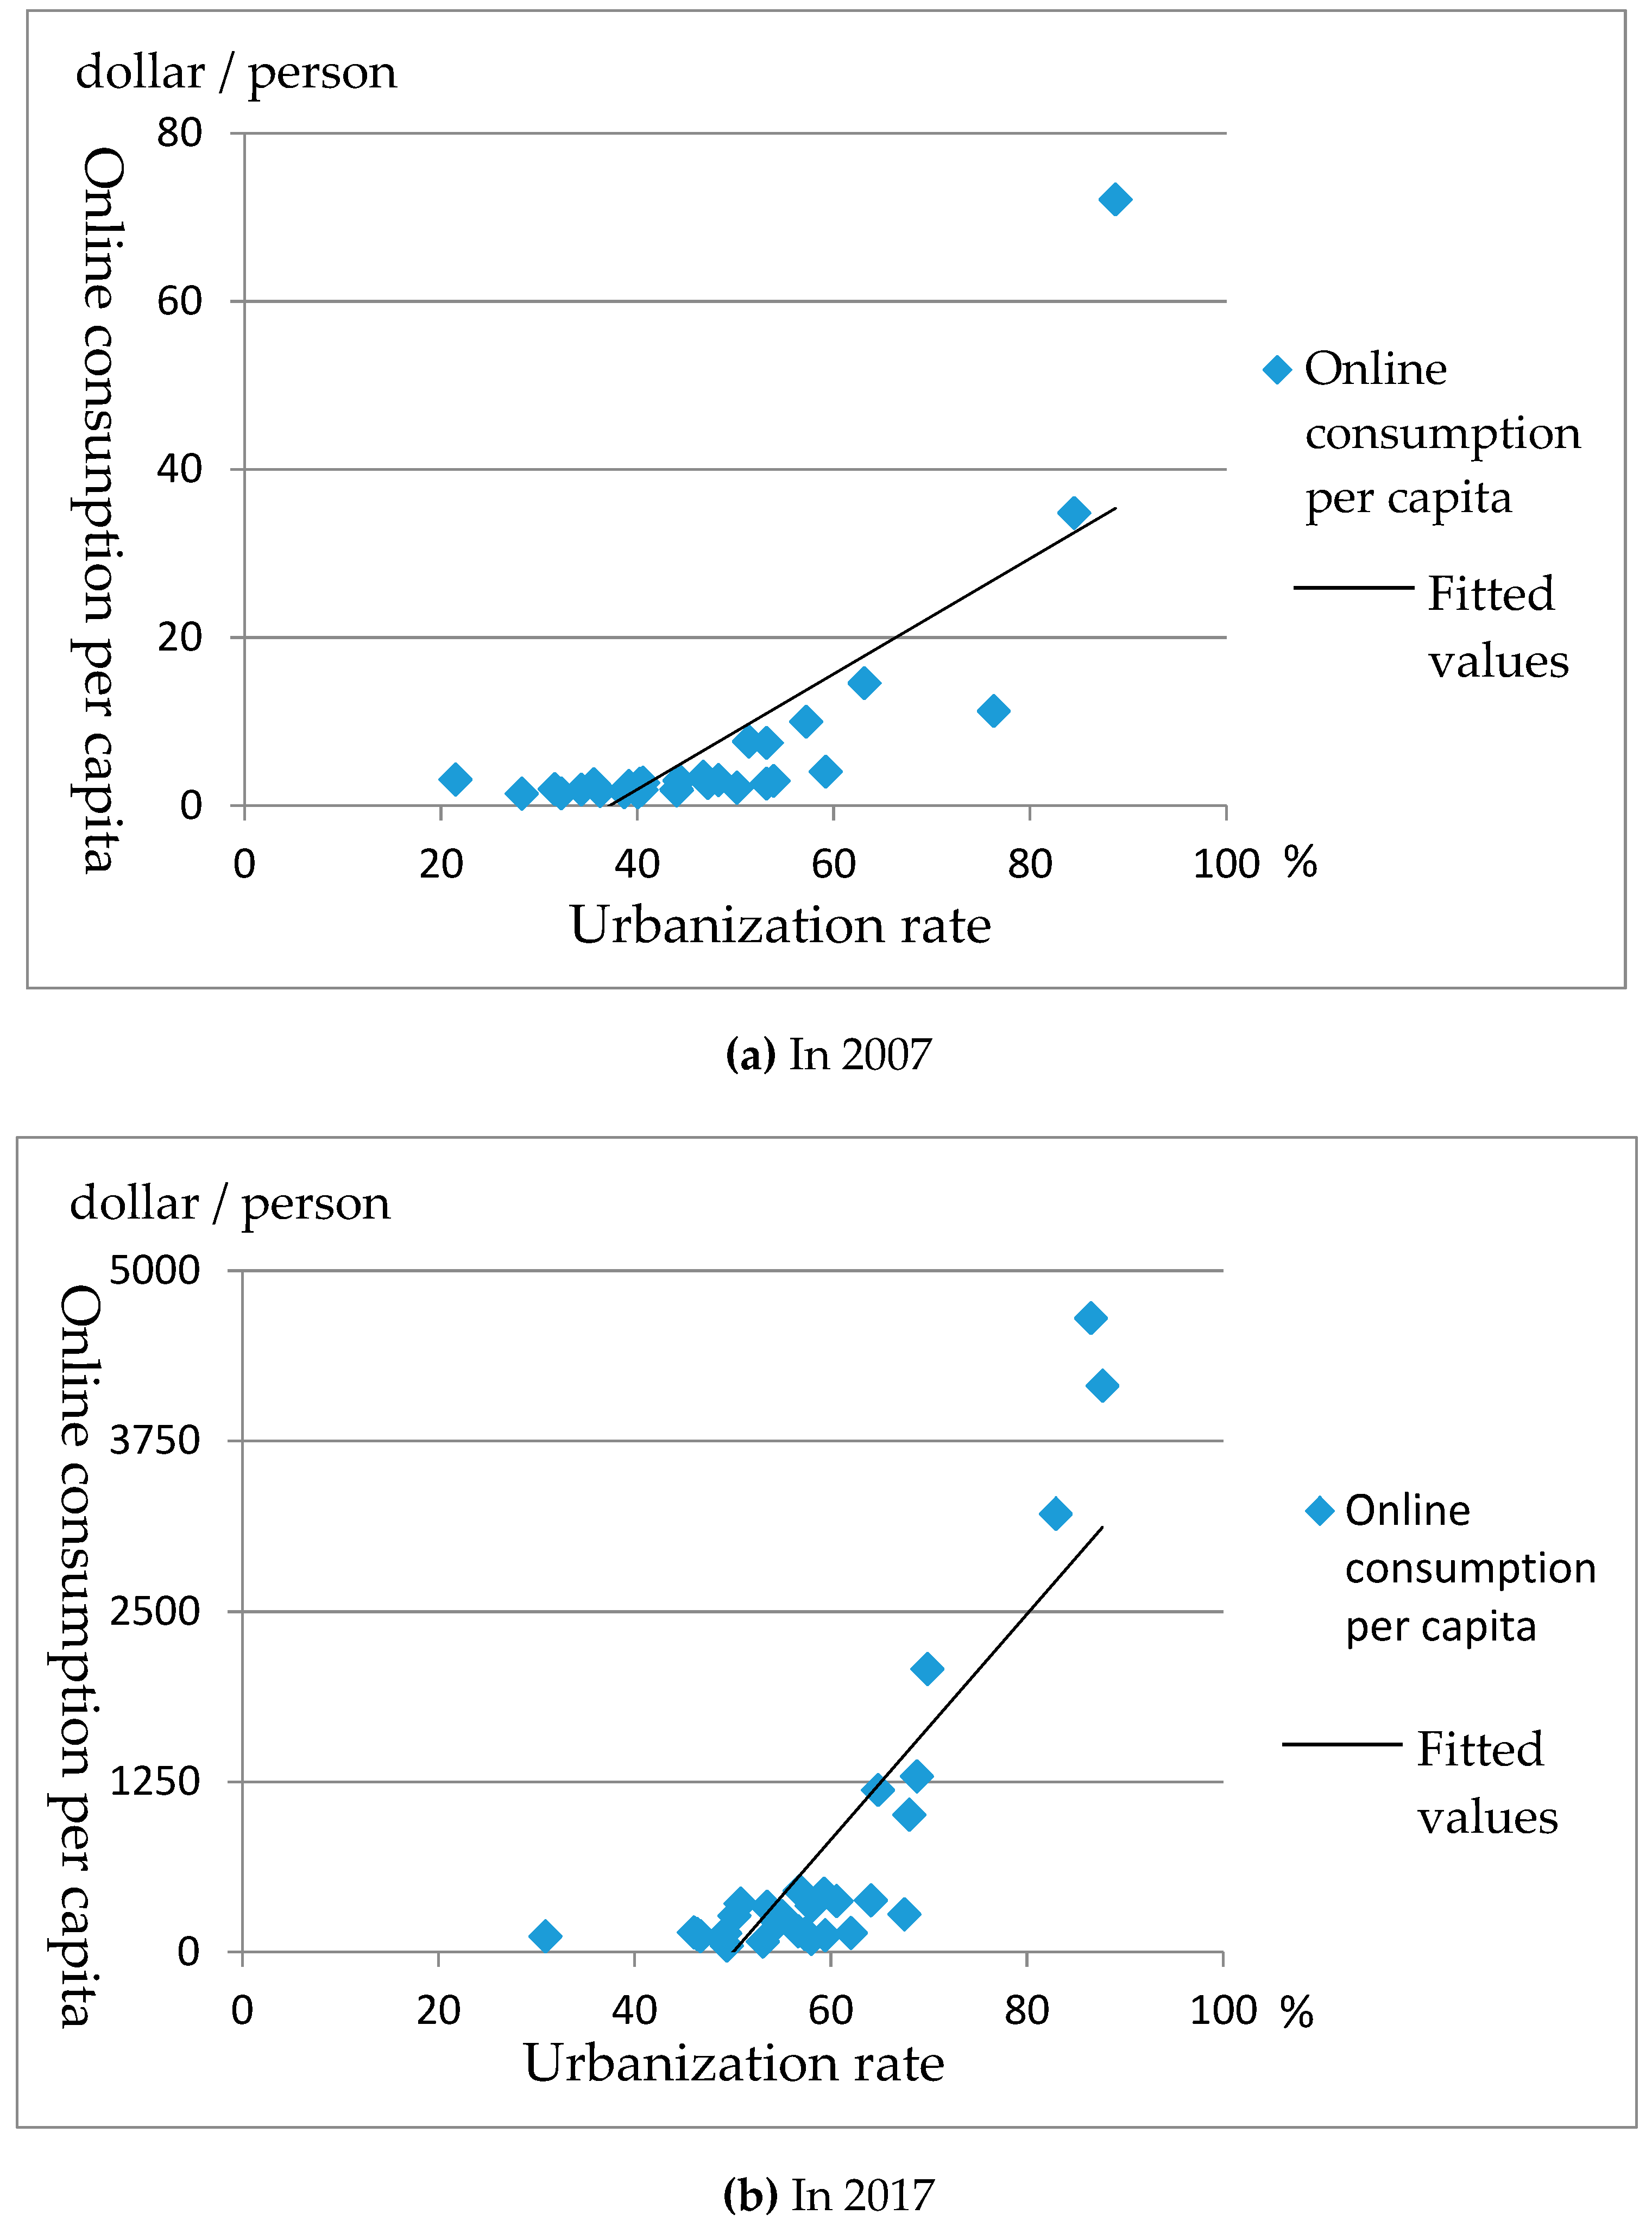
3.4. Characteristic Fact

First, we use scatter plots to visually describe the logical relationship between the urbanization rate and online consumption. Figure 2a,b, respectively, shows the scattered distribution of China’s urbanization rate and online consumption per capita in 2007 and 2017. Based on observing and summarizing the information in Figure 2, we conclude that, as a whole, with the improvement in the urbanization level, online consumption per capita continues to rise, except for several extreme values. The urbanization rate is positively correlated with online consumption per capita. That is, the urbanization rate is high in areas with high online consumption per capita, while it is low in areas with low online consumption per capita.
A scatter plot is an intuitive representation of the relationship between variables without any control variables. To accurately investigate the online consumption effect of urbanization and verify the research hypotheses proposed in this paper, we conducted an empirical analysis in Section 4 based on the econometric models discussed above.

4. Results and Analysis

4.1. Panel Unit Root Test

The panel data are treated first by the panel unit root test, which is an extension of the univariate unit root test. The test principle is to establish the AR (1) process for the panel data:
y i t = ρ i y i t 1 + X i t δ i + ε i t
where, i represents the cross-section unit and t represents time. X i t is the vector of variables in the model, including the individual specific effect and time specific effect. ε i t is the error term. ρ i represents the autoregressive coefficient. If | ρ i | < 1 , the sequence y i t is stationary, and if | ρ i | = 1 , the sequence y i t contains unit roots.
According to whether all cross-sectional sequences have the same unit root process, the panel unit root tests are divided into (1) individuals containing common unit root tests (assuming that the first-order autoregressive coefficients are consistent across all cross-sectional samples) and (2) individuals containing different unit roots (assuming that the coefficients of the first-order auto-regressions of different cross-sectional samples can differ). Two types of test methods are employed, that is, we use the same root test method (LLC test) and different root test methods (Fisher-ADF and Fisher-PP test) to perform a panel unit root test on the data. Three test methods are used in this paper to enhance the reliability of the research results. In addition, LLC, Fisher-ADF test and Fisher-PP test evaluate their original hypothesis which contains unit root.
Table 2 shows that the test results of the first-order difference values of all variables pass the significance test at the 1% level, indicating that the first differences of all variables are stationary processes.

4.2. Results of Models Estimation

The estimation results of econometric models (1) and (2) in Section 3 are shown in Table 3. According to Table 3, the p-values reported for AR (1) indicate that there is a first order correlation in the first−differenced errors, but the p-values for AR (2) show no evidence of a second order correlation. Meanwhile, the Hansen test values show that the instrumental variables are effective and there is no over−identification problem.
From Table 3, we can draw the following conclusions:
(1) The level of urbanization promotes the development of online consumption, but aging has a negative regulating effect on urbanization’s online consumption effect. No matter which estimation method is used, the coefficient of urbanization rate is positive, indicating that the conclusion that urbanization level has a positive effect on online consumption is robust. Taking the results of Model 2 as an example, which controls all other variables, the coefficient of urbanization rate is significantly positive at the 5% confidence level. Hence, it shows that the online consumption effect of urbanization exists. However, the coefficient of interaction term between urbanization rate and aging (ul*pa) is negative at the significance level of 5%, indicating that population aging inhibits the urbanization’s online consumption effect and weakens the positive driving effect of urbanization level on online consumption. The online consumption effect of urbanization will continue to decrease with the increase of the elderly population, validating Hypothesis 1 and Hypothesis 2.
(2) Population aging has a restraining effect on the development of online consumption. There is a negative impact between aging and online consumption. In Model 2, an increase of 1% in population aging will result in a decrease of 3.65 percentage points in online consumption. The possible explanation is that online consumption mode, based on the Internet, requires consumers to master certain Internet skills. However, elderly people are less able to learn and accept new things than younger people. Therefore, the online consumption model has obvious demographic age characteristics. The greater the elderly population, the more unfavorable to the development of online consumption. With the deepening of China’s aging degree, the inhibition of online consumption cannot be ignored.
(3) Raising income level is conducive to the development of online consumption. It can be seen from the estimation results that no matter which estimation methods are adopted, the coefficient of income per capita is always significantly positive. Thus, there is a significant positive relationship between income level and online consumption.
(4) The last conclusion is regarding the influence of other explanatory variables on online consumption. The coefficient of economic density is positive, indicating that the higher the urban economic density, the higher the online consumption; while the lower the urban economic density, the lower the level of online consumption tends to be. This shows that the degree of regional development is also an important factor affecting online consumption. The impact of traffic line density on online consumption is positive, and there is a positive correlation between them, which means that good transportation and logistics conditions are indispensable to the development of online consumption.

5. Regional Heterogeneity Analysis

For analyzing and evaluating the regional differences in urbanization affecting online consumption, 31 provinces and cities are divided into eastern, central and western regions according to the standards of the seventh five−year plan (1986) of the fourth session of the sixth people’s congress of China. The eastern region includes 13 provinces and municipalities: Beijing, Tianjin, Hebei, Liaoning, Jilin, Heilongjiang, Shanghai, Jiangsu, Zhejiang, Fujian, Shandong, Guangdong and Hainan. The central region includes six provinces: Shanxi, Anhui, Jiangxi, Henan, Hubei and Hunan. The western region includes 12 provinces and municipalities: Inner Mongolia, Guangxi, Chongqing, Sichuan, Guizhou, Yunnan, Tibet, Shaanxi, Gansu, Qinghai, Ningxia and Xinjiang. The results are presented in Table 4.
According to the estimation results, the following conclusions can be drawn. First, no matter which region, the online consumption variable with a lag of one period has a significant impact on the change in current online consumption. Second, the promotion effect of the urbanization rate on online consumption is different among regions, and thus, it has regional heterogeneity. In terms of coefficient size, the western region is the largest, the eastern region is the second largest, and the central region is the smallest. Regardless, the urbanization rate and online consumption change in the same direction in all regions. This further indicates that there is a positive correlation between the urbanization level and online consumption, and the improvement in the urbanization rate is conducive to the development of online consumption. Hence, the higher the urbanization rate is, the more online consumption. Third, the negative influence of aging on online consumption is statistically significant in the eastern region, but not in the central and western regions. The reason is that compared with the central and western regions, the eastern region has a greater degree of aging. Thus, the restrictive effect of aging on online consumption is also greater in the eastern region. In addition, from the perspective of the interaction term between urbanization and aging, the moderating effect of aging is significantly negative in the eastern region. Although it has not passed the significance test in the central and western regions, it also shows a negative correlation. In the current stage, the development of online consumption should pay attention to the negative regulating effect of aging in the eastern region. Fourth, the impact of urban residents’ income on online consumption is significantly positive in the eastern and western regions. Although the coefficient of the central region does not pass the significance test, it undoubtedly shows a positive impact. Therefore, raising people’s income is a channel to promote the development of online consumption. Fifth, traffic line density has a positive correlation with online consumption, especially in the central region.

6. Conclusions and Policy Implications

6.1. Conclusions

In the current study, we used system GMM method to empirically analyze influencing factors on online consumption, focusing on the impact of urbanization on online consumption under the background of population aging. The main conclusions are as follows: (1) urbanization has an effect on online consumption, and this effect has regional heterogeneity. Empirical results show that, on the whole, urbanization has a promoting effect on online consumption. From a regional perspective, the positive effect of urbanization is the largest in the western region, followed by the eastern region and the smallest in the central region. (2) Population aging has an inhibitory effect on online consumption, and this inhibition has a greater impact on the eastern region. On the one hand, aging has a direct negative impact on online consumption by changing the age structure of the consumers population. On the other hand, aging has a moderating effect on urbanization’s online consumption effect, that is, the online consumption effect of urbanization decreases with the deepening of aging. (3) The income of residents, regional development level and the convenience of transportation are also important factors affecting online consumption. The improvement of income level is driving the development of online consumption, and this promoting effect is more significant in eastern and western regions.

6.2. Policy Implication

Based on above conclusions, we propose the following policy advice.
First, the government should promote the strategic transformation of urbanization in order to give full play to the online consumption effect of urbanization. In the advancement of urbanization, the administration accelerates the strategic transformation of urbanization from being “growth−oriented” to being “people’s livelihood−oriented” [32]. In particular, government should pay attention to the development of urbanization in the central region and narrow the regional differences in urbanization’s online consumption effect.
Second, adjust and improve the population policy to cope with the aging of the population. On the one hand, the government should formulate a relaxed population policy to improve the total fertility rate of society, change the current situation of “aging population with fewer children” and alleviate the restrictive effect of aging on online consumption. On the other hand, in the process of developing online consumption, the society should seize the opportunity of the aging time. Combining the consumption characteristics of the elderly, aiming at their demand for products and services, producers should develop the elderly industry and find new breakthroughs for online consumption.
Third, raise the income level of residents and enhance the purchasing power of consumers’ online consumption. Income is an important factor affecting online consumption, so increasing residents’ income is an important way to improve online consumption. Improvement in the income level, especially the expansion of middle−income groups and increasing the income of low−income people, will stimulate the overall social consumption demand and consumption trend, as well as promote the development of online consumption.

6.3. Limitations and Future Research

This article used panel data of 31 provinces and cities in China to study urbanization’s online consumption effect and the moderating effect of population aging and made an analysis of regional heterogeneity. However, there are still some limitations, and more efforts are needed. First, in terms of variable selection, more control variables can be selected for model estimation in the future. Second, the data in this paper were only collected from China’s data. Further research should consider the differences between countries and conduct research worldwide. Third, the current research only focused on the moderating effect of aging. In the future, we will explore other mechanisms of population age structure affecting online consumption.

Author Contributions

X.L. and T.L. conceived and designed the study; X.L. and H.L. collected data; X.L. and J.Q. performed the data analysis and wrote the manuscript; T.L., H.L. and L.H. reviewed and edited the manuscript. All authors read and approved the final manuscript.

Funding

This research was supported by the National Social Science Foundation of China (Grant No. 14BJL069).

Acknowledgments

The authors are grateful to the editors and the anonymous reviewers for their insightful comments and suggestions.

Conflicts of Interest

The authors declare no conflict of interest.

References

  1. Ministry of Commerce: China Online Retail Development Report 2018. Available online: http://www.100ec.cn/detail−−6498421.html (accessed on 31 July 2019).
  2. Accenture. Capturing Growth in China: New Consumers. Available online: https://www.accenture.com/cn−en/insights/consumer−goods−services/capturing−growth−in−china (accessed on 26 June 2018).
  3. The World Bank. Available online: https://www.worldbank.org/ (accessed on 17 July 2019).
  4. National Bureau of Statistics of China. China Statistical Yearbook. Available online: http://www.stats.gov.cn/english/statisticaldata/annualdata/ (accessed on 20 June 2018).
  5. Li, T.P. 40 Years of Chinese Urbanization: Key Findings and Future Options. Popul. Res. 2018, 42, 15–24. (In Chinese) [Google Scholar]
  6. United Nations. World Urbanization Prospects: The 2018 Revision; United Nations: New York, NY, USA, 2018. [Google Scholar]
  7. Sun, Z.W.; Zhang, S.Y.; Wei, R.; Tian, W.N. The Spatial Distribution and Influencing Factors of Facebook User. World Reg. Stud. 2016, 25, 101–110. (In Chinese) [Google Scholar]
  8. Bhatnagar, A.; Misra, S.; Rao, H.R. On Risk, Convenience, and Internet Shopping Behavior. Commun. Acm. 2000, 43, 98–105. [Google Scholar] [CrossRef]
  9. Vellido, A.; Lisboa, P.J.G.; Meehan, K. Quantitative Characterization and Prediction of On−Line Purchasing Behavior: A Latent Variable Approach. Int. J. Electron. Commer. 2000, 4, 83–104. [Google Scholar] [CrossRef]
  10. Joines, J.L.; Scherer, C.W.; Scheufele, D.A. Exploring Motivations for Consumer Web Use and their Implications for E−commerce. J. Consum. Mark. 2003, 20, 90–108. [Google Scholar] [CrossRef]
  11. Card, J.A.; Chen, C.Y.; Cole, S.T. Online Travel Products Shopping: Differences between Shoppers and Nonshoppers. J. Travel Res. 2003, 42, 133–139. [Google Scholar] [CrossRef]
  12. Blake, B.F.; Neuendorf, K.A.; Valdiserri, C.M. Innovativeness and Variety of Internet Shopping. Internet Res. 2003, 13, 156–169. [Google Scholar] [CrossRef]
  13. Naseri, M.B.; Elliott, G. Role of demographics, social connectedness and prior internet experience in adoption of online shopping: Applications for direct marketing. J. Target. Meas. Anal. Mark. 2011, 19, 69–84. [Google Scholar] [CrossRef] [Green Version]
  14. Cheng, Z.C.; Guo, T.C. The Formation of Social Identity and Self−identity based on Knowledge Contribution in Virtual Communities: An Inductive Route Model. Comput. Hum. Behav. 2015, 43, 229–241. [Google Scholar] [CrossRef]
  15. Hove, L.V.; Karimov, F.P. The Role of Risk in E−retailers’ Adoption of Payment Methods: Evidence for Transition Economies. Electron. Commer. Res. 2016, 16, 27–72. [Google Scholar] [CrossRef]
  16. Tang, H.T.; Guo, K.G.; Zhu, Q.Q. Analysis of the Factors Affecting the Regional Difference of Network Consumption in China. Consum. Econ. 2017, 33, 17–23. (In Chinese) [Google Scholar]
  17. Wei, X.M.; Wang, L.S. The Regional Difference Measurement and Convergence Research on Chinese Residents’ Online Consumption. J. Quant. Tech. Econ. 2018, 35, 130–145. (In Chinese) [Google Scholar]
  18. Lewis, W.A. Economic Development with Unlimited Supplies of Labour. Manch. Sch. 1954, 22, 139–191. [Google Scholar] [CrossRef]
  19. Jorgenson, D.W. The Development of a Dual Economy. Econ. J. 1961, 71, 309–334. [Google Scholar] [CrossRef]
  20. Macmillan, J.A.; Tung, F.; Loyns, R.M.A. Differences in Regional Household Consumption Patterns by Urbanization: A Cross−Section Anaysis. J. Reg. Sci. 1972, 12, 417–424. [Google Scholar] [CrossRef]
  21. Ioannides, Y.M. Product differentiation and economic growth in a system of cities. Reg. Sci. Urban Econ. 1994, 24, 461–484. [Google Scholar] [CrossRef]
  22. Glaeser, E.L.; Kolko, J.; Saiz, A. Consumer City. J. Econ. Geogr. 2001, 1, 27–50. [Google Scholar] [CrossRef]
  23. Waldfogel, J. Preference Externalities: An Empirical Study of Who Benefits Whom in Differentieted Product Markets. Rand J. Econ. 2003, 34, 557–568. [Google Scholar] [CrossRef]
  24. Wu, Z. Urbanization: An Important Source of China’s Economy to Maintain Medium and Long−term Growth. Nankai Econ. Stud. 2000, 3, 12–16. (In Chinese) [Google Scholar]
  25. Zou, H.; Yu, K.Z. Labor Income Share, Urban−Rural Income Gap and Household Consumption in China. Econ. Theory Bus. Manag. 2011, 3, 45–55. (In Chinese) [Google Scholar]
  26. Zhu, Q.; Wei, T.Y. Future Impacts of Population Aging and Urbanization on Household Consumption in China. Popul. Res. 2016, 40, 62–75. (In Chinese) [Google Scholar]
  27. Lei, X.Y.; Gong, L.T. The Effect of Urbanization on the Household Consumption Rate: Theoretical and Empirical Analysis. Econ. Res. J. 2014, 49, 44–57. (In Chinese) [Google Scholar]
  28. Bunyan, S.; Collins, A.; Torrisi, G. Analysing Household and Intra−urban Variants in the Consumption of Financial Services: Uncovering “Exclusion” in an English City. J. Consum. Policy 2016, 39, 199–221. [Google Scholar] [CrossRef]
  29. Baker, S.R.; Yannelis, C. Income Changes and Consumption: Evidence from the 2013 Federal Government Shutdown. Rev. Econ. Dyn. 2017, 23, 99–124. [Google Scholar] [CrossRef]
  30. Fan, J.P.; Xiang, S.J. The Influence of the Dual Social Structure of Urban and Rural Population on Resident Consumption Rate in China. Manag. World 1999, 5, 35–38. (In Chinese) [Google Scholar]
  31. Yu, F.D. The Analysis of Household Consumption Expenditure from the Perspective of International Comparison. Stat. Res. 2010, 27, 29–32. (In Chinese) [Google Scholar]
  32. Li, T.P.; Cheng, S.; Ni, L.; Qian, J. The Consumption Effect of Urbanization: Evidence from China. Chin. J. Popul. Sci. 2013, 3, 19–27. (In Chinese) [Google Scholar]
  33. Shi, K.; Nie, L. Effect on Urban and Rural Residents’ Consumption by Urbanization. Urban Probl. 2014, 6, 87–93. (In Chinese) [Google Scholar]
  34. Xie, J.J.; Luo, L.Q. Analysis of the Pulling Effect of Urbanization on Investment and Consumption Demand. Reform. Strategy 2004, 3, 12–15. (In Chinese) [Google Scholar]
  35. Chen, C.B. Research on the Relationship between Urbanization and Investment Rate and Consumption Rate. Econ. Perspect. 2010, 9, 42–48. (In Chinese) [Google Scholar]
  36. Zou, H.; Lu, J.H.; Li, A.L. Urbanization Level, Urban−Rural Income Gap and Consumption Demand. Consum. Econ. 2012, 28, 28–31. (In Chinese) [Google Scholar]
  37. Leff, N.H. Dependency Rates and Savings Rates. Am. Econ. Rev. 1969, 59, 886–896. [Google Scholar]
  38. Ram, R. Dependency Rates and Aggregate Savings: A New International Cross−section Study. Am. Econ. Rev. 1982, 72, 537–544. [Google Scholar]
  39. Yasin, J. Demographic Structure and Private Savings: Some Evidence from Emerging Markets. Afr. Rev. Money Financ. Bank. 2008, 9, 7–21. [Google Scholar]
  40. Curtis, C.C.; Lugauer, S.; Mark, N.C. Demographics and Aggregate Household Saving in Japan, China, and India. J. Macroecon. 2017, 51, 175–191. [Google Scholar] [CrossRef]
  41. Senesi, P. Population Dynamics and Life−Cycle Consumption. J. Popul. Econ. 2003, 16, 389–394. [Google Scholar] [CrossRef]
  42. Hock, H.; Weil, D.N. On the Dynamics of the Age Structure, Dependency, and Consumption. J. Pop. Econ. 2012, 25, 1019–1043. [Google Scholar] [CrossRef] [PubMed]
  43. Wang, W.; Liu, Y.F. Population Aging and Upgrading of Household Consumption Structure: An Empirical Study based on CFPS2012 Data. J. Shandong Univ. 2017, 5, 84–92. (In Chinese) [Google Scholar]
  44. Lin, X.S. Family Aging, Consumption Structure and Consumption Stratification: Data Analysis Based on CFPS 2012. J. Southeast Univ. 2018, 20, 112–121. (In Chinese) [Google Scholar]
  45. Holmes, T.J.; Fujita, M.; Krugman, P.; Venables, A.J. The Spatial Economy: Cities, Regions, and International Trade. South. Econ. J. 2000, 67, 491–493. [Google Scholar] [CrossRef]
  46. Brown, T.M. Habit Persistence and Lags in Consumer Behaviour. Econometrica 1952, 20, 355–371. [Google Scholar] [CrossRef]
  47. Mueller, D.C. First−mover Advantages and Path Dependence. Int. J. Ind. Organ. 1997, 15, 827–850. [Google Scholar] [CrossRef]
  48. Poumanyvong, P.; Kaneko, S.; Dhakal, S. Impacts of Urbanization on National Transport and Road Energy Use: Evidence from Low, Middle and High Income Countries. Energy Policy 2012, 46, 268–277. [Google Scholar] [CrossRef]
  49. Cheng, Q.C. Spatial Pattern and Main Influencing Factors of Regional Logistics Transportation Scale in China. Lanzhou Acad. J. 2014, 3, 95–99. (In Chinese) [Google Scholar]
  50. Blundell, R.; Bond, S. Initial Conditions and Moment Restrictions in Dynamic Panel Data Models. J. Econ. 1998, 87, 115–143. [Google Scholar] [CrossRef]
  51. Li, Z.C. Endogeneity in CEO Power: A Survey and Experiment. Investig. Anal. J. 2016, 45, 149–162. [Google Scholar] [CrossRef]
  52. EPS. EPS China Data. Available online: http://www.epschinadata.com/ (accessed on 28 July 2018).
  53. Fang, F.Q.; Xing, W. The U−shaped Relationship between Household Consumption and E−commerce Market Scale. Financ. Trade Econ. 2015, 11, 131–147. (In Chinese) [Google Scholar]
Figure 1. China’s online retail market transaction scale and its proportion trend chart. Note: (1) Source of data: China Statistical Yearbook (2018), and http://www.100ec.cn/detail--6498421.html. (2) Online retail market transaction scale are converted by the annual average exchange rate of each year.
Sustainability 11 04349 g001
Figure 2. (a) Urbanization rate and online consumption per capita of 31 provinces in China in 2007; (b) Urbanization rate and online consumption per capita of 31 provinces in China in 2017.
Sustainability 11 04349 g002
Table 1. Variable definition and descriptive statistics.
VariablesDefinitionMeanStandard DeviationMinMaxObservations
posOnline retail sales per capita1255.3343122.77710.90624,329.940341
ulUrbanization rate53.16814.23921.50089.600341
paPopulation aging9.4711.9774.82414.279341
incDisposable income per capita of urban residents19,629.7806916.26310,012.34048,906.340341
iprInternet penetration rate40.27416.5336.00078.000341
udUrban economic density8.9033.1172.79921.536341
tdTraffic line density140.913130.8977.216722.314341
Table 2. Panel unit root test results of variables.
VariablesHorizontal ValueFirst-Order Difference Value
LLC TestFisher-ADF TestFisher-PP TestLLC TestFisher-ADF TestFisher-PP Test
lnpos5.3446
(1.0000)
66.8072
(0.3154)
119.8210 ***
(0.0000)
−6.6391 ***
(0.0000)
132.6190 ***
(0.0000)
151.8220 ***
(0.0000)
ul0.1704
(0.5677)
28.9672
(0.9999)
92.6059 ***
(0.0071)
−8.6270 ***
(0.0000)
122.0720 ***
(0.0000)
190.2940 ***
(0.0000)
pa2.2186
(0.9867)
26.8024
(1.0000)
23.9825
(1.0000)
−7.4893 ***
(0.0000)
104.9770 ***
(0.0005)
187.6240 ***
(0.0000)
lninc−11.5519 ***
(0.0000)
74.1221
(0.1392)
189.6210 ***
(0.0000)
−4.0269 ***
(0.0000)
112.1670 ***
(0.0001)
134.2910 ***
(0.0000)
ipr−20.6975 ***
(0.0000)
60.4944
(0.5304)
512.9890 ***
(0.0000)
−4.8032 ***
(0.0000)
131.4200 ***
(0.0000)
165.9620 ***
(0.0000)
ud5.3780
(1.0000)
44.8298
(0.9507)
13.5301
(1.0000)
−4.1180 ***
(0.0000)
74.9043
(0.1259)
112.6730 ***
(0.0001)
lntd0.0796
(0.5317)
64.6430
(0.3845)
84.2715 **
(0.0315)
−6.9130 ***
(0.0000)
118.5220 ***
(0.0000)
148.8160 ***
(0.0000)
Note: The p-values of the corresponding t statistic are in parentheses; ** and *** are significant at the levels of 5% and 1%, respectively.
Table 3. Comparison of regression results.
Variableslnpos
MethodSystem GMMSystem GMMOLSFE
Model 1Model 2Model 3Model 4
lnpos(−1)0.7571 ***
(0.0237)
0.7911 ***
(0.0274)
0.8192 ***
(0.0336)
0.6937 ***
(0.0558)
ul0.0039
(0.0073)
0.0148 **
(0.0063)
0.0035
(0.0054)
0.0249 *
(0.0129)
pa−0.0049
(0.0066)
−0.0365
(0.0442)
−0.0361
(0.0240)
−0.0447
(0.0477)
lninc0.7125***
(0.0577)
0.8555 ***
(0.1689)
0.5702 **
(0.2474)
0.9956 **
(0.4410)
ipr−0.0017
(0.0043)
−0.0109 *
(0.0056)
−0.0003
(0.0036)
−0.0132
(0.0086)
ud0.0168 **
(0.0071)
0.0072
(0.0067)
0.0173 **
(0.0078)
0.0290
(0.0307)
lntd0.0420
(0.0694)
0.1583
(0.1168)
0.0893 *
(0.0519)
0.1823
(0.3723)
ul*pa −0.0004 **
(0.0002)
−0.0005
(0.0004)
−0.0010
(0.0007)
constant−5.4173 ***
(0.7494)
−7.8316 ***
(1.7210)
−4.0521 *
(2.3268)
−9.6887 **
(4.4550)
Instruments76124
Hansen test1.0001.000
AR (1)0.0070.005
AR (2)0.4920.493
Observations341341341341
Note: Robust standard errors are in parentheses; *, ** and *** are significant at the levels of 10%, 5% and 1%, respectively; Hansen test reports the p-values for the null hypothesis that instruments are valid; The p−values reported for AR (1) and AR (2) are for first and second order autocorrelated disturbances.
Table 4. System generalized method of moments (GMM) results of regional heterogeneity.
Variableslnpos
MethodSystem GMM
EastCentralWest
lnpos(−1)0.4841 **
(0.2005)
0.5818 ***
(0.1095)
0.8208 ***
(0.2207)
ul0.1118
(0.0717)
0.0252
(0.0458)
0.1854 *
(0.1076)
pa−0.8847 *
(0.4719)
−0.2243
(0.2106)
−0.4367
(0.3639)
lninc3.1610 **
(1.2742)
0.9144
(0.6242)
1.0013 ***
(0.0601)
ipr−0.0056
(0.0065)
−0.0047
(0.0093)
0.0003
(0.0426)
ud−0.0142
(0.0106)
0.0624
(0.0406)
−0.0795
(0.1239)
lntd0.2669
(0.4082)
0.7769 **
(0.3483)
1.5786
(1.1082)
ul*pa−0.0117 *
(0.0066)
−0.0051
(0.0042)
−0.0076
(0.0064)
constant−20.1684
(14.1979)
−2.0073
(5.5784)
−5.8507
(12.5179)
Instruments622668
Hansen test1.0001.0001.000
AR (1)0.0190.0170.016
AR (2)0.3080.7390.355
Observations14366132
Note: Robust standard errors in parentheses; *, ** and *** are significant at the levels of 10%, 5% and 1%, respectively; Hansen test reports the p−values for the null that instruments are valid; The p−values reported for AR (1) and AR (2) are for first and second order autocorrelated in the first−differenced errors.

