Article

An Assessment Model for Evaluating Asymmetric Effects of Attribute-Level Performance on Satisfaction

1
School of Tourism Management, Eastern Liaoning University, Dandong 118001, China
2
Department of Business Administration, Chonbuk National University, Jeonju 54896, Korea
3
Business School, Shandong Jianzhu University, Jinan 250101, China
*
Author to whom correspondence should be addressed.
Sustainability 2019, 11(16), 4323; https://doi.org/10.3390/su11164323
Submission received: 12 July 2019 / Revised: 4 August 2019 / Accepted: 6 August 2019 / Published: 9 August 2019
(This article belongs to the Special Issue Service Quality in Leisure and Tourism)

Abstract

:
The effects of attribute performance on satisfaction have been widely addressed in the discussion on satisfaction. In traditional view, customer satisfaction should be enhanced by improving product or service attribute performance. However, as theoretical and empirical studies have shown, the linkage between attribute performance and overall satisfaction is asymmetric and nonlinear, which means that it is not a definite relationship between high performance of attribute and satisfaction. Regarding the research on delivering asymmetric effects, the Kano model was utilized extensively in the previous studies. But this method suffers from lacking a validity testing and failing to take account of the degree of attribute’s importance. To get a more effective access to measuring the asymmetric and nonlinear effects of attributes on customer satisfaction, this study presents an integrated approach which can express asymmetric effects through evaluating the significance of different attributes to satisfaction based on response surface analysis and importance grid analysis methods. In this paper, an empirical study on rural tourists’ satisfaction was undertaken using this integrated method. Furthermore, compared with the regression with a dummy variable method, this proposed approach shows more responsive to enhancing attribute performance and makes allowance for improving a certain target attribute in the customer satisfaction improvement process.

1. Introduction

Customer satisfaction plays a critical role in survival and future of service organization. Practitioners and academics have devoted increasing efforts on the measurement and improvement of customer satisfaction since the early 1970s [1,2,3,4,5,6,7]. The concept of satisfaction is derived from the Latin root satis, meaning “enough”. Because of this, it was defined mainly from the perspective of expectation fulfillment or customer experience in previous studies [8,9]. According to Oliver and Fen, satisfaction can “provide a pleasurable level of consumption-related fulfilment including levels of under- or overfulfillment” and can be characterized as positive “attitudes of the customers’ resulting from comparing a product’s or service supplier’s perceived performance in relation to their expectations” [8,10]. Although these definitions were accepted and widely used, measurement of satisfaction is difficult when it was thought as a subjective evaluation and an attitudinal response to customer’s judgement [9].
Despite problems with the measurement of satisfaction, various measurement method and model have been explored and implemented in previous studies. In these approaches, identification of the determinants of satisfaction was regarded as essential, because it can affect resources allocation on different service attributes for satisfaction improvement [11,12]. To confirm the critical factors, multi-attributes approach to measuring satisfaction was employed in previous research [5,13,14,15,16]. Using this approach, a list of key product or service attributes are generated first and rated by customers according to its performance or customers’ experiences. Then, multiple-regression models are used to acquire the effect of attribute performance on customer satisfaction. It was identified that attribute level of satisfaction measurement can provide more constructive feedback for satisfaction improvement [17], and the management strategy is expected to be developed based on the importance and performance values of attributes for the limits of resources.
Traditional multi-attributes approach using regression models seems to be plausible and acceptable, however, there are still considerable disagreements on it. The implicit assumption of this approach is that the relationship between attribute-level performance and satisfaction is linear and symmetric, which means that as the attribute performance increases or decreases, overall satisfaction will change with it. Yet, more recent evidences have suggested that an asymmetric relationship exists between attribute performance and customer satisfaction [16,18,19,20]. These studies indicated that product or service quality is a multi-dimensional construct and the attributes do not have equal impact on customer satisfaction [21]. Depending on the importance of attributes, overall satisfaction will be affected by the level of attribute performance [22]. To address the non-linear relationship between attribute performance and overall customer satisfaction, Kano et al. (1984) conducted the study on the categorization of product or service attribute (quality elements) according to their impacts on satisfaction or dissatisfaction. This approach is consistent with the marketing literature which proposed that an asymmetric relationship exists between attribute performance and overall customer satisfaction.
According to the Kano model, attributes can be classified mainly as four categories: must-be factor, one-dimensional factor, attractive factor, and indifferent factor. Concerning the types of attributes, Kano provided the survey method to investigate and categorize them. However, this method was not widely applied for its limitations, such as only presenting the classifying results of attribute and being not easily understood and implemented [23,24]. For these reasons, other analysis methods have been provided in recent years, such as dummy-variables regression and partial regression methods. Nevertheless, different techniques brought diverse results owning to the limitations of these methods. Consequently, it is necessary for a greater number of studies to compare the results of different techniques [16].
The purpose of this study is to develop a new method for analyzing the asymmetric satisfaction response to attribute level performance. In line with Danaher [25], we use the response surface method to derive the nonlinear relationship between attribute performance and overall customer satisfaction. As an indirect approach, attribute importance derived from this method can reflect customer’s real attitudes, and the effects of attribute performance on overall satisfaction can also be judged more accurately. The other feature of response surface method is the interaction effects of attributes that can be conducted, which were not involved in other techniques used in previous studies. To obtain the category of attributes, an importance grid analysis method is also employed. Based on these two methods, pivotal attributes and asymmetric impacts of attributes on satisfaction can be acquired. These results can help managers gain insight into developing targeted strategies to improve customer satisfaction and stimulate customers’ purchase intentions.
The rest of this paper is organized as follows: Section 2 gives a brief overview of attribute performance and customer satisfaction, Kano’s model, and importance grid analysis method. The proposed methodology is outlined in Section 3 with taking the rural tourism service in China as the study object. Then in Section 4, the response surface method combined with the importance grid analysis is presented. In this section, the multiple regression with dummy variable method is also employed for the comparison of the results. Finally, the discussion and conclusion are drawn in Section 5.

2. Theoretical Background

2.1. Attribute Performance and Customer Satisfaction

Product or service attributes usually include features, functions, benefits, and uses, which are the characteristics by which offerings are identified or differentiated [26]. Lancaster indicated that customers’ preferences were not on the product itself but on its characteristics or attributes [27]. Therefore, customers are more likely to evaluate satisfaction at an attribute-level rather than product level [28]. Furthermore, researchers pointed out that satisfaction is a function of performance on products or attributes, and it can be increased through measuring and managing performance ratings on these drivers [11,13,29]. For these reasons, attribute-level approach is thought to be a better understanding of overall customer satisfaction [16]. Based on that, other researchers suggested that customer satisfaction should be evaluated on a multi-attribute scale [30].
Although the multi-attribute approach has implications for analyzing customer choice and decision making, several problems arise when measuring satisfaction. First, this approach fails to distinguish the customer’s experience or evaluation on attributes of positive and negative performance [13]. In 2010, in Oliver’s research, when product performance is worse than expect or standard, negative discrepancy exists. Conversely, positive discrepancy will exist when performance is better than standard. Other researchers also stated that positive or negative of attribute performance has different impact on overall customer satisfaction [13,
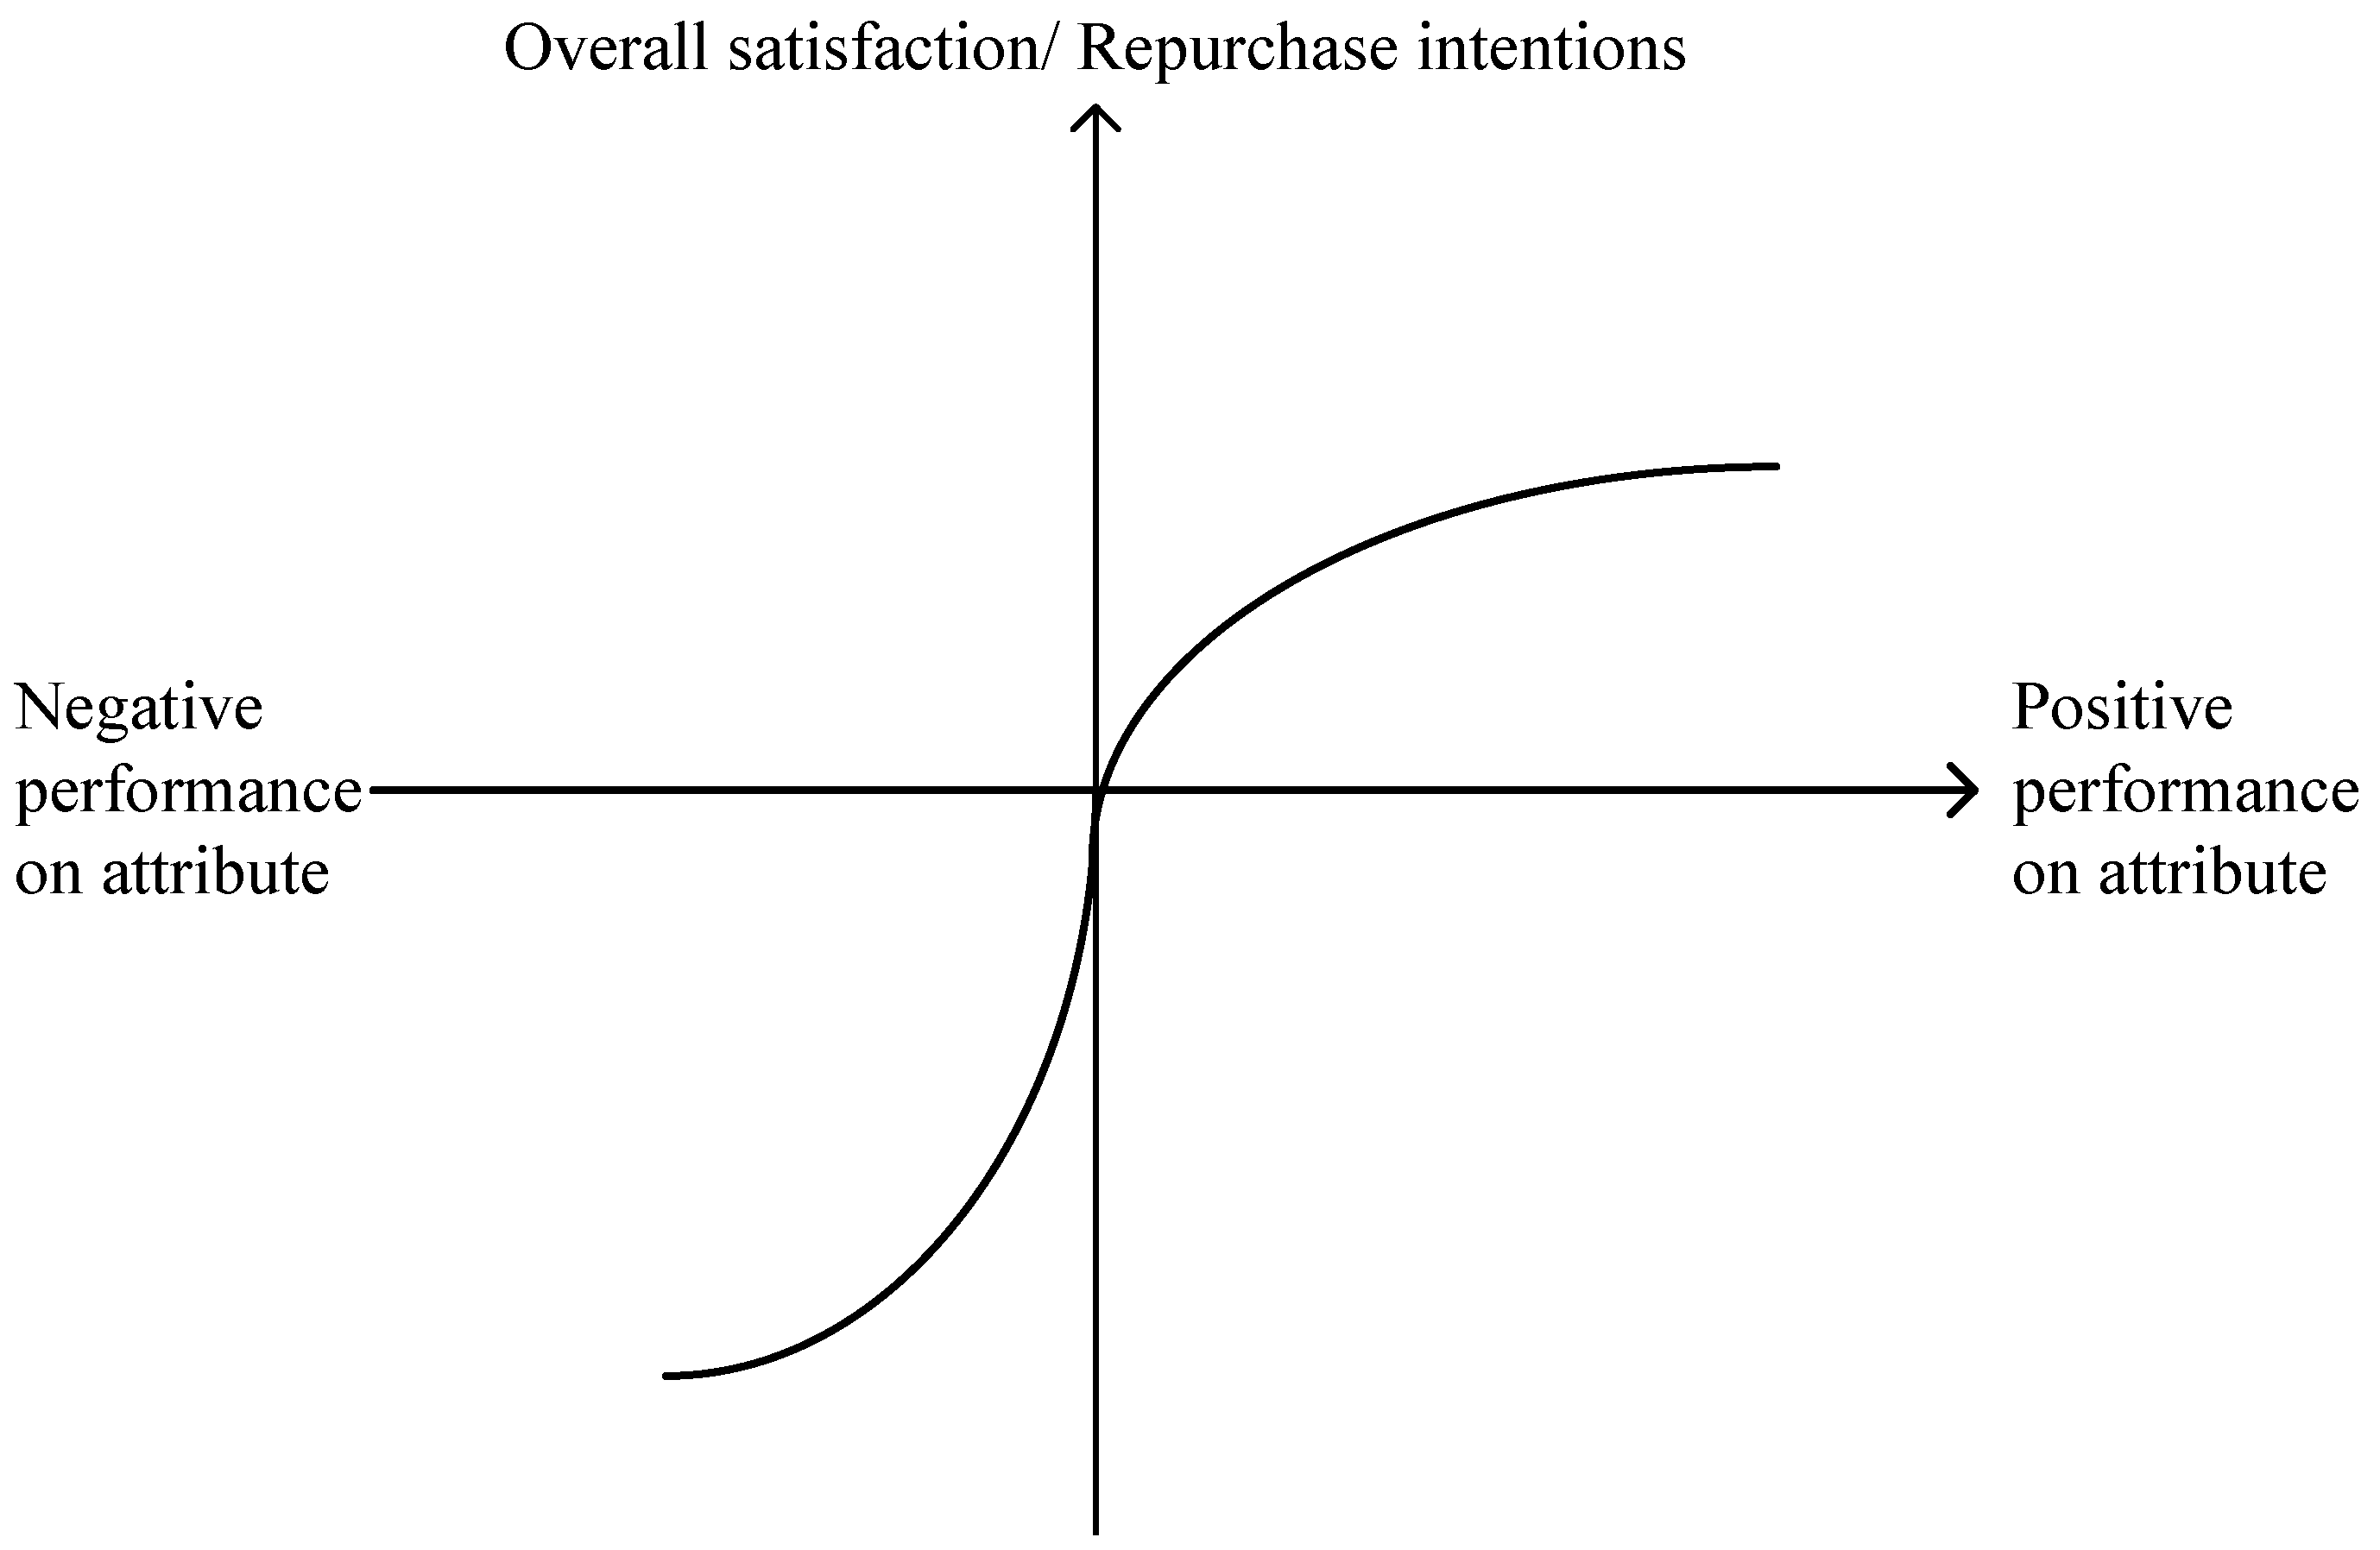
31]. The other limitation of this approach is that it treats the relationship between attribute performance and overall satisfaction as symmetric and linear. Under the linear relationship assumption, attributes with high performance will lead to satisfaction, and low performance will cause dissatisfaction. Yet, many studies have shown that the symmetric relationship has not always held true [32,33]. Mittal, in 1998, demonstrated that positive and negative performance on an attribute has different impacts on overall satisfaction based on prospect theory. As shown in Figure 1, negative performance on attributes has a greater impact on overall satisfaction than does positive performance [13].
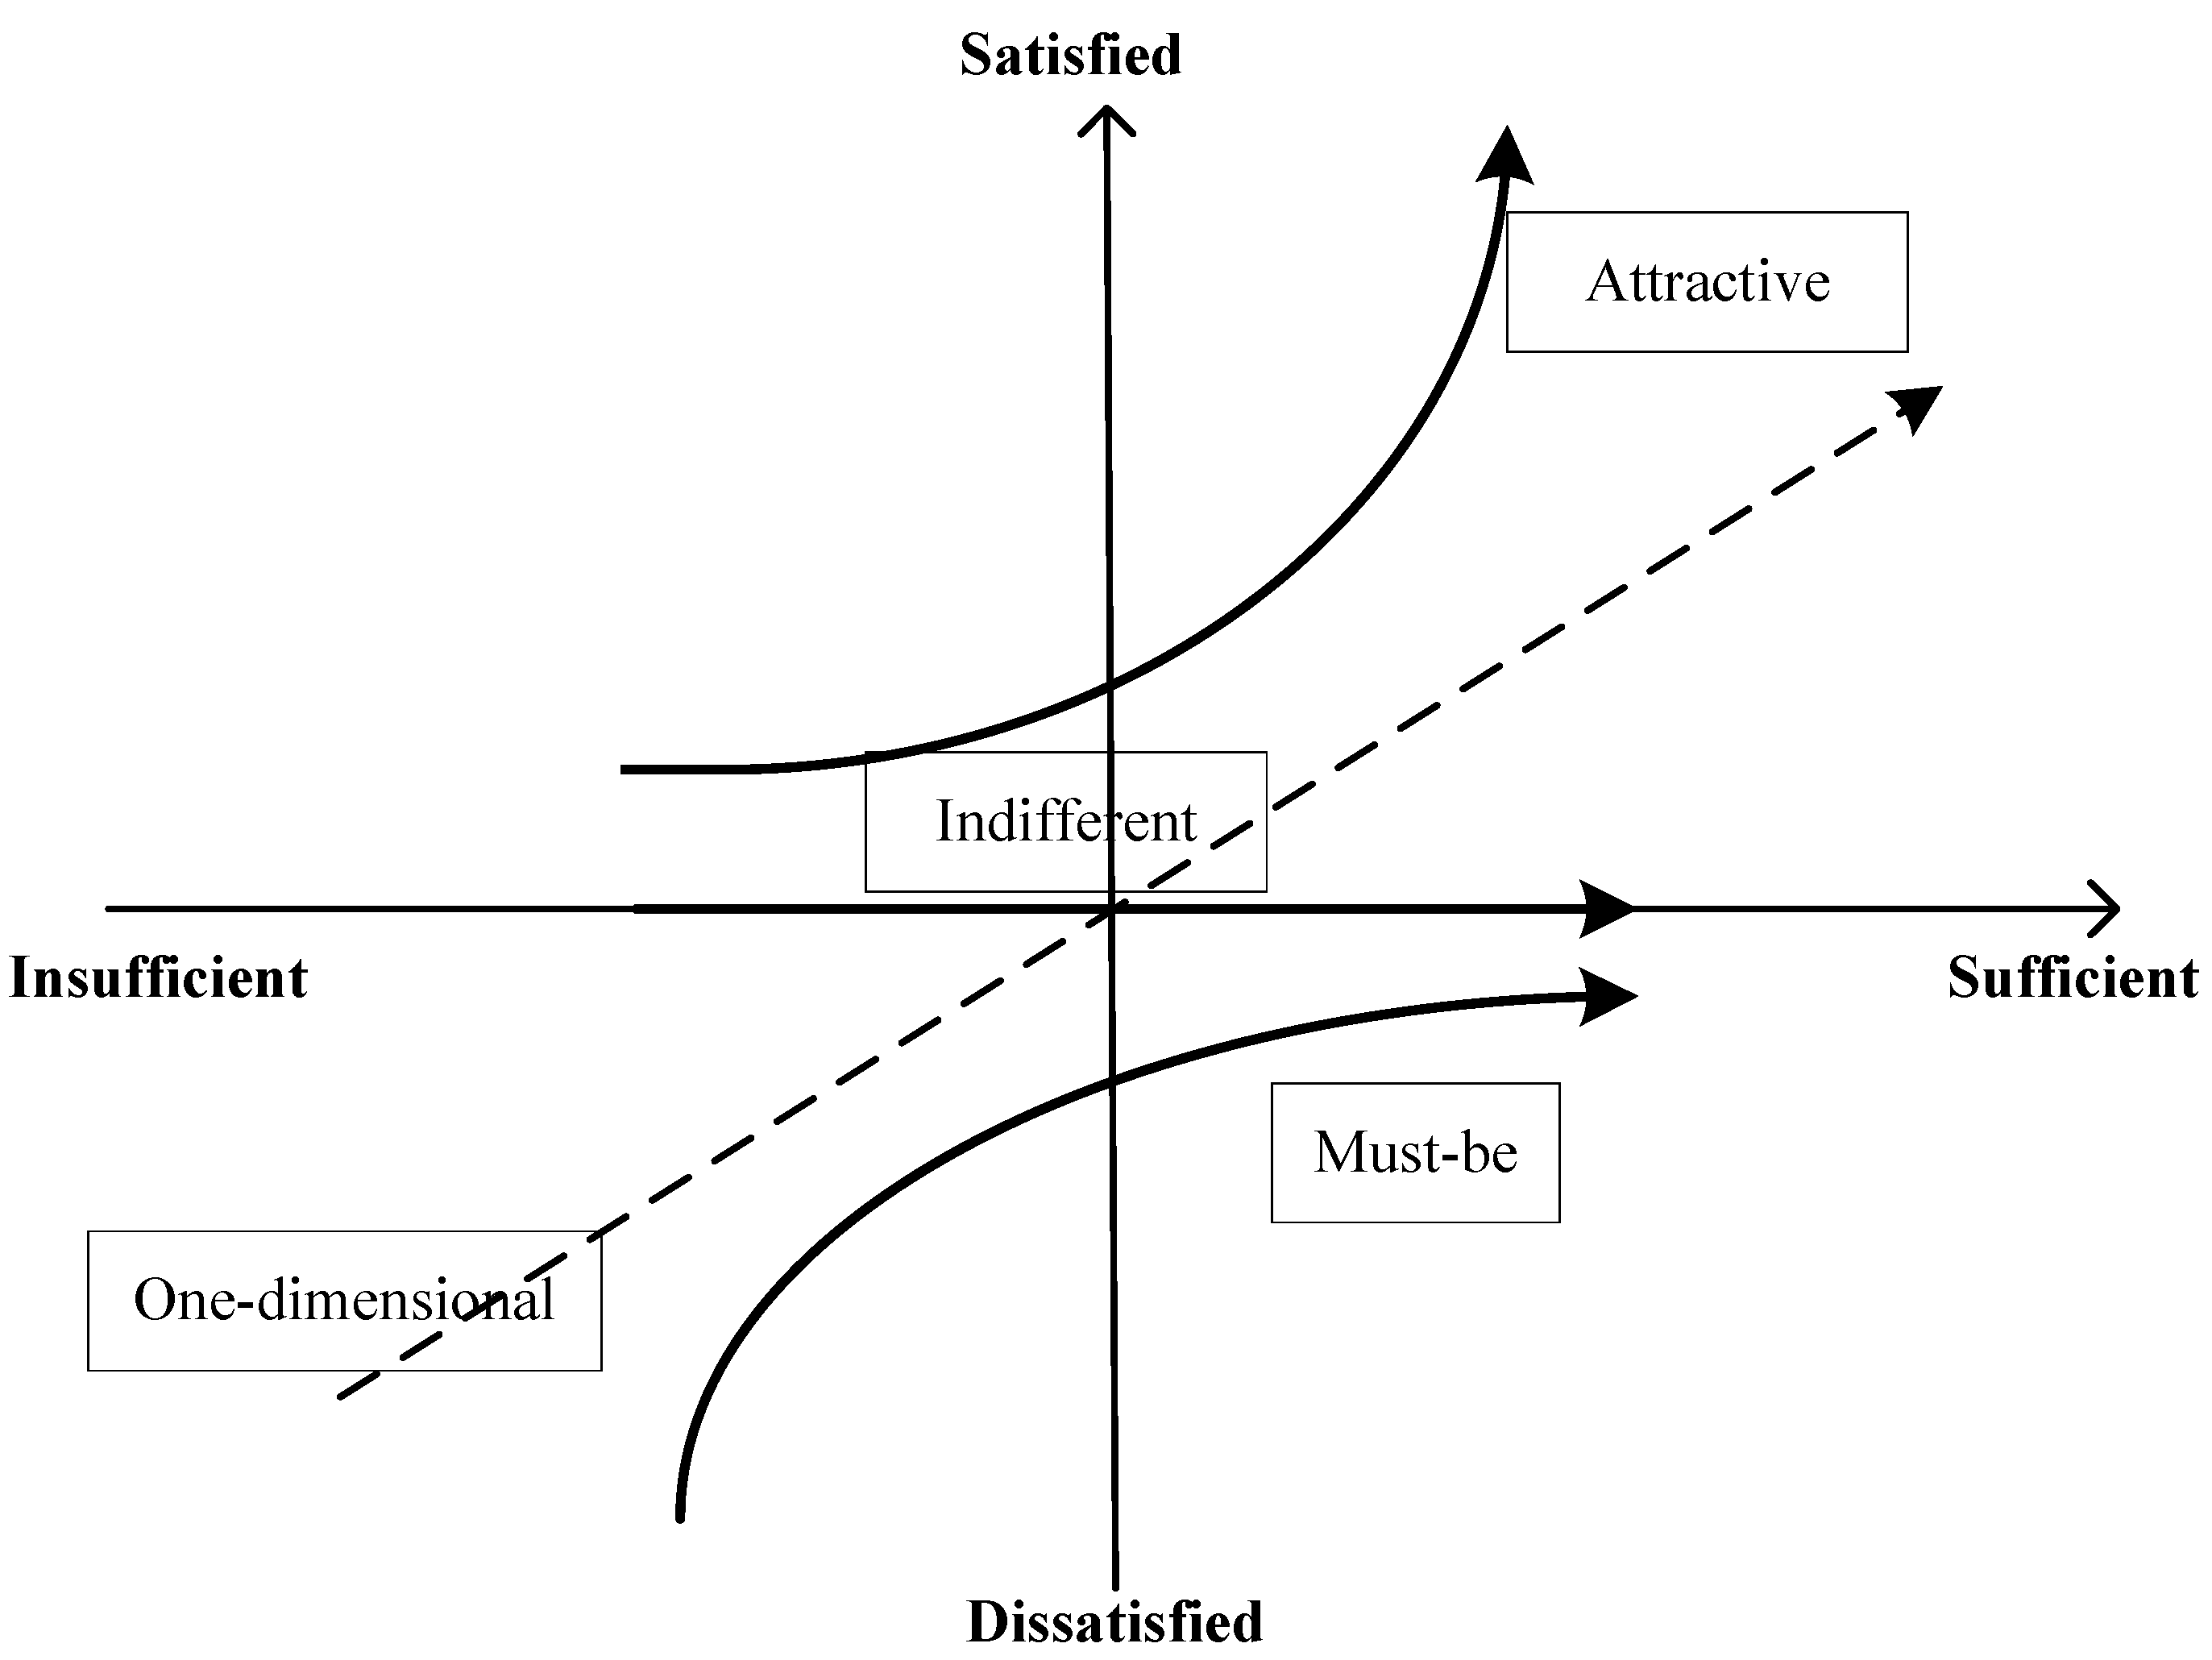
Over the past decades, many studies have been carried out for investigating the asymmetric relationship between attribute performance and satisfaction. Since being proposed in 1984, the Kano model has been the most popularly implemented method in research on nonlinear relationship between attribute performance and satisfaction. This model was named “attractive quality creation” (AQC) by Kano, which means “creating a new product with a quality that cannot only be distinguished from the qualities of the current products but also is attractive for customers” [34]. Based on a two-dimensional recognition, the physical sufficiency of the product or service is taken along the horizontal axis with “insufficient” and “sufficient” levels, and the customer’s perception with “satisfied”, “neutral” and “dissatisfied” levels is taken along the vertical axis (Figure 2). To enable the measurement to be understood more easily, other studies described the horizontal axis as “expectations” (not fulfilled to exceeded), and the vertical axis is expressed as “customer delight” (low to high).
Based on quality’s evaluation patterns, four qualities can be acquired, including attractive quality, one-dimensional quality, must-be quality, and indifferent quality. The first three qualities are the most commonly used in the research, which are also described as three satisfaction factors including excitement factor, performance factor and basic factor. Kano model is thus referred to as three-factor theory. Basic factor (must-be quality) can respond to the basic needs for the product or service. This factor will cause dissatisfaction if not fulfilled, but do not bring customer delight if exceeded. On the contrary, excitement factor (attractive quality) can increase customer satisfaction if delivered but do not cause dissatisfaction if not fulfilled [35]. Performance factor (one-dimensional quality) will lead to satisfaction on the high-performance attributes, and dissatisfaction on the low performance.
Regarding development of research theme in the Kano model, Witell, in 2013, stated the emergence and development phases of it. Classification of attributes and combination of Kano methodology with other methods are the research themes dominate according to the research results [36]. In other studies, techniques or methods used in the Kano model were also the research focus [16,24,37,38]. For example, Mikulić, in 2011, compared four techniques with Kano method from the perspectives of validity and reliability [38]. The Kano model is reasonable with the assumption that product or service attributes have a varying impact on overall customer satisfaction depending on their current level of performance [37]. Although it has been empirically justified in several studies, the agreement was not established on assessment method of quality elements. For this reason, various modified or new approaches have emerged in recent years based on different research backgrounds and objectives.

2.2. Importance Grid Analysis

Vavra, in 1997, firstly proposed that importance grid can be used to identify the three satisfaction factors [39]. Alternative to the imaginary scheme given by Kano, importance grid is constructed depending on whether the importance of attribute is derived explicitly or implicitly. Customer’s self-stated importance is identified as explicit importance, which is the indicator of an attribute’s dissatisfaction-generating potential. As an indicator of satisfaction-generating potential, implicit importance is obtained indirectly by applying other techniques such as regressing attribute-level performance against overall satisfaction [12,38,40].
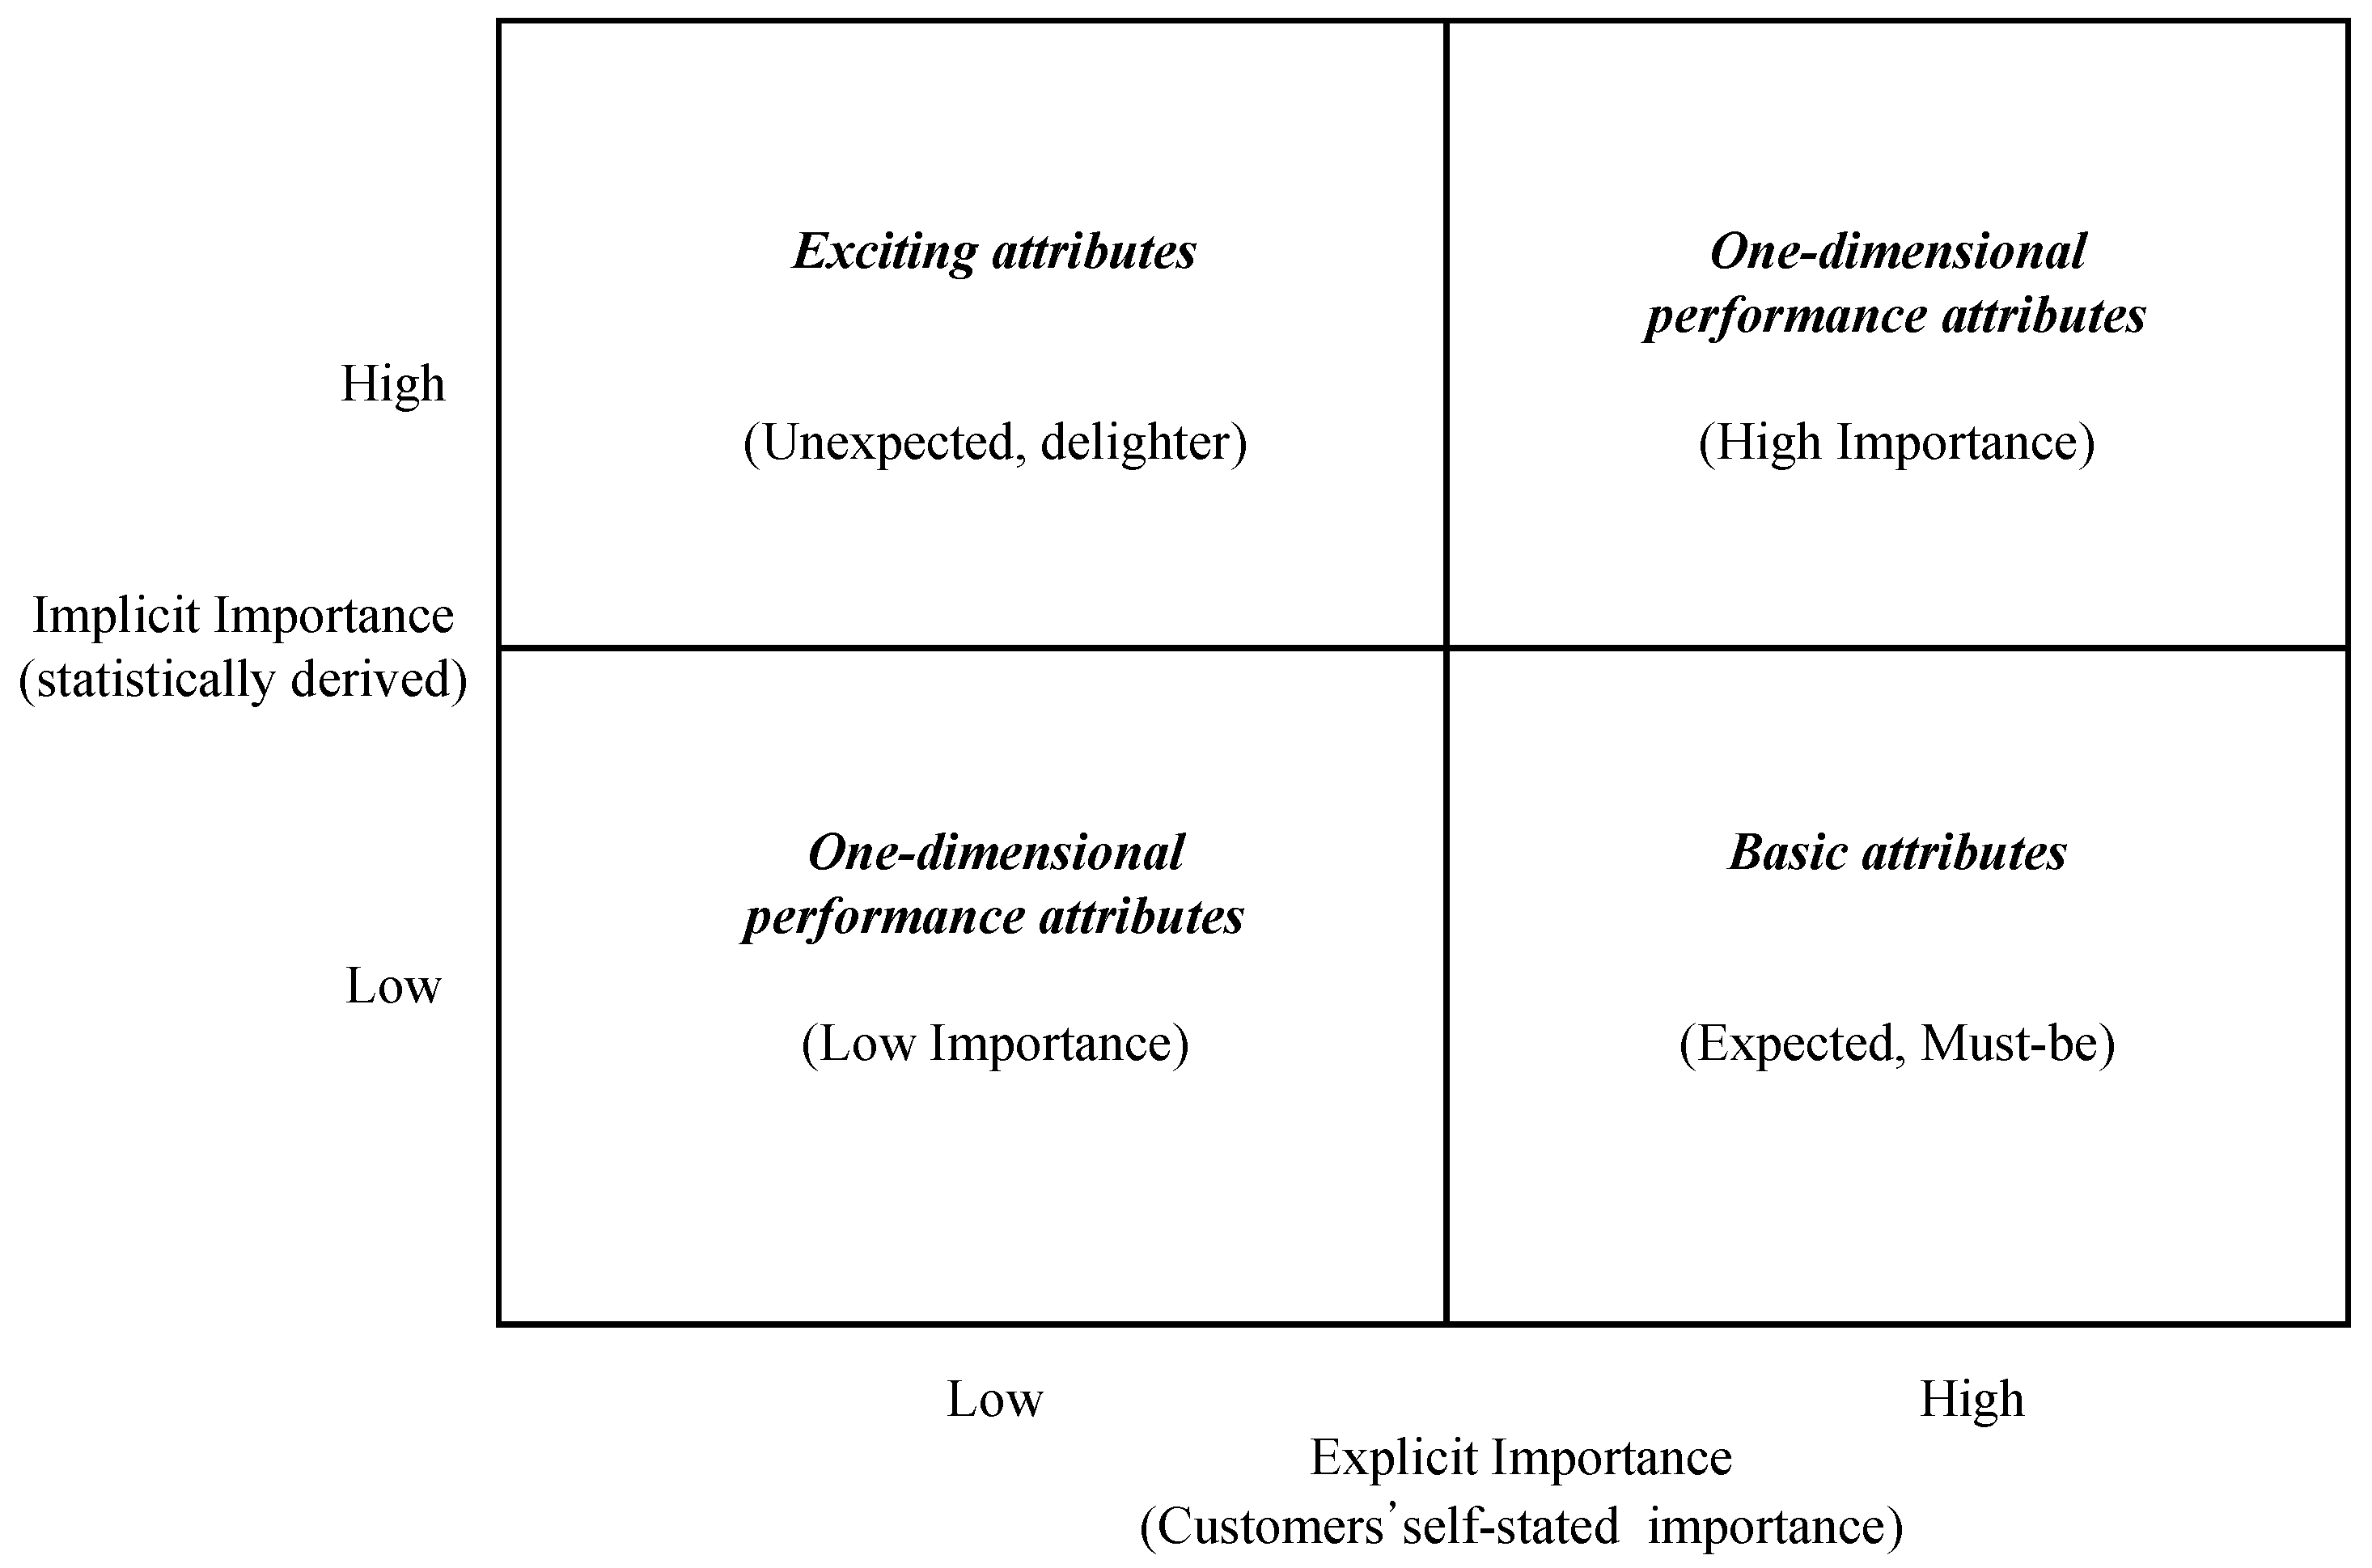
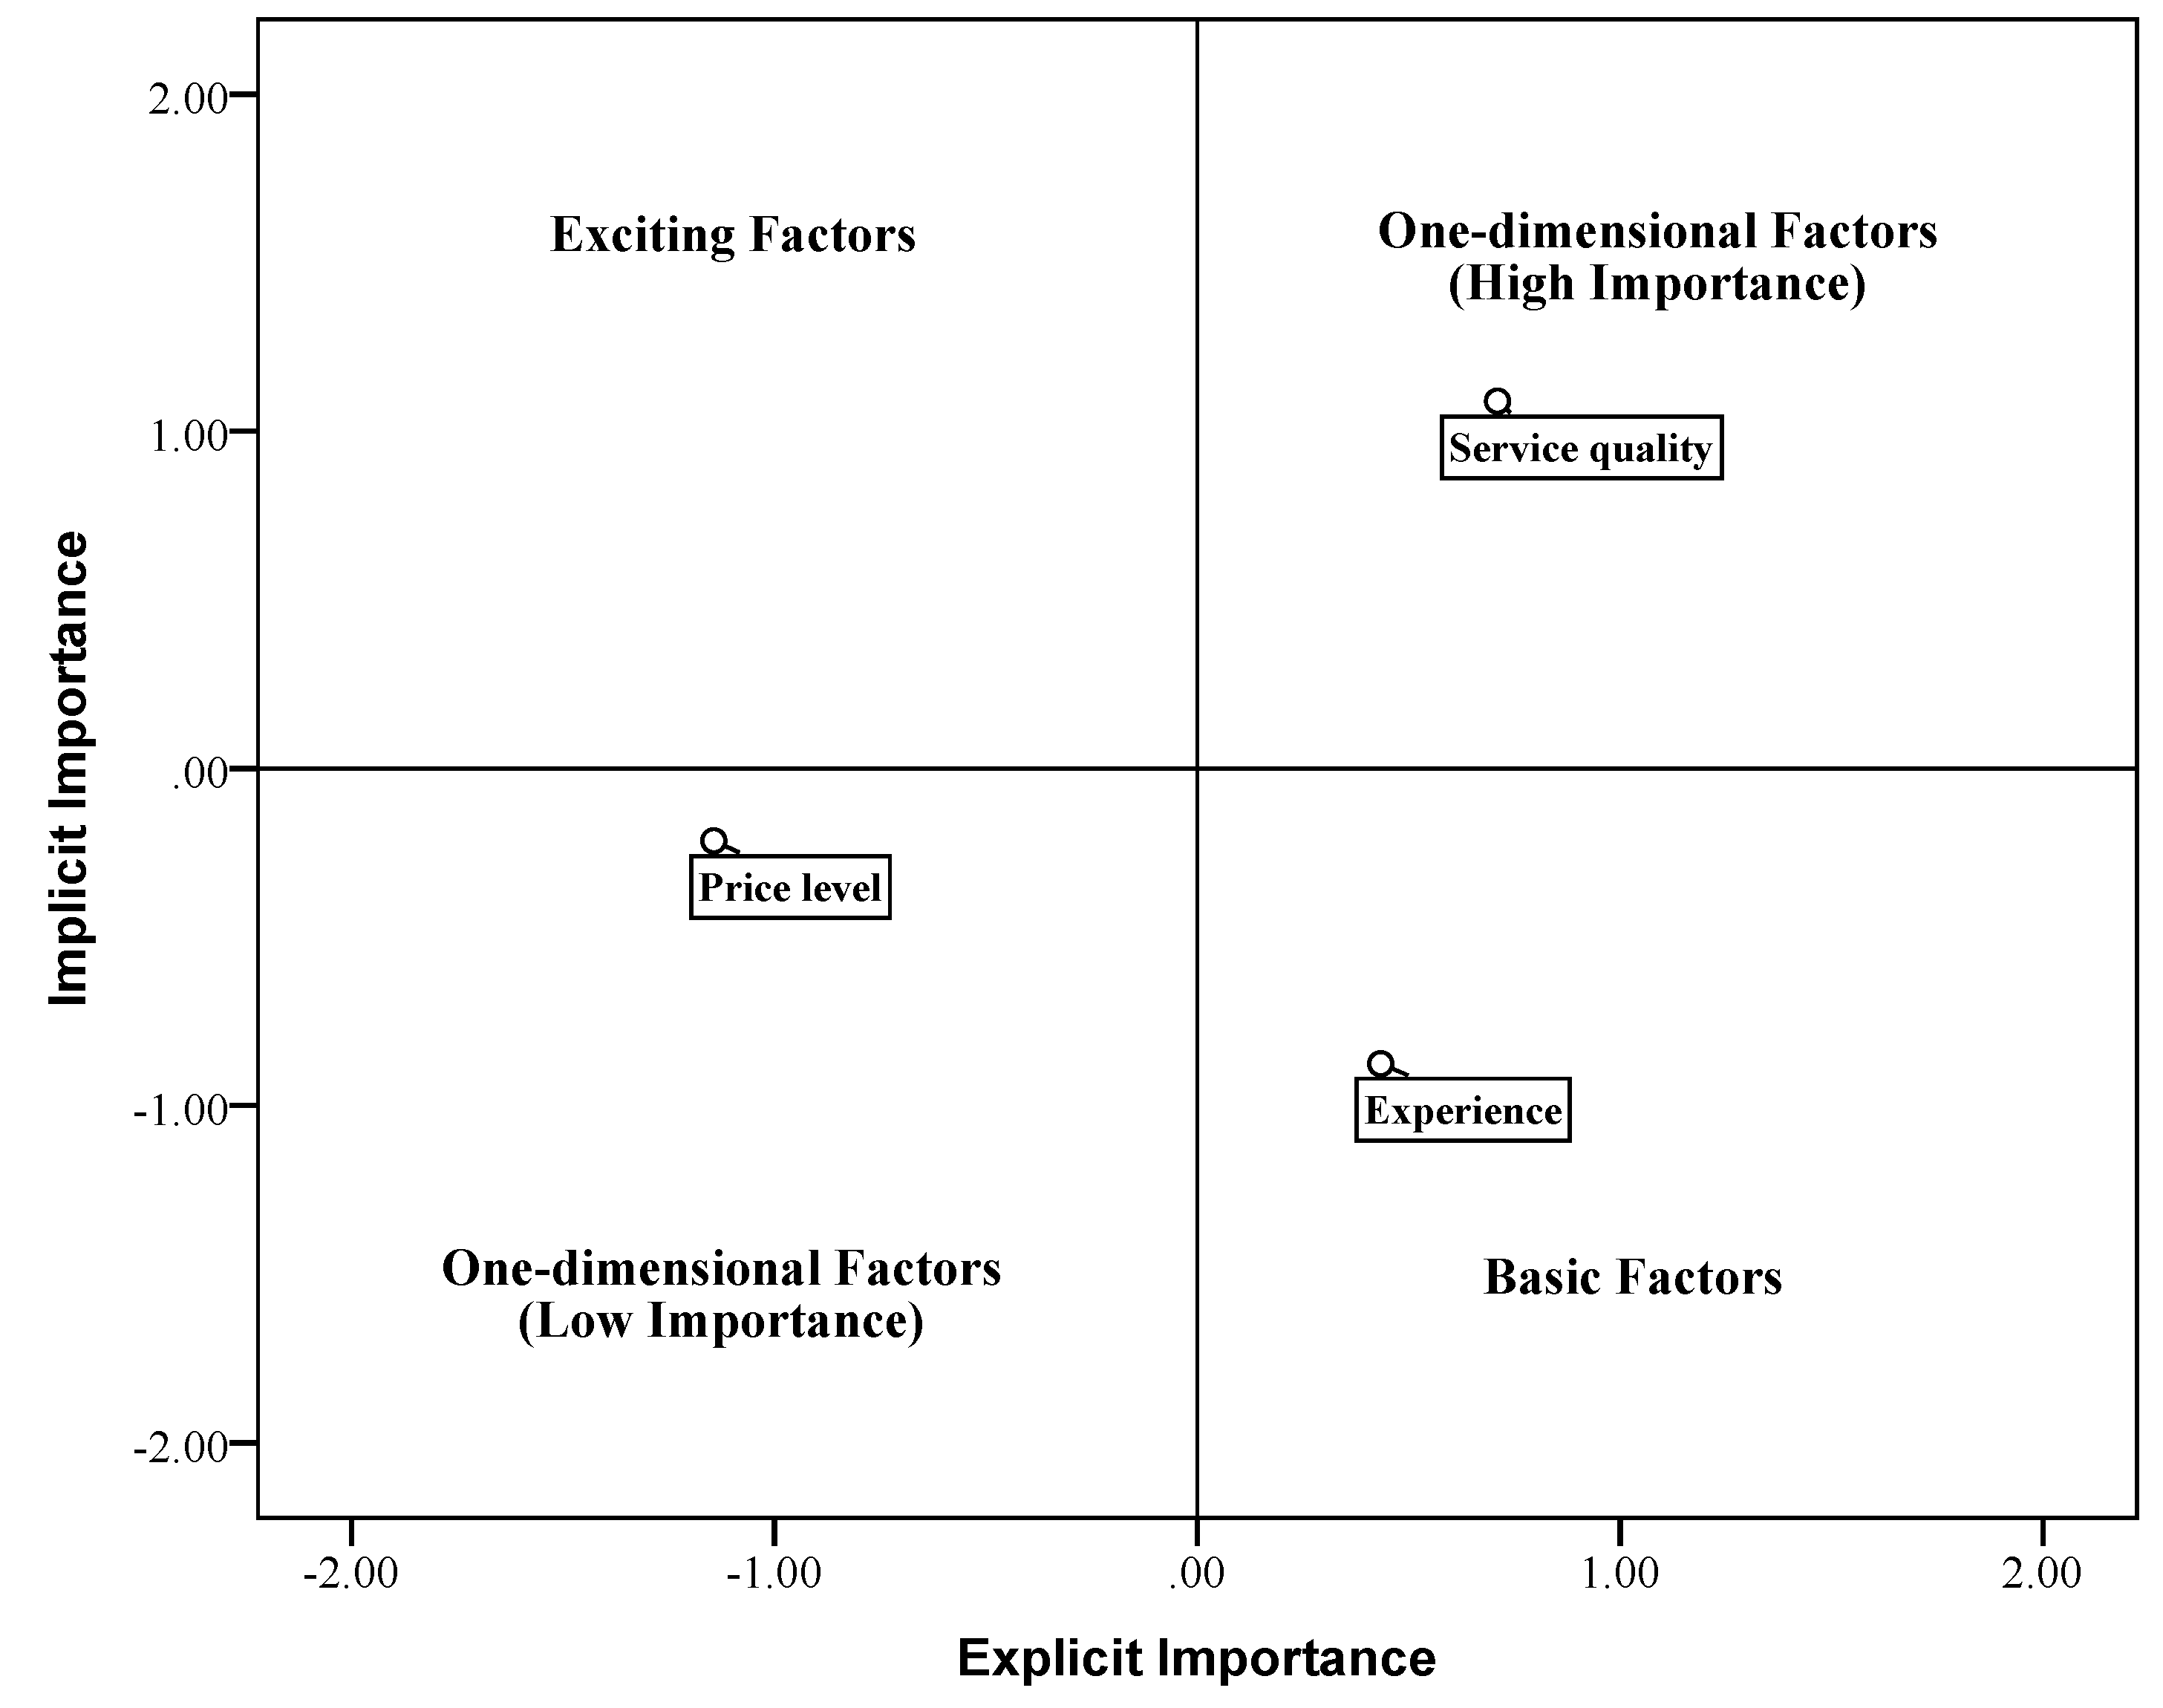
The assumption of importance grid analysis is that explicit importance and implicit importance might differ on reflecting the attribute’s importance–satisfaction relationship. Also, it is stated that the customer’s self-stated importance cannot measure the relative importance of attribute adequately [41]. Importance grid analysis combines attribute importance weights derived explicitly and implicitly in a two-dimensional grid, and the attribute can be plotted according to the differences in importance weights (Figure 3).
In terms of importance grid analysis, basic attributes are the factors which have the strong negative impact on overall satisfaction in low-level performance, but do not have a significant positive impact for high-level performance. As the minimum requirements of product or service can thus be identified as high importance in directly derived evaluation of attributes, but low importance in indirectly derived evaluation. Different from the basic attributes, exciting attributes are identified as not much important in directly derived evaluation but high importance in indirectly derived evaluation for its positive relationship with overall satisfaction on the high performance of attribute. For the one-dimensional performance attributes, the corresponding changes can be shown between the performance of attribute and overall satisfaction. It means that the attributes with high explicit and implicit importance can be explained as high importance attributes, and contrary to it, low importance attributes show the little importance both in explicit and implicit ways.
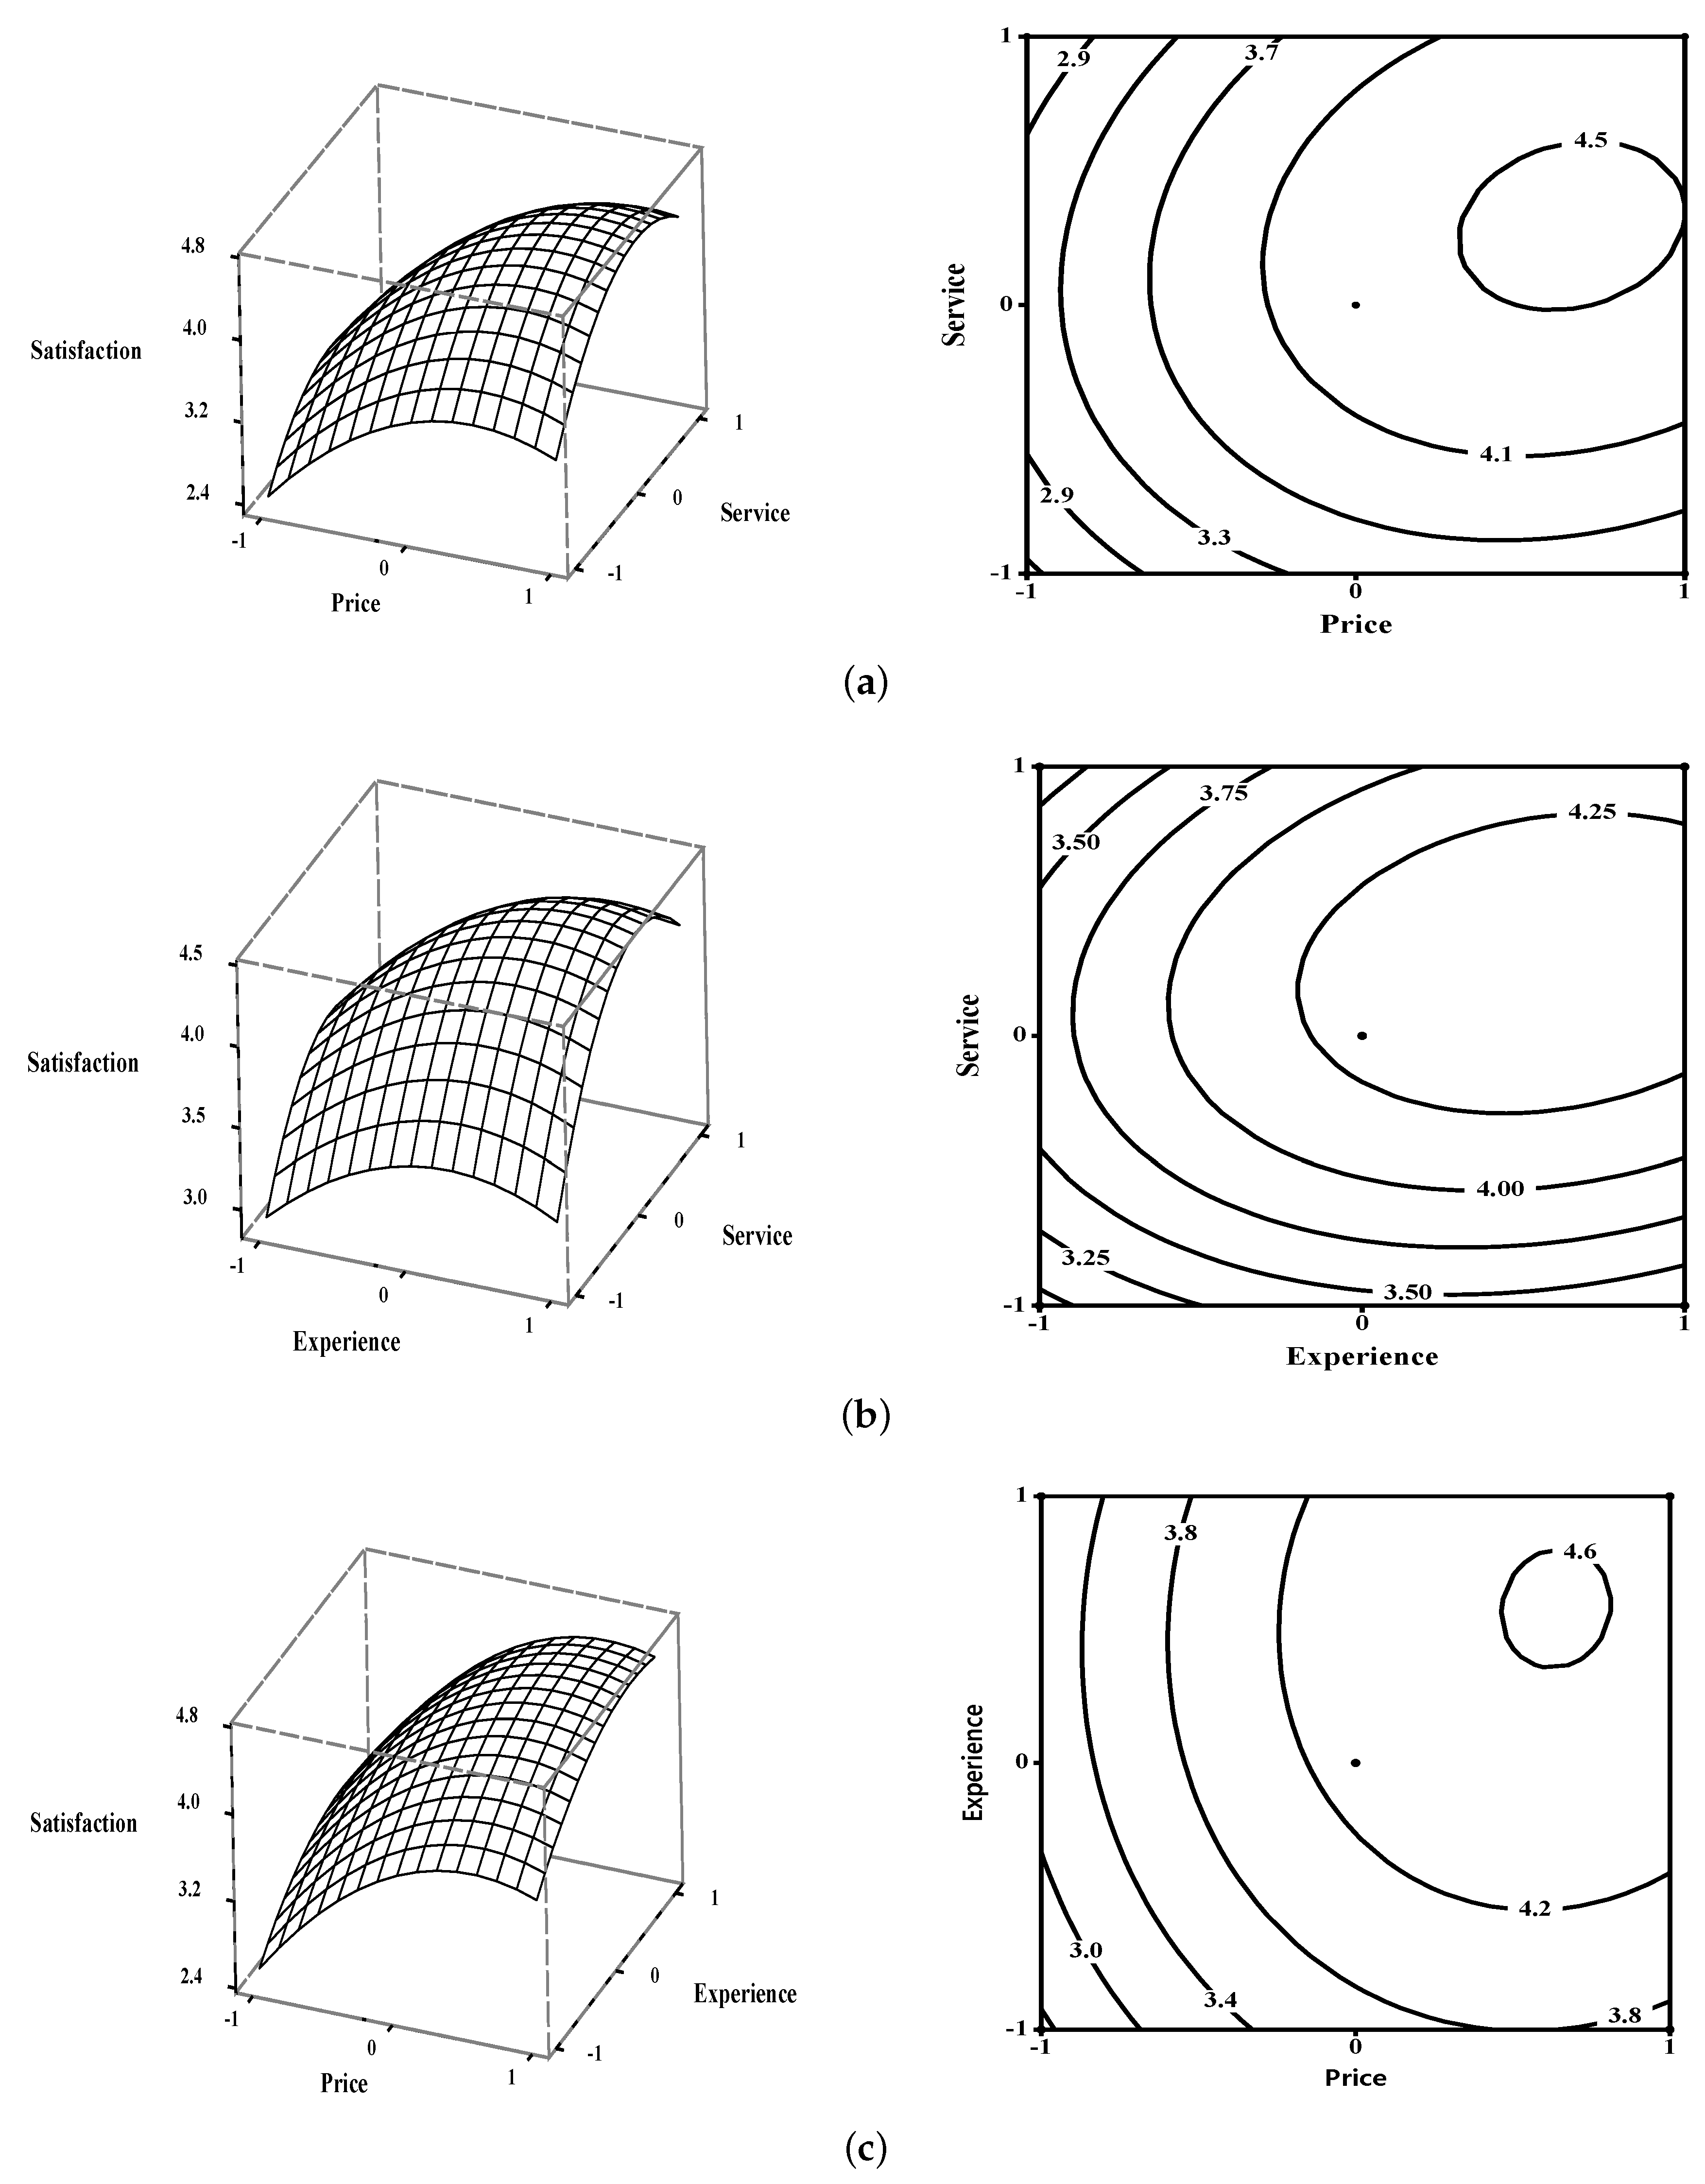
Based on the Kano model, we will use the response surface method and importance grid analysis to derive the relative importance of the attributes and classify the quality factors. In the process of response surface analysis, Box–Behnken design will be applied in profile design for reflecting consumer’s real attitude on the attributes. Therefore, this integrated approach can express the nonlinear relationship between attribute performance and satisfaction. Furthermore, it can also avoid the shortcoming existed in the regression analysis which excludes the information associated with average (common) level of performance [24].

3. Methodology

3.1. Response Surface Method

Response surface method is a kind of statistical and mathematical technique, which has been extensively utilized in product developing, improving, and optimizing processes [42]. In recent years, this method was also employed in the research on attribute importance, customer satisfaction and job satisfaction [25,43,44,45].
In general, when a product, process, or system was concerned involving a response y that depends on the controllable input variables ξ 1 , ξ 2 ξ k , it was convenient to transform the natural variables to coded variables x 1 , x 2 x k which are usually defined to be dimensions with mean zero and the same spread or standard deviation, which can be written as
η = f ( x 1 , x 2 x k ) .
If the response is well modeled by a linear function of the independent variables, the first-order model can be employed. For the case of two variables, it can be described as
y = β 0 + β 1 x 1 + β 2 x 2 + ϵ .
When the first-order model was not adequate, which means there was curvature in the system, a polynomial of higher degree will likely be requested, such as the second-order model
y = β 0 + i = 1 k β i x i + i = 1 k β i i x i 2 + i < j β i j x i x j + ϵ .
For the case of three variables, the second-order model is
y = β 0 + β 1 x 1 + β 2 x 2 + β 3 x 3 + β 11 x 1 2 + β 22 x 2 2 + β 33 x 3 2 + β 12 x 1 x 2 + β 13 x 1 x 3 + β 23 x 2 x 3 + ϵ .
Response surface method is an effective approach for the performance optimization, and it could be thus applied to evaluate the performance of independent variable on response. To produce a maximum estimated response, one should find the path of steepest ascent in the first-order model. Similarly, in the second-order or higher-order model, the location of the stationary point is focused. For the case of three variables, the stationary point is the solution to
y x 1 = y x 2 = y x 3 = 0 .

3.2. Regression with Dummy Variable

The dummy variable regression approach was adopted in previous studies for assessing non-linear, asymmetric impact of attribute performance on overall satisfaction [13,31,46]. Before conducting the analysis, attribute performance ratings are coded to form the dummy variables, such that “high performance” is coded (1, 0), “low performance” (0, 1), and “average performance” (0, 0). Then two regression coefficients for each variable can be obtained, which are used to measure the impacts when performance is low or high. Through comparing the negative and positive estimates, the category of the quality factors can be identified (Table 1).
Regression method have attracted the attentions of many researchers, and it is recognized by taking away some of the usefulness of the data to plot the nonlinear effect [24]. However, as others have highlighted [20,38], this approach is more practical as a means to identify how the attribute operates, and the conceptual validity as a Kano classification method was also questioned.

3.3. Questionnaire Design and Survey

This study conducted a survey of rural tourism satisfaction to demonstrate the application of the proposed approach. Previous studies on rural tourism attributes mainly concentrated on functional factors (i.e., reservation system, service quality) and technical factors (i.e., room size, price level, activities), access evaluation, lodgings availability and so on [47,48,49,50,51]. Based on these research and considering the characteristic of rural tourism product in China, this study initially selected six factors (transportation, price level, rural lodging, rural eating facilities, experience of rurality and rural tourism service quality) as the expectation and satisfaction factors. However, after consulting with tourism researchers and travel agency managers, we decided to delete three factors (transportation, rural lodging and rural eating facilities) from them. The reason to delete transportation is that transportation evaluation includes many aspects, such as time, price, comfortability. It will make the respondents feel difficult to evaluate. The reason to delete the other two factors is mainly because of the location of the survey region and the rural scenic spots. The rural scenic spots selected in this study are very close to the city. For a short journey, not every rural tourist has experiences of rural eating and lodging. Therefore, three factors were selected in this study including rural tourism price level, experience of rurality and rural tourism service quality (abbreviated in “price”, “experience” and “service” in the data analysis).
Regarding measurement of attributes performance, we used three-point scale: “worse than expected”, “about the same as expected”, and “better than expected”. The design of performance ratings was based two reason. First, according to Anderson, in 1972, and Swan, in 1976, the ratings of performance has the direct relation with the comparison result of customer’s expectation [52,53]. It means that satisfaction is associated with performance that fulfills expectations. Second, the ratings will be easier to be understood by respondents. Because it will be abstract to evaluate performance without reference objects, using the expect ratings is a better choice than “low performance” to “high performance”. Also, we can see this rating was implemented in other studies [25,31]. Levels and coding of attributes performance are shown in Table 2, “worse than expected” is coded “1”, “about the same as expected” is coded “0”, and “worse than expected” is coded “ 1 ”. This experiment design utilizes three factors each with three levels and will result 3 3 = 27 treatments, which is too many for the respondents to evaluate. Different from previous research, this study applies Box–Behnken design (BBD) which is evaluated as a very effective design method to research the relationship among variables. According to BBD, the profile design used 12 runs (as shown in Table 3) with three coded levels and central point experiment for three times.
For the case of three factors with three levels each, it needed 12 experimental runs and three central point experiments coded with (0, 0, 0). Therefore, we designed 15 questions according to the BBD method, and used five-point Likert scale, with 1 for “very dissatisfied” and 5 for “very satisfied” to evaluate the satisfaction of the combination of the three attributes with different levels. As to the central points experiment, we used different evaluation measurement questions for avoiding the confusion of respondents. Consequently, each respondent was asked to rank 15 alternatives. Referring to Danaher 1997 research, the questions designed in this survey are shown in Table 4.
We also designed the questions that ask customers to evaluate the importance and performance of attributes, and overall satisfaction directly. Regarding importance evaluation, we used five-point Likert scale of 1 (very unimportant), 2 (somewhat unimportant), 3 (neither unimportant nor important), 4 (somewhat important), and 5 (very important). Similar scale was also used in overall satisfaction evaluation, which used 1 (very dissatisfied), 2 (somewhat dissatisfied), 3 (neither dissatisfied nor satisfied), 4 (somewhat satisfied), and 5 (very satisfied). For the attribute performance evaluation, we used three scale of 1 (better than expected), 2 (about the same as expected) and 3 (better than expected). The results of these questions will be used in regression analysis with dummy variables as a comparison and validity test to the proposed approach.

4. Research Results

4.1. Analysis of Basic Information

The survey was conducted online in a snowball sampling approach from 27 October to 11 November 2018. The residents in Dandong city who had already participated in rural tourism were selected. Because there are two famous rural scenic spots in Dandong city and many residents in Dandong have visited there. Regarding the evaluation on satisfaction of rural scenic spot in this questionnaire, we gave the options of “Dalishu rural scenic spot” (Dandong city), “Qingshangou rural scenic spot” (Dandong city) and “other rural scenic spot”, which can make sure as many rural tourists can participate in this survey. A total of 282 online questionnaires were received. According to the pre-survey, 5–10 min is needed to read and complete all the questions. Therefore, the questionnaire completed in less than 5 min and more than 10 min were deleted, and the questionnaires with all the options had the same answers were also deleted. Finally, 171 valid and usable questionnaires were kept for analysis, and the demographic profiles of these respondents are summarized in Table 5.

4.2. Applying Response Surface Method to Analyze the Importance of Attribute

We used SAS procedure RSREG to fit the satisfaction response surface model. The attributes were coded so that “worth than expected” was 1 , “about the same as expected” was 0 and “better than expected” was 1. The dependent variable was the satisfaction rating coded 1 through 5. There are 15 such observations per respondent according to the BBD method. The fitted models are given in Table 6 and Table 7 for the rural tourism destination. Since the R 2 of 40.71% (adjusted- R 2 = 40.50%) is higher than the linear, quadratic and cross-product model, the full response surface model is better. We also checked the multicollinearity of the three independent variables using SAS, the results were summarized in Table 8. It is shown that these variables are independent with respect to the linear model.
Now we can have the function of price, experience, service and satisfaction as follow
S a t i s f a c t i o n = 4.31 + 0.65 p r i c e + 0.34 e x p e r i e n c e + 0.25 s e r v i c e 0.54 p r i c e 2 0.33 e x p e r i e n c e 2 0.65 s e r v i c e 2 + 0.07 p r i c e e x p e r i e n c e + 0.20 p r i c e s e r v i c e + 0.17 e x p e r i e n c e s e r v i c e + ϵ .
The derivation of this directional derivative is given in Equation (5) where ( x 1 , x 2 , x 3 ) = (price, experience, service), and the derivative of the satisfaction function is
S x 1 = 0.65 1.08 x 1 + 0.07 x 2 + 0.20 x 3 S x 2 = 0.34 + 0.07 x 1 0.66 x 2 + 0.17 x 3 S x 3 = 0.25 + 0.20 x 1 + 0.17 x 2 1.30 x 3 .
Through the functions, it can be indicated that satisfaction is maximized at (price, experience, service) = (0.718, 0.688, 0.394). Response surface plots and contour plots for the three attributes are displayed in Figure 4.
Finally, we computed the mean of ratings based on the actual rural tourism experience, which used three-point rating scale represent “worse than expected”, “about the same as expected” and “better than expected”. The mean of the three attributes are x a c t u a l = (0.111, −0.199, −0.234). We put the values into the equation got in the last step, the value of performance then can be acquired, which are S x a c t u a l = (0.464, 0.427, 0.537). The relative importance values of the three attributes are thus obtained. Although the values are very close, service quality can be seen as the most important factor, followed by price level, while experience of rurality is less important than the other attributes.

4.3. Creation of the Importance Grid

Using importance grid analysis method, classification of Kano’s quality can be obtained. First, the attribute importance value derived directly can be acquired from questionnaires, and explicit importance value has been known in response surface analysis. The results are shown in Table 9.
Then the grand means of explicit and implicit attribute importance values are used as the axis of the plot, and three attributes are plotted in the grid (Figure 5). It is shown that “experience of rurality”, which constructs with high explicit and low implicit importance of attribute, forms the basic factor of overall customer satisfaction. “Price level” has low explicit and implicit importance and forms the unimportant one-dimensional factor. On the contrary, with the high explicit importance and high importance, “tourism service quality” forms the high important one-dimensional factor.
Due to “tourism service quality” is classified as the high important one-dimensional attribute, it is suggested that improvement of efforts and special attention should be given to help enhance the customer satisfaction. As the basic factor, “experience of rurality” is thus suggested that business managers should pay more attention to keeping the existing level and minimizing the cost of it.

4.4. Regression Analysis with Dummy Variables

Regarding the application of regression analysis, we need to compute the mean of the performance’s ratings on the actual rural tourism experience, which used five-point rating scale representing “very dissatisfied”, “dissatisfied”, “neither dissatisfied nor satisfied”, “satisfied” and “very satisfied”. It is shown that the mean of the three attributes’ performance values are (price, activity, service) = (3.790, 4.333, 4.306). Then the dummy variables need be recorded before running the regression with dummy variables. The performance of attribute was coded as “low performance” (0, 1), “high perform” (1, 0), and “average performance” (0, 0). As the survey used 5-point Likert level, we define ratings 1 and 2 as “low performance”, 3 as “average performance”, 4 and 5 as “high performance”.
According to the coding scheme, a multiple regression analysis with two dummy variables was conducted. For each attribute, we obtained two regression coefficients to measure the impact when performance is high or low. Table 10 shows the results of the regression analysis.
Through analyzing the impact of attribute performance on overall customer satisfaction, the factor structure of customer satisfaction can be identified (as shown in Figure 6). Figure 7 illustrates the changes of attribute importance value depending on the satisfaction. It is shown that “experience of rurality” can be classified as the basic factor, “tourism service quality” is a high-performance factor, and “price level” is a low-performance factor. It is shown that the same classification results are acquired from regression method and the integration method of response surface and importance grid analysis.

5. Discussion and Conclusions

5.1. Discussion

Until now, many techniques have been employed to clarify product or service attributes’ priority for enhancing the overall customer satisfaction. However, each technique has limitations such as the linear assumptions, complexity of equation and difficult to conduct a survey. Therefore, the objective of this study is to propose a better approach which can categorize the factors properly, and express the nonlinear relationship between attributes and satisfaction. With this purpose, this study proposed a new approach that combines response surface and importance grid analysis method to analyze the priority of attributes which need to be improved. Moreover, the regression analysis with dummy variable was also conducted for the comparison.
As shown in Figure 5 and Figure 6, “experience of rurality” is identified as a basic factor, “tourism service quality” is the high-performance factor, and “price level” is the low performance factor. According to the result, the design and management of tourism activity should be improved for avoiding customer dissatisfaction. Since “experience of rurality” is categorized as a basic factor, the increase in the performance of it is not going to result in customer delight. On the other hand, “tourism service quality” and “price level” are the performance factors, which might lead to customer dissatisfaction or delight. Especially for “tourism service quality”, it will provide more customer delight with the increase of performance for it is a high-performance factor.
Also Figure 7 illustrates the changes of attribute importance value depending on performance. In this study, “experience of rurality” can be classified as a basic factor. Its impact on overall satisfaction is higher when performance is low, but lower when performance is high. “Price level” and “tourism service quality” are performance factors, which have the reverse impact on overall satisfaction when attribute performance is high or low.

5.2. Conclusions

This paper presents a new approach to assessing the prioritization of product or service attributes. It uses self-stated method and experiment design at the same time to measure the explicit and implicit importance of attributes. Response surface method was selected to analyze the attributes’ importance, and importance grid analysis method was utilized for categorizing the attributes. Through comparing the results of regression analysis with the dummy variable method, the same classification of the attributes was acquired. Due to the response surface method having a standard experiment design method and the asymmetric relationship among the attributes can be shown in the result, the integrated approach is a more efficient analysis technique than regression analysis with the dummy variable method.
Identification of key attributes is important for managers to achieve a higher level of customer satisfaction. It has been the research focus of various studies and several techniques have been implemented. However, satisfaction will not always show the corresponding increase with the improvement of key attributes because of the asymmetric relationship between attribute performance and satisfaction. Therefore, research on the theory and technique of asymmetric relationship can promote the firm to make proper managerial decisions. Furthermore, regarding the survey was conducted in rural settings, the better sustainable practices are necessary for the development of rural destinations. This study can provide managers of rural tourism destination with a useful guide to how to enhance overall satisfaction through identifying the factors which have the direct impact on satisfaction, thereby fostering destinations’ profitability and sustainable tourism.
With regards to its limitations, this study can be improved in third aspects. First, considering characteristics of the survey location and techniques this study implemented, we considered only three attributes in this survey. Although we referred to other rural tourism studies and tourism researchers’ suggestion, the number of attributes selected seems not enough and will not applicable to applied in another satisfaction research. In fact, customers might consider and compare more attributes before and after buying. At the same time, managers also need consider the various factors for seeking improvement. Future studies therefore should select more attributes to analyze for providing more practical suggestions. Second, as the number of attribute and level increase, response surface method will become more complicated both in the experimental designs and analysis. In response surface work, 2 k or 3 k factorial design (k factors with two or three levels) is widely used and the designs are simple to fit the second or higher order response surface. Therefore, response surface method will have several limitations when attributes with multiple levels need to be considered. Third, we analyzed the characteristics of rural tourism attributes in present study, however, it is not enough for representing the general conclusion for other service industry. The sample which has wider range of respondents and accessible investigation methods are also suggested in the future research.

Author Contributions

Conceptualization, Y.P.; methodology, Y.J.; software, J.Y.; investigation, Y.J. and J.Y.; writing—original draft preparation, Y.J.; writing—review and editing, Y.P.

Funding

This research received no external funding.

Acknowledgments

We are grateful to acknowledge the valuable suggestions and constructive comments of the anonymous referees. Thanks are also due to Bao, Kim and Lee, who gave us much valuable advice in the early stages of this work.

Conflicts of Interest

The authors declare no conflict of interest.

References

  1. Oliver, R.L. Measurement and evaluation of satisfaction processes in retail settings. J. Retail. 1981, 57, 25–48. [Google Scholar]
  2. Churchill, G.A., Jr.; Surprenant, C. An investigation into the determinants of customer satisfaction. J. Mark. Res. 1982, 19, 491–504. [Google Scholar] [CrossRef]
  3. Bearden, W.O.; Teel, J.E. Selected determinants of consumer satisfaction and complaint reports. J. Mark. Res. 1983, 20, 21–28. [Google Scholar] [CrossRef]
  4. Barsky, J.D. Customer satisfaction in the hotel industry: Meaning and measurement. Hosp. Res. J. 1992, 16, 51–73. [Google Scholar] [CrossRef]
  5. Oliva, T.A.; Oliver, R.L.; Bearden, W.O. The relationships among consumer satisfaction, involvement, and product performance: A catastrophe theory application. Behav. Sci. 1995, 40, 104–132. [Google Scholar] [CrossRef]
  6. Saad Andaleeb, S.; Conway, C. Customer satisfaction in the restaurant industry: An examination of the transaction-specific model. J. Serv. Mark. 2006, 20, 3–11. [Google Scholar] [CrossRef]
  7. Neal, J.D.; Gursoy, D. A multifaceted analysis of tourism satisfaction. J. Travel Res. 2008, 47, 53–62. [Google Scholar] [CrossRef]
  8. Oliver, R.L. Satisfaction: A Behavioral Perspective on the Consume; Routledge: Abingdon, UK, 2010. [Google Scholar]
  9. Crow, H.; Gage, H.; Hampson, S.; Hart, J.; Kimber, A.; Storey, L.; Thomas, H. Measurement of satisfaction with health care: Implications for practice from a systematic review of the literature. Health Technol. Assess. 2002, 6, 32. [Google Scholar] [CrossRef]
  10. Yap, S.F.; Kew, M.L. Service quality and customer satisfaction: antecedents of customer’s re-patronage intentions. Sunway Acad. J. 2007, 4, 59–73. [Google Scholar]
  11. Wittink, D.R.; Bayer, L.R. The measurement imperative. Mark. Res. 1994, 6, 14. [Google Scholar]
  12. Matzler, K.; Sauerwein, E. The factor structure of customer satisfaction: An empirical test of the importance grid and the penalty-reward-contrast analysis. Int. J. Serv. Ind. Manag. 2002, 13, 314–332. [Google Scholar] [CrossRef]
  13. Mittal, V.; Ross, W.T., Jr.; Baldasare, P.M. The asymmetric impact of negative and positive attribute-level performance on overall satisfaction and repurchase intentions. J. Mark. 1998, 33–47. [Google Scholar] [CrossRef]
  14. Gustafsson, A.; Johnson, M.D. Determining attribute importance in a service satisfaction model. J. Serv. Res. 2004, 7, 124–141. [Google Scholar] [CrossRef]
  15. Busacca, B.; Padula, G. Understanding the relationship between attribute performance and overall satisfaction: Theory, measurement and implications. Mark. Intell. Plan. 2005, 23, 543–561. [Google Scholar] [CrossRef]
  16. Albayrak, T.; Caber, M. Prioritisation of the hotel attributes according to their influence on satisfaction: A comparison of two techniques. Tour. Manag. 2015, 46, 43–50. [Google Scholar] [CrossRef]
  17. Szymanski, D.M.; Henard, D.H. Customer satisfaction: A meta-analysis of the empirical evidence. J. Acad. Mark. Sci. 2001, 29, 16–35. [Google Scholar] [CrossRef]
  18. Albayrak, T.; Caber, M. The symmetric and asymmetric influences of destination attributes on overall visitor satisfaction. Curr. Issues Tour. 2013, 16, 149–166. [Google Scholar] [CrossRef]
  19. Kuo, C.W.; Jou, R.C. Asymmetric response model for evaluating airline service quality: An empirical study in cross-strait direct flights. Transp. Res. Part A Policy Pract. 2014, 62, 63–70. [Google Scholar] [CrossRef]
  20. Woodham, O.P.; Williams, J.A.; McNeil, K.R. Toward understanding the impact of attributes on satisfaction in different price tiers. J. Consum. Satisf. Dissatisf. Complain. Behav. 2016, 29, 91. [Google Scholar]
  21. Lee, J.S.; Min, C.k. Prioritizing convention quality attributes from the perspective of three-factor theory: The case of academic association convention. Int. J. Hosp. Manag. 2013, 35, 282–293. [Google Scholar] [CrossRef]
  22. Back, K.J. Impact-range performance analysis and asymmetry analysis for improving quality of Korean food attributes. Int. J. Hosp. Manag. 2012, 31, 535–543. [Google Scholar] [CrossRef]
  23. Lin, F.H.; Tsai, S.B.; Lee, Y.C.; Hsiao, C.F.; Zhou, J.; Wang, J.; Shang, Z. Empirical research on Kano’s model and customer satisfaction. PLoS ONE 2017, 12, e0183888. [Google Scholar] [CrossRef]
  24. Lin, S.P.; Yang, C.L.; Chan, Y.h.; Sheu, C. Refining Kano’s ‘quality attributes–satisfaction’ model: A moderated regression approach. Int. J. Prod. Econ. 2010, 126, 255–263. [Google Scholar] [CrossRef]
  25. Danaher, P.J. Using conjoint analysis to determine the relative importance of service attributes measured in customer satisfaction surveys. J. Retail. 1997, 73, 235–260. [Google Scholar] [CrossRef]
  26. Poon, W.C.; Lock-Teng Low, K. Are travellers satisfied with Malaysian hotels? Int. J. Contemp. Hosp. Manag. 2005, 17, 217–227. [Google Scholar] [CrossRef]
  27. Lancaster, K.J. A new approach to consumer theory. J. Polit. Econ. 1966, 74, 132–157. [Google Scholar] [CrossRef]
  28. Gardial, S.F.; Clemons, D.S.; Woodruff, R.B.; Schumann, D.W.; Burns, M.J. Comparing consumers’ recall of prepurchase and postpurchase product evaluation experiences. J. Consum. Res. 1994, 20, 548–560. [Google Scholar] [CrossRef]
  29. Oliver, R.L.; DeSarbo, W.S. Response determinants in satisfaction judgments. J. Consum. Res. 1988, 14, 495–507. [Google Scholar] [CrossRef]
  30. Slevitch, L.; Oh, H. Asymmetric relationship between attribute performance and customer satisfaction: A new perspective. Int. J. Hosp. Manag. 2010, 29, 559–569. [Google Scholar] [CrossRef]
  31. Anderson, E.W.; Mittal, V. Strengthening the satisfaction-profit chain. J. Serv. Res. 2000, 3, 107–120. [Google Scholar] [CrossRef]
  32. Reisinger, Y.; Turner, L.W. The determination of shopping satisfaction of Japanese tourists visiting Hawaii and the Gold Coast compared. J. Travel Res. 2002, 41, 167–176. [Google Scholar] [CrossRef]
  33. Deng, J.; Pierskalla, C. Linking Importance–Performance Analysis, Satisfaction, and Loyalty: A Study of Savannah, GA. Sustainability 2018, 10, 704. [Google Scholar] [CrossRef]
  34. Noriaki, K. Life cycle and creation of attractive quality. In Proceedings of the 4th QMOD Conference, Linkoping, Sweden, 12–14 September 2001; pp. 18–36. [Google Scholar]
  35. Matzler, K.; Bailom, F.; Hinterhuber, H.H.; Renzl, B.; Pichler, J. The asymmetric relationship between attribute-level performance and overall customer satisfaction: A reconsideration of the importance–performance analysis. Ind. Mark. Manag. 2004, 33, 271–277. [Google Scholar] [CrossRef]
  36. Witell, L.; Löfgren, M.; Dahlgaard, J.J. Theory of attractive quality and the Kano methodology—The past, the present, and the future. Total Qual. Manag. Bus. Excell. 2013, 24, 1241–1252. [Google Scholar] [CrossRef]
  37. Mikulić, J. The Kano model—A review of its application in marketing research from 1984 to 2006. In Proceedings of the 1st International Conference Marketing Theory Challenges in Transitional Societies, Maribor, Slovenia, 20–21 September 2007; pp. 87–96. [Google Scholar]
  38. Mikulić, J.; Prebežac, D. A critical review of techniques for classifying quality attributes in the Kano model. Manag. Serv. Qual. Int. J. 2011, 21, 46–66. [Google Scholar] [CrossRef] [Green Version]
  39. Vavra, T.G. Improving Your Measurement of Customer Satisfaction: A Guide To Creating, Conducting, Analyzing, and Reporting Customer Satisfaction Measurement Programs; ASQ Quality Press: Milwaukee, WI, USA, 1997. [Google Scholar]
  40. Mikulić, J.; Prebežac, D. Rethinking the importance grid as a research tool for quality managers. Total Qual. Manag. Bus. Excell. 2011, 22, 993–1006. [Google Scholar] [CrossRef]
  41. Matzler, K.; Sauerwein, E.; Heischmidt, K. Importance-performance analysis revisited: The role of the factor structure of customer satisfaction. Serv. Ind. J. 2003, 23, 112–129. [Google Scholar] [CrossRef]
  42. Myer, R.; Montgomery, D.C. Response Surface Methodology: Process and Product Optimization Using Designed Experiment; John Wiley and Sons: New York, NY, USA, 2002. [Google Scholar]
  43. Spanjol, J.; Tam, L.; Tam, V. Employer–employee congruence in environmental values: An exploration of effects on job satisfaction and creativity. J. Bus. Ethics 2015, 130, 117–130. [Google Scholar] [CrossRef]
  44. Du, X.; Jiao, J.; Tseng, M.M. Understanding customer satisfaction in product customization. Int. J. Adv. Manuf. Technol. 2006, 31, 396–406. [Google Scholar] [CrossRef]
  45. Pak, R.J. Combination of importance-performance analysis and response surface methodology for enhancing satisfaction. Int. J. Qual. Reliab. Manag. 2016, 33, 792–802. [Google Scholar] [CrossRef]
  46. Randall Brandt, D. How service marketers can identify value-enhancing service elements. J. Serv. Mark. 1988, 2, 35–41. [Google Scholar] [CrossRef]
  47. Chen, P.J.; Kerstetter, D.L. International students’ image of rural Pennsylvania as a travel destination. J. Travel Res. 1999, 37, 256–266. [Google Scholar] [CrossRef]
  48. Fleischer, A.; Tchetchik, A. Does rural tourism benefit from agriculture? Tour. Manag. 2005, 26, 493–501. [Google Scholar] [CrossRef]
  49. Park, D.B.; Yoon, Y.S. Segmentation by motivation in rural tourism: A Korean case study. Tour. Manag. 2009, 30, 99–108. [Google Scholar] [CrossRef]
  50. Reichel, A.; Lowengart, O.; Milman, A. Rural tourism in Israel: Service quality and orientation. Tour. Manag. 2000, 21, 451–459. [Google Scholar] [CrossRef]
  51. Devesa, M.; Laguna, M.; Palacios, A. The role of motivation in visitor satisfaction: Empirical evidence in rural tourism. Tour. Manag. 2010, 31, 547–552. [Google Scholar] [CrossRef]
  52. Anderson, R.E. Consumerism, Consumer Expectations, and Perceived Product Performance; ACR Special Volumes; ACR: Duluth, MN, USA, 1972. [Google Scholar]
  53. Swan, J.E.; Combs, L.J. Product Performance and Consumer Satisfaction: A New Concept: An Empirical Study Examines the Influence of Physical and Psychological Dimensions of Product Performance on Consumer Satisfaction. J. Mark. 1976, 40, 25–33. [Google Scholar] [CrossRef]
Figure 1. Asymmetric impact of attribute-level performance (Mittal, 1998).
Sustainability 11 04323 g001
Figure 2. Evaluation patterns of quality (Kano, 1984).
Sustainability 11 04323 g002
Figure 3. The importance grid (Vavra, 1997).
Sustainability 11 04323 g003
Figure 4. Response surface plots and contour plots of the attributes.
Sustainability 11 04323 g004
Figure 5. Factor structure based on the importance grid analysis.
Sustainability 11 04323 g005
Figure 6. Factor structure based on regression analysis.
Sustainability 11 04323 g006
Figure 7. Importance and performance changes.
Sustainability 11 04323 g007
Table 1. Classification of the Kano quality attributes (Lin, 2010).
Quality FactorRegression Coefficients
Low PerformanceHigh Performance
Basic factor(−) SignificantNon-significant
Exciting factorNon-significant(+) Significant
Performance factor(−) Significant(+) Significant
Note: (+) = positive coefficient; (−) = negative coefficient.
Table 2. Rural tourism product attributes and levels.
Selected AttributesLevelsCoding
Tourism price levelWorse than expected 1
About the same as expected0
Better than expected1
Experience of ruralityWorse than expected 1
About the same as expected0
Better than expected1
Rurla service qualityWorse than expected 1
About the same as expected0
Better than expected1
Table 3. Experimental matrix of Box–Behnken design (BBD).
RunCoded Levels
X 1 X 2 X 3
1 1 1 0
2 1 10
31 1 0
4110
5 1 0 1
6 1 01
710 1
8101
90 1 1
100 1 1
1101 1
12011
Table 4. Question design in the survey.
1. If the price of the rural tourism product was lower than you expected, but not for the experience and service quality, how satisfied would you for the four products below?
Very dissatisfiedDissatisfiedNeither satisfied nor dissatisfiedSatisfiedVery satisfied
(1) Rurality experience was worse than you expected, and service quality was about what you expected.
(2) Rurality experience was better than you expected, and service quality was worse than you expected.
(3) Rurality experience was about what you expected, and service quality was better than you expected.
(4) Rurality experience was better than you expected, but the service quality was about what you expected.
Table 5. Demographic of the sample (N = 171).
Demographic VariablesFrequency%
Gender
   Male5330.994
   Female11869.006
Age
   up to 359052.632
   36–442816.374
   over 465330.994
Monthly income (USD)
   below 4508348.538
   451–9006336.842
   above 9012514.620
Occupation
   tourism-related occupation4325.146
   tourism-unrelated occupation7342.690
   student in tourism-related major2414.035
   student in tourism-unrelated major2816.374
   retirement31.755
Table 6. Descriptive statistics for attributes.
VariablesParameter EstimateStandard ErrorT-statisticp-Value
   Intercept4.3100.038112.750.000
   price0.6480.02327.650.000
   experience0.3360.02314.360.000
   service0.2510.02310.740.000
    p r i c e 2 −0.5380.034−15.590.000
    e x p e r i e n c e 2 −0.3270.034−9.490.000
    s e r v i c e 2 −0.6460.034−18.730.000
   price∗experience0.0670.0332.030.042
   price∗service0.1990.0336.000.000
   experience∗service0.1670.0335.030.000
    R 2 , %40.71
   adj R 2 , %40.50
Table 7. Model comparisons.
SourceDFSum of SquareMean SquareR-SquareF-Valuep-Value
Linear3248.8182.9360.252362.08<0.0001
Quadratic3148.4549.4840.140200.78<0.0001
Cross-product315.915.3020.01521.83<0.001
Total model9413.1745.9070.407194.90<0.001
Table 8. Collinearity diagnostics.
RunEigenvalueCondition IndexVariance Proportions
Intercept x 1 (Price) x 2 (Experience) x 3 (Service)
11.001.001.00000
21.001.0001.0000
31.001.00001.000
41.001.000001.00
Table 9. Mean of explicit and implicit importance ratings of each attribute.
AttributesMean of Explicit ImportanceMean of Implicit Importance
Price level3.7370.464
Experience of rurality4.2740.427
Tourism service quality4.3680.537
Table 10. Statistical results of dummy variable regression.
AttributesLow performanceHigh Performance
Price level0.030 n s −0.088 n s
(−0.213, 0.343)(−0.373, 0.066)
Experience of rurality−0.327 ****0.151 n s
(−0.743, −0.294)(0.040, 0.613)
Tourism service quality0.264 ****0.159 **
(−0.628, −0.193)(0.049, 0.639)
Note: R 2 = 0.404 (adj R 2 = 0.382); Confidence intervals in brackets; ns = not significant; **** p < 0.001; *** p < 0.01; ** p < 0.05.

