Article

Investigating the Effects of Airport Servicescape on Airport Users’ Behavioral Intentions: A Case Study of Incheon International Airport Terminal 2 (T2)

School of Business, Korea Aerospace University, Goyang-si 10540, Korea
*
Author to whom correspondence should be addressed.
Sustainability 2019, 11(15), 4171; https://doi.org/10.3390/su11154171
Submission received: 29 May 2019 / Revised: 30 July 2019 / Accepted: 31 July 2019 / Published: 2 August 2019
(This article belongs to the Special Issue Service Quality in Leisure and Tourism)

Abstract

:
The purpose of this study is to analyze the effects of physical and social servicescapes on cognitive and affective satisfaction, as well as airport image, with gender as a moderating effect between variables. A total of 283 airport users were surveyed, and structural equation modeling was used to investigate the relationships between variables. The results showed that only physical servicescape had a significant effect on cognitive and affective satisfaction, and affective satisfaction had a significant effect on airport image. In addition, the gender differences indicated a significant effect between the physical servicescape and cognitive satisfaction. This study is distinct in that it is the first attempt to verify the relationship between airport physical servicescape, social servicescape, airport users’ cognitive and affective satisfaction, and airport image on gender differences.

1. Introduction

In countries with high levels of economic growth and populations experiencing increased levels of education and economic clout, the awareness of customers (users) in the aviation industry has tended to become more specialized and diversified. Accordingly, airport terminals have also transitioned into an important means of securing national competitiveness with multiple product values coexisting. These products include cultures, foods, and services. In South Korea, Incheon International Airport (IIA) is looking to provide improved services to proactively keep pace with changes in Korean (and global) society, thereby improving its own competitiveness and maintaining its competitive advantage over rival airports.
Generally, when people visit a certain place, they experience intangible and tangible factors. People use tangible clues to evaluate an intangible service. In other words, tangible factors are important clues that determine the image of a place [1]. Tangible clues induce a customer’s positive evaluation can be conceptualized as a physical environment, and generally, this is an environment artificially created and set by humans. In this context, Bitner’s [2] servicescape is defined as environmental factors in a space that provides a service, and studies on servicescape have typically been conducted with service encounter locations such as hotels and restaurants. However, servicescape studies related to airports are scant. This is because passenger-focused issues and airport efficiency measures such as boarding wait times have generally been included in studies on airport service quality, and such studies usually measure items such as workload, unit costs, and unit sales [3,4,5]. These studies do not explore how passengers perceive particular spaces. In addition, despite the service encounters where social interactions are made, most studies related to servicescape focus more on the physical aspects of service space, and only a few studies have considered both the physical environment and the social environment [6]. In particular, in a service context, gender plays a significant role in terms of customer behavior [7]. However, studies on servicescape and the role of gender as a moderator are still limited.
With this in mind, the present study endeavors to reveal the holistic servicescape of the airport, investigating and exploring the interaction between the physical and social environment. In addition, this study analyzes differences in the awareness of airport passenger terminal servicescape according to gender, setting gender, which is the main variable explaining the difference in consumer behaviors, as a moderating variable. Therefore, this study contributes to identifying the factors that affect airport user satisfaction in the service atmosphere, and also provides implications that can be leveraged to enhance business sustainability. Appropriate service environments and personnel are beneficial to the sustainability of successful airport businesses [8]. In addition, this study represents the first research to extend the concept of physical servicescapes and social servicescape in the context of the airport. More specifically, this study fulfills a research gap in the area of physical servicescape and social servicescape, as well as the effects of satisfactions in the airport environment. This study also provides knowledge on the servicescapes (physical and social) and satisfactions (cognitive and affective) conceptualization and measurement. Moreover, the moderating effects of gender in servicescape are confirmed. Lastly, this study provides insights for both researchers and practitioners regarding the sustainable business management in the airport.
The present study reveals the impact of the servicescape of IIA’s Terminal 2 (which was opened in 2018) on visitor cognitive satisfaction and affective satisfaction, as well as on airport image. To carry this out, this study leverages the factors of social servicescape in Bogicevic et al. [3], Tombs and McColl-Kennedy [9], and Brocato, Voorhees, and Baker [10], which are based on Bitner’s [2] study of servicescape. The results enable the authors to provide an effective plan concerning the airport’s service operation.

2. Literature Review

2.1. Physical Servicescape and Satisfaction

In servicescape, first introduced by Bitner [2], the criteria for the division of elements differ depending on the researcher. However, it is used as a common concept in considering an artificial physical environment where a service is provided. Many studies on the physical environment of the aviation industry have shown the importance of the physical environment based on the dimension of servicescape in Baker et al. [11], Bitner [2], and Wakefield and Blodgett [12].
Satisfaction is based on the expectancy disconfirmation theory, in which satisfaction occurs thanks to positive discordance if the actual performance of a service or product exceeds the expectations that customers had previously. On the other hand, they are not satisfied (i.e., negative discordance occurs) if that performance does not meet their expectations. As such, satisfaction can be defined as a consumer’s positive emotional reaction when expectations for a certain product or service are met [13]. Some researchers have asserted that customer satisfaction occurs through a cognitive reaction process and an emotional reaction process, and that satisfaction can accordingly be classified into two types—cognition and emotion [14]. Cognitive satisfaction is a reaction occurring in rational judgment, while affective satisfaction is a reaction occurring from the emotional response [15,16]. In other words, customers who are cognitively satisfied believe that they made the proper and right choice through the quality of the service provided, while those emotionally satisfied would describe the experience of their use of service as a pleasant experience [17]. Accordingly, this study defined cognitive satisfaction as the degree of satisfaction of airport customers’ expectations and affective satisfaction as the degree of emotions felt after visiting a terminal based on the preceding studies.
One element of physical servicescape, the aesthetic (design), is an item reflecting the attractiveness of a physical service environment such as the building design or interior design. This is especially important since it shows the service provider’s characteristics and serves as a means of differentiating one’s space from other places [2]. Works of art that blend harmoniously into a service location aid in the process of enticing customers to recognize the space as luxurious and likely to satisfy their expectations, and this affects cognitive satisfaction [17]. In addition, indoor decorations or exhibits affect airport customers’ affective satisfaction by improving the airport’s image and creating an environment that the airport users feel is more pleasant. Layout accessibility refers to the way in which the path of a service place is arranged and the way in which items are spatially related [2]. In spaces with temporal constraints such as aircraft boarding areas, signs and words of guidance by which airport customers can easily visit desired places are especially important. An effective configuration of facilities in such a service place affects the spatial controllability and environmental congestion recognized by visitors, arouses their interest, and produces pleasurable emotions. Thus, the layout accessibility of an airport terminal affects visitors’ cognitive satisfaction and affective satisfaction. Cleanliness is one of the key factors of a service environment, which is especially important when customers spend a long time in the service environment. Generally, many customers tend to suggestively associate service quality with cleanliness, and, in fact, cleanliness has a big impact on consumers’ awareness of a service [12]. In other words, because a clean environment affects customers’ construction of a service image of a company or brand, cleanliness affects cognitive satisfaction and affective satisfaction. Seating comfort is affected by the physical seats themselves and the space between the seats, and if a seat is very close to other seats, customers may feel physically and mentally very uncomfortable. Providing comfortable seats for customers can increase their cognitive satisfaction and affective satisfaction with the physical environment. Scent is a factor playing an important role for consumers’ awareness and evaluation, and in fact, it has been demonstrated that scent acts positively in the consumers’ evaluation of the surrounding environment or the product or service [18]. In other words, scent is a factor affecting customers’ feelings and behaviors, and it is closely related to their cognitive satisfaction and affective satisfaction after using a service. Because electronic equipment such as displays further pleases customers during wait times, it plays an important role in terms of service [12]. In particular, IIA actively adopts and utilizes self-service technologies, providing services for the enhancement of visitor convenience. For instance, the airport provides visitors with free Wi-Fi service at a number of kiosks, which constitutes an on-site self-service technology. Services related to electronic equipment (e.g., kiosks and plugs) are provided because they are effective for the construction of the positive image of an airport, which affects customer cognitive satisfaction and affective satisfaction. Lastly, air quality is a factor affecting convenience in an indoor environment, and low indoor air quality may have a negative impact on the health of employees and customers [19]. High air quality helps customers feel positive feelings about the space, which results in affective satisfaction. In this context, lighting may also affect customer behaviors and evaluation. Kim and de Dear [20] stated that visitor satisfaction improves if visitors are aware that the lighting of a building is comfortable. Thus, air and lighting affect customers’ affective satisfaction and cognitive satisfaction.

2.2. Social Servicescape

Social servicescape, which is rooted in Bitner’s [2] concept of servicescape, is an important factor representing the indirect influences among people sharing a common service environment. Thus, for a complete understanding of servicescape, social environment must be included as well as physical environment [21]. Social servicescape presupposes the service environment related to the people in the service environment and refers to indirect interactions such as the presence of other customers and service providers, appearance, behavior, and similarity [6,22]. For example, the factors of the physical environment affect the consumers’ experience just by sharing a place. In addition, the presence of service employees and other customers may affect consumers’ awareness and behavior, and consequently, factors of behavior such as consumer attitudes and satisfaction [23]. Social servicescape includes human factors and consists broadly of two levels—employees and other customers [24]. The present study conceptualizes social servicescape as appearance, behavior, professionalism, and similarity based on the framework developed by Brocato et al. [10], and it looks at how customers in an airport terminal environment perceive a service environment.
Similarity, a social servicescape component indicates the degree of similarity or identity felt between central customers’ social identity and other customers’ social identity in a service environment [25]. Customers prefer other customers with similar characteristics, which elicits a sense of belonging to a place or an attachment to a place [21]. In this context, the similarity between customers and employees also plays an important role in a service environment. According to the social identity theory, it has been shown that customers prefer that employees are similar to themselves [6,26]. Customers have a good feeling toward employees with high similarity and feel more intimacy, while the employees are very likely to understand customer desires and needs concretely [27]. In addition, they lower the relationship barrier so that customers can meet a service provider that shares an identity with themselves, which improves comfort and trust and provides high levels of customer awareness [28]. Second, appearance includes both physical and behavioral characteristics, including hairstyle, dress style, accessories, tone, voice, and behavior, all of which reflect an individual’s identity [28]. This constitutes the general appearance related to the physical characteristics of other customers or employees recognized by individual customers. The presence of others plays a very important role in the formation of service experience [29] in that people tend to think sharing a service environment with attractive others is favorable [30]. In addition, an employee’s physical characteristics are a very important factor in a service environment. An employee’s attractive appearance has a positive impact on a customer’s experience and the formation of feelings [31], and it improves the image of the company [32]. Customers tend to attribute positive characteristics, thinking that an employee with an attractive appearance is friendlier and more professional [6]. Thus, physical attraction is effective for the formation of customers’ positive feelings and experiences. Lastly, adaptive behavior refers to the degree to which individual customers feel about others’ behaviors in a service environment [8]. This is a reaction formed based on the essence of the role theory representing the importance of individual actions [10,33]. In a service environment, despite the fact that there is no direct interaction with others, there may be an impact of others’ behaviors. For example, other customers’ improper behaviors have a negative impact on individual customers’ general service experience [30], and there may be an impact on the employees’ methods of coping with situations [2]. In particular, an employee’s behavior and attitude are important in a service environment, for the success of a service is based on the customers’ subjective experience. In other words, an employee’s professional attitude and behavior can improve the customers’ general service experience and awareness of the company, and an employee’s non-professional attitude and/or behavior might cause customers to overlook the employee’s other efforts and develop a negative awareness [10,33]. Therefore, others’ behaviors and characteristics have important impacts on the general image and evaluation of a company, especially in the service environment [2,31].

2.3. Satisfaction and Airport Image

Generally, the preceding studies on image have mainly been conducted with the image of a company or brand, and there are insufficient studies that provide an objective definition of an airport’s image. Thus, the present study defines airport image based on company and brand image. Image is abstract and subjective, a concept that is difficult to clearly define, but generally, an immediate mental reaction representing the association of a specific target, and a comprehensive concept that reflects consumer emotion, behavior, and understanding [34,35].
Studies of satisfaction and image have been conducted in various areas. Likewise, the relationship between the two has been investigated in various ways according to researcher interests [25]. Some researchers have considered image to be a leading variable of customer satisfaction [36] while taking into account that the concept of image is based on customers’ individual experiences, and that an individual’s positive experience leads to the creation of a positive image. A number of studies indicated empirical evidence to support the results that customer satisfaction had a direct impact on image [37,38,39,40]. For example, Amin et al. [37] showed that customer satisfaction was found to positively affect corporate image. Similarly, Hu et al. [38] and Cheng and Rashid [39] revealed that customers who were satisfied with consistently high levels of service created a positive image of a certain corporation. Moreover, Chiou and Chen [40] revealed that customer satisfaction was recognized as the important antecedent of corporate image. Thus, it is more desirable to see image as a result of satisfaction rather than as a leading variable of the formation of satisfaction [41].

2.4. Moderating Effect of Gender

Differences in social identities such as gender and race have provided important indicators for an understanding of consumer behavior [42,43]. Gender-based differences have been analyzed in various studies. Okazaki and Hirose [44] argued that gender played an important role in predicting purchase intention by analyzing consumers’ use of media. When investigating quality response according to gender, Sanchez-Hernandez et al., [45] found that men were more sensitive to the physical environment quality and result quality, and that women were more sensitive to the interaction quality. This is because men displayed a result-oriented propensity while women demonstrated a strong society-oriented propensity to internalize themselves in society [42]. In addition, according to Meyers Levy and Sternthal [46], it turned out that women understood meaning through comprehensive clues while men depended on clues clearly revealed. Thus, the present study attempts to determine whether gender creates a moderating effect in the relationship of the influence of social servicescape, including the physical servicescape of an airport terminal as well as employees and other customers, on cognitive satisfaction and affective satisfaction. In addition, according to Kandampully & Hu [47], satisfaction with an experience appeared to lead to a positive evaluation of the image, and as such, the present study assumes that there is also a moderating effect of gender in the relationship of the influence of cognitive satisfaction and affective satisfaction with the airport image.

3. Methodology

3.1. Research Model and Hypotheses

This study intends to analyze the overall influence of two aspects of servicescape in the airport passenger terminal environment based on the prior research on physical and social servicescape. It has also been designed to analyze the effect of the relationship and satisfaction between the two aspects of servicescape and the cognitive satisfaction and affective satisfaction the airport image. Based on the previous studies presented, the following hypotheses are proposed in Table 1. The interrelationships between the variables are shown in Figure 1.

3.2. Instrument

A questionnaire was designed based on the previous studies by an extensive review of servicescape, customer emotion, and airport image. The questionnaire included seven parts, the first of which contained four items for the T2 experience. In the second part, physical servicescape consisted of seven constructs: aesthetic, air quality, layout accessibility, cleanliness, scent, seating comfort, and electronic equipment. Aesthetic and layout accessibility were measured with five items each. Air quality were measured with five items and cleanliness were measured with four items. Scent, seating comfort, and electronic equipment were measured with three items each. Items regarding the physical servicescape were based on the work of Bitner [2], Wakefield & Blodgett [12] and Bogicevic et al. [3]. In the third part, social servicescape was structured into two separate sections, employees and other customers. Employees consisted of four constructs: physical appearance, suitable behavior, professionalism, and previewed similarity. Other customers consisted of three constructs: physical appearance, suitable behavior, and perceived similarity. Each construct was measured using three items based on the work of Bitner [2], Hanks & Line [23] and Brocato, Voorhees & Baker [10]. Parts four and five contained three items for cognitive satisfaction and emotional satisfaction based on the work of Lam et al. [17]. Part six of the questionnaire contained four measurement items for airport image based on the work of Jani & Han [25] and Lai & Basin [36]. Responses were measured using a 5-pint Likert scale because it provided a clearer appearance for the respondents [48]. The scale ranged from strongly disagree = 1 to strongly agree = 5. Questions regarding gender, age, education, job, and financial status were positioned in the last section of the questionnaire.

3.3. Data Collection and Data Analysis

Data were collected over a two-month period from November to December 2018 by approaching individuals who had experienced IIA’s T2, which opened in February 2018. To ensure a representative sample, field surveyors distributed questionnaires in the airport and collected questionnaire responses via face-to-face encounters with participants. Online surveys were also conducted with individuals who had experienced T2. A total of 294 questionnaires were distributed, and 283 copies were used for the final analysis. 11 copies were excluded due to insincere or insufficient entries. These respondents were pressed for time in the airport, and thus, some of the questions were not properly answered.
SPSS 18.0 and AMOS 21.0 were used to analyze the data. Structural equation modeling (SEM) was used to test the hypotheses in this study, as SEM provides an appropriate analytical method for examining the relationships among variables, especially in multivariate structures [48]. SEM also elicits analysis results that consider the measurement error of the measurement tools. As such, SEM describes better analysis results for social phenomena compared to other analytical methods such as regression [48]. In addition, it has an advantage in terms of examining multiple independent variables simultaneously [48]. For these reasons, SEM was employed in the present study.
According to Anderson & Gerbing [49], a two-step approach is often preferred in SEM. To analyze the measurement model, a confirmatory factor analysis (CFA) with a maximum likelihood estimation method was conducted. After CFA, structural relationships among latent variables were analyzed using SEM.

4. Results

4.1. Demographic Characteristics

Table 2 presents the characteristics of the sample. First, a frequency analysis was conducted to identify the general characteristics of the sample. Second, structural equation modelling was conducted to verify the hypotheses using AMOS 21.0. Of the respondents, 59% were female and 41% were male. In terms of age, 33.63% of the respondents were between 30 and 39, 28.3% were between 40 and 49, 21.6% were between 20 and 29, 13.4% were between 50 and 59, 13.4% were 60 or above, and the remaining 1.1% were under 20. In terms of visiting purpose, 47.0% were traveling for leisure and/or vacation, 24.4% were for traveling for business, 5.7% were visiting relatives, 3.9% were traveling for education, 1.1% were traveling for work, 0.7% were going to conferences, and 17.3% did not indicate their reasons. In terms of time spent in the airport, 25.1% were there between 1 and 1.5 h, 24.4% were there between 1.5 and 2 h, 18.7% were there between 30 min and 1 h, and 9.9% were there less than 30 min. Figure 2 shows the characteristics of the respondents.

4.2. Measurement Model Evaluation

This study verified validity by conducting a confirmatory factor analysis (CFA) of measurement models prior to the testing of research hypotheses. CFA is a testing method of how well-measured variables represent a smaller number of structures [50]. In other words, CFA provide a confirmatory test of how measured variables logically represent constructs that is not measured directly. With CFA, a researcher is able to analyze preconceived theory is whether confirmable or not. First, through a primary CFA, this study identified the factors describing the measurement items, and through a secondary CFA, this study examined whether the latent variables extracted by the primary CFA described the upper dimension. The secondary CFA is a method that can check whether the latent variables extracted by the primary CFA have individual properties and at the same time are in a lower dimension of an upper dimension [51]. This study investigated the extent to which the components of physical servicescape (seven sub-factors) and social servicescape (seven sub-factors) commonly described each upper theoretical concept.
As a result of the primary CFA, the suitability indices of physical servicescape factors were as follows: CMIM = 581.885, DF = 325, p = 0.000, CMIN/DF = 1.790, RMR = 0.032, GFI = 0.874, AGFI = 0.842, CFI = 0.965, NFI = 0.924, IFI = 0.965, and RMSEA = 0.053. This turned out to be a relatively satisfactory goodness of fit [52,53,54]. The suitability indices of social servicescape factors were as follows: CMIM = 338.832, DF = 167, p = 0.000, CMIN/DF = 2.029, RMR = 0.022, GFI = 0.901, AGFI = 0.863, CFI = 0.977, NFI = 0.956, IFI = 0.977, and RMSEA = 0.060, which also appeared to be a satisfactory goodness of fit. Thus, it was found that each measurement item was significantly loaded in the construct in both physical servicescape factors and social servicescape factors. In addition, the suitability indices of the CFA of seven sub factors of physical servicescape factors were as follows: CMIM = 690.229, DF = 340, p = 0.000, CMIN/DF = 2.030, RMR = 0.043, GFI = 0.852, AGFI = 0.823, CFI = 0.952, NFI = 0.910, IFI = 0.952, and RMSEA = 0.060. This was also a satisfactory goodness of fit, and the estimate of the path between upper dimensions was significant, so each measurement item was significantly loaded to the construct. Accordingly, it was found that the sub-factors that constituted physical servicescape were lower dimensions appropriate for a physical servicescape. The suitability indices of the CFA of seven sub factors of social servicescape factors were as follows: CMIM = 396.317, DF = 179, p = 0.000, CMIN/DF = 2.214, RMR = 0.034, GFI = 0.888, AGFI = 0.855, CFI = 0.971, NFI = 0.949, IFI = 0.971, and RMSEA = 0.066, which was a relatively satisfactory goodness of fit. As such, physical servicescape, i.e., the estimate of the path between upper and lower dimensions, was significant, and the measurement items were significantly loaded in the constructs. Thus, employee appearance, employee behavior, employee professionalism, employee similarity, customer appearance, customer behavior, and customer similarity were found to be lower dimensions appropriate for evaluating social servicescape.
Finally, as a result of the CFA, including the whole constructs, and as for the values of the measurement items of all factors, the squared multiple correlations (SMC) value was higher than 0.4; the standardized regression coefficient value was higher than 0.7, the standard value; and the construct reliability (CR) was greater than 0.7 [49]. Thus, the construct measures, which included a high degree of reliability (0.889–0.967), demonstrated convergent validity [49]. This research model achieved discriminant validity since the average variance extracted (AVE) of each factor (0.722–0.907) exceeded 0.5 [55]. The goodness of fit of all models in this study was as follows: CMIM = 2800.491, DF = 1855, p = 0.000, CMIN/DF = 1.510, RMR = 0.034, GFI = 0.773, AGFI = 0.754, CFI = 0.949, NFI = 0.864, IFI = 0.950, and RMSEA = 0.043. Thus, the goodness of fit of the measurement models was relatively satisfactory. It was found that the results of the analysis of GFI and AGFI did not reach the acceptable levels. However, the other indices were suitable. Thus, it was judged that overall, they would be acceptable. The results of the CFA of the measurement items for each construct in this study are shown in Table 3.

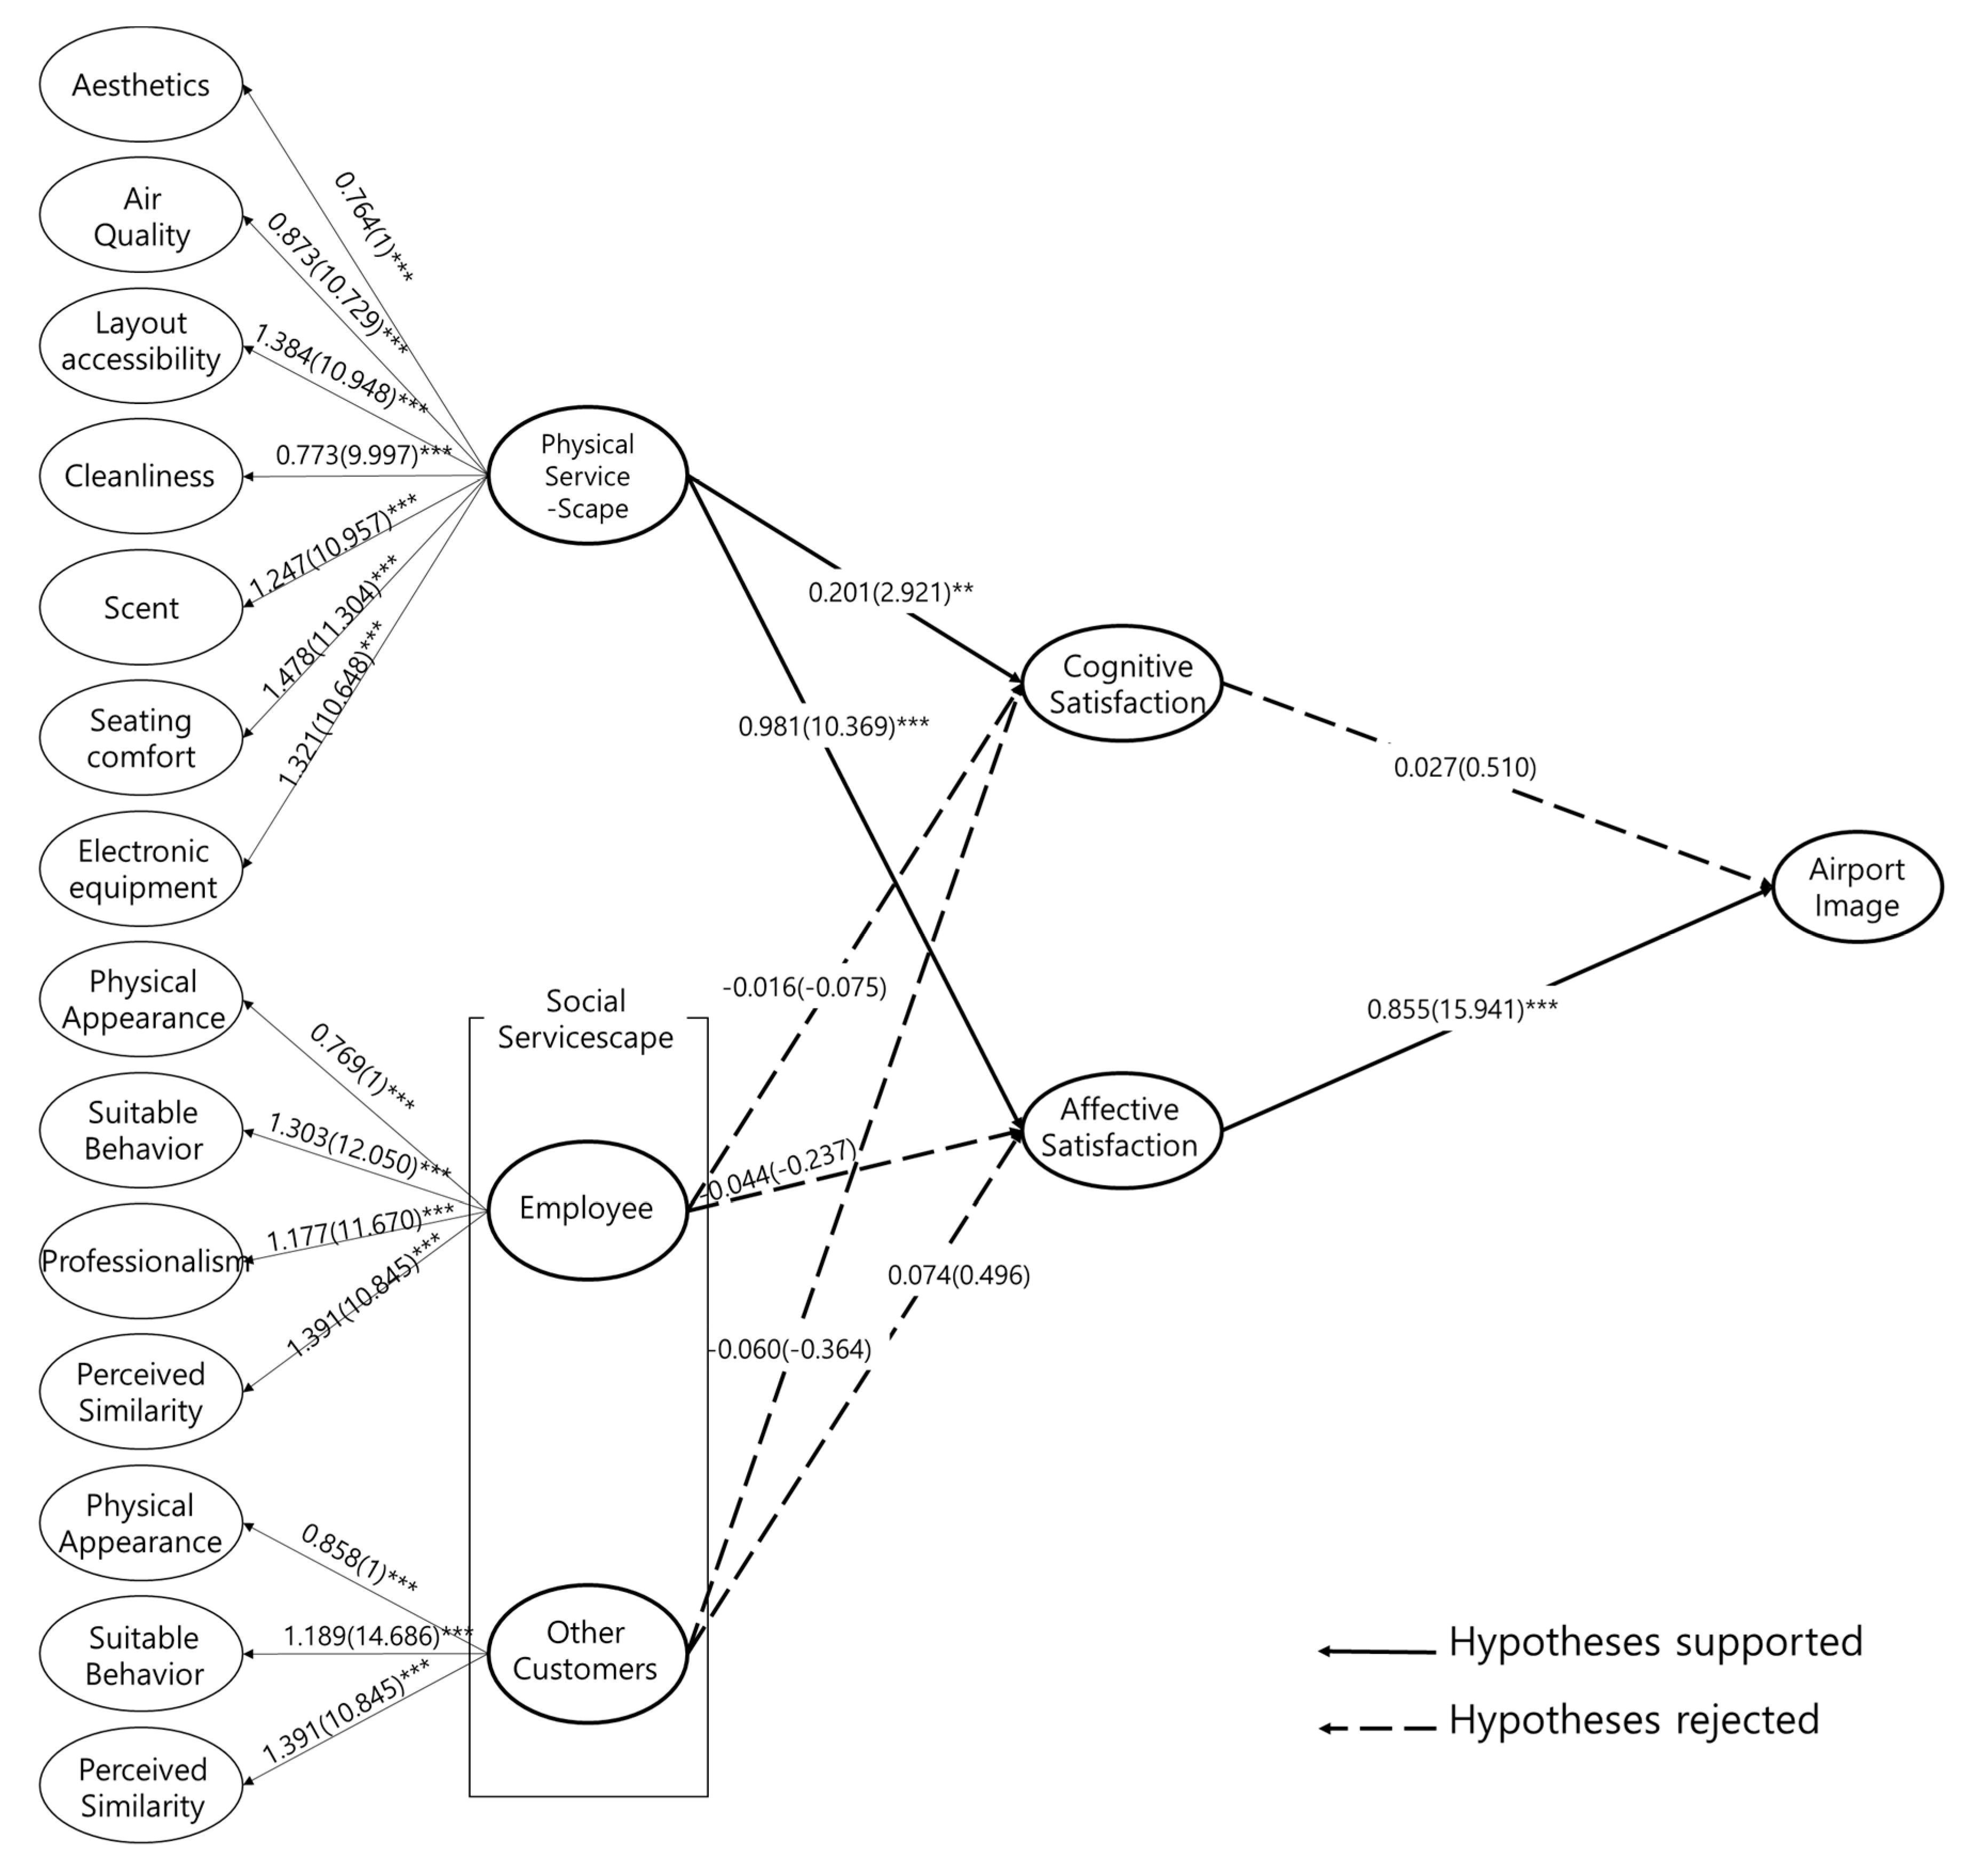
4.3. Structural Model

As a result of an analysis of the impacts of physical servicescape on cognitive satisfaction and emotional satisfaction, the impact of physical servicescape on cognitive satisfaction was β = 0.201, C.R. = 2.921 (p < 0.05), and the impact of physical servicescape on emotional satisfaction was β =0.981, C.R.=10.369 (p < 0.01), respectively. Thus, there were statistically significant effects. It is concluded that these results from the reflection of the characteristics of T2, which was designed to be a smart airport with a short opening period, and an airport that applies up-to-date science and technology such as self-service tech and guide robots. Meanwhile, of the dimensions of social servicescape, the impact of the employee factor on cognitive satisfaction was β = −0.016, C.R. = −0.075, while the impact of other visitors on cognitive satisfaction was β = −0.060, C.R. = −0.364, respectively. The impacts of employees and other visitors on cognitive satisfaction and emotional satisfaction were β = −0.044, C.R.= −0.237 and β = 0.074, C.R.= 0.496, respectively. These values were statistically insignificant. These results indicated that social aspects of the airport are less likely impacted than that of the physical environmental factors. H7 focused on the relationship of cognitive satisfaction and emotional satisfaction with airport image β = 0.027 (0.510), so there were no statistically significant effects. The results for H8, which centered on the relationship between emotional satisfaction and airport image were β = 0.855, C.R. = 15.941 (p < 0.01), which were statistically significant. These results reflected the fact that in the formation of an airport image, rather than rational judgment or reasonable service quality, emotional response elements through pleasant experiences and good feelings were critical. As a result of the above testing of the research hypotheses, H1, H2, and H8 were supported while H3, H4, H5, H6, and H7 were rejected. The results of the hypothesis testing are shown in Table 4 and Figure 3.

4.4. Moderating Effect of Gender

This study took gender as a moderating variable and analyzed its regulatory effects on the relationships of the impacts of physical servicescape and social servicescape with cognitive satisfaction and affective satisfaction in the relationships of the impacts of cognitive satisfaction and emotional satisfaction with airport image in a male group and a female group. As a result of a comparison of the goodness of fit of the two models, since Δ = 12.021, Δdf = 8, p = 0.150 between the constrained model and the unconstrained model [56], it was found that gender had a regulatory effect.
As a result of an analysis of the regulatory effect of gender on the relationships of the impacts of physical servicescape with cognitive satisfaction and emotional satisfaction, it was found that there was a significant difference between the male and female groups (Table 5). This result reflects the fact that the male group accepted the service environments and service quality of the airport more rationally than the female group. Therefore, H9a did indicate gender differences. In addition, H9b which analyzed the moderating effect of gender groups on physical servicescape and affective satisfaction had no statistically significant differences. Moreover, H9c, H9d, H9e, and H9f had no statistically significant differences between gender groups. H9g and H9h also indicated that there were no statistically significant differences between male and female groups.

5. Conclusions and Implications

As a result of the analyses in this study, it turned out that among airport terminal servicescapes, only physical servicescape had a significant impact on cognitive satisfaction and affective satisfaction. Affective satisfaction and airport image had a relationship of significant impact, while cognitive satisfaction did not have a relationship of significant impact. These results were similar to those of Lam et al. [17], who investigated the relationship of the impact between the servicescape factor of a casino and affective satisfaction. According to the results of the present study, airport users were affected only by physical aspects. Kim et al. [43] also found similar results when they investigated an airline’s in-flight servicescape. This suggests that despite the continually increasing importance of social aspects, there is less influence in terms of the social environment than that of the physical environment in an airport as compared to an airline in flight. In other words, customer evaluations of the environment are determined by tangible factors that are objective and can be visualized. However, considering the long-term image of an airport and its customer evaluations, the social factors in which their subjectivity is reflected are very important. Thus, an airport should develop a physical environment and continuously develop a social environment at the same time. Finally, it turned out that gender did represent a controlling action in the relationship between physical servicescape and cognitive satisfaction. It was determined that physical servicescape affected cognitive satisfaction in men, while physical servicescape did not affect cognitive satisfaction in women. This supports the results in Mitchell & Walsh [57], which reported that women valued emotional consumption more than men, which means that men recognized the given environment more rationally and more reasonably than women.
This study has important theoretical implications. Numerous studies on servicescape have been conducted, and they have emphasized the importance of the concept. However, very few studies have examined the role of servicescape in the context of the airport. On the contrary, the majority have focused only on the concept of physical servicescape. Therefore, this study is one of the first empirical studies to apply and expand social servicescape to incorporate employees and other customers into the studies related to the physical servicescape of the airport. In addition, this study looks at satisfaction (i.e., cognitive and affective satisfaction) as an important preceding factor affecting the formation of an airport’s image, and it examines how such satisfaction would affect the formation of airport image. Also, gender was partially significantly moderated in the proposed conceptual framework. The results of the study indicated that the male group adopted service quality more rationally than the female group in the airport environment.
The results of the study have several practical implications for airport practitioners as well. A number of previous studies supported the hypothesis that both the physical and social service environments had an effect on customer experiences and satisfaction. This suggested that airport practitioners should pay more attention to the servicescape design of the airport. In this study, only the physical servicescape positively affected cognitive and affective satisfaction. To improve social servicescape, IIA would do well to hire and train more employees to provide services that result in airport user satisfaction. It could be difficult for airport practitioners to control for the similarity and behavior of other customers, but this would be easier to execute when dealing with employees. For example, service personnel are deployed for customers who are unfamiliar with self-service check-in kiosks. It is also important to note that during the training process, trainers need to consider social servicescape when training their employees. Appropriate and professional behavior is an important element of the social servicescape, and airport practitioners should put strong emphasis on the traditional roles of employees.
This study suggested that cognitive and affective satisfaction are significant factors for the formation of airport image. For this reason, airport practitioners should pay close attention to elements that will positively influence airport user satisfaction. As satisfaction increases, the value of the airport image will also increase, and this might generate loyalty. With higher levels of satisfaction and loyalty, IIA could guarantee its own business sustainability and competitive advantage [58]. Servicescape is an important element in terms of service, and it should be developed continuously to enhance service sustainability. Such efforts could result in positive customer evaluations on airport image.
While this study makes a significant contribution on the understanding of the physical servicescape and social servicescape of IIA T2, there are several limitations that should be taken into consideration. First, it is difficult to generalize the results of this study as it was conducted only with IIA T2 users. As there are differentiating characteristics in the airport environment of each country, it would be useful to compare and analyze a wide variety of airports. Second, this research focused on the moderating effect of gender only. Possible differences in the nationalities of the respondents were not investigated. Future research should explore the cross-nationality and cultural differences of airport users. Next, the research sample was small. Given this, future research must obtain a large number of data to provide strong results regarding the servicescape of the airport. In cooperation with the airport management research team, the valuable data and information could be used for future research. Also, it will be important to collect more samples in different hours of the day and days of the week. The same servicescape could be differently approached at different times, and even in different personal situations. Accordingly, future research should continue to explore servicescape by conducting research in different time sequences and situations.

Author Contributions

Conceptualization, J.-W.P. and Y.K.R.; methodology, J.-W.P. and Y.K.R.; data collection and analysis, J.-W.P. and Y.K.R.; writing-original draft, J.-W.P. and Y.K.R.; writing-review & editing, J.-W.P. and Y.K.R.; supervision of the research, J.-W.P.; funding acquisition, J.-W.P.

Funding

This work was supported by 2017 Korea aerospace university faculty research grant.

Conflicts of Interest

The authors declare no conflict of interest.

References

  1. Choi, M.S.; Seo, Y.-M.; Lee, H.R. Effect of service quality and revisit intention for servicescape in the wine restaurant. Korea Contents Assoc. 2012, 12, 391–400. [Google Scholar] [CrossRef]
  2. Bitner, M.J. Servicescapes: The impact of physical surroundings on customers and employees. J. Mark. 1992, 56, 57–72. [Google Scholar] [CrossRef]
  3. Bogicevic, V.; Yang, W.; Cobanoglu, C.; Bilgihan, A.; Bujisic, M. Traveler anxiety and enjoyment: The effect of airport environment on traveler’s emotions. J. Air Transp. Manag. 2016, 57, 122–129. [Google Scholar] [CrossRef]
  4. Humphreys, I.; Francis, G. Performance measurement: A review of airports. Int. J. Transp. Manag. 2002, 1, 79–85. [Google Scholar] [CrossRef]
  5. Park, H.S.; Kim, H.Y.; Lee, J.Y. Lee, S.M. A study on the influence of airport environment on airport users’ emotions–focused on incheon international airport. J. Korean Soc. Aviat. Aeronaut. 2017, 25, 61–75. [Google Scholar] [CrossRef]
  6. Hanks, L.; Line, N.D. The restaurant social servicescape: Establishing a nomological framework. Int. J. Hosp. Manag. 2018, 74, 13–21. [Google Scholar] [CrossRef]
  7. Akturan, U.; Tezcan, N. Identifying the major discriminative consumption styles and money attitudes of male and female young adults. Int. J. Bus. Econ. 2014, 4. [Google Scholar] [CrossRef]
  8. Wang, C.-J.; Tseng, K.-J. Effects of selected positive resources on hospitality service quality: The mediating role of work engagement. Sustainability 2019, 11. [Google Scholar] [CrossRef]
  9. Tombs, A.; McColl-Kennedy, J.R. Social-servicescape conceptual model. Mark. Theory 2003, 3, 447–476. [Google Scholar] [CrossRef]
  10. Brocato, E.D.; Voorhees, C.M.; Baker, J. Understanding the influence of cues from other customers in the service experience: A scale development and validation. J. Retail. 2012, 88, 384–398. [Google Scholar] [CrossRef]
  11. Baker, J.; Parasuraman, A.; Grewal, D.; Voss, G.B. The influence of multiple store environment cues on perceived merchandise value and patronage intentions. J. Mark. 2002, 66, 120–141. [Google Scholar] [CrossRef]
  12. Wakefield, K.L.; Blodgett, J.G. The effect of the servicescape on customers’ behavioral intentions in leisure service settings. J. Serv. Mark. 1996, 10, 45–61. [Google Scholar] [CrossRef]
  13. Tse, D.K. Models of consumer satisfaction formation: An extension. J. Mark. Res. 1988, 25, 204–213. [Google Scholar] [CrossRef]
  14. Cronin, J.J., Jr.; Brady, M.K.; Hult, G.T. Assessing the effects of quality, value, and customer satisfaction on consumer behavioral intentions in service environments. J. Retail. 2000, 76, 193–218. [Google Scholar] [CrossRef]
  15. Kim, M.K.; Park, M.C.; Park, J.H.; Kim, J.; Kim, E. The role of multidimensional switching barriers on the cognitive and affective satisfaction-loyalty link in mobile communication services: Coupling in moderating effects. Comput. Hum. Behav. 2018, 87, 212–223. [Google Scholar] [CrossRef]
  16. Martin, D.; O’neill, M.; Hubbard, S.; Palmer, A. The role of emotion in explaining consumer satisfaction and future behavioural intention. J. Serv. Mark. 2008, 22, 224–236. [Google Scholar] [CrossRef]
  17. Lam, L.W.; Chan, K.W.; Fong, D.; Lo, F. Does the look matter? The impact of casino servicescape on gaming customer satisfaction, intention to revisit, and desire to stay. Int. J. Hosp. Manag. 2011, 30, 558–567. [Google Scholar] [CrossRef]
  18. Spangenberg, E.R.; Crowley, A.E.; Henderson, P.W. Improving the store environment: Do olfactory cues affect evaluations and behaviors? J. Mark. 1996, 11, 71–92. [Google Scholar] [CrossRef]
  19. Teeters, K.; Jones, T.; Boatman, J.F. Smoke Gets in Your Eyes-Examining Air Quality in Casino-Hotels. Cornell Hosp. Q. 1995, 36, 69. [Google Scholar] [CrossRef]
  20. Kim, J.; de Dear, R. Nonlinear relationships between individual IEQ factors and overall workspace satisfaction. Build. Environ. 2012, 49, 33–40. [Google Scholar] [CrossRef] [Green Version]
  21. Tombs, A.G.; McColl-Kennedy, J.R. Social and spatial influence of customers on other customers in the social-servicescape. Australas. Mark. J. 2010, 18, 120–131. [Google Scholar] [CrossRef]
  22. Nguyen, D.T.; DeWitt, T.; Russell-Bennett, R. Service convenience and social servicescape: Retail vs hedonic setting. J. Serv. Mark. 2012, 26, 265–277. [Google Scholar] [CrossRef]
  23. Line, N.D.; Hanks, L.; Zhang, L. Birds of a feather donate together: Understanding the relationship between the social servicescape and CSR participation. Int. J. Hosp. Manag. 2018, 71, 102–110. [Google Scholar] [CrossRef]
  24. Rosenbaum, M.S.; Massiah, C. An expanded servicescape perspective. J. Serv. Manag. 2011, 22, 471–490. [Google Scholar] [CrossRef]
  25. Jani, D.; Han, H. Personality, social comparison, consumption emotions, satisfaction, and behavioral intentions: How do these and other factors relate in a hotel setting? Int. J. Contemp. Hosp. Manag. 2013, 25, 970–993. [Google Scholar] [CrossRef]
  26. Tajfel, H. Human Groups and Social Categories; Cambridge University Press: Combridge, UK, 1981; ISBN 978-052-128-073-0. [Google Scholar]
  27. Gremler, D.D.; Gwinner, K.P.; Brown, S.W. Generating positive word-of-mouth communication through customer-employee relationships. J. Serv. Manag. 2001, 12, 44–59. [Google Scholar] [CrossRef]
  28. Pounders, K.R.; Babin, B.J.; Close, A.G. All the same to me: Outcomes of aesthetic labor performed by frontline service providers. J. Acad. Mark. Sci. 2015, 43, 670–693. [Google Scholar] [CrossRef]
  29. Grove, S.J.; Fisk, R.P. The impact of other customers on service experiences: A critical incident examination of “Getting Along”. J. Retail. 1997, 73, 63–86. [Google Scholar] [CrossRef]
  30. McGrath, M.A.; Otnes, C. Unacquainted influencers: When strangers interact in the retail setting. J. Bus. Res. 1995, 32, 261. [Google Scholar] [CrossRef]
  31. Soderlund, M.; Julander, C.R. Physical attractiveness of the service worker in the moment of truth and its effects on customer satisfaction. J. Retail. Consum. Serv. 2009, 16, 216–226. [Google Scholar] [CrossRef]
  32. Tsaur, S.-H.; Luoh, H.-F.; Syue, S.-S. Positive emotions and behavioral intentions of customers in full-service restaurants: Does aesthetic labor matter? Int. J. Hosp. Manag. 2015, 51, 115–126. [Google Scholar] [CrossRef]
  33. Solomon, M.R. A role theory perspective on dyadic interactions: The service encounter. J. Mark. 1985, 49, 99–112. [Google Scholar] [CrossRef]
  34. Keller, K.L. Conceptualizing, measuring, and managing customer-based brand equity. J. Mark. 1993, 57, 1–23. [Google Scholar] [CrossRef]
  35. Nguyen, N.; Leblanc, G. Corporate image and corporate reputation in customers’ retention decisions in services. J. Retail. Consum. Serv. 2001, 8, 227–236. [Google Scholar] [CrossRef]
  36. Lai, F.; Griffin, M.; Babin, B.J. How quality, value, image, and satisfaction create loyalty at a Chinese telecom. J. Bus. Res. 2009, 62, 980–986. [Google Scholar] [CrossRef]
  37. Amin, M.; Isa, Z.; Fontaine, R. Islamic banks: Contrasting the drivers of customer satisfaction on image, trust, and loyalty of Muslim and non-Muslim customers in Malaysia. Int. J. Bank Mark. 2013, 31, 79–97. [Google Scholar] [CrossRef]
  38. Hu, H.H.; Kandampully, J.; Juwaheer, T.D. Relationships and impacts of service quality, perceived value, customer satisfaction, and image: An empirical study. Serv. Ind. J. 2009, 29, 111–125. [Google Scholar] [CrossRef]
  39. Cheng, B.L.; Rashid, M.Z.A. Service quality and the mediating effect of corporate image on the relationship between customer satisfaction and customer loyalty in the Malaysian hotel industry. Gadiah Mada. Int. Bus. 2013, 15, 99–112. [Google Scholar] [CrossRef]
  40. Chiou, Y.C.; Chen, Y.H. Factors influencing the intentions of passengers regarding full service and low cost carriers: A note. J. Air Transp. Manag. 2010, 16, 226–228. [Google Scholar] [CrossRef]
  41. Liat, C.B.; Mansori, S.; Huei, C.T. The associations between service quality, corporate image, customer satisfaction, and loyalty: Evidence from the malaysian hotel industry. J. Hosp. Mark. Manag. 2014, 23, 314–326. [Google Scholar] [CrossRef]
  42. Oyserman, D. Identity-based motivation: Implications for action-readiness, procedural-readiness, and consumer behavior. J. Consum. Psychol. 2009, 19, 250–260. [Google Scholar] [CrossRef] [Green Version]
  43. Kim, H.K.; Jung, H.C. Passengers’ perception of in-flight physical and social servicescape regarding full service carriers and low cost carriers. Int. J. Tour. Hosp. Res. 2017, 31, 51–65. [Google Scholar]
  44. Okazaki, S.; Hirose, M. Does gender affect media choice in travel information search? On the use of mobile Internet. Tour. Manag. 2009, 30, 794–804. [Google Scholar] [CrossRef] [Green Version]
  45. Sánchez-Hernández, R.M.; Martínez-Tur, V.; Peiró, J.M.; Moliner, C. Linking functional and relational service quality to customer satisfaction and loyalty: Differences between men and women. Psychol. Rep. 2010, 106, 598–610. [Google Scholar] [CrossRef]
  46. Meyers-Levy, J.; Sternthal, B. Gender differences in the use of message cues and judgments. J. Mark. Res. 1991, 28, 84–96. [Google Scholar] [CrossRef]
  47. Kandampully, J.; Hu, H.-H. Do hoteliers need to manage image to retain loyal customers? Int. J. Contemp. Hosp. Manag. 2007, 19, 435–443. [Google Scholar] [CrossRef]
  48. Song, J.J. Spss/Amos Statistical Analysis Method; 21C: Gyeonggi, Korea, 2008. [Google Scholar]
  49. Anderson, J.C.; Gerbing, D.W. Structural equation modeling in practice: A review and recommended two-step approach. Psychol. Bull. 1988, 103, 411–423. [Google Scholar] [CrossRef]
  50. Hair, J.F.; Black, W.C.; Babin, B.J.; Anderson, R.E.; Tatham, R.L. Multivariate Data Analysis, 6th ed.; Pearson Prentice Hall: Upper Saddle River, NJ, USA, 2006. [Google Scholar]
  51. Ryu, J.Y.; Choi, B.S. An Investigation of the Factor Structure of the Career Guidance Efficacy Scale. Korea Res. Inst. Vocat. Educ. Train. 2013, 16, 83–106. [Google Scholar]
  52. Browne, M.W.; Cudeck, R. Alternative ways of assessing model fit. Sage Focus Ed. 1993, 154, 136. [Google Scholar] [CrossRef]
  53. Bentler, P.M. Comparative fit indexes in structural models. Psychol. Bull. 1990, 107, 238–246. [Google Scholar] [CrossRef]
  54. Kline, R. Principles and Practice of Structural Equation Modeling, 2nd ed.; Guilford Publications: New York, NY, USA, 2005; ISBN 978-159-385-075-3. [Google Scholar]
  55. Fornell, C.; Larcker, D.F. Structural equation models with unobservable variables and measurement error: Algebra and statistics. J. Mark. Res. 1981. [Google Scholar] [CrossRef]
  56. Roh, K.S. The Proper Methods of Statistical Analysis for Dissertation; Hanbit academy: Seoul, Korea, 2014. [Google Scholar]
  57. Mitchell, V.W.; Walsh, G. Gender differences in German consumer decision-making styles. J. Consum. Behav. 2004, 3, 331–346. [Google Scholar] [CrossRef]
  58. Eklof, J.A.; Westlund, A. Customer satisfaction index and its role in quality management. Total Qual. Manag. 1998, 9, 80–85. [Google Scholar] [CrossRef]
Figure 1. Research Model.
Sustainability 11 04171 g001
Figure 2. Demographic characteristics.
Sustainability 11 04171 g002
Figure 3. Results of hypothesis testing.
Sustainability 11 04171 g003
Table 1. Hypotheses.
Hypotheses
H1Physical servicescape has a positive impact on cognitive satisfaction.
H2Physical servicescape has a positive impact on affective satisfaction.
H3Employee-related social servicescape has a positive impact on cognitive satisfaction.
H4Employee-related social servicescape has a positive impact on affective satisfaction.
H5Other customer-related social servicescape has a positive impact on cognitive satisfaction.
H6Other customer-related social servicescape has a positive impact on affective satisfaction.
H7Cognitive satisfaction has a positive impact on airport image.
H8Affective satisfaction has a positive impact on airport image.
H9aGender will moderate the relationship between physical servicescape and cognitive satisfaction.
H9bGender will moderate the relationship between physical servicescape and affective satisfaction.
H9cGender will moderate the relationship between employment in social servicescape and cognitive satisfaction.
H9dGender will moderate the relationship between employment in social servicescape and affective satisfaction.
H9eGender will moderate the relationship between other customers in social servicescape and cognitive satisfaction.
H9fGender will moderate the relationship between other customers in social servicescape and affective satisfaction.
H9gGender will moderate the relationship between cognitive satisfaction and airport image.
H9hGender will moderate the relationship between affective satisfaction and airport image.
Table 2. Demographic characteristics.
VariableN%VariableN%
GenderMale11641AccompanimentBy oneself8128.6
Female16759Couple3512.4
Age>2031.1Friends/colleagues9834.6
20–296121.6Family6824
30–399533.6Others10.4
40–498028.3Educational levelHigh school and below20.7
50–593813.4University or college17662.2
6062.1Graduate school10537.1
Total283100
Table 3. Results of Confirmatory Factor Analysis.
Configuration ConceptsMeasurement ItemsStandarized EstimateCritical RatioSMCAverage Variance ExtractedConstruct ReliabilityCronbach’ α
ServicescapeAesthetics5The style of the interior accessories at the airport was fashionable0.817-0.6670.7630.9420.910
Aesthetics4The airport was decorated in an attractive fashion.0.78114.9140.61
Aesthetics3The terminal architecture gave it an attractive character0.86217.1620.743
Aesthetics2Materials used inside the airport were pleasing and of high quality.0.84516.6810.714
Aesthetics1Wall decor at the terminal was visually appealing.0.79515.2880.632
Air quality5The lighting at the airport was adequate0.743-0.5520.7270.9300.897
Air quality4The lighting at the airport created a comfortable atmosphere.0.817.0560.64
Air quality3Air humidity at the airport was acceptable0.86814.3320.753
Air quality2Air circulation at the airport was appropriate0.73912.1060.546
Air quality1The temperature at the airport was comfortable.0.78312.8950.613
Layout accessibility 5Overall, the airport layout made it easy to get where I wanted to go.0.932-0.8680.7220.9280.938
Layout accessibility4The airport layout made it easy to walk to my gate0.93228.8440.869
Layout accessibility3Clarity of the airport terminal signs and symbols was adequate.0.90826.5280.824
Layout accessibility2The signs used at the airport were helpful to me.0.77818.1320.605
Layout accessibility1The airport layout made it easy for me to move around.0.77618.0270.602
Cleanliness4The airport maintained clean walkways and gates.0.893-0.7970.8370.9530.903
Cleanliness3The airport maintained clean food service areas.0.87120.1970.759
Cleanliness2The airport maintained clean restrooms.0.83518.6620.697
Cleanliness1Overall, the airport was kept clean.0.76215.8980.580.8890.9600.949
Scent3The airport had a pleasant smell.0.939-0.881
Scent2The aroma at the airport was fitting.0.96333.2630.928
Scent1The aroma at the airport was adequate.0.8925.7080.791
Seating comfort3The airport provided sufficient number of comfortable seats.0.934-0.8720.8490.9440.940
Seating comfort2The furniture at the terminal was appropriately designed.0.93228.1010.868
Seating comfort1The seat arrangements at the airport gates provided plenty of space.0.88324.1980.779
Electronic equipment3The wifi service was easy to use.0.86-0.740.7290.8890.879
Electronic equipment2The charging plug was easy to find.0.84217.0570.709
Electronic equipment1The self-service system (e.g. self check-in, self bag-drop, etc.) was easy to use.0.82116.4650.674
Social servicescapeEmployeePhysical Appearnace3The employees looked nice.0.863-0.7410.8820.9570.929
Physical Appearnace2The employees were dressed appropriately.0.94522.6920.897
Physical Appearnace1The appearance of the employees looked professional.0.90421.090.816
Suitable Behavior3The employees were friendly towards me.0.921-0.8490.8650.9500.929
Suitable Behavior2The employees seemed willing to help me.0.93127.1070.868
Suitable Behavior1The employees spent enough time and effort trying to solve customer problems.0.86222.150.739
Professionalism3The employees were clearly aware of their work.0.901-0.8120.8900.9600.937
Professionalism2The employees had the knowledge to respond to my needs.0.94526.620.894
Professionalism1The employees have expertise in providing customer services0.89523.3220.799
Perceived Similarity3I could identify with the employees in IIA T2.0.945-0.8930.8990.9640.965
Perceived Similarity2I am similar to the employees in IIA T2.0.99343.1350.987
Perceived Similarity1The employees are like me0.91529.7390.837
Other customers (users)Physical Appearnace3I liked the appearance of the other customers.0.928-0.8580.8940.9620.943
Physical Appearnace2The other customers were dressed appropriately.0.94729.5240.9
Physical Appearnace1The other customers looked nice0.89224.8470.798
Suitable Behavior3The other customers behave well.0.929-0.8630.9020.9650.949
Suitable Behavior2I found that the other customers behaved well.0.9429.3960.884
Suitable Behavior1The other customers were friendly towards me0.91827.2190.842
Perceived Similarity3The other customers came from a similar background to myself.0.947-0.8990.9010.9650.965
Perceived Similarity2I could identify with the other customers in IIA T2.0.95735.6150.917
Perceived Similarity1I felt similar to the other customers in IIA T2.0.94233.3270.89
SatisfactionCognitive1It was a wise choice for me to use IIA T2.0.892-0.8150.9000.9640.903
Cognitive 2It was a good choice to visit IIA T2.0.91220.1410.878
Cognitive 3The facilities at IIA T2 are what I needed at the airport.0.80717.2570.834
Affective 1I am satisfied with the overall service of IIA T2.0.903-0.7960.9070.9670.940
Affective 2It was a pleasant experience visiting IIA T2.0.93726.0980.832
Affective 3I am completely satisfied with my experience at IIA T2.0.91324.50.652
Airport ImageAirport Image1IIA makes the user feel friendly.0.859-0.7370.8010.9410.901
Airport Image2The atmosphere of IIA is excellent.0.81416.9370.663
Airport Image3IIA has a unique image.0.81116.8240.657
Airport Image4I like the overall image of IIA.0.85918.5130.738
Table 4. Results of hypothesis testing.
HypothesisEstimatesCritical RatioResults
H1: Physical Servicescpae → Cognitive satisfaction0.201 **2.921Supported
H2: Physical Servicescpae → Affective satisfaction0.981 ***10.369Supported
H3: Social Servicescape_Employee → Cognitive satisfaction−0.016−0.075Rejected
H4: Social Servicescape_Employee → Affective satisfaction−0.044−0.237Rejected
H5: Social Servicescape_Other customers →Cognitive satisfaction−0.060−0.364Rejected
H6: Social Servicescape_Other customers → Affective satisfaction0.0740.496Rejected
H7: Cognitive satisfaction → Airport image0.0270.510Rejected
H8: Affective satisfaction → Airport image0.855 ***15.941Supported
Note: *** p < 0.001, ** p < 0.010.
Table 5. Results of moderating effect of gender.
Hypo-ThesesMale GroupFemale Group
EstimatesCritical RatiopSupportedEstimatesCritical RatiopSupported
H9a0.3532.5290.011 *Yes0.1461.8740.061No
H9b1.0276.209***Yes0.9128.299***Yes
H9c0.160.630.529No−0.064−0.3390.734No
H9d−0.08−0.4430.658No−0.027−0.1420.887No
H9e−0.146−0.7060.48No−0.067−0.450.653No
H9f0.1671.1320.258No−0.008−0.0510.959No
H9g0.081.0620.288No−0.013−0.1790.858No
H9h1.01310.456***Yes0.77311.658***Yes
Note: *** p < 0.001, ** p < 0.010, * p < 0.05.

