Abstract
The use of a single criterion in the selection of the most suitable hybrid renewable energy system (HRES) has been reported to be inadequate in terms of sustainability. In order to fill this gap, this study presents a multi-criteria approach for the selection of HRES for a typical low-income household. The analysis is based on two energy demand scenarios viz: consumer demand based on energy efficient equipment (EET) and consumer energy demand without energy efficiency. The optimization of the HRES is performed using hybrid optimization of multiple energy renewables (HOMER) while the multi-criteria analysis is carried out using Criteria Importance Through Intercriteria Correlation (CRITIC) and the Technique for Order of Preference by Similarity to the Ideal Solution (TOPSIS). Results show that the optimal HRES alternative returned based on both energy demand scenarios is a PV/GEN/BAT system. The analysis further shows that a reduction of 44.6% in energy demand through EET leads to: 51.38% decrease in total net present cost, 11.90% decrease in cost of energy, 96.61% decrease in emission and 193.94% increase in renewable fraction. Furthermore, the use of multi-criteria approach for HRES selection has an influence in the selection and ranking of the most suitable HRES alternatives. Overall, the application of EETs is environmentally and economically beneficial while the application of MCDM can help decision makers make a comprehensively informed decision on the selection of the most suitable HRES.
1. Introduction
Adequate access to electricity has been identified as a foremost tool that can aid the development and growth of urban, semi-urban and rural communities [1]. This is because electricity acts as an initiation tool, employer and driver of products and services [2]. Reliable access to electricity forms the basis for many daily operations in businesses, households, production lines, services etc. In order to ensure reliable electricity, one of the sustainable developmental goals (SDGs) advocates for a low-cost, sustainable and reliable access to electrification across all societal class [3]. This is expected to reduce poverty rates and at the same time improve the standard of living across the world. As a way of increasing the electrification rates, utility grids are usually extended to areas without electricity access or through decentralized generation in areas that are not grid-viable. In many developing countries (especially sub-Sahara Africa), the challenge spans beyond extension of grid or decentralized generation as a lot of areas with utility grid or distributed generations do not have adequate and reliable access to electricity [4]. Many consumers experience blackouts for days. This particularly is due to deficits in the level of electricity generation.
In order to meet their basic electricity demands, many consumers have turned to the use of personal captive gasoline/diesel powered electricity generators [5]. This, however, comes at an extra cost and associated challenges. Some of these challenges include: incessant increase in fuel pump price, irregular pump price across geographical zones, and occasional scarcity of fuel. Others include: hazards associated in storing fuel products, adulteration of fuel products, health hazards associated with exhaust fumes and some other environmental hazards responsible for climate change. The majority of grid-connected power plants are also powered by conventional sources (fossil fuels). As a result, electricity generation accounts for majority (42%) of the emission worldwide [6]. Apart from the aforementioned challenges, there is a growing concern with regard to the depletion of conventional sources of energy sources and its sustainability [2].
In combating the challenges associated with global warming (caused by the use of fossil fuel) and depletion of fossil fuel reserves, several environmental policies that encourages the decarbonization of electricity generation has been put in place at international, regional and national levels. One of such policies is the Paris Agreement which proposes to `to keep the increase in global average temperature to well below 2 C above pre-industrial levels; and to limit the increase to 1.5 C’ [7]. Some of the strategies and tools proposed to aid decarbonization include adoption of renewable energy for powering homes and industries, energy efficiency measures (retrofitting and energy conservation), carbon capture and storage, demand response, clean coal technologies, carbon tax, feed-in-tariffs, emission and trading schemes etc. Out of these strategies, the most prominent approaches used at the demand side are the adoption of renewable energy technologies and energy efficiency. Renewable energy, which is used as an alternative for electricity generation, has been the focus of many researches in recent times [4,8,9,10,11,12]. Most of these studies concluded that the use of hybrid renewable energy system is more efficient and reliable as compared to a single source [4,8,9,10]. Hybrid energy systems eliminate the problem associated with intermittency of renewable energy sources- such as solar and wind- which has been ascertained to be both economically and environmentally viable. On the other hand, energy efficiency can be used to reduce energy consumption. And by implication the size of the energy system needed to meet a particular load and the electricity bills/cost of energy (COE) [2]. Another advantage of energy efficiency is the reduction in emissions [13].
The theoretical depth and the discussive length of renewable energy systems adoption have expanded tremendously. For example, Oyedepo et al. [11] presented a techno-economic model for the assessment of a hybrid renewable energy system for a rural community across six locations in Nigeria. They reported that the cost of energy (COE) varied directly as the value of the wind and solar irradiation received at the locations under study. Zahboune et al. [14] proposed a novel modified electric system cascade approach for designing a hybrid PV/wind energy system based on power pinch analysis. This approach was compared with results presented by hybrid optimization of multiple energy resources (HOMER) tool. There was a slight difference between the result of their approach and those of HOMER, for example, a difference of 0.07% in COE, 5.4% in excess energy and 0.04% in energy production was recorded. Fazelpour et al. [15] investigated the viability of replacing diesel generator in hybrid energy system with hydrogen powered generator in five different configurations for a residential application. Their study reported that the most economically viable hybrid renewable energy system (HRES) configuration is the wind-diesel-battery-power converter-electrolyzer. Yilmaz and Dincer [16] optimized a hybrid PV-battery-diesel energy system for an off-grid holiday inn in Turkey. In a bid to obtain the maximum energy output for a grid connected PV system, Al Garni et al. [12] investigated various PV array tracking configurations for electricity generation- the configurations considered include: horizontal-axis with daily adjustment, two axis, horizontal-axis with monthly adjustment, horizontal-axis with continuous adjustment, horizontal-axis with weekly adjustment, and vertical-axis with continuous adjustment. Their analysis shows that the two axis configuration returned the highest power. Krishan and Sathans [17], presented a similar study whose results was identical to the one reported by Al Garni et al. [12]. The study by Diemuodeke et al. determined the optimal locations for siting PV-wind-diesel-battery system across Nigeria [18]. Akinbulire et al. [2] considered the influence of demand side management on the sizing of HRES for a rural community in Nigeria. Rezzouk and Mellit [19] investigated the effects of various level of PV penetration on the techno-economic features of PV–diesel–battery HRES. The authors concluded that the compromise between PV penetration efficiency, energy cost and the system stability can be achieved at 25 % PV penetration. Table 1 shows the summary of some literature considered in this study. Table 1 shows that the most considered aspects in HRES literature is the technical and economic implications. This is followed by emission analysis. However, reliability, energy efficiency and the use of multiple criteria in system ranking have received low research focus.

Table 1.
Summary of relevant literature.
Based on literature search, many case studies concentrate on national [34], regional [35] and rural communities scale [2,11,12,16,18,20,22,23,26,28,36] with only a few research efforts directed at low-income households. Furthermore, the effect of energy efficient practices on the techno-economic and environmental features of HRES have not been comprehensively investigated (see Table 1). Apart from these, it has also been reported that many HRES were not able to adequately address the challenges faced by energy consumers especially in the Global South, in the past because the choice of these HRES alternatives were solely based on a single criterion: either the technical or economic [37,38,39]. As such, the selection and ranking of HRES alternatives based on multiple criteria have not been comprehensively considered in household applications. Criteria that relate to socio-cultural practices, environmental requirements, enabling policies [40] and so on, are also very important in the selection and ranking of suitable HRES alternatives. As a contribution to the existing literature, this study presents a techno-economic optimization and emission analysis of HRESs using energy efficient loads in a typical low-income household. It further presents a multi-criteria method for the selection of the most suitable HRES obtained from the optimization process. The techno-economic optimization of the HRES is carried out using HOMER while the multi-criteria analysis is carried out using the Criteria Importance Through Intercriteria Correlation (CRITIC) and Technique for Order of Preference by Similarity to the Ideal Solution (TOPSIS) methods. Our results suggest that energy efficiency can reduce the overall costs of HRESs, the cost of energy as well as the emission attributed to such systems. Furthermore, the use of multiple criteria in the selection of HRES can re-order the ranking of the HRESs returned using a single criterion.
2. Materials and Methods
The methodology adopted in this study is divided into three stages (Figure 1). The first stage deals with the evaluation of the energy demand, energy resource, as well as the technical and cost details of the components. These details serve as the major inputs into HOMER, a software capable of performing modelling, simulation and sensitivity analysis of energy system (renewable and conventional).
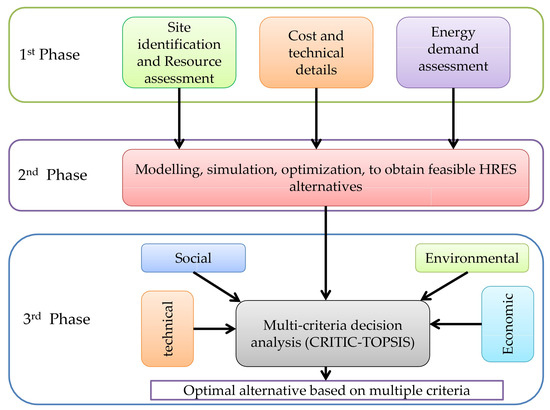
Figure 1.
Methodology adopted in this study.
The second stage involves the use of HOMER to simulate and optimize the HRES alternatives. The selection and ranking of HRES at this stage is based on the total net present cost (TNPC). The last stage uses multi-criteria decision-making (MCDM) approach to rank the HRES alternatives based on multiple criteria (social, technical, economic, environmental, and policy).
2.1. Site Description and Resources Assessment
The HRES is proposed for a low-income residential apartment in Akoka (6.5270 N, 3.3918 E), Lagos state, Nigeria (Figure 2). Lagos is an energy-hungry city because it is a major commercial hub in Nigeria. The selected location receives considerable wind and solar irradiation resource.

Figure 2.
Map of the Study Area.
Just like most locations in Nigeria, the area under consideration receives less than 8 h of constant electricity supply daily. Furthermore, residents experience incessant black out due to utility grid breakdown, vandalization of facilities, inadequate maintenance, and natural factors (rain, storm etc.). In order to meet daily electricity needs, many resident make use of captive gasoline/diesel powered generators [41,42]. The use of captive generators is not cost effective and environmentally-friendly. Perpetual increase in the fuel pump price and its scarcity are also major setbacks credited to this approach of electricity generation. In the past, the fumes from these generators has been reported to cause deaths and many health hazard.
The average 22 year solar radiation and wind speed data for the location considered in this study was obtained from the NASA website [43] (Figure 3 and Figure 4).
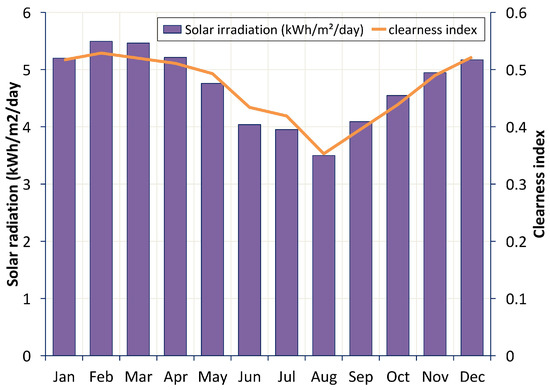
Figure 3.
Monthly solar radiation.
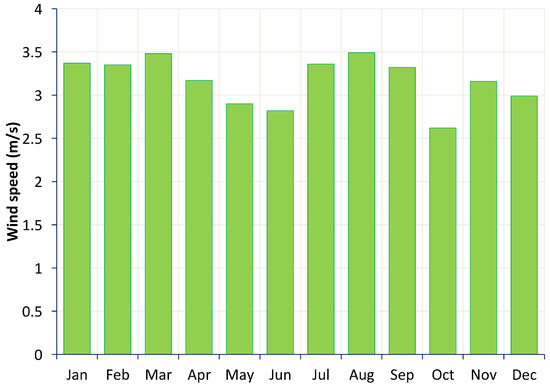
Figure 4.
Monthly wind speed.
According to Figure 3, the peak solar radiation was experienced in February and March while the lowest solar radiation was experienced in the month of August. The monthly average wind speed shows that the highest wind speed (3.49 m/s) was experienced in August while the lowest (2.62 m/s) was in October (Figure 4).
2.2. System Modelling
The simulation and optimization of the proposed HRES is carried out using Hybrid Optimization of Multiple Electric Renewables (HOMER). HOMER software was used for the modeling, simulation, optimization and sensitivity analysis of grid connected and off-grid energy systems for diverse applications. In order to simulate an energy system, HOMER performs an annual energy balance calculation with a simulation time step of one hour (8760 h). On an hourly basis, it compares the energy demand (thermal and electric) to the hourly energy generated by the system. In order to obtain the energy balance, it performs calculations of energy exchange among the system components. This calculation is carried out for different energy system alternatives. For energy systems with fuel-fired power generator(s) and battery storage system, HOMER also specifies for every hour of the year, the operational strategies behind the use of the generator(s) as well as the scheme for the charging and discharging of the battery bank. Feasible systems that can meet the energy demand under the various constraints specified are identified and the system costs till the end of the project life are calculated. The components that make up the project costs include: investment, operations and maintenance, fuel cost, replacements and interest. Penalties for capacity shortage and emissions can also be included in the evaluation process.
After the simulation process, all feasible system alternatives that satisfies the specified constraints are sorted, categorized and ranked based on the total net present cost (TNPC). The energy system with the least TNPC is considered as the best. The techno-economic input to HOMER include: daily energy demand, renewable energy resources, capital, replacement, operation and maintenance costs, technical details of components and operational constraints. These inputs are discussed in the next sub-sections. Outputs from HOMER include component sizes, TNPC, levelised cost of energy (LCOE), unmet energy, capacity shortage, excess energy productions, renewable fraction (RF), and annual emissions among other.
2.3. Energy Efficiency Techniques (EETs)
Energy efficiency is a form of demand side management techniques. It involves techniques aimed at reducing the quantity of energy required to drive a service or finish a product. By doing so, the available and planned energy resources are optimized and saved for the use of future generations. Some of these methods include: adequate insulation and ventilation in homes, use of energy efficient lamps, use of energy star products, etc. The adoption of energy efficiency can reduce energy consumption and increase renewable energy penetration [44]. It can also reduce cost of energy and emissions. In order to evaluate the efficacy of a DSM technique, two basic indices are typically used. The first one (demand side management quality index [DSMQI]) accesses the technical benefit, while the second index (demand side management appreciation index [DSMAI]) evaluates the economic benefit. Equations (1) and (3) are used to evaluate DSMQI and DSMAI, respectively [45]. If the values of and are greater than 1, it is an indication that the DSM measure adopted is beneficial; the higher the value, the higher the advantage of the DSM activity.
where , , , and are energy demand with DSM, energy demand without DSM, cost of energy with DSM, and cost of energy without DSM, respectively.
2.4. Energy Demand Assessment
For the purpose of this study, a low-income household is considered for HRES electrification. Usually, a modest low income-household consist of a living-room, a bedroom, a kitchen and one or two restroom (Figure 5).
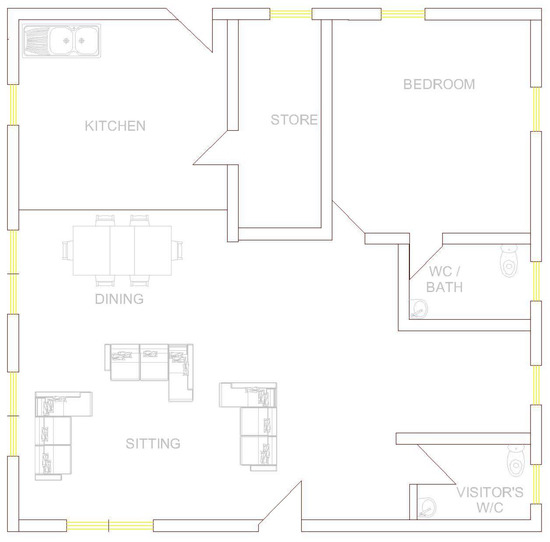
Figure 5.
Floor plan of a typical low income house.
The number of occupants varies between one and four. The energy demand profile of a typical low-income household (in Nigeria) is presented in Figure 6. In order to elucidate the advantage of energy efficient energy-consuming home gadgets, this study considered two load scenarios: energy demand without energy efficient energy-consuming devices and energy demand with energy efficient energy-consuming devices. It is assumed that a capital cost of $2000 would be incurred for the retrofit of inefficient energy gadgets- the replaced gadgets are lighting bulbs, ceiling fans, television, and pressing iron. The hourly energy consumption is estimated using Equation (4). Table 2 shows the gadget, power rating, energy consumption, and daily duration of consumption for both scenarios mentioned above. Without retrofitting, it is observed that lighting consumes the highest energy (36%) while equipment such as blender, phone, television and cable decoder consumes the least energy. After retrofit, the lighting consumes only 10% of the total energy while the refrigeration consumes the highest (Figure 7). The demand profile shows that the peak periods of the energy demand occur around 5 a.m. and 6 a.m. as well as 7 p.m. and 10 p.m. The first peak is associated with preparation for daily work by residents while the second peak can be attributed to the resident retiring from their daily work and make use of electricity for various domestic needs. Since residents are not usually around between 7 a.m. and 6 p.m., the energy consumption is minimal.
where is the power rating of a connected load, is the duration for operating a connected load and is the number of a particular connected load.
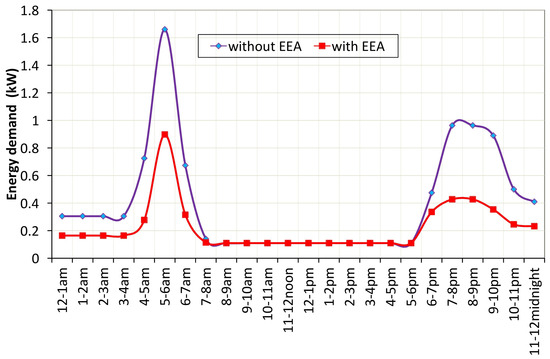
Figure 6.
Energy demand of the residential building.
Table 2.
Gadget, power rating, and energy consumption.
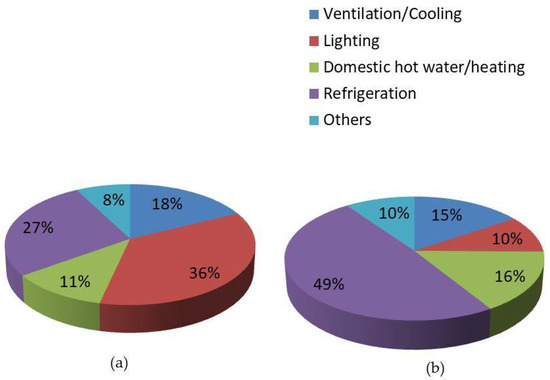
Figure 7.
Energy consumption details. (a) before retrofit; (b) after retrofit.
2.5. Cost and Technical Specifications
Based on the energy resource available at the study location, a system consisting of photovoltaic panels (PV), wind turbine, gasoline generator and battery bank is proposed (Figure 8). The cost and technical details of the components used are presented in this subsection. The lifespan of the project is assumed to be 25 years while the annual real interest rate is taken as 6%. Given below are the specific cost and technical detail of the various system components.
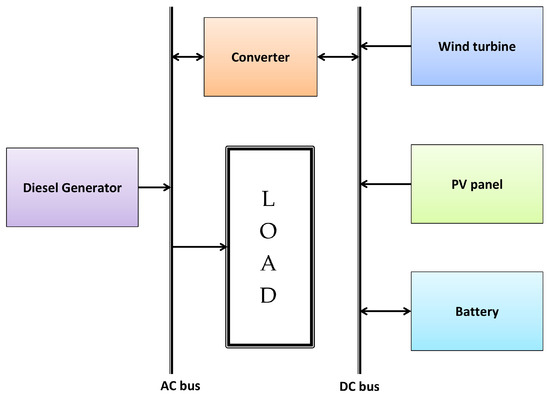
Figure 8.
Proposed HRES configuration.
Photovoltaic panel: The investment cost of the PV panel is taken to be $4250 for a kW, while the replacement cost and operation and maintenance cost is assumed to be $4200/kW and $0/year, respectively. The size of the solar panel considered is between 0 and 5 kW, with a lifespan of 25 years. The output of the PV panel is assumed to be DC with no tracking system, with a derating factor of 80%, and ground reflectance of 20%.
Wind turbine: A 3 kW DC wind turbine whose capital cost and replacement costs are assumed to be $1200 and $1100, respectively, is specified. It is also assumed that the wind turbine will last for 25 years, and it will cost $20 to maintain it annually. The wind turbine is assumed to be installed 25 m above the sea level. The search space (turbine number) considered is between 0 and 3.
Gasoline generator: A 2.6 kW generator with a capital cost of $1000 is specified. The software then interpolates or extrapolates this value to obtain the cost for the generator specified in the optimal system. The operation and maintenance cost of the generator is fixed as 0.04 $/h. The replacement cost of the gasoline generator is $1000 and its lifespan is 15,000 h. Other parameters specified for the generator include: minimum load ratio of 30%, intercept coefficient of 0.08 L/h/kW rated, and slope of 0.25 L/h/kW output. The search space considered include: 0.4, 0.5, 0.75 and 1 (kW), respectively.
Battery bank: The battery considered is assumed to be 4 V, 1900 Ah with a capital and replacement of $269 and $260 respectively. The number of batteries considered is between 0 and 40, with a life-span of 4 years. In order to maintain each battery, a consumer is expected to spend $5 annually.
Converter: The cost of a 3 kW converter is taken to be $200, with a replacement cost of $225. Other parameters include: Operation and maintenance cost—1$/year, inverter efficiency—90%, rectifier efficiency—85% and lifespan—15 years. The sizes considered include 0, 1, 2, 3, 4 (kW).
Emission factors: In order to estimate the quantity of emissions, various values of emission factor has been used in the literature [3,46]. For the purpose of this study, the values in Table 3 were adopted.
Table 3.
Pollutants and emission factor.
2.6. Reliability
There are usually situations where consumer’s energy demand requirements would not be met by the proposed energy system. This may be due to insufficiency in energy resources. Such circumstance will led to a loss of power which in turn result in consumer’s load not been served at such moment. This study uses a loss of energy probability (LOEP)—Equation (5) and a availability (Equation (6)) indices to evaluate the reliability of the proposed systems.
2.7. Multi-Criteria Decision Analysis: TOPSIS
Multi-criteria decision making methods (MCDMs) are typically used for ranking and identifying the best alternative in the presence of multiple criteria and attributes. Some of these include WSM, WPM, WASPAS, AHP, ELECTRE, PROMETHEE, VIKOR, COPRAS, TOPSIS [35,47,48,49]. For this study, TOPSIS method is applied due to its rationality, comprehensibility, computational efficiency, ease of application, and simple expressions that interconnects the relative performance of the highlighted alternatives [50]. Another advantage is that the number of alternatives and criteria it can handle is not limited. However, one major drawback of this method is problem of ranking reversal. This means that the final ranking can change as soon as new alternatives are included in the model [51]. The categorized optimal HRES alternatives returned by HOMER are only ranked based on the TNPC. By applying the MCDM, other criteria (technical, environmental, social) and attributes are included to select the best alternative. This study uses Technique for Order of Preference by Similarity to the Ideal Solution (TOPSIS) for the multi-criteria decision making.
2.7.1. CRITIC
The CRITIC approach proposed by Diakoulaki [52] is used in determining the weights allocated to the criteria. In order to implement CRITIC, the first step is to estimate the standard deviation of the j-th criteria using Equation (7).
where represents the mean of the j-th criteria. The next step is to calculate the conflict between the j-th criterion and the other criteria using Equation (8).
where the coefficient of correlation between the j-th and k-th criteria is determined by using Equation (9).
where:
A higher value of is an indication of higher positive correlation between two criteria, while a greater value of is an indication of lower positive correlation between the j-th criteria and others [53]. Lastly, the weight of the criteria can be calculated using Equation (11).
2.7.2. TOPSIS
The governing principle behind TOPSIS allows that the best alternative should have the least distance from the ideal solution and the longest from the negative-ideal solution. Detailed analysis of the TOPSIS method is available in the literature [18,26,27,54]; however, the basic steps are presented as follow:
Step 1—identification and definition of attributes
Step 2—establishment of an initial decision matrix with m alternatives, n criteria with scores assigned to every attribute of all alternatives.
Step 4—construction of the weighted normalized decision matrix
where:
so that
and is the original weight given to the indicator ,
Step 5—determination of the positive ideal and negative ideal solution
where related to the criteria with positive impact, and related to the criteria with negative impact.
Step 6—calculation of the separation measure
Step 7—calculation of the relative closeness to the ideal solution
3. Results and Discussions
3.1. Optimal System Comparison with and without EET (Single Criterion)
The categorized optimization results (based on least TNPC) for the HRES without and with EET are presented in Table 4 and Table 5, respectively. From the result presented in Table 5, the optimal HRES without the application of EET consist of a 1 kW PV panel, 0.75 kW gasoline generator and 6 batteries. The capital cost, TNPC and COE of this system are $2900, 14,230 and 0.316 kWh/year, respectively. This system has the capability to achieve a 33% renewable fraction annually with the gasoline generator operating for 3931 h annually. This means that the gasoline generator will emit about 2479 kg of every year. The second best HRES on the list is a PV/WD/BAT system with a TNPC of $18,568 and 52% RF. Other HRES include PV/BAT with a TNPC and RF of $18,652 and 100% respectively, WD/GEN/BAT with a TNPC and RF of $19,213 and 25% respectively and PV/WD/BAT with a TNPC and RF of $22,350 and 100% respectively. As regards the economic profitability, only the optimal system (PV/GEN/BAT) performed better than the present gasoline generator been used by majority of the residents. It is the only HRES that returned a feasible present worth, annual worth and discounted payback (DPB). This means that, the PV/GEN/BAT is the only economically viable HRES that can replace the use of gasoline generator for a scenario where the connected loads are not energy efficient.
Table 4.
Categorized optimized HRESs results without EET application.
Table 5.
Categorized optimized HRESs results with EET application.
When EET is applied to the residential loads, the optimal HRES that will meet the energy demand of the residential apartment is also a PV-generator-battery system but with lower generator size and higher PV capacity. The rating of the components include: PV—2 kW, generator—0.4 kW, and 6 batteries. The initial investment (inclusive of equipment retrofits) for acquiring this system is $5807, while the TNPC and COE is $6919 and 0.28 $/kWh, respectively. The renewable fraction (RF) for this HRES is 97% with gasoline generator operating for only 367 h in a year while emitting 83.2 kg of annually. The other HRES alternatives returned with EET application (ranked based on TNPC) include PV/BAT with a TNPC of $7738 and RF of 100%; PV/WD/GEN/BAT with a TNPC and R.F of $11,087 and 95%, respectively; PV/WD/BAT with a TNPC and RF of $11,766 and 100%, respectively; PV/GEN with a TNPC and RF of $11,778 and 39% respectively; and WD/GEN/BAT with a TNPC and RF of $12,752 and 43% respectively. Out of these HRES alternatives, the PV/GEN/BAT (optimal system) has the least discounted payback period of slightly less than 5 years. If the gasoline generators presently used by many of the residents are replaced by the PV/GEN/BAT, this means that in less than 5 years, the initial capital cost spent in putting up the system will be recovered. Furthermore, the PV/GEN/BAT HRES performed better than the other alternatives with regards to present worth, annual worth, return on investment (ROI) and Internal rate of return (IRR). These are indicators of the superior economic feasibility and profitability features of the PV/GEN/BAT HRES.
Altogether, when the optimal HRES system returned with and without the application of EET are compared, the optimal system with EET applied was able to achieve 100.24% increase in initial capital, 51.38% decrease in TNPC, 11.90% decrease in COE, 96.61% decrease in emission and 193.94% increase in renewable fraction. The values of DSMQI (1.81) and DSMAI (1.19) shows that the EET technique applied is technically and economically viable and beneficial.
The reliability results for the optimal systems without the application of EET show that the load will only be lost for less than 3 h annually (Table 6). However, when EET is applied, the optimal system will be out of service for approximately 3 days annually. The reliability values for the rest of the HRES is presented in Table 6. The HRES that is used to serve the load without EET performed better in terms of the reliability. This is due to the fact that the diesel generator produce more energy to support the system when EET is not applied.
Table 6.
HRESs reliability results.
3.2. Multi-Criteria Decision Analysis
Traditionally, the choice of optimal HRES is based on a single criterion-TNPC or life cycle cost. However, a system with the least TPNC might not be the most suitable choice if other relevant criteria are considered. In order to re-evaluate the most suitable choice of HRES for the household in the presence of multiple criteria, TOPSIS method is employed. As presented in Section 3.1, HOMER returned six HRES alternatives when EET was applied to the residential load. TOPSIS method is used to evaluate and rank these systems in order to obtain the most suitable HRES for the household. This selection is based on technical, economic, environmental and social criteria, with various attributes.
The initial decision matrix has six HRES alternatives and fourteen attributes (Table 7). The values attached to these attributes are obtained from HOMER simulations (see Table 5) and experts’ opinion. They include attributes that relate to social, technical, economic, emission as well as policy. Table A1 (Appendix A) presents the normalized decision matrix based on Equation (12) while Table A2 presents the weighted normalized matrix based on Equations (13)–(15). Table A3 presents the positive and negative ideal solution based on Equations (16) and (18). Table 8 presents the relative distance of each solution from the positive and the negative ideal solution based on Equations (19) and (20) for each alternative. The HRES with a relative closeness value closest to 1 is considered as the best alternative, while the one furthest from 1 is considered the worst alternative.
Table 7.
Initial decision matrix.
Table 8.
Relative distance and relative closeness and ranking of each alternative.
Results from the multi-criteria decision making analysis indicates that PV/GEN/BAT with a relative closeness of 0.734 is the most suitable HRES. This is the same HRES alternative that is identified as the optimal based on single criterion of TNPC. The second best system is PV/BAT energy system, with a relative closeness of 0.654; this is followed by PV/WD/GEN/BAT, with a relative closeness of 0.637. The fourth ranked HRES is the PV/WD/BAT HRES, with a relative closeness of 0.605. In the fifth place is WD/GEN/BAT system, with a relative closeness of 0.493 while the PV/GEN energy system, with a relative closeness of 0.302 is ranked worst. A comparison between the system ranking with a single criterion and with multiple criteria is presented in Figure 9. Except for the last two systems on the list returned by the TOPSIS method, all other systems produced the same ranking when compared with the ranking returned by HOMER (single criterion).
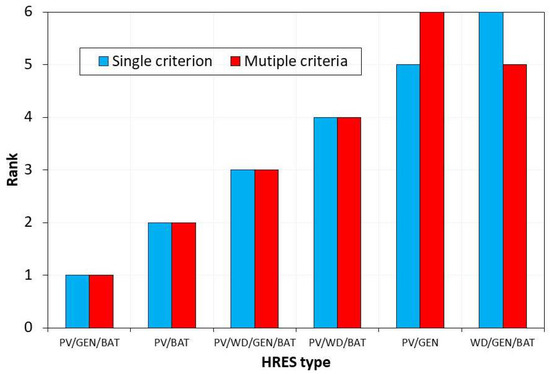
Figure 9.
ranking comparison.
The cash flow details for the most suitable HRES based on multi-criteria decision analysis is presented in Figure 10. The initial investment cost of putting up the system is $5807. The initial cost of this project consists of the purchase price of the various components which make up the system; its breakdown shows that the PV panels accounts for about 38.7% ($2250) of the capital cost. This is followed by cost of energy efficiency activities-$2,000; battery bank-$1320; gasoline generator-$154 and converter-$ 83. The battery bank will be replaced two times during the project lifespan (year 12 and year 24). However, the entire system can be sold for $1294.7 (salvage) at the end of the project life span of 25 years.
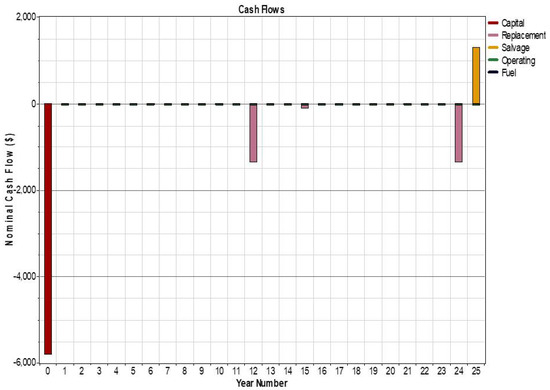
Figure 10.
Cash flow for PV/WD/BAT HRES.
The monthly energy production for the PV/GEN/BAT HRES is presented in Figure 11. On the average, PV accounts for the 97% of annual energy production while gasoline generator accounts for 3%. Interestingly, the monthly energy production trend followed the solar radiation resource pattern. The highest electricity production occurred in the month of March and February, respectively. These are the months when the solar and wind resources are at their peak (see Figure 3). The gasoline generator contributed more energy in June, July, August and September because these months have the lowest solar resource. These are the months when the rainy season and cloudy weather is predominant in Nigeria.
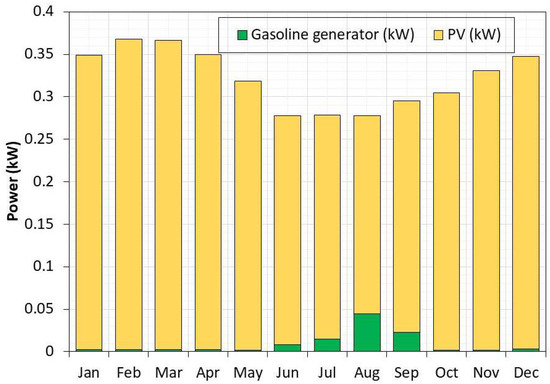
Figure 11.
Monthly energy production for PV/WD/BAT HRES.
The breakdown of energy demand, electricity production and the state of charge (SOC) of the battery bank for a typical month in the dry season (February) and a typical month in the rainy season (August) is presented in Figure 12 and Figure 13, respectively. From Figure 12, it can be seen that the gasoline generator operates for less hours in the month and on the average the battery SOC is above 50% at all times. This is because there is adequate PV output in February to serve the energy demand and to also charge the battery bank. In contrast, the use of gasoline generator is more frequent in August. Also, for most of the times, the battery SOC is at minimum depth of discharge (40%). These can be attributed to the cloudy weather conditions predominant in this time of the year, which causes the PV panels to produce low output.
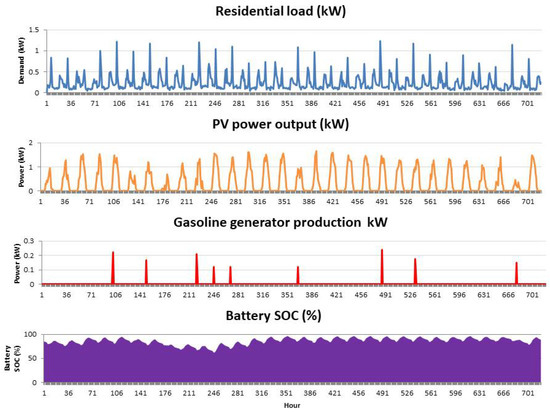
Figure 12.
Energy production of PV panel and gasoline generator and battery SOC in February.
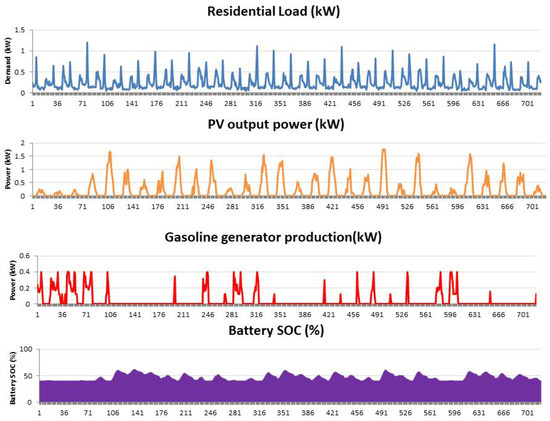
Figure 13.
Energy production of PV panel and gasoline generator and battery SOC in August.
A comparison of the best ranked HRES (PV/GEN/BAT) with the second best ranked HRES (PV/BAT) shows that PV/GEN/BAT exhibited better qualities in terms of TNPC and COE while the PV battery system has a lower operating cost. The PV/GEN/BAT also has a better attribute in terms of minimum unmet load capacity shortage and excess electricity production. Apart from these attributes, the PV/GEN/BAT is more reliable as compared to the PV/BAT energy system (Table 6). On the other hand, the performance of the PV/BAT energy system is better than that of the PV/GEN/BAT in terms of the environmental implications because it exhibits 100% renewable fraction and zero emission during energy production. It is also easier to install and its resources are easily available at zero cost. It also has higher total electricity production which can be sold to the grid (if available). Although the PV/BAT system is greener as compared to the PV/GEN/BAT HRES, a major challenge that a typical low-income household will face in adopting PV/BAT HRES is the initial cost of installation. Low income households usually have a constrained budget for purchase of energy and may tend to choose the PV/GEN/BAT as against PV/BAT because it has the least economic implications. Their choice may also be aided by the fact that the present policy in Nigeria does not place emission penalties on the use of fossil fuel-powered generators. However, from the environmental point of view, the PV/BAT HRES will contribute to reduction in emission of greenhouse gases and encourage sustainable development.
Figure 14 presents the battery state of charge (SOC) for both configurations. From this figure, the battery SOC for the PV/GEN/BAT energy system configuration is depleted to its minimum between late June and early September of every year. Furthermore, it could be observed that on the average, the battery for the PV/BAT energy system is well charged throughout the year and does not reach the minimum SOC. This is because in comparison to the PV/GEN/BAT system, the PV/BAT system has more PV panel capacity that produces more power output to charge the battery.
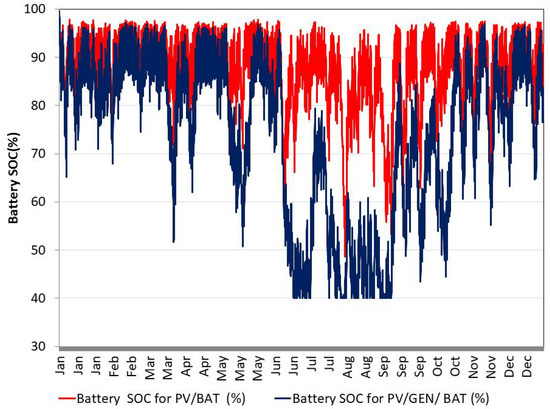
Figure 14.
Hourly battery SOC over a typical year.
4. Conclusions
Traditionally, the choice of HRES is usually based on a single criterion—total net present cost. However, a single criterion may not be sufficient to ensure sustainability and a well informed choice. In order to address this issue, this paper presented a viability analysis of HRES adoption for a typical low-income household based on multiple criteria. It also explored the effects of energy efficiency techniques on the features of the optimal system that will serve the proposed low-income household. This study explored the use of gasoline, wind as well as solar resource under various configurations for meeting the energy needs of a low income household. This study adopted standard off-grid power system methodologies offered by HOMER software, relevant standards, a MCDM tool (TOPSIS) and relevant literature for the simulation, optimal sizing, and selection of the most suitable HRES for the low-income household. Furthermore, a daily energy consumption profile suitable for a real-life low-income household is used to analyse the HRES. The technical analyses presented include: system capacities, battery state of charge, combined electricity production, renewable fraction and systems reliability. Examined in the economic analyses are: net present cost, investment cost, cost of energy, simple payback (SPB), present worth, return on investment and so on; while the emission analysis is carried out for environmental purpose. Although there are very few studies related to this present study, the results of the optimal HRES configuration observed in this study is consistent with the one reported by Olatomiwa et al. [55] for a similar location in Lagos state, Nigeria. The main outcomes of the study are as follows:
- As expected, energy efficiency reduced the energy demand of the household. The reduction will consequently improve the techno-economic and emission output during the optimization and sizing of HRES. For example, for the proposed household, a reduction of 44.6% in energy demand through EET will lead to; 51.38% decrease in TNPC, 11.90% decrease in COE, 96.61% decrease in emission and 193.94% increase in renewable fraction. This, however, comes at a 100.24% increase in initial capital.
- The most suitable alternative that will serve the energy requirement of the low-income household considered based on a single criterion and multiple criteria is a PV/GEN/BAT HRES. It exhibited better performance in terms of initial investment cost, TNPC, COE, discounted payback, ROI, IRR, present worth and annual worth.
- The adoption of multi-criteria approach for the selection of HRES can reorder the ranking of HRES returned, based on a single criterion. For example, in this study, the WD/GEN/BAT HRES was ranked as the least viable (6th) and the PV/GEN was ranked 5th based on single criterion. However, the ranking based on multiple criteria ranked WD/GEN/BAT HRES 5th and PV/GEN as 6th.
The study has been able to elucidate the importance of applying energy efficient activities in households prior to the sizing of HRES. It will lead to reduction in the cost of energy and the capital cost spent on deploying HRES. This will ease the financial burden of adopting HRES. Energy efficient activities will also lead to reduction in emission; thereby slowing down climate change. Apart from this, it will reduce the amount of toxic fumes that energy consumers are exposed to, thereby lowering the risks of health related challenges. This study has also shown that it is important to consider multiple criteria when selecting the best energy alternatives. This is expected to produce a more robust result that may be different from the use of a single criterion. The effects of various sources of uncertainty on the features of the HRESs has not been considered in this study. It will be interesting to consider the effects of change in fuel pump price, meteorological data, interest rates and load demand on the technical features of the HRESs. Future research can also explore the application and comparison of other MCDM methods in the selection of the most suitable HRES.
Author Contributions
O.M.B. formulated the problem and drafted the manuscript. J.L.M. and Y.H. assisted with quality improvement. All authors have read and approved the final manuscript.
Funding
This research received no external funding.
Acknowledgments
The financial assistance of the National Research Foundation (NRF) through the DST-NRF-TWAS doctoral fellowship towards this research is hereby acknowledged. Opinions expressed and conclusions arrived at, are those of the authors and are not necessarily to be attributed to the NRF.
Conflicts of Interest
The authors declare no conflict of interest.
Appendix A
Table A1.
Normalized decision matrix.
Table A1.
Normalized decision matrix.
| Criteria Weight | HRES Alternatives | |||||
|---|---|---|---|---|---|---|
| PV/GEN/BAT | PV/BAT | PV/WD/GEN/BAT | PV/WD/BAT | PV/GEN | WD/GEN/BAT | |
| 0.048 | 0.267216 | 0.298846 | 0.428186 | 0.45441 | 0.454873 | 0.492489 |
| 0.063 | 0.106885 | 0.092142 | 0.240797 | 0.21254 | 0.786277 | 0.508623 |
| 0.047 | 0.267344 | 0.298852 | 0.431569 | 0.454485 | 0.455439 | 0.488857 |
| 0.099 | 0.35128 | 0.511961 | 0.319368 | 0.473567 | 0.437791 | 0.310767 |
| 0.099 | 0.47442 | 0.489093 | 0.464638 | 0.489093 | 0.190746 | 0.21031 |
| 0.074 | 0.34988 | 0.373205 | 0.676434 | 0.373205 | 0.373205 | 0.046651 |
| 0.071 | 0.34988 | 0.373205 | 0.676434 | 0.373205 | 0.373205 | 0.046651 |
| 0.084 | 0.115822 | 0.604674 | 0.061203 | 0.508996 | 0.598089 | 0.02053 |
| 0.094 | 0.02846 | 0 | 0.046755 | 0 | 0.9036 | 0.424865 |
| 0.052 | 0.56488 | 0.444496 | 0.270865 | 0.240768 | 0.546359 | 0.231277 |
| 0.066 | 0.43949 | 0.547289 | 0.273645 | 0.273645 | 0.497536 | 0.33169 |
| 0.066 | 0.425487 | 0.586048 | 0.264926 | 0.264926 | 0.481683 | 0.321122 |
| 0.064 | 0.321122 | 0.425487 | 0.425487 | 0.377318 | 0.537879 | 0.321122 |
| 0.074 | 0.510747 | 0.466057 | 0.255373 | 0.255373 | 0.549053 | 0.300064 |
Table A2.
Weighted normalized matrix.
Table A2.
Weighted normalized matrix.
| PV/GEN/BAT | PV/BAT | PV/WD/GEN/BAT | PV/WD/BAT | PV/GEN | WD/GEN/BAT |
|---|---|---|---|---|---|
| 0.012826 | 0.014345 | 0.020553 | 0.021812 | 0.021834 | 0.023639 |
| 0.006734 | 0.005805 | 0.01517 | 0.01339 | 0.049535 | 0.032043 |
| 0.012565 | 0.014046 | 0.020284 | 0.021361 | 0.021406 | 0.022976 |
| 0.034777 | 0.050684 | 0.031617 | 0.046883 | 0.043341 | 0.030766 |
| 0.046968 | 0.04842 | 0.045999 | 0.04842 | 0.018884 | 0.020821 |
| 0.025891 | 0.027617 | 0.050056 | 0.027617 | 0.027617 | 0.003452 |
| 0.024841 | 0.026498 | 0.048027 | 0.026498 | 0.026498 | 0.003312 |
| 0.009729 | 0.050793 | 0.005141 | 0.042756 | 0.050239 | 0.001725 |
| 0.002675 | 0 | 0.004395 | 0 | 0.084938 | 0.039937 |
| 0.029374 | 0.023114 | 0.014085 | 0.01252 | 0.028411 | 0.012026 |
| 0.029006 | 0.036121 | 0.018061 | 0.018061 | 0.032837 | 0.021892 |
| 0.028082 | 0.038679 | 0.017485 | 0.017485 | 0.031791 | 0.021194 |
| 0.020552 | 0.027231 | 0.027231 | 0.024148 | 0.034424 | 0.020552 |
| 0.037795 | 0.034488 | 0.018898 | 0.018898 | 0.04063 | 0.022205 |
Table A3.
Positive and negative ideal solution.
Table A3.
Positive and negative ideal solution.
| Factor | Ideal Solution | |
|---|---|---|
| A+ | A− | |
| negative | 0.012826 | 0.023639 |
| negative | 0.005805 | 0.049535 |
| negative | 0.012565 | 0.022976 |
| positive | 0.050684 | 0.030766 |
| positive | 0.04842 | 0.018884 |
| negative | 0.050056 | 0.003452 |
| negative | 0.003312 | 0.048027 |
| negative | 0.001725 | 0.050793 |
| negative | 0 | 0.084938 |
| positive | 0.029374 | 0.012026 |
| positive | 0.036121 | 0.018061 |
| positive | 0.038679 | 0.017485 |
| positive | 0.034424 | 0.020552 |
| positive | 0.04063 | 0.018898 |
References
- Monyei, C.; Adewumi, A. Demand Side Management potentials for mitigating energy poverty in South Africa. Energy Policy 2017, 111, 298–311. [Google Scholar] [CrossRef]
- Akinbulire, T.O.; Oluseyi, P.O.; Babatunde, O.M. Techno-economic and environmental evaluation of demand side management techniques for rural electrification in Ibadan, Nigeria. Int. J. Energy Environ. Eng. 2014, 5, 375–385. [Google Scholar] [CrossRef]
- Babatunde, O.M.; Munda, J.L.; Hamam, Y. Hybrid energy system for low-income households. In Proceedings of the 2017 IEEE AFRICON, Cape Town, South Africa, 18–20 September 2017; pp. 1038–1042. [Google Scholar]
- Akinyele, D.; Belikov, J.; Levron, Y. Challenges of Microgrids in Remote Communities: A STEEP Model Application. Energies 2018, 11, 432. [Google Scholar] [CrossRef]
- Ajibade, A. Nigeria Imports 70 Million Generators. 2017. Available online: https://thenationonlineng.net/nigeria-imports-70m-generators/ (accessed on 18 June 2019).
- Planete-Energies. Electricity Generation and Related CO2 Emissions. 2016. Available online: https://www.planete-energies.com/en/medias/close/electricity-generation-and-related-co2-emissions (accessed on 30 January 2019).
- Reguly, E.; Mccarthy, S. Paris Climate Accord Marks Shift toward Low-Carbon Economy; Globe and Mail: Toronto, ON, Canada, 2015. [Google Scholar]
- Olatomiwa, L.; Mekhilef, S. Techno-economic feasibility of hybrid renewable energy system for rural health centre (RHC): The wayward for quality health delivery. In Proceedings of the IEEE Conference on Energy Conversion (CENCON), Johor Bahru, Malaysia, 19–20 October 2015; pp. 504–509. [Google Scholar]
- Bhandari, B.; Lee, K.T.; Cho, Y.M.; Ahn, S.H. Optimization of Hybrid Renewable Energy Power system: A review. Int. J. Precis. Eng. Manuf.-Green Technol. 2015, 2, 99–112. [Google Scholar] [CrossRef]
- Ashok, S. Optimised model for community-based hybrid energy system. Renew. Energy 2007, 32, 1155–1164. [Google Scholar] [CrossRef]
- Oyedepo, S.O.; Uwoghiren, T.; Babalola, P.O.; Nwanya, S.C.; Kilanko, O.; Leramo, R.O.; Aworinde, A.K.; Adekeye, T.; Oyebanji, J.A.; Abidakun, O.A. Assessment of Decentralized Electricity Production from Hybrid Renewable Energy Sources for Sustainable Energy Development in Nigeria. Open Eng. 2019, 9, 72–89. [Google Scholar] [CrossRef]
- Al Garni, H.Z.; Awasthi, A.; Ramli, M.A. Optimal design and analysis of grid-connected photovoltaic under different tracking systems using HOMER. Energy Convers. Manag. 2018, 155, 42–57. [Google Scholar] [CrossRef]
- Oluseyi, P.; Babatunde, O.; Babatunde, O. Assessment of energy consumption and carbon footprint from the hotel sector within Lagos, Nigeria. Energy Build. 2016, 118, 106–113. [Google Scholar] [CrossRef]
- Zahboune, H.; Zouggar, S.; Krajacic, G.; Varbanov, P.S.; Elhafyani, M.; Ziani, E. Optimal hybrid renewable energy design in autonomous system using Modified Electric System Cascade Analysis and Homer software. Energy Convers. Manag. 2016, 126, 909–922. [Google Scholar] [CrossRef]
- Fazelpour, F.; Soltani, N.; Rosen, M.A. Economic analysis of standalone hybrid energy systems for application in Tehran, Iran. Int. J. Hydrogen Energy 2016, 41, 7732–7743. [Google Scholar] [CrossRef]
- Yilmaz, S.; Dincer, F. Optimal design of hybrid PV-Diesel-Battery systems for isolated lands: A case study for Kilis, Turkey. Renew. Sustain. Energy Rev. 2017, 77, 344–352. [Google Scholar] [CrossRef]
- Krishan, O. Design and Techno-Economic Analysis of a HRES in a Rural Village. Procedia Comput. Sci. 2018, 125, 321–328. [Google Scholar] [CrossRef]
- Diemuodeke, E.; Addo, A.; Oko, C.; Mulugetta, Y.; Ojapah, M. Optimal mapping of hybrid renewable energy systems for locations using multi-criteria decision-making algorithm. Renew. Energy 2019, 134, 461–477. [Google Scholar] [CrossRef]
- Rezzouk, H.; Mellit, A. Feasibility study and sensitivity analysis of a stand-alone photovoltaic–diesel–battery hybrid energy system in the north of Algeria. Renew. Sustain. Energy Rev. 2015, 43, 1134–1150. [Google Scholar] [CrossRef]
- Alharthi, Y.Z.; Siddiki, M.K.; Chaudhry, G.M. Resource Assessment and Techno-Economic Analysis of a Grid-Connected Solar PV-Wind Hybrid System for Different Locations in Saudi Arabia. Sustainability 2018, 10, 3690. [Google Scholar] [CrossRef]
- Hossain, C.A.; Chowdhury, N.; Longo, M.; YaÏci, W. System and Cost Analysis of Stand-Alone Solar Home System Applied to a Developing Country. Sustainability 2019, 11, 1403. [Google Scholar] [CrossRef]
- Mandal, S.; Das, B.K.; Hoque, N. Optimum sizing of a stand-alone hybrid energy system for rural electrification in Bangladesh. J. Clean. Prod. 2018, 200, 12–27. [Google Scholar] [CrossRef]
- Sen, R.; Bhattacharyya, S.C. Off-grid electricity generation with renewable energy technologies in India: An application of HOMER. Renew. Energy 2014, 62, 388–398. [Google Scholar] [CrossRef]
- Farahi, S.; Fazelpour, F. Techno-economic assessment of employing hybrid power system for residential, public, and commercial buildings in different climatic conditions of Iran. Environ. Prog. Sustain. Energy 2019, 38, 614–623. [Google Scholar] [CrossRef]
- Goudarzi, S.A.; Fazelpour, F.; Gharehpetian, G.B.; Rosen, M.A. Techno-economic assessment of hybrid renewable resources for a residential building in tehran. Environ. Prog. Sustain. Energy 2019. [Google Scholar] [CrossRef]
- Diemuodeke, E.; Hamilton, S.; Addo, A. Multi-criteria assessment of hybrid renewable energy systems for Nigeria’s coastline communities. Energy Sustain. Soc. 2016, 6, 26. [Google Scholar] [CrossRef]
- Ighravwe, D.E.; Babatunde, O.M.; Adedoja, O.S.; Okharedia, T.E. Evaluation and Selection of Hybrid Renewable Energy Systems for Healthcare Centres In Rural Areas: A Techno-economic Approach. In Proceedings of the 2018 IEEE 7th International Conference on Adaptive Science & Technology (ICAST), Accra, Ghana, 22–24 August 2018; pp. 1–7. [Google Scholar]
- Akinyele, D. Techno-economic design and performance analysis of nanogrid systems for households in energy-poor villages. Sustain. Cities Soc. 2017, 34, 335–357. [Google Scholar] [CrossRef]
- Adaramola, M.S.; Quansah, D.A.; Agelin-chaab, M.; Paul, S.S. Multipurpose renewable energy resources based hybrid energy system for remote community in northern Ghana. Sustain. Energy Technol. Assess. 2017, 22, 161–170. [Google Scholar] [CrossRef]
- Ajayi, O.O.; Ohijeagbon, O.D.; Agarana, M.C.; Attabo, A.; Ogbonaya, M. Feasibility and Econometrics Assessment of Standalone and Hybrid RE Facilities for Rural Community Utilization and Embedded Generation in North-West, Nigeria. In Proceedings of the World Congress on Engineering 2017, London, UK, 5–7 July 2017. [Google Scholar]
- Aziz, A.S.; Tajuddin, M.F.N.; Adzman, M.R.; Ramli, M.A.; Mekhilef, S. Energy Management and Optimization of a PV/Diesel/Battery Hybrid Energy System Using a Combined Dispatch Strategy. Sustainability 2019, 11, 683. [Google Scholar] [CrossRef]
- Touré, A.F.; Addouche, S.A.; Danioko, F.; Diourté, B.; Mhamedi, A.E. Hybrid Systems Optimization: Application to Hybrid Systems Photovoltaic Connected to Grid. A Mali Case Study. Sustainability 2019, 11, 2356. [Google Scholar] [CrossRef]
- Jung, T.; Kim, D.; Moon, J.; Lim, S. A scenario analysis of solar photovoltaic grid parity in the Maldives: The case of Malahini resort. Sustainability 2018, 10, 4045. [Google Scholar] [CrossRef]
- Kharlamova, G.; Nate, S.; Chernyak, O. Renewable energy and security for Ukraine: Challenge or smart way. J. Int. Stud. 2016, 9, 88–115. [Google Scholar] [CrossRef][Green Version]
- Yazdani, M.; Chatterjee, P.; Zavadskas, E.K.; Streimikiene, D. A novel integrated decision-making approach for the evaluation and selection of renewable energy technologies. Clean Technol. Environ. Policy 2018, 20, 403–420. [Google Scholar] [CrossRef]
- Akinyele, D. Analysis of photovoltaic mini-grid systems for remote locations: A techno-economic approach. Int. J. Energy Res. 2018, 42, 1363–1380. [Google Scholar] [CrossRef]
- Akuru, U.B.; Onukwube, I.E.; Okoro, O.I.; Obe, E.S. Towards 100% renewable energy in Nigeria. Renew. Sustain. Energy Rev. 2017, 71, 943–953. [Google Scholar] [CrossRef]
- Cloke, J.; Mohr, A.; Brown, E. Imagining renewable energy: Towards a Social Energy Systems approach to community renewable energy projects in the Global South. Energy Res. Soc. Sci. 2017, 31, 263–272. [Google Scholar] [CrossRef]
- Kasperowicz, R.; Pinczyński, M.; Khabdullin, A. Modeling the power of renewable energy sources in the context of classical electricity system transformation. J. Int. Stud. 2017, 10, 264–272. [Google Scholar] [CrossRef]
- Neverauskiene, L.O.; Rakauskiene, O.G. Identification of Employment Increasing Possibilities in the Context of the EU Socioeconomic Environment Evaluation: The case of Lithuania. Econ. Sociol. 2018, 11, 51–68. [Google Scholar] [CrossRef]
- Ayodele, T.R.; Ogunjuyigbe, A.S. Increasing household solar energy penetration through load partitioning based on quality of life: The case study of Nigeria. Sustain. Cities Soc. 2015, 18, 21–31. [Google Scholar] [CrossRef]
- Enongene, K.; Abanda, F.; Otene, I.; Obi, S.; Okafor, C. The potential of solar photovoltaic systems for residential homes in Lagos city of Nigeria. J. Environ. Manag. 2019, 244, 247–256. [Google Scholar] [CrossRef]
- NASA Website. 2018. Available online: https://eosweb.larc.nasa.gov/cgi-bin/sse/grid.cgi? (accessed on 2 May 2018).
- Babatunde, O.; Munda, J.; Hamam, Y. Decarbonisation of Electricity Generation: Efforts and Challenges. In Carbon Footprints; Springer: Berlin/Heidelberg, Germany, 2019; pp. 47–77. [Google Scholar]
- Dharme, A.; Ghatol, A. Demand side management quality index for assessment of DSM programs. In Proceedings of the 2006 IEEE PES Power Systems Conference and Exposition, Atlanta, GA, USA, 29 October–1 November 2006; pp. 1718–1721. [Google Scholar]
- Babatunde, O.; Akinyele, D.; Akinbulire, T.; Oluseyi, P. Evaluation of a grid-independent solar photovoltaic system for primary health centres (PHCs) in developing countries. Renew. Energy Focus 2018, 24, 16–27. [Google Scholar] [CrossRef]
- Mardani, A.; Zavadskas, E.K.; Khalifah, Z.; Zakuan, N.; Jusoh, A.; Nor, K.M.; Khoshnoudi, M. A review of multi-criteria decision-making applications to solve energy management problems: Two decades from 1995 to 2015. Renew. Sustain. Energy Rev. 2017, 71, 216–256. [Google Scholar] [CrossRef]
- Kolios, A.; Mytilinou, V.; Lozano-Minguez, E.; Salonitis, K. A comparative study of multiple-criteria decision-making methods under stochastic inputs. Energies 2016, 9, 566. [Google Scholar] [CrossRef]
- Chatterjee, K.; Kar, S. A multi-criteria decision making for renewable energy selection using Z-numbers in uncertain environment. Technol. Econ. Dev. Econ. 2018, 24, 739–764. [Google Scholar] [CrossRef]
- Roszkowska, E. Multi-criteria decision making models by applying the TOPSIS method to crisp and interval data. Mult. Criteria Decis. Mak. Univ. Econ. Katow. 2011, 6, 200–230. [Google Scholar]
- Junior, F.R.L.; Osiro, L.; Carpinetti, L.C.R. A comparison between Fuzzy AHP and Fuzzy TOPSIS methods to supplier selection. Appl. Soft Comput. 2014, 21, 194–209. [Google Scholar] [CrossRef]
- Diakoulaki, D.; Mavrotas, G.; Papayannakis, L. Determining objective weights in multiple criteria problems: The critic method. Comput. Oper. Res. 1995, 22, 763–770. [Google Scholar] [CrossRef]
- Li, Z.; Yang, T.; Huang, C.S.; Xu, C.Y.; Shao, Q.; Shi, P.; Wang, X.; Cui, T. An improved approach for water quality evaluation: TOPSIS-based informative weighting and ranking (TIWR) approach. Ecol. Indic. 2018, 89, 356–364. [Google Scholar] [CrossRef]
- Ighravwe, D.E.; Babatunde, M.O. Determination of a Suitable Renewable Energy Source for Mini-Grid Business: A Risk-Based Multicriteria Approach. J. Renew. Energy 2018, 2018, 2163262. [Google Scholar] [CrossRef]
- Olatomiwa, L.; Mekhilef, S.; Huda, A.S.N.; Ohunakin, O.S. Economic evaluation of hybrid energy systems for rural electrification in six geo-political zones of Nigeria. Renew. Energy 2015, 83, 435–446. [Google Scholar] [CrossRef]
© 2019 by the authors. Licensee MDPI, Basel, Switzerland. This article is an open access article distributed under the terms and conditions of the Creative Commons Attribution (CC BY) license (http://creativecommons.org/licenses/by/4.0/).