Is Smart Housing a Good Deal? An Answer Based on Monte Carlo Net Present Value Analysis


Abstract
1. Introduction
2. Smart Housing Model
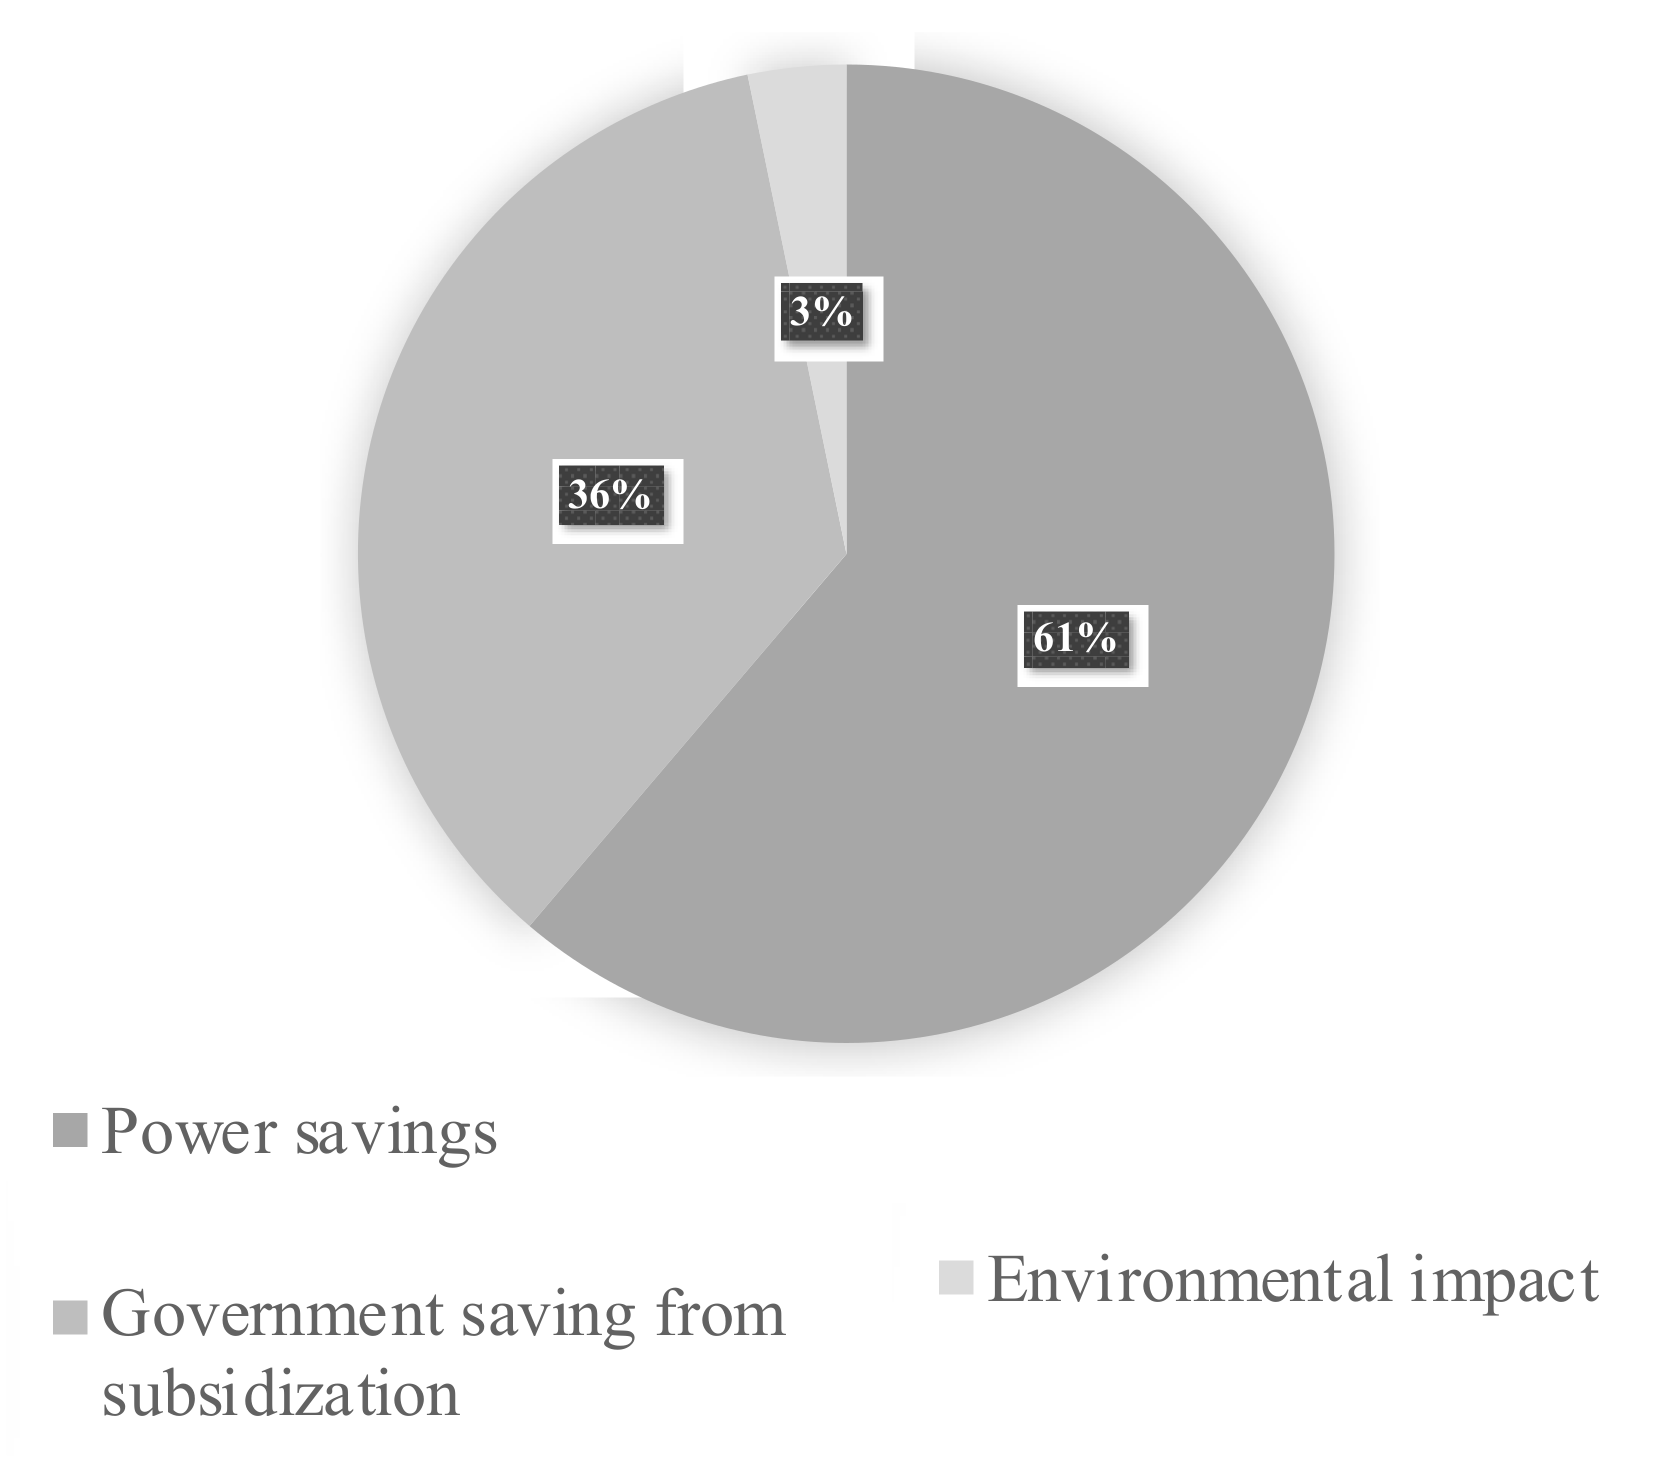
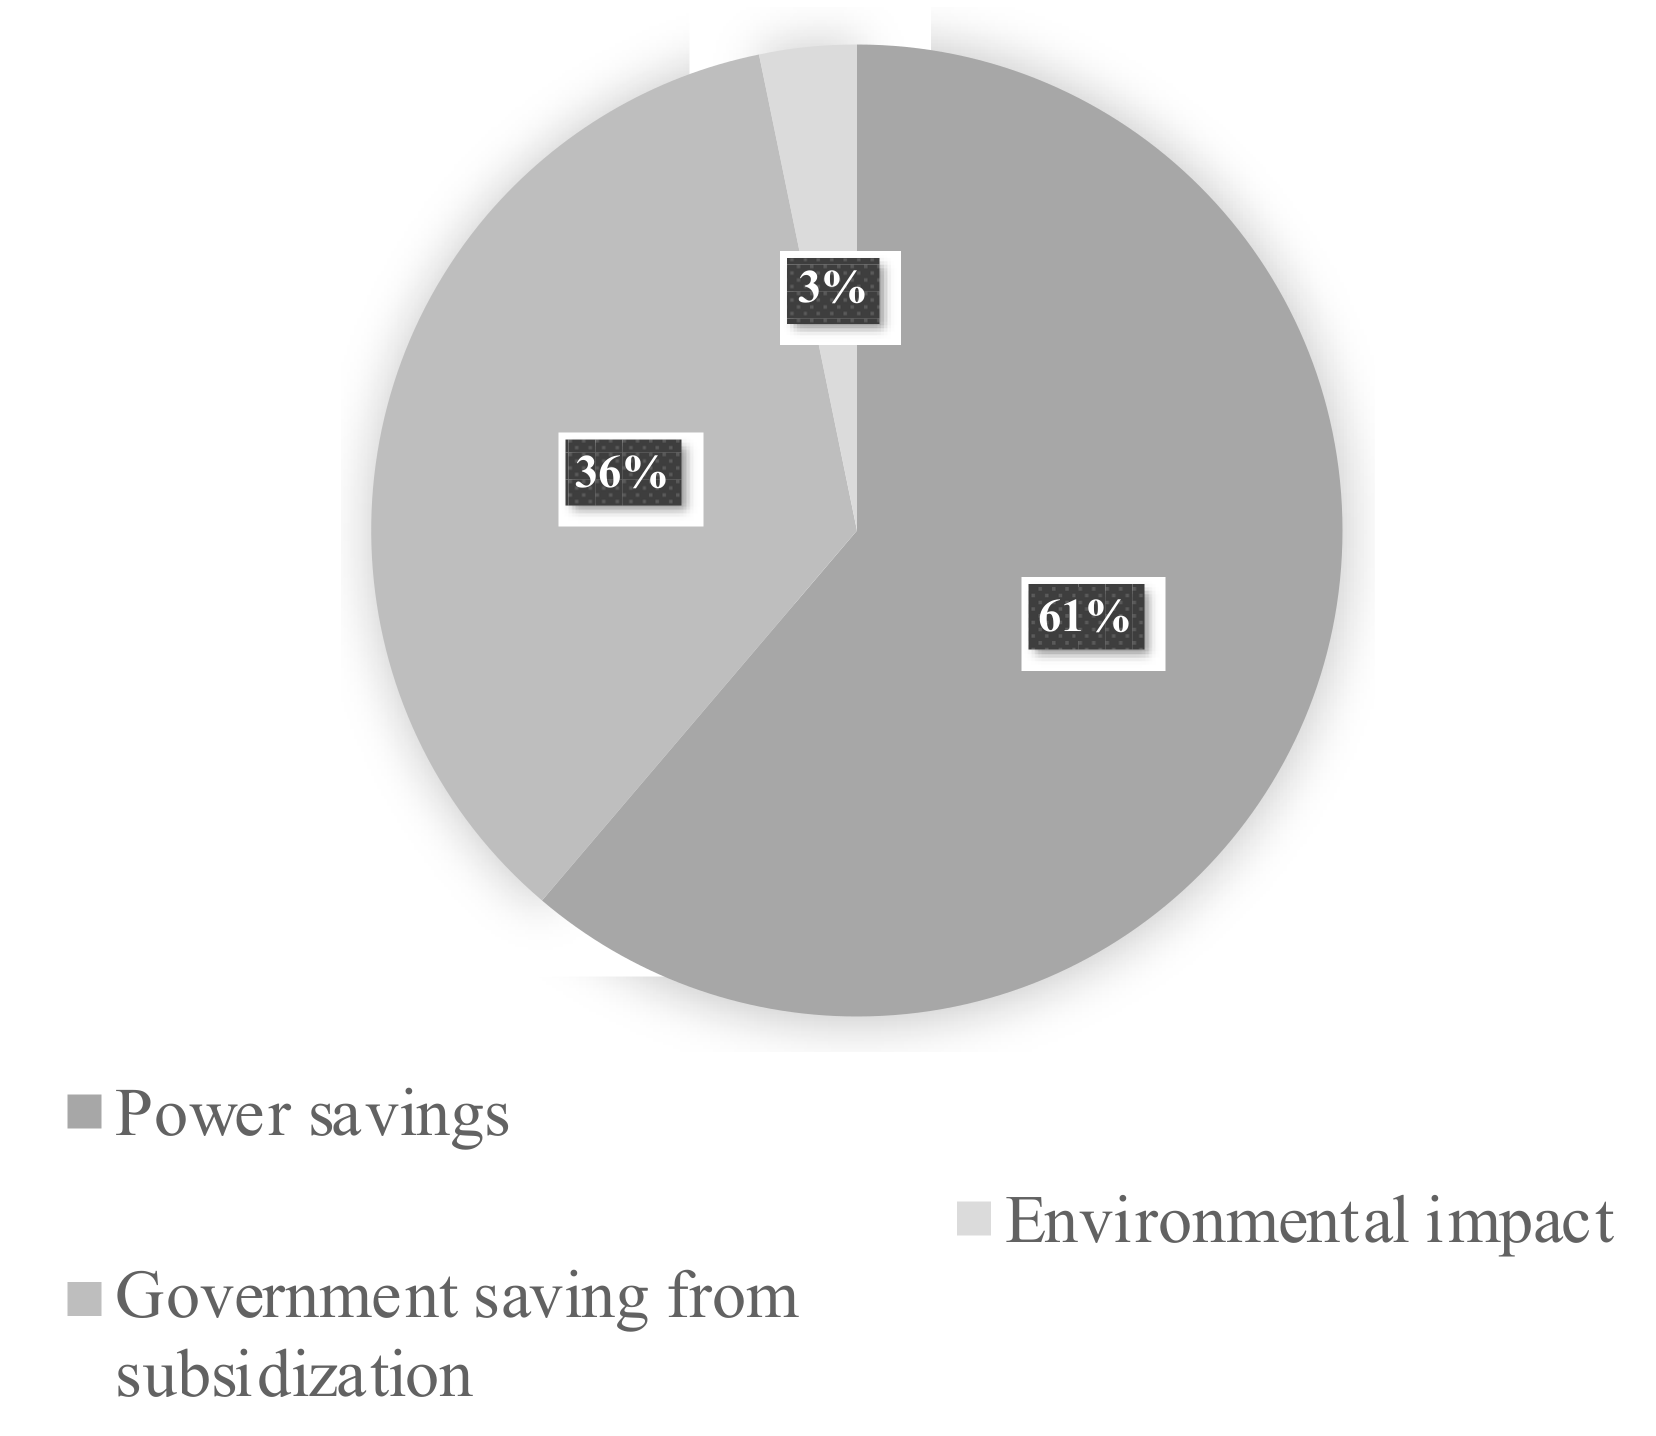
2.1. Distributed Solar Generation
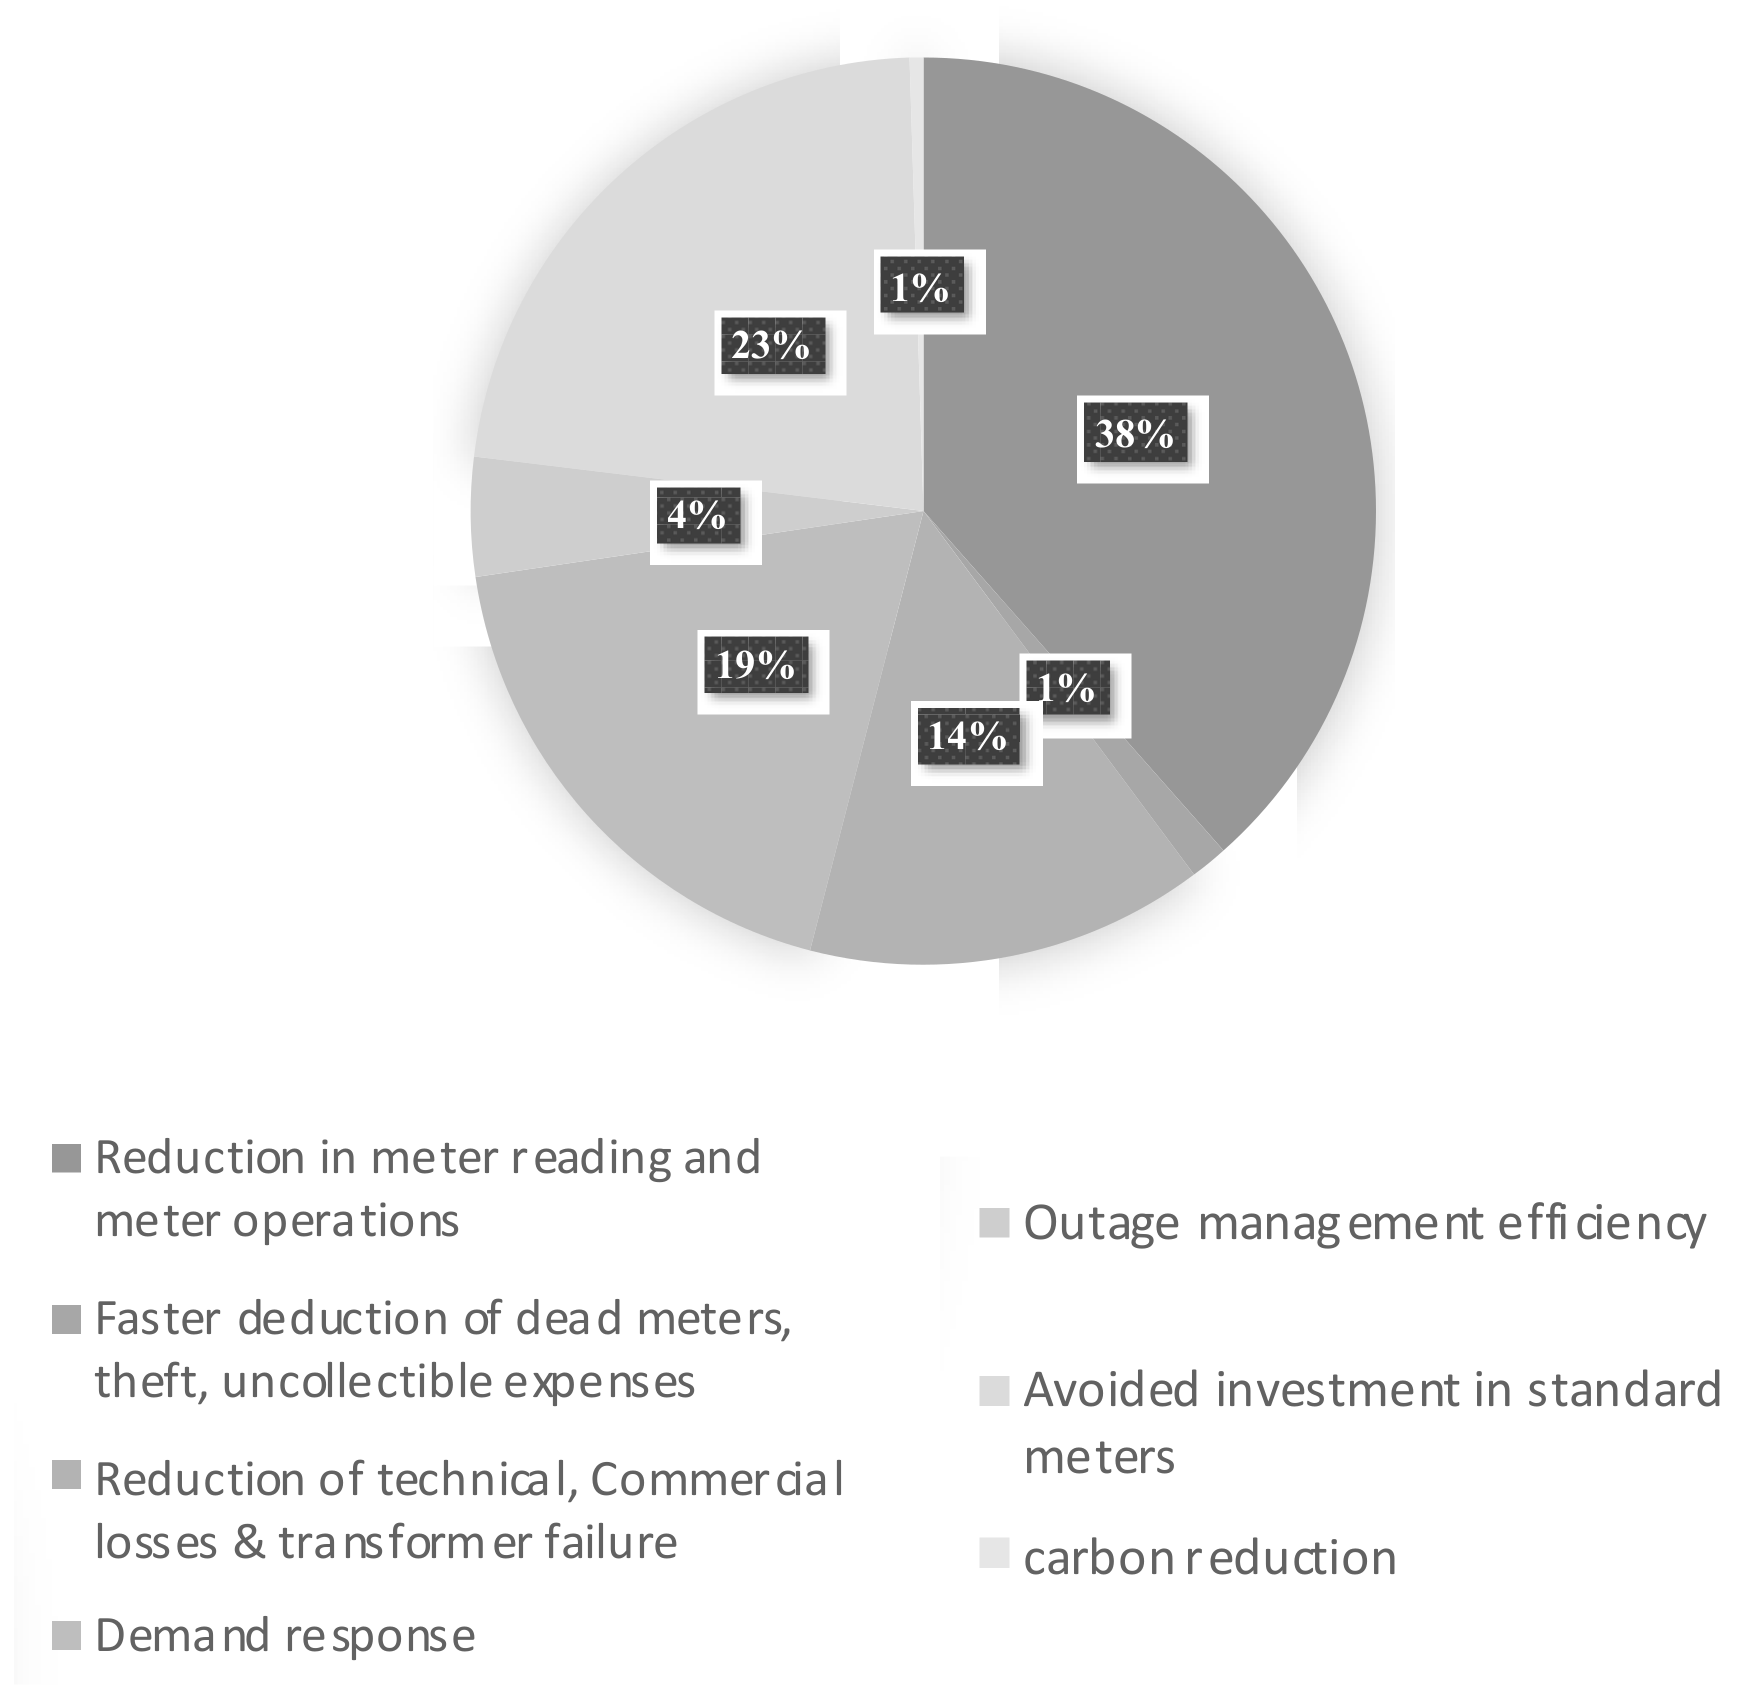
2.2. Electricity Smart Meter
2.3. Gas Smart Meter
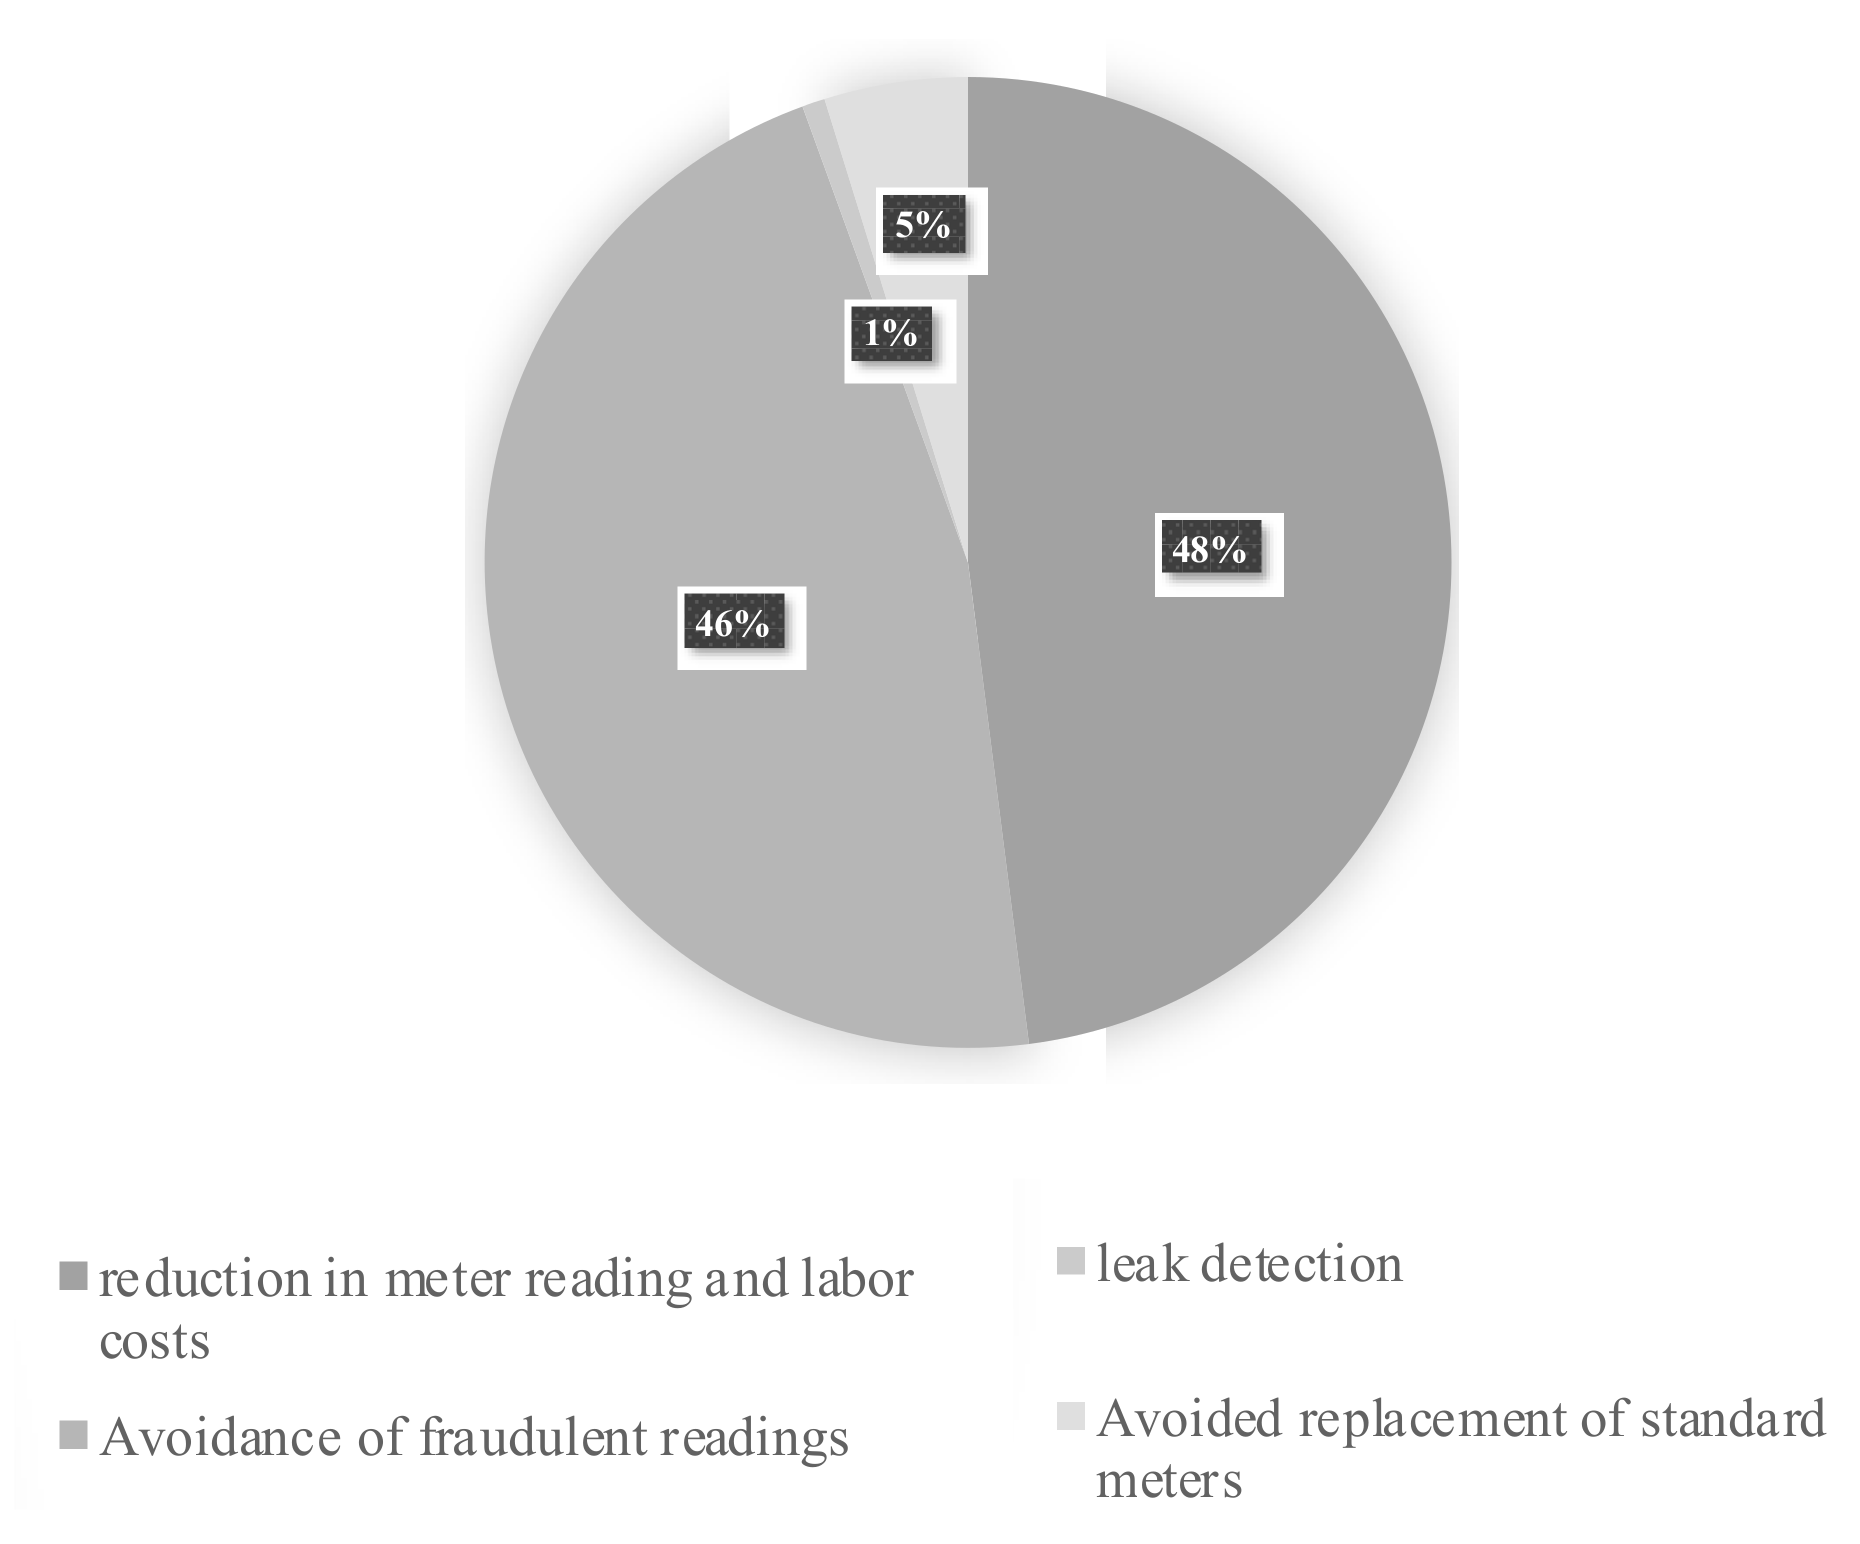
2.4. Water Smart Meter
2.5. In-Home Display with User Interface
2.6. Home Area Network (HAN)
3. Literature Review
3.1. Cost
3.2. Benefits
3.2.1. Quantitative Benefits
3.2.2. Non-Monetary Benefits
4. Methodology
4.1. Net Present Value: A Monte Carlo Simulation Approach
4.2. Data
5. Results
6. Discussion
7. Conclusions
Author Contributions
Funding
Conflicts of Interest
Appendix A

| Author | Subject | Harmonized Costs | ||||
|---|---|---|---|---|---|---|
| Item | Value | Unit | Currency 1 | Years | ||
| Vanshdeep Parmar, 2016 | Micro-generation (Solar System) | Installation of a Solar System (Texas) | 2971.34 | kw | US$ | 2019 |
| Cost for utility | - | - | - | - | ||
| Micro-generation (Solar System) | Installation of a Solar System (California) | 3331.51 | kw | US$ | 2019 | |
| Cost for utility | - | - | - | - | ||
| Micro-generation (Solar System) | Installation of a Solar System (Hawaii) | 3691.67 | kw | US$ | 2019 | |
| Cost for utility | - | - | - | - | ||
| Micro-generation (Hybrid System) | Installation of a Hybrid System (Texas) | 3718.96 | kw | US$ | 2019 | |
| Cost for utility | 39.22 | kw/year | US$ | 2019 | ||
| Micro-generation (Hybrid System) | Installation of a Hybrid System (California) | 4349.63 | kw | US$ | 2019 | |
| Cost for utility | 62.16 | kw/year | US$ | 2019 | ||
| Micro-generation (Hybrid System) | Installation of a Hybrid System (Hawaii) | 5111.71 | kw | US$ | 2019 | |
| Cost for utility | 101.80 | kw/year | US$ | 2019 | ||
| Hancevic et al., 2017 | Micro-generation (Solar System) | Installation of a Solar System | 2104.70 | kw | US$ | 2019 |
| Operation and maintenance | 4.21 | kw/year | US$ | 2019 | ||
| Padmini et al., 2017 | Electricity AMI | Smart meter | 65.05 | meter | US$ | 2019 |
| IT costs | 11.22 | meter | US$ | 2019 | ||
| Operation and maintenance | 3.63 | meter/year | US$ | 2019 | ||
| Ameren Illinois, 2012 | Electricity AMI | Smart meter | 172.59 | meter | US$ | 2019 |
| IT costs | 206.47 | meter | US$ | 2019 | ||
| Operation & management (8 years deployment) | 50.18 | meter | US$ | 2019 | ||
| Operation and maintenance | 23.14 | meter/year | US$ | 2019 | ||
| Ahmad Faruqui et al., 2011 | Electricity AMI | Smart meter and enabling Demand Response/Energy Efficiency technologies (case study 1: Pioneer) | 274.49 | meter | US$ | 2019 |
| Smart meter and enabling Demand Response/Energy Efficiency technologies (case study 2: Committed) | 377.76 | meter | US$ | 2019 | ||
| Smart meter and enabling Demand Response/Energy Efficiency technologies (case study 3: Exploratory) | 308.90 | meter | US$ | 2019 | ||
| Smart meter and enabling Demand Response/Energy Efficiency technologies (case study 4: Cautious) | 357.49 | meter | US$ | 2019 | ||
| Af-Mercados Emi & Institute of Communication & Computer Systems of the National Technical University of Athens ICCS-NTUA, 2015 | Electricity AMI | AM Installation (Portugal) | 86.58 | meter | US$ | 2019 |
| IT & communication (Portugal) | 63.74 | meter | US$ | 2019 | ||
| Customer care (Portugal) | 28.78 | meter | US$ | 2019 | ||
| AM Installation (Flanders) | 595.77 | meter | US$ | 2019 | ||
| IT & communication (Flanders) | 163.07 | meter | US$ | 2019 | ||
| Customer care (Flanders) | 116.48 | meter | US$ | 2019 | ||
| Mark L. Serrano, 2009 | Gas AMI | Gas meter cost | 222.68 | meter | US$ | 2019 |
| Commission for Energy Regulation, 2011 | Gas AMI | Gas meter cost with IHD | 349.73 | meter | US$ | 2019 |
| IT & communication | 45.74 | meter | US$ | 2019 | ||
| Operation & maintenance | 1.99 | meter/year | US$ | 2019 | ||
| Department for business, energy and industrial strategy, 2016 | Gas AMI | cost of equipment | 115.71 | meter | US$ | 2019 |
| installation cost | 136.02 | meter | US$ | 2019 | ||
| Operation & maintenance | 2.90 | meter/year | US$ | 2019 | ||
| U.S. Department of Housing and Urban Development, 2015 | Water AMI | capital cost | 671.83 | meter | US$ | 2019 |
| installation cost | 76.32 | meter | US$ | 2019 | ||
| Operation & maintenance | 2.04 | meter/year | US$ | 2019 | ||
| March et al., 2017 | Water AMI | capital cost | 95.68 | meter | US$ | 2019 |
| Operation & maintenance | 2.99 | meter/year | US$ | 2019 | ||
| Commission for Energy Regulation, 2011 | IHD | IHD cost | 17.62 | unit | US$ | 2019 |
| Department for business, energy and industrial strategy, 2016 | IHD | IHD cost | 30.45 | unit | US$ | 2019 |
| Department for business, energy and industrial strategy, 2016 | Communication hub | Communication hub cost | 62.12 | unit | US$ | 2019 |
| Author | Subject | Harmonized Benefits | ||||
|---|---|---|---|---|---|---|
| Item | Value | Unit | Currency 1 | Years | ||
| Vanshdeep Parmar, 2016 | Micro-generation | Power savings (Texas) | 155.10 | kw/year | US$ | 2019 |
| Environmental impact (Texas) | 10.59 | kw/year | US$ | 2019 | ||
| Micro-generation | Power savings (California) | 245.78 | kw/year | US$ | 2019 | |
| Environmental impact (California) | 18.13 | kw/year | US$ | 2019 | ||
| Micro-generation | Power savings (Hawaii) | 402.48 | kw/year | US$ | 2019 | |
| Environmental impact (Hawaii) | 14.63 | kw/year | US$ | 2019 | ||
| Hancevic et al., 2017 | Micro-generation | Power savings | 288.28 | kw/year | US$ | 2019 |
| Government saving from subsidization | 156.52 | kw/year | US$ | 2019 | ||
| Environmental impact | 12.67 | kw/year | US$ | 2019 | ||
| Padmini et al., 2017 | Electricity AMI | Reduction in meter reading costs | 1.95 | Meter/year | US$ | 2019 |
| Reduction in cost of connection/disconnection | 0.98 | Meter/year | US$ | 2019 | ||
| Faster deduction of dead meters | 0.13 | Meter/year | US$ | 2019 | ||
| Reduction of AT & C losses | 13.01 | Meter/year | US$ | 2019 | ||
| Reduction in data entry cost | 1.46 | Meter/year | US$ | 2019 | ||
| Reduction in peak power purchase cost | 1.73 | Meter/year | US$ | 2019 | ||
| Reduction in distribution transformer failure | 0.33 | Meter/year | US$ | 2019 | ||
| Ameren Illinois, 2012 | Electricity AMI | reduction in meter reading | 24.98 | Meter/year | US$ | 2019 |
| reduction in field & meter services | 22.06 | Meter/year | US$ | 2019 | ||
| theft tamper detection & reduction | 3.76 | Meter/year | US$ | 2019 | ||
| faster identification of dead meters | 0.54 | Meter/year | US$ | 2019 | ||
| efficiency improvement in customer care | 1.57 | Meter/year | US$ | 2019 | ||
| IT cost savings | 0.49 | Meter/year | US$ | 2019 | ||
| improved distribution system spend efficiency | 32.85 | Meter/year | US$ | 2019 | ||
| outage management efficiency | 28.89 | Meter/year | US$ | 2019 | ||
| reduced consumption on inactive meters | 1.46 | Meter/year | US$ | 2019 | ||
| reduced uncollectible/bad debt expense | 6.21 | Meter/year | US$ | 2019 | ||
| demand response | 48.08 | Meter/year | US$ | 2019 | ||
| energy efficiency | 2.79 | Meter/year | US$ | 2019 | ||
| PEV | 17.71 | Meter/year | US$ | 2019 | ||
| carbon reduction | 1.38 | Meter/year | US$ | 2019 | ||
| customer outage reduction benefits | 3.00 | Meter/year | US$ | 2019 | ||
| avoided meter purchases | 24.28 | Meter/year | US$ | 2019 | ||
| Ahmad Faruqui et al., 2011 | Electricity AMI | Avoided meter reading (case study 1: Pioneer) | 6.33 | Meter/year | US$ | 2019 |
| Remote connection and disconnection (case study 1: Pioneer) | 0.15 | Meter/year | US$ | 2019 | ||
| Outage management efficiency (case study 1: Pioneer) | 2.99 | Meter/year | US$ | 2019 | ||
| Demand response (case study 1: Pioneer) | 18.55 | Meter/year | US$ | 2019 | ||
| Avoided meter reading ((case study 2: Committed) | 15.83 | Meter/year | US$ | 2019 | ||
| Remote connection and disconnection (case study 2: Committed) | 0.46 | Meter/year | US$ | 2019 | ||
| Outage management efficiency (case study 2: Committed) | 2.56 | Meter/year | US$ | 2019 | ||
| Demand response (case study 2: Committed) | 17.19 | Meter/year | US$ | 2019 | ||
| Avoided meter reading (case study 3: Exploratory) | 12.67 | Meter/year | US$ | 2019 | ||
| Remote connection and disconnection (case study 3: Exploratory) | 0.30 | Meter/year | US$ | 2019 | ||
| Outage management efficiency (case study 3: Exploratory) | 6.25 | Meter/year | US$ | 2019 | ||
| Demand response (case study 3: Exploratory) | 16.10 | Meter/year | US$ | 2019 | ||
| Avoided meter reading (case study 4: Cautious) | 19.00 | Meter/year | US$ | 2019 | ||
| Remote connection and disconnection (case study 4: Cautious) | 0.61 | Meter/year | US$ | 2019 | ||
| Outage management efficiency (case study 4: Cautious) | 5.95 | Meter/year | US$ | 2019 | ||
| Demand response (case study 4: Cautious) | 12.36 | Meter/year | US$ | 2019 | ||
| Af-Mercados Emi & Institute of Communication & Computer Systems of the National Technical University of Athens ICCS-NTUA, 2015 | Electricity AMI | Reduction in meter reading and meter operations (Portugal) | 49.48 | Meter/year | US$ | 2019 |
| Reduction in technical losses of electricity (Portugal) | 8.09 | Meter/year | US$ | 2019 | ||
| Electricity cost savings (DR) (Portugal) | 126.07 | Meter/year | US$ | 2019 | ||
| Reduction of commercial losses (Portugal) | 40.21 | Meter/year | US$ | 2019 | ||
| Reduction of outage times (Portugal) | 1.66 | Meter/year | US$ | 2019 | ||
| Avoided investment in standard meters (Portugal) | 34.96 | Meter/year | US$ | 2019 | ||
| Reduction in meter reading and meter operations (Flanders) | 249.72 | Meter/year | US$ | 2019 | ||
| Reduction in operational and maintenance costs (Flanders) | 93.19 | Meter/year | US$ | 2019 | ||
| Reduction in technical losses of electricity (Flanders) | 4.66 | Meter/year | US$ | 2019 | ||
| Electricity cost savings (DR) (Flanders) | 167.26 | Meter/year | US$ | 2019 | ||
| Reduction of commercial losses (Flanders) | 93.19 | Meter/year | US$ | 2019 | ||
| Reduction of outage times (Flanders) | 34.95 | Meter/year | US$ | 2019 | ||
| Avoided investment in standard meters (Flanders) | 146.29 | Meter/year | US$ | 2019 | ||
| Mark L. Serrano, 2009 | Gas AMI | Meter Reading | 7.17 | Meter/year | US$ | 2019 |
| Avoided costs form changing conventional meter | 1.72 | Meter/year | US$ | 2019 | ||
| Customer Services Field | 2.50 | Meter/year | US$ | 2019 | ||
| Customer Billing Services | 1.07 | Meter/year | US$ | 2019 | ||
| Customer Contact Center | 0.04 | Meter/year | US$ | 2019 | ||
| Facilities | 0.14 | Meter/year | US$ | 2019 | ||
| Safety | 0.01 | Meter/year | US$ | 2019 | ||
| Human Resources | 0.06 | Meter/year | US$ | 2019 | ||
| Gas Transmission & Distribution Planning | 0.50 | Meter/year | US$ | 2019 | ||
| Theft | 0.02 | Meter/year | US$ | 2019 | ||
| Commission for Energy Regulation, 2011 | Gas AMI | meter reading | 84.80 | Meter/year | US$ | 2019 |
| siteworks savings | 2.20 | Meter/year | US$ | 2019 | ||
| meter exchanges | 1.41 | Meter/year | US$ | 2019 | ||
| prepayment meter exchange and operation savings | 13.27 | Meter/year | US$ | 2019 | ||
| theft gas | 0.58 | Meter/year | US$ | 2019 | ||
| system reinforcement | 2.17 | Meter/year | US$ | 2019 | ||
| Customer services | 3.12 | Meter/year | US$ | 2019 | ||
| reduction in CO2 emissions | 2.47 | Meter/year | US$ | 2019 | ||
| reduction in residential usage | 29.95 | Meter/year | US$ | 2019 | ||
| Department for business, energy and industrial strategy, 2016 | Gas AMI | avoided site visits | 10.00 | Meter/year | US$ | 2019 |
| reduction in customer service overhead | 3.76 | Meter/year | US$ | 2019 | ||
| prepayment exchange cost | 27.35 | Meter/year | US$ | 2019 | ||
| theft gas | 0.62 | Meter/year | US$ | 2019 | ||
| The avoidance of debt | 3.76 | Meter/year | US$ | 2019 | ||
| switching savings | 1.33 | Meter/year | US$ | 2019 | ||
| remote disconnection | 0.85 | Meter/year | US$ | 2019 | ||
| avoided losses | 0.34 | Meter/year | US$ | 2019 | ||
| Energy demand reduction | 30.77 | Meter/year | US$ | 2019 | ||
| U.S. Department of Housing and Urban Development, 2015 | Water AMI | reduction in meter reading and labor costs | 29.93 | Meter/year | US$ | 2019 |
| accurate reading of low water flow | 69.78 | Meter/year | US$ | 2019 | ||
| March et al., 2017 | Water AMI | Avoided replacement of standard meters | 2.99 | Meter/year | US$ | 2019 |
| leak detection | 0.48 | Meter/year | US$ | 2019 | ||
| Avoidance of fraudulent readings | 1.17 | Meter/year | US$ | 2019 | ||
| Commission for Energy Regulation, 2011 | IHD | Gas energy demand reduction | 6.25 | Meter/year | US$ | 2019 |
| Department for business, energy and industrial strategy, 2016 | IHD | Gas energy demand reduction | 12.39 | Meter/year | US$ | 2019 |
| Electricity energy demand reductions | 26.90 | Meter/year | US$ | 2019 | ||
References
- March, H.; Morote, Á.F.; Rico, A.M.; Saurí, D. Household Smart Water Metering in Spain: Insights from the Experience of Remote Meter Reading in Alicante. Sustainability 2017, 9, 582. [Google Scholar] [CrossRef]
- Finger, M. Smart Cities—Management of Smart Urban Infrastructures. 2018. Available online: https://www.coursera.org/learn/smart-cities (accessed on 12 July 2019).
- Nagar, S.; Aneja, S.; Khadilkar, H.; Dechu, S.; Charbiwala, Z. SMOME: A framework for evaluating the costs and benefits of instrumentation in smart home systems. In Proceedings of the 2016 IEEE International Conference on Smart Grid Communications (SmartGridComm), Sydney, Australia, 6–9 November 2016; pp. 134–139. [Google Scholar]
- Joshipura, S. The Payoff and Peril of Smart Infrastructure. Brink—The Edge of Risk. 2019. Available online: https://www.brinknews.com/the-payoff-and-peril-of-smart-infrastructure/ (accessed on 27 May 2019).
- Faruqui, A.; Mitarotonda, D.; Wood, L.; Cooper, A.; Schwartz, J. The Costs and Benefits of Smart Meters for Residential Customers; Institute for Electric Efficiency: Washington, DC, USA, 2011. [Google Scholar]
- Smart Water Metering Cost Benefit Study; Marchment Hill Consulting Pty Ltd.: Melbourne, Victoria, Australia, 2010.
- Karnain, M.A.B.; Zakaria, Z.B. A Review on ZigBee Security Enhancement in Smart Home Environment. In Proceedings of the 2015 2nd International Conference on Information Science and Security (ICISS), Seoul, Korea, 14–16 December 2015; pp. 1–4. [Google Scholar]
- Aljer, A.; Loriot, M.; Shahrour, I.; Benyahya, A. Smart system for social housing monitoring. In Proceedings of the 2017 Sensors Networks Smart and Emerging Technologies (SENSET), Beirut, Lebanon, 12–14 September 2017; pp. 1–4. [Google Scholar]
- Parmar, V. Benefit Cost Analysis of Solar Power Over On-Grid Electricity for Residential System: Is Photovoltaic Technology Really Effective? Ph.D. Thesis, Texas A&M University, College Station, TX, USA, May 2016. [Google Scholar]
- Smart Meter Roll-out Cost-Benefit Analysis; Department for Business, Energy and Industrial Strategy: London, UK, 2016.
- Giordano, V.; Onyeji, I.; Fulli, G.; Jimenez, M.S.; Filiou, C. Guidelines for Conducting a Cost—Benefit Analysis of Smart Grid Projects; Publications Office: Luxembourg, 2012. [Google Scholar]
- Padmini, V.; Omran, S.; Chatterjee, K.; Khaparde, S.A. Cost benefit analysis of smart grid: A case study from India. In Proceedings of the 2017 North American Power Symposium (NAPS), Morgantown, WV, USA; 2017; pp. 1–6. [Google Scholar]
- Commission for Energy Regulation. Cost-Benefit Analysis (CBA) for a National Gas Smart Metering Rollout in Ireland; Tallaght: Dublin, Ireland, 2011. [Google Scholar]
- Study on Cost Benefit Analysis of Smart Metering Systems in EU Member States; Af-Mercados Emi and Institute of Communication & Computer Systems of the National Technical University of Athens ICCS-NTUA: Athens, Greece, 2015.
- Smart Meters and Domestic Water Usage; Foundation for Water Research: Marlow, UK, 2015.
- Advanced Metering Infrastructure (AMI) Cost/Benefit Analysis; Ameren Illinois: St. Louis, MI, USA, 2012.
- Hancevic, P.I.; Nuñez, H.M.; Rosellon, J. Distributed photovoltaic power generation: Possibilities, benefits, and challenges for a widespread application in the Mexican residential sector. Energy Policy 2017, 110, 478–489. [Google Scholar] [CrossRef][Green Version]
- Serrano, M.L. Socalgas AMI Deployment Plan, Costs, and Operational Benefits; Southern California Gas Company: Los Angeles, CA, USA, 2009. [Google Scholar]
- Benefit/Cost Analysis, Smart Water Meter System; U.S. Department of Housing and Urban Development: Washington, DC, USA, 2015.
- Grelle, M.L. Cost Benefit Analysis of Smart Meter Deployment for Residential Customers, a Holistic Approach. Master’s Thesis, Swiss Federal Institute of Technology Zurich, Zurich, Switzerland, August 2016. [Google Scholar]
- California Carbon Dashboard. 2018. Available online: Calcarbondash.org (accessed on 27 May 2019).
- The Energy Prices Analysis team. Quarterly Energy Prices; Department for Business, Energy and Industrial Strategy: Zurich, Switzerland, 2017. [Google Scholar]
- Shaffie, S.S.; Jaaman, S.H. Monte Carlo on Net Present Value for Capital Investment in Malaysia. Procedia Soc. Behav. Sci. 2016, 219, 688–693. [Google Scholar] [CrossRef]
- The OECD. Conversion Rates—Exchange Rates—OECD Data. 2019. Available online: http://data.oecd.org/conversion/exchange-rates.htm (accessed on 26 May 2019).
- Cost-Benefit Analysis and the Environment: Recent Developments; OECD: Paris, France, 2006.
- Guide D’analyse Coûts-Avantages Pour le Canada: Propositions de Réglementation; Secrétariat du Conseil du Trésor du Canada: Ottawa, ON, Canada, 2007.


| Author | Subject | Costs | ||||
|---|---|---|---|---|---|---|
| Item | Value | Unit | Currency | Years | ||
| Vanshdeep Parmar, 2016 | Micro-generation (Solar System) | Installation of a Solar System (Texas) | 33,000 | 12.5 kw | US$ | 2015 |
| Micro-generation (Solar System) | Installation of a Solar System (California) | 37,000 | 12.5 kw | US$ | 2015 | |
| Micro-generation (Solar System) | Installation of a Solar System (Hawaii) | 41,000 | 12.5 kw | US$ | 2015 | |
| Micro-generation (Hybrid System) | Installation of a Hybrid System (Texas) | 30,300 | 10 kw | US$ | 2015 | |
| Micro-generation (Hybrid System) | Installation of a Hybrid System (California) | 34,300 | 10 kw | US$ | 2015 | |
| Micro-generation (Hybrid System) | Installation of a Hybrid System (Hawaii) | 38,300 | 10 kw | US$ | 2015 | |
| Hancevic et al., 2017 | Micro-generation (Solar System) | Installation of a Solar System | 1870 | kw | US$ | 2015 |
| Operation and maintenance | 3.74 | kw/year | US$ | 2015 | ||
| Padmini et al., 2017 | Electricity AMI | Smart meter | 4000 | meter | INR | 2016 |
| IT costs | 690, 000,000 | M. meters | INR | 2016 | ||
| Operation and maintenance | 223,250,000 | M. meters/year | INR | 2016 | ||
| Ameren Illinois, 2012 | Electricity AMI | Smart meter | 109,517,049 | 780,419 m | US$ | 2012 |
| IT costs | 131,012,913 | 780,419 m | US$ | 2012 | ||
| Operation and management (8 years deployment) | 31,842,433 | 780,419 m | US$ | 2012 | ||
| Operation and maintenance | 293,724,053 | 780,419 m (20 years) | US$ | 2012 | ||
| Ahmad Faruqui et al., 2011 | Electricity AMI | Smart meter and enabling Demand Response/Energy Efficiency technologies (case study 1: Pioneer) | 197,774,979 1 | M. meters | US$ | 2011 |
| Smart meter and enabling Demand Response/Energy Efficiency technologies (case study 2: Committed) | 272,188,433 1 | M. meters | US$ | 2011 | ||
| Smart meter and enabling Demand Response/Energy Efficiency technologies (case study 3: Exploratory) | 222,571,202 1 | M. meters | US$ | 2011 | ||
| Smart meter and enabling Demand Response/Energy Efficiency technologies (case study 4: Cautious) | 257,578,845 1 | M. meters | US$ | 2011 | ||
| Af-Mercados Emi & Institute of Communication & Computer Systems of the National Technical University of Athens ICCS-NTUA, 2015 | Electricity AMI | AM Installation (Portugal) | 56.31 | meter | € | 2014 |
| IT & communication (Portugal) | 41.46 | meter | € | 2014 | ||
| Customer care (Portugal) | 18.72 | meter | € | 2014 | ||
| AM Installation (Flanders) | 387.49 | meter | € | 2014 | ||
| IT & communication (Flanders) | 106.06 | meter | € | 2014 | ||
| Customer care (Flanders) | 75.76 | meter | € | 2014 | ||
| Mark L. Serrano, 2009 | Gas AMI | Gas meter cost | 965,200,000 | 6 M. meters | US$ | 2008 |
| Commission for Energy Regulation, 2011 | Gas AMI | Gas meter cost with IHD | 198.5 | meter | € | 2011 |
| IT & communication | 25.96 | meter | € | 2011 | ||
| Operation & maintenance | 1.13 | meter/year | € | 2011 | ||
| Department for business, energy and industrial strategy, 2016 | Gas AMI | cost of equipment | 57 | meter | £ | 2011 |
| installation cost | 67 | meter | £ | 2011 | ||
| Operation & maintenance | 1.43 | meter/year | £ | 2011 | ||
| U.S. Department of Housing and Urban Development, 2015 | Water AMI | capital cost | 17,012,000 | 28,500 m | US$ | 2015 |
| installation cost | 1,932,500 | 28,500 m | US$ | 2015 | ||
| Operation & maintenance | 1,031,703 | 28,500 m (20 years) | US$ | 2015 | ||
| March et al., 2017 | Water AMI | capital cost | 80 | meter | € | 2017 |
| Operation & maintenance | 2.5 | meter/year | € | 2017 | ||
| Commission for Energy Regulation, 2011 | IHD | IHD cost | 10 | Unit | € | 2011 |
| Department for business, energy and industrial strategy, 2016 | IHD | IHD cost | 15 | Unit | £ | 2011 |
| Department for business, energy and industrial strategy, 2016 | Communication hub | Communication hub cost | 30.6 | Unit | £ | 2011 |
| Author | Subject | Benefits | ||||
|---|---|---|---|---|---|---|
| Item | Value | Unit | Currency | Years | ||
| Vanshdeep Parmar, 2016 | Micro-generation (Solar System) | Power savings (Texas) | 1722.47 | 12.5 kw/year | US$ | 2015 |
| Environmental impact (Texas) | 18,107.7 1 | lbs/year | - | 2015 | ||
| Micro-generation (Solar System) | Power savings (California) | 2,729.62 | 12.5 kw/year | US$ | 2015 | |
| Environmental impact (California) | 30,977.66 1 | lbs/year | - | 2015 | ||
| Micro-generation (Solar System) | Power savings (Hawaii) | 4470.05 | 12.5 kw/year | US$ | 2015 | |
| Environmental impact (Hawaii) | 24,991.6 1 | lbs/year | - | 2015 | ||
| Micro-generation (Hybrid System) | Power savings (Texas) | 1377.98 | 10 kw/year | US$ | 2015 | |
| Environmental impact (Texas) | 14,486.1 1 | lbs/year | - | 2015 | ||
| Micro-generation (Hybrid System) | Power savings (California) | 2183.69 | 10 kw/year | US$ | 2015 | |
| Environmental impact (California) | 24,782.00 1 | lbs/year | - | 2015 | ||
| Micro-generation (Hybrid System) | Power savings (Hawaii) | 3576.04 | 10 kw/year | US$ | 2015 | |
| Environmental impact (Hawaii) | 19,993.2 1 | lbs/year | - | 2015 | ||
| Hancevic et al., 2017 | Micro-generation (Solar System) | Power savings | 0.16 | US$/kwh | US$ | 2015 2 |
| Government saving from subsidization | 1.6 billion | US$/year | US$ | 2015 2 | ||
| Environmental impact | 192 million | US$/year | US$ | 2015 2 | ||
| Padmini et al., 2017 | Electricity AMI | Reduction in meter reading costs | 120,000,000 | M./year | INR | 2016 |
| Reduction in cost of connection/disconnection | 60,000,000 | M./year | INR | 2016 | ||
| Faster deduction of dead meters | 8,000,000 | M./year | INR | 2016 | ||
| Reduction of AT & C losses | 799,998,000 | M./year | INR | 2016 | ||
| Reduction in data entry cost | 90,000,000 | M./year | INR | 2016 | ||
| Reduction in peak power purchase cost | 106,666,000 | M./year | INR | 2016 | ||
| Reduction in distribution transformer failure | 20,000,000 | M./year | INR | 2016 | ||
| Ameren Illinois, 2012 | Electricity AMI | Reduction in meter reading | 237,814,522 | 780,419 m (20 years) | US$ | 2012 |
| Reduction in field & meter services | 209,138,191 | 780,419 m (20 years) | US$ | 2012 | ||
| Theft tamper detection & reduction | 35,522,376 | 780,419 m (20 years) | US$ | 2012 | ||
| Faster identification of dead meters | 5,127,494 | 780,419 m (20 years) | US$ | 2012 | ||
| Efficiency improvement in customer care | 14,589,258 | 780,419 m (20 years) | US$ | 2012 | ||
| IT cost savings | 5,135,593 | 780,419 m (20 years) | US$ | 2012 | ||
| Improved distribution system spend efficiency | 27,076,479 | 780,419 m (20 years) | US$ | 2012 | ||
| Outage management efficiency | 31,789,315 | 780,419 m (20 years) | US$ | 2012 | ||
| Reduced consumption on inactive meters | 16,532,798 | 780,419 m (20 years) | US$ | 2012 | ||
| Reduced uncollectible/bad debt expense | 59,115,015 | 780,419 m (20 years) | US$ | 2012 | ||
| Demand response | 405,776,029 | 780,419 m (20 years) | US$ | 2012 | ||
| Energy efficiency | 23,740,538 | 780,419 m (20 years) | US$ | 2012 | ||
| PEV | 150,676,076 | 780,419 m (20 years) | US$ | 2012 | ||
| Carbon reduction | 11,392,210 | 780,419 m (20 years) | US$ | 2012 | ||
| Customer outage reduction benefits | 27,952,082 | 780,419 m (20 years) | US$ | 2012 | ||
| Avoided meter purchases | 15,404,293 | 780,419 m (20 years) | US$ | 2012 | ||
| Ahmad Faruqui et al., 2011 | Electricity AMI | Avoided meter reading (case study 1: Pioneer) | 51,453,162 3 | M. meters (20 years) | US$ | 2012 |
| Remote connection and disconnection (case study 1: Pioneer) | 1,234,876 3 | M. meters (20 years) | US$ | 2012 | ||
| Outage management efficiency (case study 1: Pioneer) | 24,259,229 3 | M. meters (20 years) | US$ | 2012 | ||
| Demand response (case study 1: Pioneer) | 150,330,260 3 | M. meters (20 years) | US$ | 2012 | ||
| Avoided meter reading ((case study 2: Committed) | 128,632,904 3 | M. meters (20 years) | US$ | 2012 | ||
| Remote connection and disconnection (case study 2: Committed) | 3,704,628 3 | M. meters (20 years) | US$ | 2012 | ||
| Outage management efficiency (case study 2: Committed) | 20,757,821 3 | M. meters (20 years) | US$ | 2012 | ||
| Demand response (case study 2: Committed) | 139,580,561 3 | M. meters (20 years) | US$ | 2012 | ||
| Avoided meter reading (case study 3: Exploratory) | 102,906,323 3 | M. meters (20 years) | US$ | 2012 | ||
| Remote connection and disconnection (case study 3: Exploratory) | 2,469,752 3 | M. meters (20 years) | US$ | 2012 | ||
| Outage management efficiency (case study 3: Exploratory) | 50,721,203 3 | M. meters (20 years) | US$ | 2012 | ||
| Demand response (case study 3: Exploratory) | 130,770,355 3 | M. meters (20 years) | US$ | 2012 | ||
| Avoided meter reading (case study 4: Cautious) | 154,359,485 3 | M. meters (20 years) | US$ | 2012 | ||
| Remote connection and disconnection (case study 4: Cautious) | 4,939,504 3 | M. meters (20 years) | US$ | 2012 | ||
| Outage management efficiency (case study 4: Cautious) | 48,315,562 3 | M. meters (20 years) | US$ | 2012 | ||
| Demand response (case study 4: Cautious) | 100,366,244 3 | M. meters (20 years) | US$ | 2012 | ||
| Af-Mercados Emi & Institute of Communication & Computer Systems of the National Technical University of Athens ICCS-NTUA, 2015 | Electricity AMI | Reduction in meter reading and meter operations (Portugal) | 32.18 | Avg meter/year | € | 2014 |
| Reduction in technical losses of electricity (Portugal) | 5.26 | Avg meter/year | € | 2014 | ||
| Electricity cost savings (DR) (Portugal) | 82 | Avg meter/year | € | 2014 | ||
| Reduction of commercial losses (Portugal) | 26.15 | Avg meter/year | € | 2014 | ||
| Reduction of outage times (Portugal) | 1.08 | Avg meter/year | € | 2014 | ||
| Avoided investment in standard meters (Portugal) | 22.74 | Avg meter/year | € | 2014 | ||
| Reduction in meter reading and meter operations (Flanders) | 162.42 | Avg meter/year | € | 2014 | ||
| Reduction in operational and maintenance costs (Flanders) | 60.61 | Avg meter/year | € | 2014 | ||
| Reduction in technical losses of electricity (Flanders) | 3.03 | Avg meter/year | € | 2014 | ||
| Electricity cost savings (DR) (Flanders) | 108.79 | Avg meter/year | € | 2014 | ||
| Reduction of commercial losses (Flanders) | 60.61 | Avg meter/year | € | 2014 | ||
| Reduction of outage times (Flanders) | 22.73 | Avg meter/year | € | 2014 | ||
| Avoided investment in standard meters (Flanders) | 95.15 | Avg meter/year | € | 2014 | ||
| Mark L. Serrano, 2009 | Gas AMI | Meter Reading | 777,500,000 | 6 M. meters (25 years) | US$ | 2008 |
| Avoided costs form changing conventional meter | 185,900,000 | 6 M. meters (25 years) | US$ | 2008 | ||
| Customer Services Field | 270,500,000 | 6 M. meters (25 years) | US$ | 2008 | ||
| Customer Billing Services | 116,400,000 | 6 M. meters (25 years) | US$ | 2008 | ||
| Customer Contact Center | 4,800,000 | 6 M. meters (25 years) | US$ | 2008 | ||
| Facilities | 15,000,000 | 6 M. meters (25 years) | US$ | 2008 | ||
| Safety | 1,400,000 | 6 M. meters (25 years) | US$ | 2008 | ||
| Human Resources | 6,100,000 | 6 M. meters (25 years) | US$ | 2008 | ||
| Gas Transmission & Distribution Planning | 53,900,000 | 6 M. meters (25 years) | US$ | 2008 | ||
| Theft | 2,400,000 | 6 M. meters (25 years) | US$ | 2008 | ||
| Commission for Energy Regulation, 2011 | Gas AMI | meter reading | 48.13 | Per meter/year | € | 2011 |
| siteworks savings | 1.25 | Per meter/year | € | 2011 | ||
| meter exchanges | 0.8 | Per meter/year | € | 2011 | ||
| prepayment meter exchange and operation savings | 7.53 | Per meter/year | € | 2011 | ||
| theft gas | 0.33 | Per meter/year | € | 2011 | ||
| system reinforcement | 1.23 | Per meter/year | € | 2011 | ||
| Customer services | 1.77 | Per meter/year | € | 2011 | ||
| reduction in CO2 emissions | 1.4 | Per meter/year | € | 2011 | ||
| reduction in residential usage | 17 | Per meter/year | € | 2011 | ||
| Department for business, energy and industrial strategy, 2016 | Gas AMI | avoided site visits | 5.85 | Per meter/year | £ | 2016 |
| reduction in customer service overhead | 2.2 | Per meter/year | £ | 2016 | ||
| prepayment exchange cost | 16 | Per meter/year | £ | 2016 | ||
| theft gas | 0.36 | Per meter/year | £ | 2016 | ||
| The avoidance of debt | 2.2 | Per meter/year | £ | 2016 | ||
| switching savings | 0.78 | Per meter/year | £ | 2016 | ||
| remote disconnection | 0.5 | Per meter/year | £ | 2016 | ||
| avoided losses | 0.2 | Per meter/year | £ | 2016 | ||
| Energy demand reduction | 18 | Per meter/year | £ | 2016 | ||
| U.S. Department of Housing and Urban Development, 2015 | Water AMI | reduction in meter reading and labor costs | 15,156,537 | 28,500 m (20 years) | US$ | 2015 |
| accurate reading of low water flow | 35,341,835 | 28,500 m (20 years) | US$ | 2015 | ||
| March et al., 2017 | Water AMI | Avoided replacement of standard meters | 5,000,000 | In 10 years | € | 2017 |
| leak detection | 80,000 | 200,000 per year | € | 2017 | ||
| Avoidance of fraudulent readings | 180,000–210,000 | 200,000 per year | € | 2017 | ||
| Commission for Energy Regulation, 2011 | IHD | Gas energy demand reduction | 3.55 | Per unit/year | € | 2011 |
| Department for business, energy and industrial strategy, 2016 | IHD | Gas energy demand reduction | 8.4 4 | Per unit/year | £ | 2016 |
| Electricity energy demand reduction | 18.24 5 | Per unit/year | £ | 2016 | ||
| Subjects | Item | Unit | Maximum | Minimum |
|---|---|---|---|---|
| Costs | ||||
| Micro-generation Solar System | Installation | US$/KW | 3691.67 | 2104.70 |
| Operation & maintenance | US$/KW/year | 5.05 | 3.37 | |
| Micro-generation Hybrid System | Installation | US$/KW | 5231.51 | 3758.18 |
| Operation & maintenance | US$/KW/year | 5.05 | 3.37 | |
| Electricity AMI | Installation | US$/KW | 875.32 | 76.27 |
| Operation & maintenance | US$/KW/year | 23.14 | 3.63 | |
| Gas AMI | Installation | US$/KW | 395.47 | 222.68 |
| Operation & maintenance | US$/KW/year | 2.9 | 1.99 | |
| water AMI | Installation | US$/KW | 748.15 | 95.68 |
| Operation & maintenance | US$/KW/year | 2.99 | 2.04 | |
| IHD | Installation | US$/KW | 30.45 | 17.62 |
| Benefits | ||||
| Micro-generation Solar System | Power savings | US$/KW/year | 402.48 | 155.1 |
| Government saving from subsidization | US$/KW/year | 187.82 | 125.22 | |
| Environmental impact | US$/KW/year | 18.13 | 10.59 | |
| Micro-generation Hybrid System | Power savings | US$/KW/year | 402.48 | 155.1 |
| Government saving from subsidization | US$/KW/year | 187.82 | 125.22 | |
| Environmental impact | US$/KW/year | 18.13 | 10.59 | |
| Electricity AMI | Reduction in meter reading & meter operations | US$/KW/year | 342.91 | 4.39 |
| Faster deduction of dead meters, theft, uncollectible expenses | US$/KW/year | 11.97 | 0.13 | |
| Reduction of technical, Commercial losses & transformer failure | US$/KW/year | 97.85 | 13.34 | |
| Demand response | US$/KW/year | 167.26 | 1.73 | |
| Outage management efficiency | US$/KW/year | 34.95 | 1.66 | |
| Avoided investment in standard meters | US$/KW/year | 146.29 | 24.77 | |
| Carbon reduction | US$/KW/year | 1.66 | 1.10 | |
| Gas AMI | Avoided meter readings | US$/KW/year | 84.8 | 7.23 |
| Meter exchanges | US$/KW/year | 27.34 | 1.72 | |
| Site works savings | US$/KW/year | 2.65 | 0.85 | |
| Reduction in customer services | US$/KW/year | 5.09 | 1.11 | |
| Gas Transmission & Distribution Planning | US$/KW/year | 2.17 | 0.34 | |
| Theft gas | US$/KW/year | 0.62 | 0.02 | |
| Energy demand reduction | US$/KW/year | 34.53 | 29.95 | |
| Reduction in CO2 emissions | US$/KW/year | 2.96 | 1.98 | |
| water AMI | Reduction in meter reading and labor costs | US$/KW/year | 35.92 | 23.94 |
| Avoidance of fraudulent readings | US$/KW/year | 69.78 | 1.17 | |
| Leak detection | US$/KW/year | 0.58 | 0.38 | |
| Avoided replacement of standard meters | US$/KW/year | 3.59 | 2.39 | |
| IHD | Gas energy demand reduction | US$/KW/year | 12.39 | 6.25 |
| Electricity energy demand reductions | US$/KW/year | 32.28 | 21.52 | |
| NPV for Distributed Solar Generation (Solar System) | ||||
| Mean | Min | Max | % of NPV > 0 | Benefits/costs |
| 2386.46 | −437.22 | 6302.81 | 98.70% | 1.85 |
| NPV for Distributed solar generation (Hybrid System) | ||||
| Mean | Min | Max | % of NPV > 0 | Benefits/costs |
| 790.94 | −1994.19 | 4649.82 | 70.70% | 1.18 |
| NPV for Electricity smart meter | ||||
| Mean | Min | Max | % of NPV > 0 | Benefits/costs |
| 4376.76 | −481.79 | 10,879.34 | 98.20% | 10.89 |
| NPV for Gas smart meter | ||||
| Mean | Min | Max | % of NPV > 0 | Benefits/costs |
| 866.44 | 58.96 | 1962.31 | 100% | 3.64 |
| NPV for Water smart meter | ||||
| Mean | Min | Max | % of NPV > 0 | Benefits/costs |
| 358.5 | −420.68 | 1391.58 | 84.50% | 2.28 |
| NPV for In-home-display (IHD) | ||||
| Mean | Min | Max | % of NPV > 0 | Benefits/costs |
| 407.51 | 247.18 | 607.06 | 100% | 18.31 |
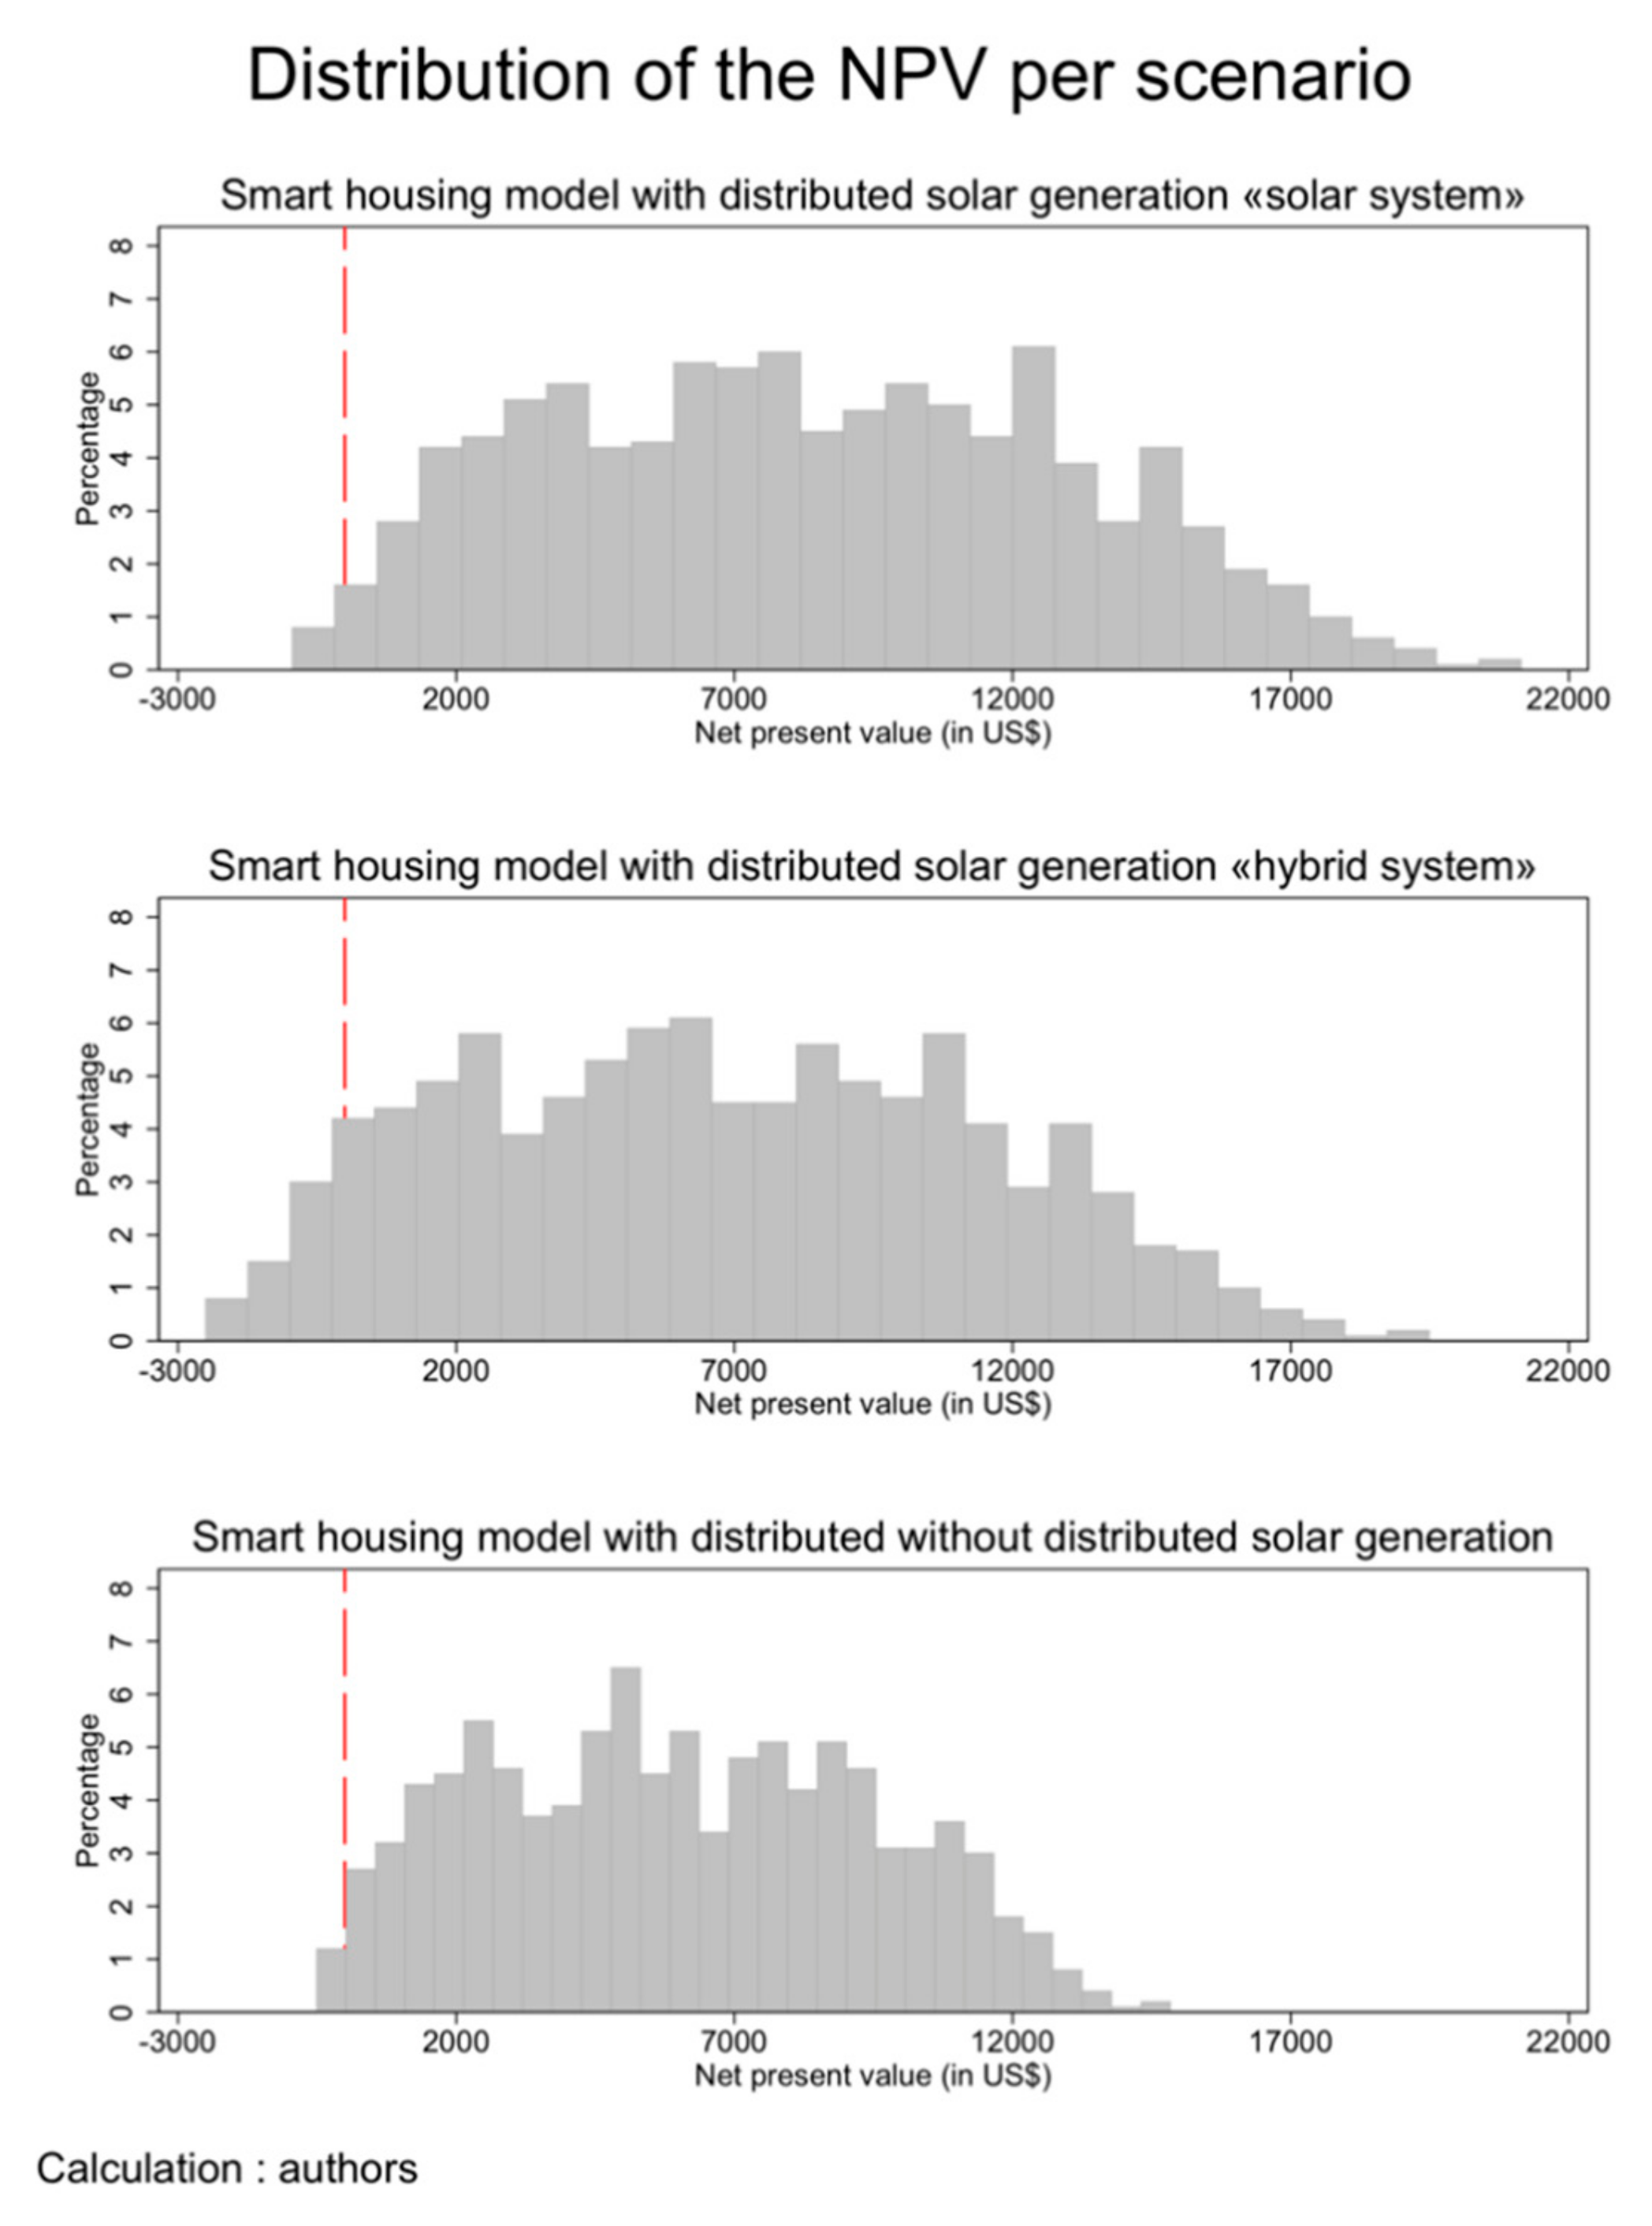
| Scenario 1: Net Present Value for smart housing model with distributed solar generation (solar system) | ||||
| Mean | Min | Max | % of NPV > 0 | Benefits/costs |
| 8395.67 | −946.26 | 21,142.19 | 99% | 3.07 |
| Scenario 2: Net Present Value for smart housing model with distributed solar generation (Hybrid system) | ||||
| Mean | Min | Max | % of NPV > 0 | Benefits/costs |
| 6800.15 | −2503.23 | 19,489.2 | 93.70% | 2.19 |
| Scenario 3: Net Present Value for smart housing model without distributed solar generation | ||||
| Mean | Min | Max | % of NPV > 0 | Benefits/costs |
| 6009.207 | −509.0402 | 14,839.38 | 98.80% | 6.09 |
© 2019 by the authors. Licensee MDPI, Basel, Switzerland. This article is an open access article distributed under the terms and conditions of the Creative Commons Attribution (CC BY) license (http://creativecommons.org/licenses/by/4.0/).
Share and Cite
Elariane, S.A.; Dubé, J. Is Smart Housing a Good Deal? An Answer Based on Monte Carlo Net Present Value Analysis. Sustainability 2019, 11, 4193. https://doi.org/10.3390/su11154193
Elariane SA, Dubé J. Is Smart Housing a Good Deal? An Answer Based on Monte Carlo Net Present Value Analysis. Sustainability. 2019; 11(15):4193. https://doi.org/10.3390/su11154193
Chicago/Turabian StyleElariane, Sarah A., and Jean Dubé. 2019. "Is Smart Housing a Good Deal? An Answer Based on Monte Carlo Net Present Value Analysis" Sustainability 11, no. 15: 4193. https://doi.org/10.3390/su11154193
APA StyleElariane, S. A., & Dubé, J. (2019). Is Smart Housing a Good Deal? An Answer Based on Monte Carlo Net Present Value Analysis. Sustainability, 11(15), 4193. https://doi.org/10.3390/su11154193