Article

An Assessment of the Impact of Spatial Agglomeration on the Quality of China’s Wood Processing Industry Products

1
School of Economics and Management, Beijing Forestry University, Beijing 100083, China
2
Institutes of Science and Development, Chinese Academy of Sciences, Beijing 100190, China
3
School of Public Policy and Management, University of Chinese Academy of Sciences, Beijing 100049, China
*
Authors to whom correspondence should be addressed.
Sustainability 2019, 11(14), 3961; https://doi.org/10.3390/su11143961
Submission received: 24 May 2019 / Revised: 7 July 2019 / Accepted: 19 July 2019 / Published: 21 July 2019

Abstract

:
The influence of industrial agglomeration on corporate export behavior has been widely studied by both industry and academia. However, few studies have explored the impact of the spatial agglomeration of China’s wood processing industry on the quality of its products at the micro level. In this study, we analyzed data from the China Customs Database to determine the quality of wood processing industry products at the enterprise level. Then, we matched the China Customs Database with the data in the China Industrial Enterprise Database. Based on this, we analyzed the impact of the spatial agglomeration on the quality of wood products using panel data regression. According to our results, spatial agglomeration of the wood processing industry can significantly improve product quality. Also, private enterprises are more likely to benefit from the advantages conferred by agglomeration than state-owned enterprises. Moreover, trade method does not significantly modulate the effect of spatial agglomeration on the quality of wood products. Last but not least, the agglomeration has the most significantly positive impact on the quality of products produced by the wood chip processing industry, followed by the wood products industry and the wood panel industry. Agglomeration of the bamboo and rattan palm industry actually decreases product quality. Therefore, we encourage agglomeration of timber processing enterprises, especially privately owned wood chip, wood product, and wood panel enterprises, to fully realize the benefits of the agglomeration economy. We also make policy recommendations to improve wood product quality.

1. Introduction

The external effect of industrial agglomeration is an essential factor in the product quality and core competitiveness of wood processing enterprises. The export volume of China’s wood processing industry products accounted for approximately 20% of the total exports forest products from 2000 to 2013, and its international market share has also increased rapidly. Although Chinese wood processing enterprises are well represented in global value chains, they often rely excessively on international production networks, mainly those associated with original equipment manufacturer (OEM) production, and thus lack technological innovation and brand leadership. Hence, the low-quality of export wood processing products has become a significant problem [1]. The “low price and high quantity” export growth mode also means that Chinese wood processing enterprises are threatened by “low-end lock in the value chain” [2]. Therefore, to improve the international competitiveness of China’s wood processing industry, a shift from the traditional price competition to the competition of quality is urgently needed [3]. As for industrial distribution, there are five major wood panel industry clusters in China, namely Linyi city of Shandong province, Wen’an city of Hebei province, Zhangzhou city of Jiangsu province, Jiashan city of Zhejiang province, and Guangxi province [1]. There are also three major paper industry clusters in China, namely Shandong province, Jiangsu and Zhejiang province, and Guangdong province. Appendix A Figure A1 compares the spatial distributions of China’s wood processing industry in 2000 and 2013. We found that the level of spatial agglomeration of China’s wood processing industry has been deepening throughout the 2000–2013 period. Although wood processing enterprises are mainly small-scaled, their degree of agglomeration has exceeded the average level of China’s manufacturing industry, which has had a significant effect on the scale economy [4,5]. Numerous studies have shown that the effects on the scale economy and vertical economy of this spatial agglomeration could drive improvements in the quality of export products [6,7,8]. Although numerous studies have examined the relationship between industrial agglomeration and corporate export behavior from the perspective of total factor productivity (TFP), fixed cost efficiency, and transaction cost, few scholars have explored the impact of the agglomeration of the wood processing industry on the quality of export products [9]. Some scholars have suggested that the excessive competition caused by industrial agglomeration is a barrier to improve enterprise and fixed cost efficiency [10,11]. Most scholars believe that the large labor pools, intermediate input sharing, and knowledge spillover, when associated with industrial agglomeration, can bolster the productivity and investment efficiency of enterprises [12,13]. In terms of the impact mechanism, knowledge or technology spillover due to industrial agglomeration could stimulate technological innovations and improve productivity [14,15,16,17]. Moreover, industrial agglomeration can reduce transaction costs, including the information collection, adjustment, regulatory, and transportation costs associated with information asymmetry, thus allowing enterprises to invest more capital in improving of their products [18,19]. Spatial agglomeration also gives rise to product imitation due to information sharing. This may improve the efficiency of fixed cost investment, thus investing more upgrading the quality of export products [20,21,22,23]. From the perspective of the heterogeneity of enterprises, the influence of industrial agglomeration on the quality of export products varies by the geographic locations, ownership behaviors, and trade patterns of a given company [24,25,26].
China is currently experiencing a critical period of forestry reform that aims at improving product quality. Contemporary research about the agglomeration of the wood processing industry is particularly important. The Central Economic Work Conference proposed supply-side structural reforms in 2017, aimed at improving the quality and supply of products. Product quality reflects the core competitiveness of the company [27]. Chinese wood processing enterprises should reduce their dependence on foreign resources and markets, and instead exploit the localized production system fostered by domestic industrial agglomeration, to increase the quality of their export products. By fully utilizing the agglomeration economy, a steady improvement in the quality of export products should be achievable. As well as being of great practical significance to China’s wood processing industry, this will also contribute to the global value chain.
Based on the above, the most important issue is whether there is any relationship between the level of spatial agglomeration of China’s wood processing industry and the quality of its export products. Because of this, we evaluated the spatial agglomeration of China’s wood processing industry and the quality of its export products at the micro level. We then carried out an empirical analysis of the impact of spatial agglomeration on the quality of wood processing industry export products. Micro data were used to determine the level of spatial agglomeration of the wood processing industry between 2000 and 2013. We evaluated the quality of wood processing products based on the demand side, which was proposed by Khandelwal et al. [28]. Panel data regression was used to empirically analyze the impact of spatial agglomeration on the quality of wood processing industry products according to different enterprise types, trade patterns, and three-digit industries. We also assessed the impact of forest certification systems operated in import countries on our regression results.
This paper was organized as follows. The introduction and literature review were presented in the first section; the theoretical mechanism of wood processing industry agglomeration and product quality was described in the second section; an empirical analysis of agglomeration and product quality was provided in the third section; we discussed our results in the fourth section; and finally, we described our conclusions and the implications of this study in the fifth section.

2. Theoretical Mechanism

2.1. Theoretical Framework

Product quality refers to the comprehensive characteristics of products that meet potential requirements and regulations, is a concrete manifestation of use value, and expresses the good or bad of products [29]. According to Khandelwal et al. [28], Shi Bingzhan [30], and Yu Yujie and Zhang Rui [31], the following theoretical analysis can be carried out on wood processing product quality. From a demand perspective, the utility of wood products depends both on the quantity and quality of the product. Suppose the consumer’s utility function, U, is in the form of a constant elasticity of substitution (CES):
U = [ j N j t ( λ j q j ) σ 1 σ ] σ σ 1 ,   σ > 1 .
λj and qj are, respectively, the quality and quantity of wood product j. Under budget constraints, the optimal consumption of product j can be obtained by utility maximization:
q = p j σ λ j σ 1 E P = p j σ λ j σ 1 E j p j 1 σ λ j σ 1
where E is consumer spending and P = P = j p j 1 σ λ j σ 1 is the price index.
Wood processing companies’ production costs include fixed and variable costs:
MC   ( λ ,   φ ) = c φ φ β ,   F   ( λ ,   ξ ) = F 0 + f ξ φ α
where MC is the marginal variable cost, F is the fixed cost, φ and ξ are enterprise productivity and fixed cost efficiency, respectively, c and f are the variable and fixed input prices, respectively, and β and α are the quality elasticity of variable and fixed costs, respectively.
According to Equations (2) and (3), the optimal export product quality is achieved by profit maximization:
Λ ( φ ,   ξ ) = [ 1 β α ( σ 1 σ ) σ ( φ c ) σ 1 ξ f E P ] 1 ρ ρ = α ( 1 β ) ( σ 1 ) > 0 ,   0 < β > 1 ,   α > ρ .
Like Khandelwal [32] and Hallak and Schott [33], this method infers the quality of wood processing products from the demand side, and assumes that quality is any attribute that raises consumer demand other than price [28]. According to Aw and Roberts [34] and Harrigan and Barrows [35], Khandelwal et al. [28] ignored potential price variation across firms due to markups, by assuming a constant-elasticity-of-substitution demand system. According to Equation (4), the quality of wood processing industry export products is affected by productivity, input efficiency, and demand.
λ ( φ ,   ξ ) φ > 0 ,   λ ( φ ,   ξ ) ξ > 0
Wood processing companies can take measures to improve their productivity and efficiency, thereby improving the quality of their products. However, the degree of improvement may be constrained by the level of demand for products.

2.2. Mechanism

Although the international market share of China’s wood panels has exceeded 20%, due to multiple factors such as a scarcity of raw materials and the international division of labor, the problem of the low-quality of Chinese wood-processing products has always existed. For instance, the California Air Resources Board (CARB) issued policy to reduce formaldehyde emissions from composite wood products in 2008. The impact of this new policy on China’s wood flooring foreign trade business was very serious. What’s more, in 2017, the Formaldehyde Standards for Composite Wood Act was issued by Federal Register. Many of China’s wood processing enterprises suffered a lot. Recently, the rise of quality of China’s wood processing products has become more and more slow (see Appendix A, Figure A2). Thus, to maintain and promote the growth of China’s wood processing industry, a rapid transition from the model with low-price competition and small profits, to one of innovation and higher-quality of products, is needed.
The quality of wood processing products is affected by the productivity and efficiency of wood processing enterprises. Therefore, it is essential to identify the factors that can improve productivity and efficiency.
The advantages of spatial agglomeration include large labor pools, intermediate input sharing, and knowledge and technology spillover [12]. Studies have shown that spatial agglomeration can directly promote the production efficiency of enterprises [36] to improve the quality of export products. Spatial agglomeration can improve production methods through promoting innovation, thus increasing productivity and the quality of export products [37]. Spatial agglomeration may also play a role in information sharing and, to some extent, the likelihood of product imitation [20]. Such effects would reduce the fixed costs involved when improving the quality of export products [21,22,23]. Furthermore, when situated in close proximity to each other, enterprises can share local infrastructure to reduce cost, such as transportation cost [38], ultimately improving the quality of export products. Therefore, we hypothesize that spatial agglomeration of China’s wood processing industry will significantly improve the quality of its products.

3. Modeling Process

3.1. Variables

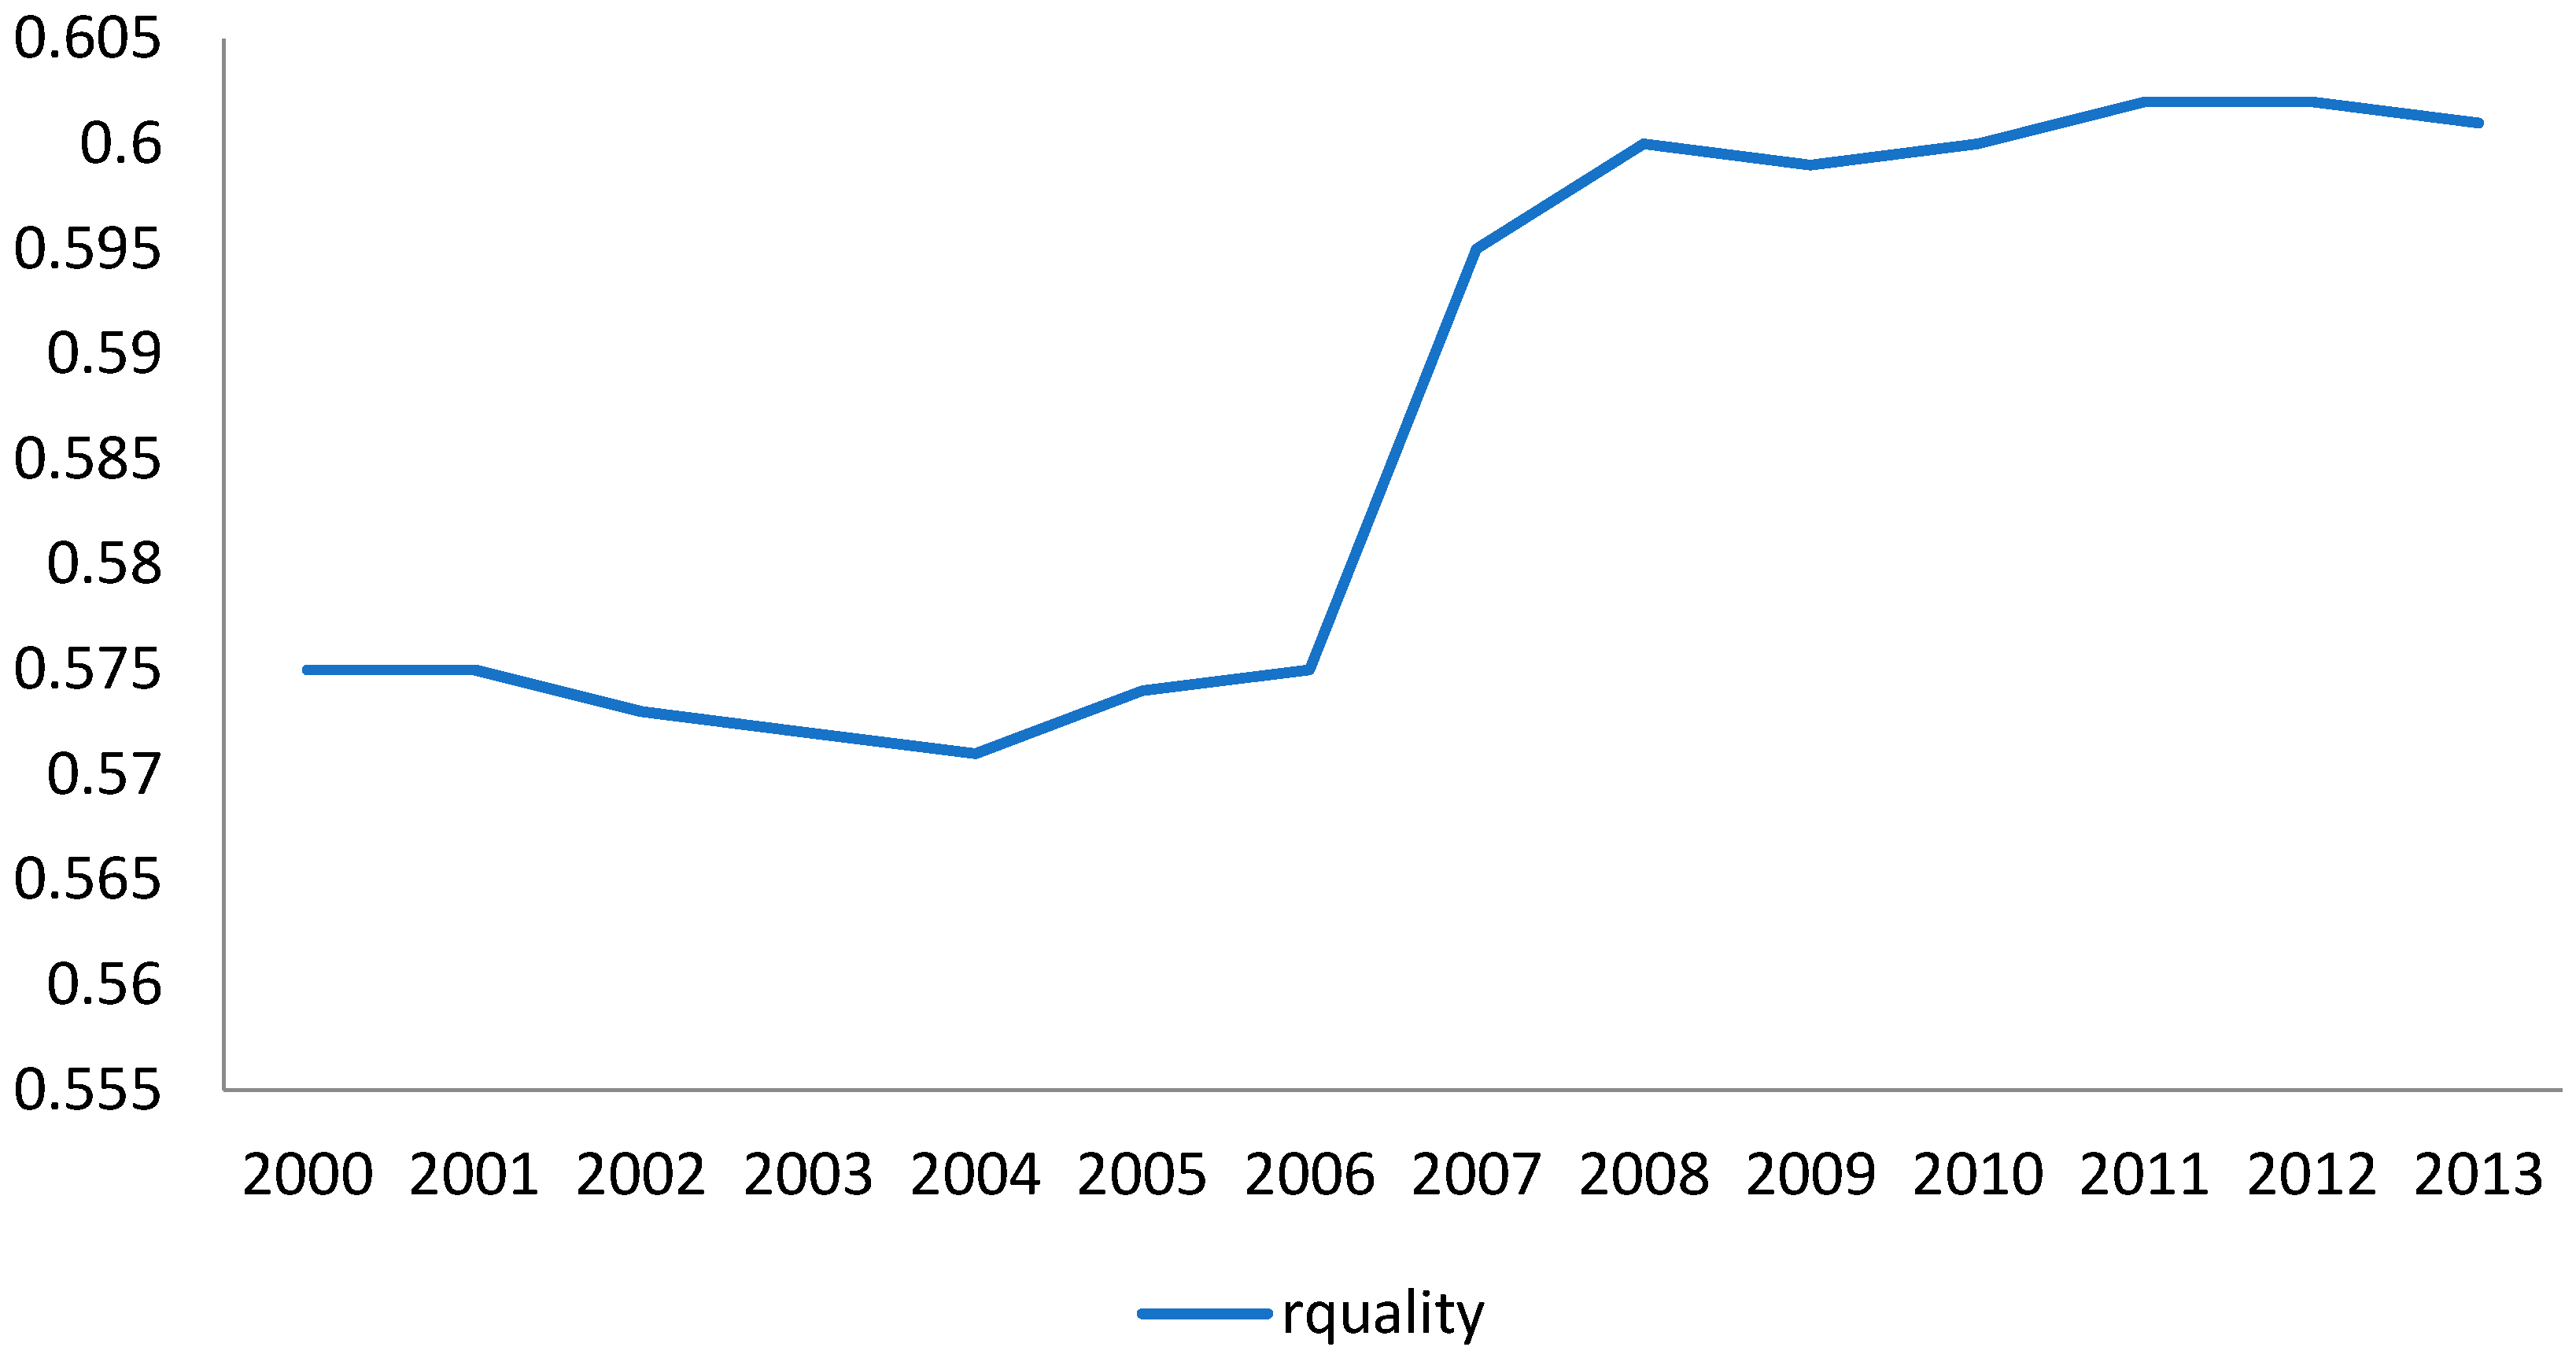
3.1.1. Export Products Quality (r-quality)

We used the methods developed by Hallak & Sivadasan [39], Khandelwal et al. [28], Shi Bingzhan [30], and Shi Bingzhan & Shao Wenbo [40] to measure the quality of the export products of wood processing enterprises in China. First, an econometric model was established:
q j kmt = p j k m t σ λ j k m t σ 1 E mt P mt
where j is the product category, k is the enterprise, m is the importing country, and t is the year in which the transaction occurred.
Then, we took the logarithm of both sides of Equation (6) to get:
lnq j kmt = σ ln p j k m t +   ( σ 1 ) l n λ j k m t + ln E mt l n P mt
lnq j kmt σ ln p j k m t + χ m t ϵ j k m t
where χ mt = ln E mt lnP mt represents the virtual variable of the importing countries and year, controlling for the effects of variation in the importing countries and time. lnp jkmt is the logarithm of the price of product j, which is exported to country m in year t. ϵ jkmt = ( σ 1 ) ln λ jkmt is a residual term that contains product quality information. We could regress Equation (8) and use the residual to define the product quality:
quality jkmt = ln λ ^ jkmt = ϵ ^ jkmt σ 1 =   lnq jkmt ln q ^ jkmt σ 1 .
Equation (9) can be used to calculate the quality of any type of wood processing industry products. Formula (9) can be standardized to facilitate comparison of quality among products, as follows:
r quality jkmt = quality jkmt min ( quality jkmt ) max ( quality jkmt ) min ( quality jkmt )
where min and max are the minimum and maximum quality values, respectively, for a given product exported to any country, by any enterprise in any year.

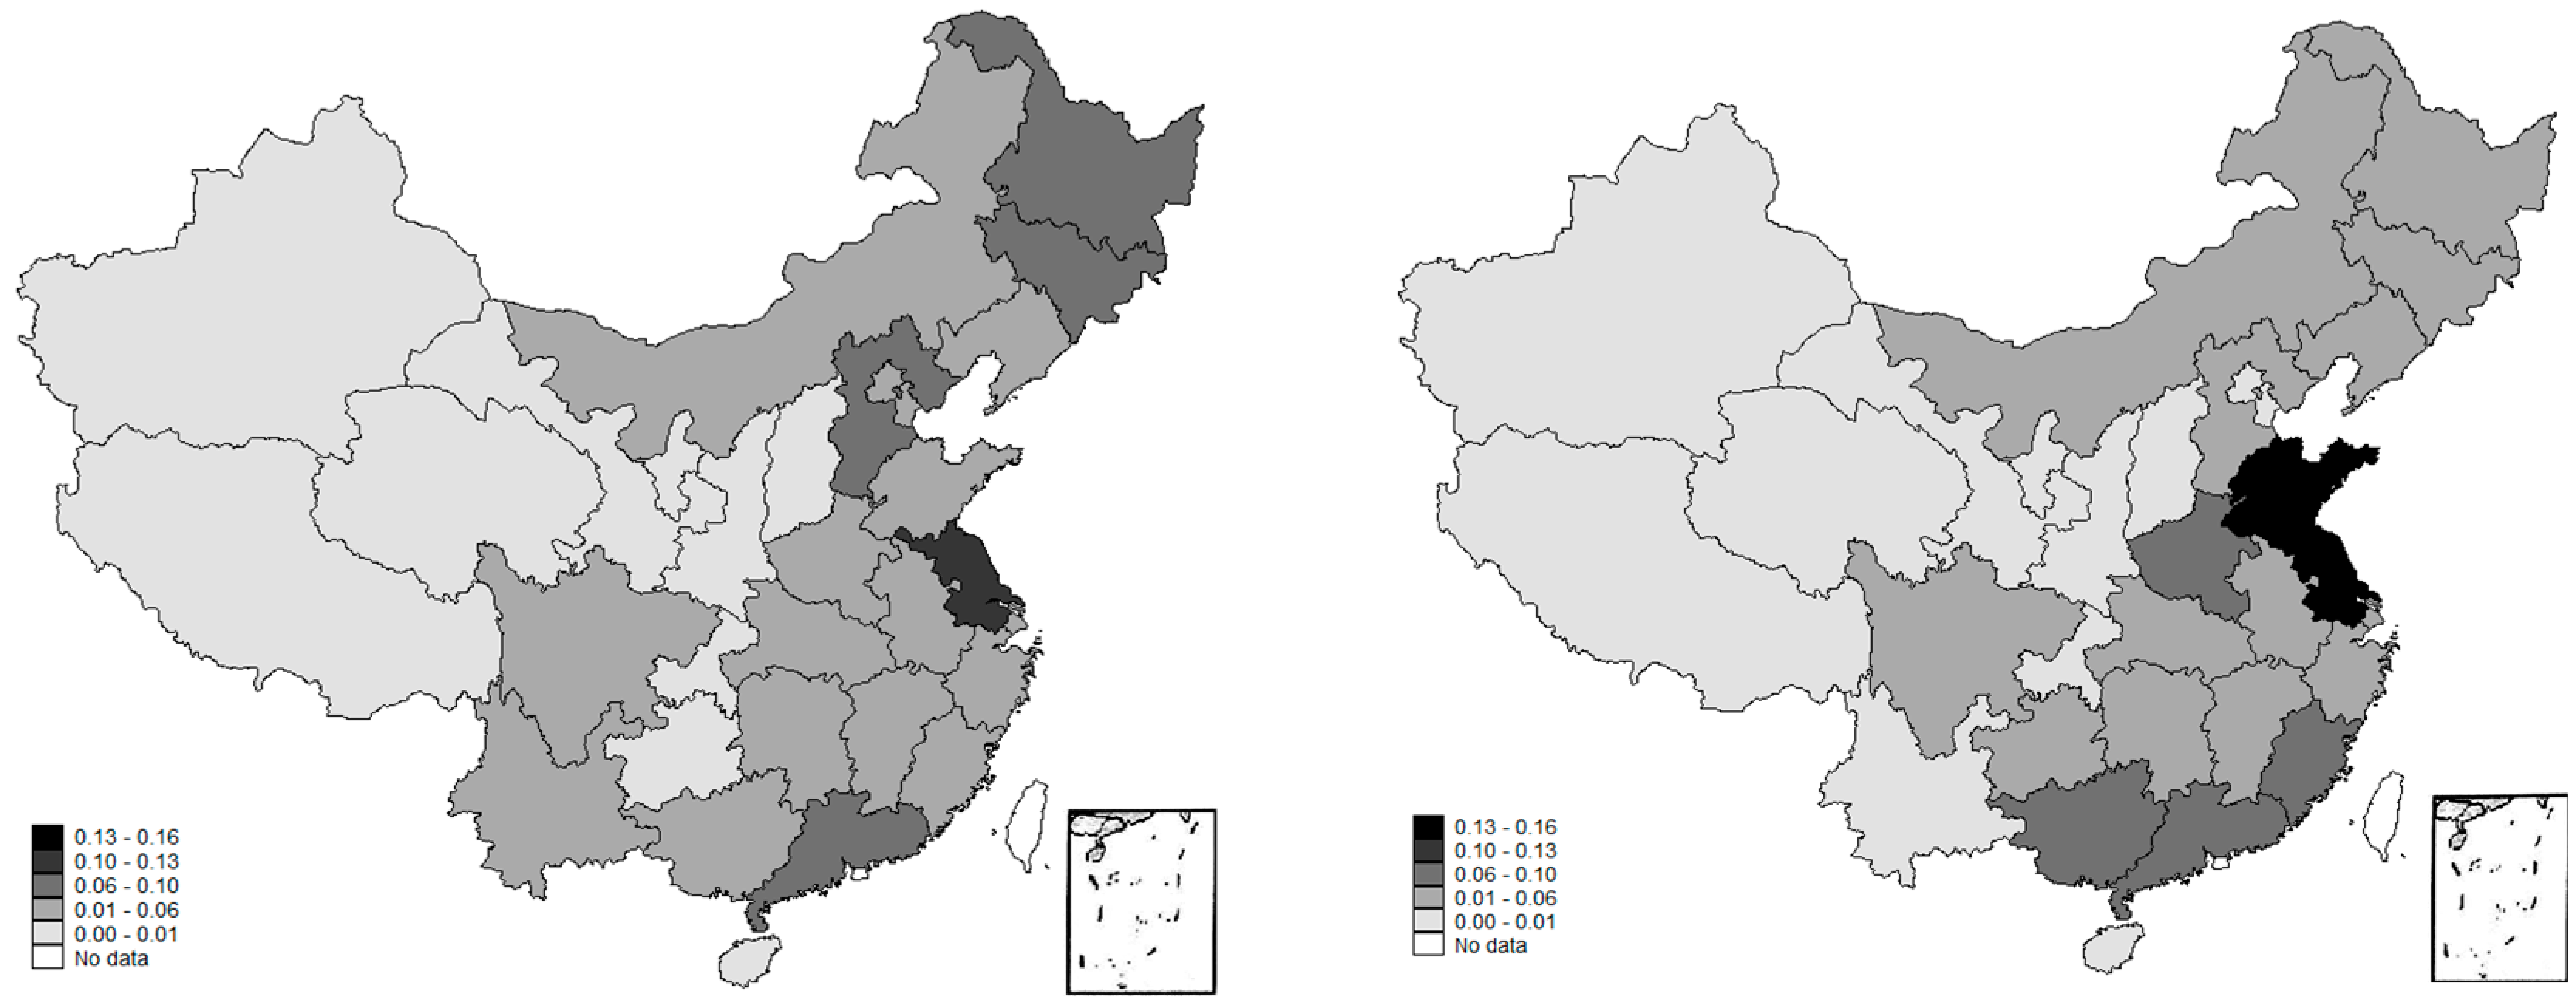
3.1.2. Spatial Agglomeration Index (EG)

To quantify the influence of spatial agglomeration of China’s wood processing industry, we used the EG proposed by Ellison and Glaeser [41] as a proxy for enterprise spatial agglomeration:
EGi = G i H i 1 H i = r ( x r   s i r ) 2 [ 1 r ( x r ) 2 ] j ( z i j ) 2 [ 1 r ( x r ) 2 ] ( 1 j ( z i j ) 2 )
where x r is the ratio of employees in region r to the number of employees in the entire country, which is an indicator of the population density of region r; s i r is the ratio of employees working in industry i in region r with respect to that in the whole country, which serves as a proxy of the regional distribution of employees in industry i; and z i j is the ratio of employees of enterprise j in industry i to the total number of employees in industry i, which is an indicator of the firm size distribution in industry i.

3.1.3. Control Variables

Enterprise Level

Total factor productivity (TFP): The productivity growth is driven mainly by technology innovation [42]. According to the new trade theory (NTT) and the theoretical framework of this paper, the productivity of enterprises has an impact on the quality of export products [43]. We used the following formula, proposed by Li Chunding [44], to calculate total factor productivity:
TFP = ln Y L 1 3 ln K L .
The total factor productivity is one of the variables used to control the impact of the productivity of wood processing enterprises on the quality of products.
Government subsidies (sub): Government subsidies increase company funds, thus allowing for increased investment aimed at improving product quality. When the government grants subsidies to enterprises, it does not transfer payments according to the proportion of its sales revenue. It is often a fixed subsidy for some reasons [45]. So we decided to use dummy variables. If a company receives government subsidies in a given year, sub is 1; otherwise it is 0 [35].
Enterprise scale (scale): Larger enterprises have a lower fixed cost per unit of product and higher investment efficiency. As a control variable, we used the logarithm of the fixed assets of the enterprise to measure the size of the enterprise [46].
Enterprise operating period (age): Older enterprises have greater experience and a more stable position in the market, allowing them to improve product quality more easily. Hence, we used enterprise age as another control variable. We used the method of Sultan et al. [46] to determine the age of companies.
Ownership type (OST): Enterprises are classified as state-owned enterprises, collectively owned enterprises, private enterprises, self-employed households, wholly foreign-owned enterprises, Sino-foreign joint ventures, or Chinese–foreign cooperative enterprises. We assessed the impact of the agglomeration economy on product quality for these different types of enterprises. The products of state-owned and collectively owned wood processing enterprises account for 6.42% of the total wood processing products, the products of self-employed households and privately owned wood processing enterprises account for 56.13%, and the products of foreign-owned enterprises account for 37.45%. Therefore, we created additional dummy variables. If enterprises were state-owned or collectively owned wood processing enterprises, OSTG was assigned a value of 1; otherwise, it was 0. If they were self-employed households and privately owned wood processing enterprises, OSTP was 1; otherwise, it was 0.
Mode of trading (MOT): In the China Customs Database, trading methods are divided into general trade, processing trade, processing and assembling incoming materials, feed processing, consignment and agency sales, border trade, imported equipment for processing and assembling incoming materials, exported goods for externally contracted projects, compensation trade, duty-free foreign exchange commodities, inbound and outbound goods in bonded warehouses, leasing trade, equipment and articles imported by foreign-invested enterprises, output processing, barter trade, storage of goods in bonded warehouses, imported equipment stored in export processing zones, materials and gifts donated by countries and international organizations, and other forms of trade. The wood processing industry products using general trade account for 72.69% of the total wood processing products, the products using processing trade account for 24.18%, and the products of other trade methods account for 3.13%. Dummy variables for trade mode were created. If it used general trade, MOTG was 1; otherwise, it was 0. If it used the processing or assemblage of incoming materials trade, feed processing trade, output processing trade, or general processing trade, MOTP was 1; otherwise, it was 0.
Industry (IND): The wood processing industry can be divided into four three-digit industries (wood chip processing industry (201), wood panel manufacturing industry (202), wood products industry (203), bamboo and rattan palm industry (204)), which include the following nine four-digit industries: Sawn timber processing industry (2011), wood chip processing industry (2012), plywood manufacturing industry (2021), fiberboard manufacturing industry (2022), particleboard manufacturing industry (2023), wood panel manufacturing industry (2029), wood products for manufacturing industry (2031), wood products for daily use industry (2033), and bamboo and rattan palm industry (2040) (see Appendix A Table A1). Since wood chip processing industry (201), wood panel manufacturing industry (202), wood products industry (203), and bamboo and rattan palm industry (204) account for 4.88%, 41.07%, 41.65%, and 12.38%, respectively, of the total wood processing industry, dummy variables were created to measure the impact of agglomeration on the product quality of different three-digit wood processing industries. In this paper, IND201, IND202, and IND203 are set as virtual variables indicating whether an enterprise is a wood chip processing industry (201), wood panel manufacturing industry (202), or wood products industry (203). Industrial enterprises take a value of 1; otherwise, the value is 0.
Country LevelEconomic size (lngdp): The size of a country’s economy determines the level of consumption at the national level; the higher the level of consumption is, the higher the demand for high-quality products is [47]. Yongrok Choi et al. found regions with higher GDP are likely to have higher eco-efficiency [48]. We used the logarithm of gross domestic product (GDP) of the importing country in a given year as an indicator of the size of that country’s economy.
Degree of dependence on foreign trade (ddft): The degree of dependence on foreign trade of the importing country corresponds to its trade barriers. Countries with lower degree of dependence on foreign trade may only be in the market for high-quality forest products; in other words, high-quality products can break market barriers. We used the ratio of a given country’s trade volume to its GDP as a proxy for degree of dependence on foreign trade.
Forest certification system (FCS): Whether an importing country has a forest certification system can reflect the strength of its enterprises, and the awareness of its government of the need for sustainable forest management; with greater awareness, the demand for high-quality imported forest products is also greater. At present, the Forest Stewardship Council (FSC) and Program for the Endorsement for Forest Certification (PEFC) are the forest certification systems most widely accepted by the international community, and are closely involved in the trade of wood processing products in China. We took FSC or PEFC membership as a proxy for the degree of awareness of the need for sustainable forestry for a given importing country.

3.2. Data

We analyzed data on wood processing enterprises for the period 2000–2013, contained within the China Industrial Enterprise Database and the China Customs Database, for this research. The China Industrial Enterprise Database includes information such as enterprise ID code, address, industry sector, registration type, affiliation, opening dates, business status, and various economic performance indicators. However, the latest update of the China Industrial Enterprise Database was in 2013, which is weakly time limited. The database also has problems such as missing indicators, abnormal indicators, and sample selection problems. However, due to the large sample size and detailed data classification of the database, it is in line with the data requirements of this study. What’s more, research using this data has been published in top journals such as American Economic Review [49] and Economic Research [50,51,52] in recent years. Therefore, before using it, we excluded duplicate enterprise codes, enterprises with missing data, an unconventional business status, or zero listed employees from our analysis. The China Customs Database mainly includes transaction-related information, such as enterprise ID code, transaction dates, transit countries, importing countries, HS codes of the traded products, transaction prices, and transaction quantities. According to the method of Yu [53], we first excluded entries with missing data from the analysis, and then matched entries within both databases to calculate the EG and determine the quality of products exported by China’s wood processing industry. Through this matching process, a total of 59,281 data samples were obtained, associated with 2328 wood processing enterprises. The sample data is an unbalanced panel data with company–product–country and years, whose entries are distinguished by different company, HS code of products, importing country, or year.
The control variables in micro level were calculated based on data from the China Industrial Enterprise Database and the China Customs Database. The GDP of import countries which was used as a proxy for economy size, and trade volume which in turn were used in the calculation of the degree of dependence on foreign trade, were obtained from the World Bank database. The data pertaining to whether the importing country joined a forest certification system were taken from annual reports published by the FSC and PEFC, for the period 2000–2013.

3.3. Model

As discussed above, we selected 59,281 samples from the China Industrial Enterprise Database and the China Customs Database to study the relationship between product quality and various parameters of wood processing industry. According to Yu Miaojie & Zhang Rui [54], Shi Bingzhan & Shao Wenbo [35], and Sultan et al. [46], the model were established as follows:
r quality jkmt = α 0 + α 1 EG kt + α 2 TFP kt + α 3 dwz kt + α 4 sub kt + α 5 scale kt + α 6 age kt + α 7 lngdp jkmt + α 8 ddft jkmt + α 9 FCS jkmt + ε 1
r quality jkmt = α 0 + α 1 EG kt + α 2 EG kt OSTG kt + α 3 EG kt OSTP kt + α 4 TFP kt + α 5 dwz kt + α 6 sub kt + α 7 scale kt + α 8 age kt + α 9 OSTG kt + α 10 OSTP kt + α 11 lngdp jkmt + α 12 ddft jkmt + α 13 FCS jkmt + ε 2
r quality jkmt = α 0 + α 1 EG kt + α 2 EG kt MOTG kt + α 3 EG kt MOTP kt + α 4 TFP kt + α 5 dwz kt + α 6 sub kt + α 7 scale kt + α 8 age kt + α 9 MOTG kt + α 10 MOTP kt + α 11 lngdp jkmt + α 12 ddft jkmt + α 13 FCS jkmt + ε 3
r quality jkmt = α 0 + α 1 EG kt + α 2 EG kt IND 201 kt + α 3 EG kt IND 202 kt + α 4 EG kt IND 203 kt + α 5 TFP kt + α 6 dwz kt + α 7 sub kt + α 8 scale kt + α 9 age kt + α 10 IND 201 kt + α 11 IND 202 kt + α 12 IND 203 kt + α 13 lngdp jkmt + α 14 ddft jkmt + α 15 FCS jkmt + ε 4
where j is the product j, k is the enterprise k, m is the importing country m, and t is the year t in which a transaction occurred. The indicators are divided into enterprise-level and country-level. The variable r-quality represents the standardized export product quality. The main explanatory variable, EG, is the agglomeration index. TFP is the total factor productivity of the enterprise, dwz is the R&D investment, sub represents whether the company receives a government subsidy, scale refers to the size of the enterprise, and age is the age of an individual enterprise. OSTG is a dummy variable for state-owned and collectively owned wood processing enterprises. OSTP is a dummy variable for privately owned enterprises and self-employed households. MOT is the mode of trading, which is equal to 1 in the case of general trade and 0 in the case of processing trade. IND201, IND202, and IND203 are dummy variables pertaining to the wood chip processing, wood panel manufacturing, and wood products industries, respectively. lngdp denotes the size of the economy of the importing country and ddft represents the degree of openness dependence on foreign trade of the importing country. FCS denotes the forest certification system status of the importing country.

3.4. Descriptive Statistics

Descriptive statistics were calculated for the 59,281 data samples. As can be seen from the Appendix A Table A2, the average value of quality of the wood processing export products is 0.555, which is much lower than that of the China’s manufacturing products [54], indicating that the quality of the wood processing export products still need to be improved. Comparing with the average value, the standard deviation of the EG index is relatively large, reflecting substantial differences in the level of spatial agglomeration among different regions. The values of control variables are generally consistent with the previous literature (see Appendix A Table A2).

3.5. Heteroscedasticity, Autocorrelation, and Multicollinearity

Initially, we used White’s test to determine the heteroscedasticity of the data. The results showed that the data were heteroscedastic (p = 0.00). An autocorrelation test showed that the model had autocorrelation properties (p = 0.00). Therefore, to avoid the estimation bias associated with heteroscedasticity and autocorrelation, we used a robust standard error value in the regression analysis. To test for multicollinearity among the explanatory variables, we generated a correlation coefficient matrix (see Appendix A Table A3), which revealed no serious multicollinearity. The maximum and minimum variance expansion factor (VIF) values were less than 10 and not less than 0.

3.6. Regression Analysis

Due to the heteroscedasticity of the data, the Hausmann test of endogeneity could not be applied so we instead used the overidentification test; the null hypothesis of random effects could be rejected (p = 0.00). In summary, models 1–4 used fixed-effects regression with robust standard error and the results were in Table 1.
According to the regression results for model 1, the EG index has a positive impact on the quality of export products (0.009), i.e., spatial agglomeration of Chinese wood processing enterprises could significantly promote the quality of wood products. Thus, the economic benefits of agglomeration would likely offset the negative effects of excessive competition. Overall, although China’s wood processing industry is concentrated in east coast cities, the level of agglomeration has declined since 2004 [5]. New wood processing enterprises should be encouraged to purchase land and build factories nearby to, and to cooperate with existing enterprises, to create a ‘win–win’ situation wherein existing infrastructure is shared to reduce costs, allowing for improved product quality.
The regression results for model 2 also showed a positive correlation between the EG index and quality of export products (0.008). The EG × OSTG interaction was significantly negative (−0.029; p < 0.05). The sum of the coefficients for the EG × OSTG interaction and EG was also negative (−0.021). The coefficient for the EG × OSTP interaction was significantly positive (0.034), as was the sum of the coefficients for the EG × OSTP interaction and EG (0.042). Greater spatial agglomeration did not have a positive effect on the quality of the products of state-owned and collectively owned wood processing enterprises. Compared to other enterprises, greater spatial agglomeration had a more positive effect on the quality of the products of privately owned wood processing enterprises. The coefficient of EG (0.008) showed that spatial agglomeration could promot the quality of wood processing industry products as produced by foreign-owned enterprises, but to a lesser extent versus private enterprises.
The regression results for model 3 showed that the EG index has a positive impact on the quality of export products (0.026, p < 0.01). However, neither the EG × MOTG nor EG × MOTG interactions were significant. Thus, regardless of the type of trade that a company is involved in, spatial agglomeration would always promote the improvement of wood product quality.
The regression results for model 4 indicated that the coefficient of EG index plus that of the interactions of the dummy variable for the wood chip processing industry, wood panel industry or, wood products industry with EG index was positive (0.066, 0.041 and 0.017, respectively; p < 0.01). The model showed that spatial agglomeration promotes higher-quality products by the wood chip processing industry, wood product industry, and wood-panel manufacturing industry. However, based on the negative EG coefficient (−0.022; p < 0.01), agglomeration reduces the quality of bamboo and rattan palm products.
Among the enterprise-level control variables, TFP and export product quality were significantly positively correlated (p < 0.01), where highly productive wood processing enterprises have higher-quality products. Thus, improving the productivity of wood processing enterprises not only increases their output, but also the quality of their products. Furthermore, government subsidies were significantly negatively associated with the quality of wood products. This may be because government subsidies alleviate financial pressure on wood processing enterprises, such that the importance of improving product quality may be ignored by companies themselves. Enterprise scale and age were negatively correlated with product quality (p < 0.01); larger and older enterprises appear to focus more on the quantity rather than the quality of products. By ignoring the importance of high product quality, these companies attempt to “win by volume”.
Among the importing-country-level control variables, economy size of the importing country was significantly positively associated with product quality (p < 0.01), indicating that larger importing country economies require higher-quality products. Hence, low-quality wood products should eventually be eliminated through market competition. Therefore, to penetrate the markets of developed countries, Chinese wood processing enterprises need to improve the quality of their products. ddft was negatively associated with product quality, where importing countries with high levels of dependence on foreign trade have a less strict requirement for high-quality products. The presence of FCS within an importing country was negatively correlated with wood product quality (p < 0.01); countries jioned FCS have relatively well-established legal processes pertaining to sustainable forest management, and may also be able to produce their own high-quality wood products. Hence, the demand for such products from China is relatively low.

3.7. Data Robustness

We assessed the robustness of our data statistically. According to the GB/T4754-1994 standard, the wood processing industry could be divided into nine four-digit industries, as listed in Section 3.1.3. Fixed-effect regression analysis was carried out to ensure the robustness of the data by eliminating these nine industries from the analysis one by one. Most of results show that agglomeration had a positive impact on product quality, except for wood products for daily use industry (2033). These results were largely consistent with those of regression model 1, indicating that our data were relatively robust (see Table 2).

4. Discussion

Spatial agglomeration of China’s wood processing industry promotes higher wood product quality. This result is similar to those reported by Greenaway & Kneller [6], Antonietti & Cainelli [7], Sun Churen et al. [24], Geng Yeqiang & Zhang Shizheng [55], Meng Qi [56], and Mo Sha & Ou Peiqun [57]. China’s per capita forest area is only 21% of the world’s, which is faced with a shortage of timber resources. China’s wood processing industry relies heavily on imported timber resources. So it is important to find out a way to improve the quality of wood processing products to maintain the international share of China. Spatial agglomeration is one of the most important ways to improve the quality of the products of the wood processing industry. China’s wood processing industry should adopt conservation and intensification technologies, and a centralized system. Spatial agglomeration can play an active role in the development of China’s wood processing industry, and thus should be promoted and optimized.
We found that private enterprises benefit more from the advantages conferred by the agglomeration economy than do state-owned enterprises, similar to the findings of Sultan et al. [46] and Geng Yeqiang & Zhang Shizheng [55], in which they found that agglomeration improved the quality of all manufacturing products of state-owned enterprises. One possible explanation for this is that state-owned wood processing enterprises are more likely to have access to sufficient labor, capital, land, and other resources granted by the government. However, if too many enterprises are concentrated within the same region, the advantages of state ownership will be diluted. Compared to state-owned and collectively owned enterprises, the motivation for private enterprises to maximize profits is stronger. Increased agglomeration will likely intensify competition among enterprises, stimulate innovation, and improve enterprise productivity and product quality. China’s wood processing industry should formulate appropriate industrial policies, encourage privately owned wood processing enterprises to agglomerate, and improve the conditions for them, and acquire economic benefits associated with agglomeration. In particular, the spillover benefits of the agglomeration economy should be fully realized by privately owned wood processing enterprises to accelerate improvements in the quality of their wood products.
According to our results, trade type does not significantly modify the effect of spatial agglomeration on the quality of wood products. However, this does not agree with Sultan et al. [46], who stated that in manufacturing, seen under general trade conditions, scale economy was more advantageous than the excessive competition. This may be attributable to the particular characteristics of the wood processing industry. The environment, service, and management of wood processing industry agglomeration efforts should be improved. We also recommend that the industrial chain be extended, various trade types be promoted, and the quality of export products be improved on a continual basis.
Agglomeration appears to be most beneficial for wood chip processing industry products, followed by those of the wood products industry, with the smallest positive effect on product quality being seen for the wood panel manufacturing industry. In the case of the bamboo and rattan palm industry, the positive effects of agglomeration are outweighed by the negative impacts of excessive competition, because agglomeration is less likely to stimulate innovation, and by extension increase productivity and product quality, in this industry. Compared to the other three-digit industries, the industrial chain of the bamboo and rattan palm industry is shorter, and the demand for downstream industries is lower. Although agglomeration increases competition and drives up raw materials costs to the benefit of the farmers, it also increased the supply of bamboo and rattan palm products, which is not conducive to greater product sales. While large-scale automated production benefits more from agglomeration, agglomeration of producers of handcrafted products leads to extreme competition (and where handcrafted goods are more prevalent in the bamboo and rattan palm industry versus the other three-digit industries). It is possible to sell more products by reducing their quality, and agglomeration may lower product quality in the bamboo and rattan palm industry. Appropriate industrial policies should be formulated according to the characteristics of individual wood processing industries, to encourage their development.

5. Conclusions and Implications

We analyzed data within the China Customs Database to determine the quality of China’s wood processing products, and then compared the results to those based on analysis of data from the China Industrial Enterprise Database of the period 2000–2013. We carried out panel data regression to assess the impact of spatial agglomeration on the quality of products of the wood processing industry. According to our results, first of all, spatial agglomeration can significantly improve wood product quality. Also, private enterprises are more likely to benefit from the advantages conferred by agglomeration than state-owned enterprises. Moreover, trade type does not modulate the impact of spatial agglomeration on the quality of wood products. Last but not least, the quality of wood chip processing industry benefits the most from agglomeration, followed by those of the wood products industry and the wood panel industry. Agglomeration was actually associated with a decrease in the quality of the products of the bamboo and rattan palm industry.
It is also worth noting that the productivity of wood processing enterprises was positively associated with product quality; that is, wood processing enterprises with high productivity have relatively higher-quality products. Older and larger wood processing enterprises appear to be more concerned with the quantity rather than quality of their products; that is, wood processing enterprises that are new and small indeed produce high-quality products. Meanwhile, importing countries with larger economies demand higher-quality wood products, as do those without forest certification systems.
Improving the quality of the products of China’s wood processing industry is not only an urgent issue for that industry itself, but also a focus of governmental policy. Based on the results of our empirical analysis, first, we propose that policy should encourage rational agglomeration of China’s wood processing industry, to ensure higher-quality products. Second, it is important to exploit the positive effects of spatial agglomeration on the quality of wood products. In particular, agglomeration of privately owned wood processing companies in China should be encouraged, because such companies can benefit more from the spillover effects of agglomeration. Third, there is no need to limit the trade methods for the wood processing industry, which should be encouraged to develop in a variety of ways. Fourth, policies should be set according to the particular characteristics of the various wood processing industries. In particular, however, policy should be focused on the wood chip processing, wood product, and wood panel industries, all of which need to address their overreliance on external resources and foreign markets and develop in sync with local production systems fostered by large-scale agglomeration. This would likely improve the quality of products by fully exploiting the spillover benefits of the agglomeration economy. Fifth, moderate competition between enterprises should be encouraged to improve productivity, which in turn is associated with higher product quality. Thus the opportunities afforded by agglomeration of the wood processing industry should be fully utilized, by encouraging enterprises to compete fairly and effectively in the marketplace.

Author Contributions

T.C. performed calculation, analyzed the data, and wrote the paper. J.Z. verified and solidified the argument and edited the paper. Y.L. and B.C. revised the manuscript during the whole writing process. All authors contributed to the drafting of the article and read the final manuscript.

Funding

This research is funded by the National Natural Science Foundation of China (Grant No. 71873016; Grant No.71690242); the National Key Research and Development Program of China (Grant No. 2016YFA0602500); Strategic Priority Research Program of Chinese Academy of Sciences (Grant No. XDA20100104).

Conflicts of Interest

The authors declare no conflict of interest.

Appendix A

Figure A1. Spatial distribution of China’s wood processing industry in 2000 and 2013.
Sustainability 11 03961 g0a1
Figure A2. Trend in the quality of China’s wood processing products from 2000 to 2013.
Sustainability 11 03961 g0a2
Table A1. The interpretation of industry.
Industry IDIndustryInterpretation
2011sawn timber processing industryProcessing ordinary sawn timber and special sawn timber.
2012wood chip processing industryProcessing needles and hardwood chips
2021plywood manufacturing industryManufacturing wood plywood, bamboo plywood, bamboo plywood, and bamboo laminates
2022fiberboard manufacturing industryManufacturing wood and non-wood fiberboard
2023particleboard manufacturing industryManufacturing wood and non-wood shaving fiberboard
2029other wood panel manufacturing industryManufacturing veneer, thermosetting resin decorative laminate, wood-based panel surface decoration, glued wood, laminated wood
2031wood products for manufacturing industryProducing wooden farm implements, wooden doors and windows, small pieces of flooring, wooden packaging supplies, etc.
2033wood products for daily use industryProducing wooden cooking utensils, pots, barrels, and other household wood products
2040bamboo and rattan palm industryProducing daily necessities and packaging supplies made by bamboo and rattan palm.
Table A2. Data characteristics (n = 59,281).
StatsMeanMedianMaxMinSd
rquality0.5550.5791.0000.0000.138
EG0.0600.0433.626−4.9740.155
TFP6.9866.95914.2742.5121.166
sub0.1540.0001.0000.0000.361
scale8.8358.85914.1161.0991.593
age8.4457.00087.0001.0005.489
lngdp6.5546.7739.728−2.0171.911
ddft83.55061.444442.6200.16770.064
FCS0.7421.0001.0000.0000.438
Table A3. Correlation coefficient matrix of the explanatory variables.
EGTFPSubScaleAgelngdpddftFCS
EG1.000
TFP−0.0081.000
sub−0.022−0.0131.000
scale−0.0360.3680.1041.000
age0.049−0.0230.0720.2271.000
lngdp0.018−0.1260.007−0.028−0.0041.000
ddft−0.0160.013−0.016−0.0070.003−0.4391.000
FCS0.027−0.0600.012−0.0030.0080.504−0.3651.000
VIF1.011.201.021.251.081.511.291.39
1/VIF0.9940.8360.9840.7980.9300.6610.7780.720

References

  1. Yang, H.Q.; Nie, Y. Study on the Issues of Transformation, Upgrading and Regional Optimization of Chinese Lumber Processing Industry. Issues Agric. Econ. 2011, 32, 90–94, 112. (In Chinese) [Google Scholar]
  2. Zhang, J.; Li, F.; Liu, Y.; Cheng, B. An Assessment of Trade Facilitation’s Impacts on China’s Forest Product Exports to Countries Along the “Belt and Road” Based on the Perspective of Ternary Margins. Sustainability 2019, 11, 1298. [Google Scholar] [CrossRef]
  3. Ding, L.; Chen, K.L.; Liu, T.; Cheng, S.G.; Wang, X. Spatial-Temporal Hotspot Pattern Analysis of Provincial Environmental Pollution Incidents and Related Regional Sustainable Management in China in the Period 1995–2012. Sustainability 2015, 7, 14385–14407. [Google Scholar] [CrossRef]
  4. Zhang, X.; Li, Z. Analysis of Scale Economy of China’s Wood Processing Industry—Based on the First National Economic Census and 188 Enterprises Survey Data. China Rural Econ. 2010, 10, 36–42. (In Chinese) [Google Scholar]
  5. Tao, C.; Li, L.; Cheng, B. An Empirical Study on the Spatial Agglomeration Level of China’s Wood-Processing Industry. J. Beijing For. Univ. Soc. Sci. 2017, 16, 61–68. (In Chinese) [Google Scholar]
  6. Greenaway, D.; Kneller, R. Exporting, productivity and agglomeration. Eur. Econ. Rev. 2008, 52, 919–939. [Google Scholar] [CrossRef]
  7. Antonietti, R.; Cainelli, G. The role of spatial agglomeration in a structural model of innovation, productivity and export: A firm-level analysis. Ann. Reg. Sci. 2011, 46, 577–600. [Google Scholar] [CrossRef]
  8. Lin, B.; Liu, F.; Zhao, H. A Study on the Impact of Industrial Agglomeration’s Productivity Effect on Export Competitiveness of Chinese Manufacturing Industry. East China Econ. Manag. 2015, 29, 109–115. (In Chinese) [Google Scholar]
  9. Wen, D.; Yan, G. Spatial Agglomeration and Export of China’s Manufacturing Industry: Based on Enterprise Level Research. Manag. World 2014, 10, 57–74. (In Chinese) [Google Scholar]
  10. Syverson, C. Prices, spatial competition and heterogeneous producers: An empirical test. J. Ind. Econ. 2007, 55, 26. [Google Scholar] [CrossRef]
  11. Fan, D.; Du, M. Research on the spatial and temporal differentiation of China’s industrial technology innovation resource allocation—Based on the new normal perspective. Stud. Sci. Sci. 2017, 35, 1167–1178. (In Chinese) [Google Scholar]
  12. Marshall, A. Principles of Economics; Palgrave Macmillan: Basingstoke, UK, 1920. [Google Scholar]
  13. Ellison, G.; Glaeser, E.L.; Kerr, W.R. What Causes Industry Agglomeration? Evidence from Coagglomeration Patterns. Am. Econ. Rev. 2010, 100, 1195–1213. [Google Scholar] [CrossRef]
  14. Audretsch, D.B. Agglomeration and the Location of Innovative Activity. Oxf. Rev. Econ. Policy 1998, 14, 18–29. [Google Scholar] [CrossRef]
  15. Chang, C.L.; Oxley, L. Industrial agglomeration, geographic innovation and total factor productivity: The case of Taiwan. Math. Comput. Simul. 2009, 79, 2787–2796. [Google Scholar] [CrossRef] [Green Version]
  16. Greenstone, M.; Hornbeck, R.; Moretti, E. Identifying Agglomeration Spillovers: Evidence from Winners and Losers of Large Plant Openings. J. Polit. Econ. 2010, 118, 536–598. [Google Scholar] [CrossRef] [Green Version]
  17. Hong, J.; Yu, W.; Guo, X.; Zhao, D. Creative industries agglomeration, regional innovation and productivity growth in China. Chin. Geogr. Sci. 2014, 24, 258–268. [Google Scholar] [CrossRef]
  18. Head, C.K.; Mayer, T. The Empirics of Agglomeration and Trade. Handb. Reg. Urban Econ. 2004, 4, 2609–2669. [Google Scholar]
  19. Liu, Z.; Yan, J.; Xu, J. Geographic Agglomeration and the Firm Export Decision—Research Based on Technological Sophistication. Ind. Econ. Res. 2014, 2, 73–82. (In Chinese) [Google Scholar]
  20. Ma, A.C. Export Spillovers to Chinese Firms: Evidence from Provincial Data. J. Chin. Econ. Bus. Stud. 2006, 4, 127–149. [Google Scholar] [CrossRef]
  21. Fan, H.; Li, Y.A.; Yeaple, S.R. Trade Liberalization, Quality, and Export Prices. Rev. Econ. Stat. 2015, 97, 1033–1051. [Google Scholar] [CrossRef]
  22. Amighini, A.; Sanfilippo, M. Impact of South–South FDI and Trade on the Export Upgrading of African Economies. World Dev. 2014, 64, 1–17. [Google Scholar] [CrossRef]
  23. Ito, B.; Xu, Z.Y.; Yashiro, N. Does Agglomeration Promote Internationalization of Chinese Firms. China Econ. Rev. 2015, 34, 109–121. [Google Scholar] [CrossRef]
  24. Sun, C.; Yu, H.; Zhao, R. Relationship between Agglomeration and Quality of Urban Export Products. J. Int. Trade 2014, 7, 23–32. (In Chinese) [Google Scholar]
  25. He, X. The Effect of Industrial Agglomeration on the Quality of Export Products of the Empirical Analysis Based on Dynamic Panel Data of the Cities above Prefectural Level of China. West Forum 2017, 2, 100–106. (In Chinese) [Google Scholar]
  26. Tian, X.; Tang, M. Industrial Concentration, Quality Difference and Price Difference of Export Products of Firms. J. Shanghai Univ. Int. Bus. Econ. 2018, 3, 25–36. (In Chinese) [Google Scholar]
  27. Amiti, M.; Khandelwal, A. Import Competition and Quality Upgrading. Rev. Econ. Stat. 2014, 95, 476–490. [Google Scholar] [CrossRef]
  28. Khandelwal, A.K.; Schott, P.K.; Wei, S.J. Trade Liberalization and Embedded Institutional Reform: Evidence from Chinese Exporters. Am. Econ. Rev. 2013, 103, 2169–2195. [Google Scholar] [CrossRef]
  29. Li, K.; Jiang, W.; Song, L. The Mystery of Changes in the Quality of China’s Exports: A Micro-level Explanation Based on Market Entry. Soc. Sci. China 2014, 3, 80–103, 206. (In Chinese) [Google Scholar] [CrossRef]
  30. Shi, B. The Product Quality Heterogeneity of China Firms’ Export: Measurement and Facts. China Econ. Q. 2014, 13, 263–284. (In Chinese) [Google Scholar]
  31. Yu, M.; Zhang, R. Estimating China’s Manufacturing Export Quality: Pitfalls and Remedy. China Econ. Q. 2017, 16, 463–484. (In Chinese) [Google Scholar]
  32. Amit, K. The Long and Short of Quality Ladders. Rev. Econ. Stud. 2010, 77, 1450–1476. [Google Scholar]
  33. Hallak, J.C.; Schott, P.K. Estimating Cross-Country Differences in Product Quality. Q. J. Econ. 2011, 126, 417–474. [Google Scholar] [CrossRef]
  34. Aw, B.Y.; Roberts, M.J. Measuring Quality Change in Quota-Constrained Import Markets: The Case of U.S. Footwear. J. Int. Econ. 1986, 21, 45–60. [Google Scholar] [CrossRef]
  35. Harrigan, J.; Barrows, G. Testing the Theory of Trade Policy: Evidence from the Abrupt End of the Multifiber Arrangement. Rev. Econ. Stat. 2009, 91, 282–294. [Google Scholar] [CrossRef]
  36. Liu, H.; Chen, H.; Li, W. Research on the Influence of Industrial Agglomeration on the Quality of Export Products-An Empirical Analysis Based on Chinese Provincial Panel Data. Contemp. Econ. Res. 2016, 7, 84–91. (In Chinese) [Google Scholar]
  37. O’Sullivan, A. Urban Economics; Irwin McGraw Hill: New York, NY, USA, 2009. [Google Scholar]
  38. Wu, D. Specialized labor division among enterprises and the organizational development of industrial cluster—On the basis of the view of trading costs. Economist 2006, 6, 89–95. (In Chinese) [Google Scholar]
  39. Hallak, J.C.; Sivadasan, J. Firms’ Exporting Behavior under Quality Constraints. NBER Working Paper, 2009; 14928. [Google Scholar]
  40. Shi, B.; Shao, W. Measurement of Chinese Enterprises’ Export Product Quality and Its Determinants: A Microscopic Perspective on Cultivating New Advantages of Export Competition. Manag World 2014, 9, 90–106. (In Chinese) [Google Scholar]
  41. Ellison, G.; Glaeser, E.L. Geographic Concentration in U.S. Manufacturing Industries: A Dartboard Approach. Soc. Sci. Electron. Publ. 1997, 105, 889–927. [Google Scholar] [CrossRef] [Green Version]
  42. Choi, Y.; Oh, D.H.; Zhang, N. Environmentally sensitive productivity growth and its decompositions in China: A metafrontier Malmquist–Luenberger productivity index approach. Empir. Econ. 2015, 49, 1017–1043. [Google Scholar] [CrossRef]
  43. Li, X.; Shi, B. Diversification of Intermediate Input Imports and the Quality of Chinese Exports. J. Int. Trade 2016, 3, 106–116. (In Chinese) [Google Scholar]
  44. Li, C. Is there a “productivity paradox” in Chinese export enterprises: A test based on the data of Chinese manufacturing enterprises. J. World Econ. 2010, 7, 64–81. (In Chinese) [Google Scholar]
  45. Geng, Q.; Hu, R. Impact Factors on the Conditions of Chinese Enterprises Attaining Government Subsidies: An Empirical Investigation Based on Data Base of Industrial Enterprises. J. Audit Econ. 2013, 28, 80–90. [Google Scholar]
  46. Sultan, N.; Sheng, B.; Shao, C. Industrial Agglomeration and Firms’ Export Product Quality Upgrading. China Ind. Econ. 2018, 11, 117–135. (In Chinese) [Google Scholar]
  47. Baldwin, R.; Harrigan, J. Zeros, Quality, and Space: Trade Theory and Trade Evidence. Am. Econ. J. Microecon. 2011, 3, 60–88. [Google Scholar] [CrossRef]
  48. Choi, Y.; Zhang, N.; Chen, S.C.; Luo, C.C. Quantitative Ecological Risk Analysis by Evaluating China’s Eco-Efficiency and Its Determinants. Hum. Ecol. Risk Assess. Int. J. 2013, 19, 1324–1337. [Google Scholar] [CrossRef]
  49. Song, Z.; Storesletten, K.; Zilibotti, F. Growing like china. Am. Econ. Rev. 2011, 101, 196–233. [Google Scholar] [CrossRef]
  50. Yu, M.; Jin, Y.; Zhang, R. Capacity Utilization Rate Measurement and Productivity Estimation for Industrial Firms. Econ. Res. J. 2018, 53, 56–71. [Google Scholar]
  51. Tan, Y.; Tan, Z.; Huang, Y.; Woo, W.T. The Crowding-out Effect of Zombie Firms: Evidence from China’s Industrial Firms. Econ. Res. J. 2017, 52, 175–188. [Google Scholar]
  52. Dong, X.; Xiao, X. Does the “Revitalization of the Old Industrial Base in Northeast of China” Benefit the Firm’s Output Value or its Profit? Evidence from the Chinese Industrial Enterprises Database. Manag. World 2017, 7, 24–34, 187–188. [Google Scholar]
  53. Yu, M.J. Processing Trade, Tariff Reductions and Firm Productivity: Evidence from Chinese Firms. Econ. J. 2015, 125, 943–988. [Google Scholar] [CrossRef]
  54. Yu, M.; Zhang, R. How Does Export Quality Respond to Home Currency Appreciation: Micro-level Evidence from China. Manag. World 2017, 5, 28–40, 187. (In Chinese) [Google Scholar]
  55. Geng, Y.; Zhang, S. Has Industrial Agglomeration Improved the Quality of Export Products?—Empirical Evidence from China’s Manufacturing Enterprises. J. Shandong Univ. Philos. Soc. Sci. 2018, 1, 92–101. (In Chinese) [Google Scholar]
  56. Meng, Q. Product Quality Effect of Agglomeration Economy: An Empirical Analysis Based on Firm Level Data. J. Cent. Univ. Financ. Econ. 2017, 6, 101–109. (In Chinese) [Google Scholar]
  57. Mosha, O.P. Can the Agglomeration of Producer Services Improve the Export Product Quality? —Evidence from 275 Cities of China. Int. Bus. 2016, 5, 17–27. (In Chinese) [Google Scholar]
Table 1. Panel data regression results.
Model 1Model 2Model 3Model 4
EG0.009 ***0.008 **0.026 ***−0.022 ***
(3.15)(2.53)(3.04)(−3.49)
EG*OSTG −0.029 **
(−2.56)
EG*OSTP 0.034 ***
(3.19)
EG*MOTG −0.011
−(1.33)
EG*MOTP −0.014
−(1.13)
EG*IND201 0.088 ***
(4.01)
EG*IND202 0.037 ***
(4.43)
EG*IND203 0.063 ***
(8.44)
TFP0.005 ***0.005 ***0.004 ***0.005 ***
(9.18)(7.51)(7.47)(6.78)
sub−0.004 **−0.002 *−0.001−0.003 **
(−3.27)(−1.66)(0.95)(−2.28)
scale−0.018 ***−0.018 ***−0.021 ***−0.018 ***
(−33.02)(−18.94)(−23.53)(−17.83)
age−0.006 ***−0.006 ***−0.004 ***−0.006 ***
(−45.34)(−8.04)(−7.15)(−7.97)
OSTG 0.057 ***
(3.52)
OSTP 0.031 ***
(13.34)
MOTG 0.052 ***
(29.58)
MOTP 0.059 ***
(24.77)
IND201 −0.004
(−0.93)
IND202 0.009 ***
(3.22)
IND203 −0.009 ***
(−4.82)
lngdp0.020 ***0.036 ***0.077 ***0.018 ***
(7.16)(7.50)(20.46)(3.34)
ddft−0.0003 ***−0.00020.0001−0.0003
(−7.20)(−3.67)(2.93)(−4.83)
FCS−0.043 ***−0.042 ***−0.030 ***−0.042 ***
(−10.06)(−8.93)(−7.18)(−9.00)
cons0.656 ***0.533 ***0.210 ***0.661 ***
(35.65)(15.56)(7.91)(16.75)
Note: standard error values are in parentheses. *** p < 0.01, ** p < 0.05, * p < 0.10.
Table 2. Results of data robustness analysis.
(1)(2)(3)(4)(5)(6)(7)(8)(9)
EG0.006 *0.007 **0.008 **0.011 ***0.010 ***0.010 ***0.026 ***−0.0040.011 ***
(1.83)(2.17)(2.27)(3.14)(2.91)(3.01)(4.68)(−1.27)(3.47)
TFP0.006 ***0.005 ***0.004 ***0.005 ***0.005 ***0.005 ***0.005 ***0.004 ***0.004 ***
(8.44)(6.98)(4.52)(7.45)(7.60)(6.47)(5.72)(6.17)(5.81)
sub−0.002−0.004 **−0.003−0.005 ***−0.005 ***−0.004 ***−0.003−0.006 ***−0.005 ***
(−1.19)(−2.36)(−1.66)(−3.20)(−3.16)(−2.64)(−1.31)(−3.33)(−2.89)
scale−0.018 ***−0.018 ***−0.016 ***−0.016 ***−0.016 ***−0.018 ***−0.017 ***−0.018 ***−0.018 ***
(−18.10)(−17.95)(−13.29)(−16.08)(−16.25)(−18.01)(−10.57)(−16.34)(−19.53)
age−0.006 ***−0.006 ***−0.006 ***−0.008 ***−0.008 ***−0.006 ***−0.008 ***−0.006 ***−0.005 ***
(−7.88)(−7.99)(−6.57)(−9.97)(−9.90)(−7.44)(−6.31)(−7.12)(−7.00)
lngdp0.016 ***0.020 ***0.047 ***0.028 ***0.028 **0.015 ***0.0010.0000.016 ***
(2.77)(3.51)(6.76)(4.68)(4.84)(2.53)(0.18)(0.04)(3.12)
ddft−0.0003 ***−0.0003 ***−0.0002 ***−0.0002 ***−0.0002 ***−0.0002 ***−0.0004 ***−0.0003 ***−0.0002 ***
(−4.45)(−4.71)(−3.01)(−4.05)(−4.06)(−4.62)(−7.30)(−5.78)(−4.45)
FCS−0.044 ***−0.042 ***−0.047 ***−0.039 ***−0.040 ***−0.045 ***−0.035 ***−0.039 ***−0.048 ***
(−9.17)(−8.74)(−8.35)(−8.24)(−8.46)(−9.15)(−5.36)(−7.69)(−9.91)
cons0.679 ***0.659 ***0.453 ***0.596 ***0.591 ***0.687 ***0.794 ***0.797 ***0.682 ***
(16.76)(16.38)(8.71)(14.10)(14.03)(15.90)(15.50)(18.48)(18.31)
Note: Standard error values are in parentheses. *** p < 0.01, ** p < 0.05, * p < 0.10. (1)–(9) correspond to sequential removal of the data for the sawn timber processing industry (2011), wood chip processing industry (2012), plywood manufacturing industry (2021), fiberboard manufacturing industry (2022), particleboard manufacturing industry (2023), wood panel manufacturing industry (2029), wood products for manufacturing industry (2031), wood products for daily use industry (2033), and bamboo and rattan palm industry (2040).

