Article

A Comparative Study of En Route Refuelling Behaviours of Conventional and Electric Vehicles in Beijing, China

1
Department of Geography, University of Cambridge, Downing Place, Cambridge CB2 3EN, UK
2
Tyndall Centre for Climate Change Research, University of East Anglia, Norwich NR4 7TJ, UK
3
Department of Land Surveying and Geo-Informatics, The Hong Kong Polytechnic University, Hung Hom, Kowloon, Hong Kong, China
4
Key Laboratory of Transport Industry of Big Data Application Technologies for Comprehensive Transport, Beijing Jiaotong University, 3 Shangyuancun, Xizhimenwai, Beijing 100044, China
5
School of Management and Economics, Beijing Institute of Technology, Beijing 100081, China
*
Author to whom correspondence should be addressed.
Sustainability 2019, 11(14), 3869; https://doi.org/10.3390/su11143869
Submission received: 17 May 2019 / Revised: 28 June 2019 / Accepted: 11 July 2019 / Published: 16 July 2019

Abstract

:
A comparative study is carried out to investigate the differences among conventional vehicles (CVs), battery electric vehicles (BEVs) and plug-in hybrid electric vehicles (PHEVs) in the maximum acceptable time of diverting to a refuelling station, maximum acceptable time of queueing at a refuelling station, refuelling modes and desirable electric driving ranges, using Beijing, China, as a case study. Here, several multinomial logit (MNL) models are developed to relate the diverting and waiting times to individual attributes. The results suggest that, (1) the diverting time roughly follows a normal distribution for both CVs and electric vehicles (EVs), but the difference between them is slight; (2) EVs tend to bear longer waiting time above 10 min; (3) the MNL models indicate that income and the level of education tend to be more statistically significant to both the diverting and waiting times; (4) the most preferred driving ranges obtained for BEVs and PHEVs are both around 50 km, indicating that EV drivers may just prefer to charge for a specific time ranging from 8 to 10 min. Finally, ways to apply the empirical findings in planning refuelling and charging stations are discussed with specific examples.

1. Introduction

1.1. Background

Electric vehicles (EVs) appear to be one of the most promising alternative fuel vehicles as the widespread adoption of EVs could potentially reduce vehicular emissions and improve local air quality in cities [1,2,3]. In order to promote the purchase and usage of EVs, many studies have been carried out to investigate the travel behaviour of EVs, including parking and charging behaviours [4,5,6,7]. However, these studies have been mostly focused on the charging behaviour at destinations (or parking lots), paying significantly less attention to the possible en route charging behaviour, for example, at fast charging stations. In response, this empirical study attempts to investigate the en route charging behaviours of both battery electric vehicles (BEVs) and plug-in hybrid electric vehicles (PHEVs) at fast charging stations, compared with the refuelling behaviour of CVs. The outcomes are expected to be helpful for different EV-related stakeholders involved. For electricity utilities, the outcomes could help them figure out the spatial distribution of en route charging demand, and then build electricity infrastructures to accommodate the additional demand from EVs [8]. For urban planners, the empirical findings could help them to locate and optimize the layouts of those EV-related transport facilities, including refuelling stations, en route fast charging stations and slow charging posts at parking lots, considering the potential interactions and competitions between them [8,9]; for example, some of the existing refuelling stations may be replaced with fast charging stations when more and more people choose EVs instead of CVs. For local authorities, a better understanding of en route refuelling behaviour could help them shape policies for EVs [8].

1.2. Previous Studies of Refuelling Behaviour

Essentially, the studies of refuelling behaviour could be grouped into theoretical modelling and empirical research [6,10,11], and the empirical findings could offer useful information to the modelling. Since this paper would contribute from an empirical perspective, the review below will be focused on the existing empirical studies of refuelling behaviours of both CVs and alternative fuel vehicles, with special attention paid to the charging behaviour of EVs.
Refuelling behaviour has been analysed from both spatial and temporal perspectives [12,13,14]. Specifically, the temporal analysis focused on the time-related refuelling characteristics, such as refuelling frequency, duration, and time of day [15,16,17], while the spatial analysis investigated the relationships between the locations of refuelling facilities and refuelling behaviour. According to the locations, the spatial analyses could be grouped into two categories: En route refuelling behaviour and the destination-based refuelling behaviour. The former generally investigated how drivers chose refuelling stations on their journeys, and the empirical findings could be further used to locate and optimize refuelling facilities [18,19,20,21]. For example, Kelley and Kuby [18] pointed out that the drivers of compressed natural gas vehicles were more likely to refuel their vehicles at stations on their journeys than at stations closest to their homes. Whereas the destination-based refuelling behaviour particularly refers to the charging behaviour of EVs at trip destinations (or parking lots) where normal (or slow) charging posts are available [22,23].
Refuelling behaviour is also closely associated with both individual and vehicle attributes [24,25,26]. For example, Kitamura and Sperling [20]’s findings suggested that refuelling behaviour of CVs was strongly associated with car ownership and utilization, but was weakly correlated with demographic and socioeconomic attributes of drivers. Similarly, Kelly, et al. [27] investigated how demographic attributes (including sex, age, residential location and household income) might influence the refuelling behaviour and further the total energy consumption. In terms of vehicle attributes, the driving range, which is closely associated with the range anxiety of drivers, was found as an important factor that could heavily influence individual charging behaviour [28,29]. In addition, charging behaviour was sometimes analysed in specific scenarios, such as vehicle-to-grid [22,30,31] and off-peak charging schemes [22].

1.3. Data Collection Methods for Refuelling Behaviour Analysis

Essentially, the data on refuelling behaviour could be collected through either questionnaire survey or automatic monitors (e.g., GPS technology). Most of the surveys on the refuelling behaviour were conducted using paper-based questionnaires [18,19,20,28], but some attempts have been made to use online questionnaires [22]. Compared to the paper-based questionnaire survey, the online survey tends to be easier to get access to respondents but is limited in representing a statistical perfect sample of the general population [22]. In terms of automatic monitors, there were two general approaches to collecting the data on individual refuelling behaviour automatically: GPS tracker and charging points. Specifically, GPS technology could be used to trace the movement of vehicles [13,15,32]; charging points could record the “charging events” when they occurred [16,17,25].
Traditionally, the survey data can be collected using one or both of stated preference (SP) and revealed preference (RP) techniques [33], which have their own advantages and disadvantages. For example, RP technique cannot be directly applied to ask questions about any targets which do not yet exist [34], and the essential limitation of the SP method is that participants’ stated preferences may not be their actual preferences [35]. Both SP and RP have been applied to survey respondents in the studies of refuelling behaviour [12,15,16,18,20,26,28,36]. However, the development of some alternative fuel vehicle types (e.g., EVs) stays at their early stages and it is rather difficult to survey directly the owners of these vehicle types, due to the low adoption rate. Therefore, some studies applied SP to survey the CV owners instead of alternative fuel vehicle owners [19,22,24].

1.4. Comments on Previous Work

Overall, the spatial and temporal characteristics of refuelling behaviour have been extensively studied. However, the spatial analyses of EV charging behaviour were mostly focused on the charging at trip destinations, paying significantly less attention to the en route charging behaviour compared with both CVs and other alternative fuel vehicles (e.g., compressed natural gas vehicle). One possible reason might be that the adoption rates of EVs were relatively low in the majority of countries across the world, meaning that the charging demand might also be low and could currently be accommodated by slow charging posts at parking lots. As a result, there is a relatively low need for fast en route charging facilities, such as fast charging stations and battery swap stations, which can recharge EVs in a relatively short time. In response to this limitation, this empirical study tries to investigate the maximum acceptable distance (or time) for EVs to divert to fast charging stations on their journeys. In terms of the analysis of temporal EV charging behaviour, most of the studies were focused on the charging duration and the time of day when EVs recharged at parking lots (or trip destinations) with slow charging posts. In response, this empirical study tries to provide insights into the EV drivers’ maximum acceptable time of queueing at fast en route charging stations on their journeys. Furthermore, the spatial and temporal characteristics of EV charging will be compared to those of CVs and will also be related to both individual and household attributes (e.g., sex and car ownership). In addition, the driving range, which appears to be one of the most influential vehicle attributes associated with charging behaviour, will also be analysed but with a focus on the en route charging, which has received significantly less attention. As reviewed above, both RP and SP have been applied to design surveys on refuelling behaviours of CVs and alternative fuel vehicles. This study adopted the SP technique as the study area of Beijing, China had a relatively small number of EV owners (Beijing only had 6000 BEVs for private use by the end of 2014 [37]) when the survey was designed and it was rather difficult to only survey EV owners. Furthermore, the survey used paper-based questionnaire as EVs might be quite new to some participants and the investigators might need to explain about EVs to them.
In summary, this paper attempts to compare the spatial and temporal refuelling characteristics of CVs, BEVs and PHEVs, with a particular focus on their maximum acceptable times of diverting to a refuelling (or charging) station and of queueing at a station, which has received scant attention in the previous studies. To an individual, the maximum acceptable times could be influenced by many factors, such as the state of energy, the availability of charging facilities at trip destinations and trip purposes. However, this paper will be focused on the general choice behaviour of CVs and EVs. Such empirical findings could be further used to investigate the choice behaviour within specific cases considering different influential factors discussed above. In order to collect the data, a paper-based questionnaire survey was designed with the SP technique and delivered to Beijing where the development of EVs stayed at the early stage [3,8]. Discrete choice models [38] will be used to analyse the data. The empirical findings extracted from the survey should be helpful for electricity utilities to invest in the electricity infrastructures, for urban planners to locate and optimize the layouts of refuelling and charging stations and for governments to shape policies and make investment decisions for EVs.

2. Methodology

2.1. Questionnaire Design

The questionnaire aims to collect the data on both en route refuelling and charging behaviours of CVs and EVs at refuelling stations and fast charging stations, respectively. Essentially, the questionnaire is composed of two parts (see Table 1): Part 1 is about individual and household attributes (e.g., sex and income). These attributes are expected to be linked to individual refuelling and charging behaviours using discrete choice models. Part 2 is about the refuelling behaviours of CVs, PHEVs and BEVs, with a focus on the maximum acceptable time of diverting to a refuelling station, the maximum acceptable time of waiting (or queueing) at a station, refuelling modes and obtained electric driving ranges, which are the key characteristics of refuelling behaviour. Here, the SP techniques were applied to set up different scenarios in which respondents were asked to choose, for example, maximum acceptable diverting time and waiting time, given different vehicles types, namely, CV, PHEV and BEV. More details about each of them are given as follows:
(1) The maximum acceptable time of diverting to a refuelling station
When becoming aware of the low state of energy, drivers start searching for a refuelling station in order to refuel their vehicles. There may be several refuelling stations around them, but the drivers may have to quit their planned routes in order to get their vehicles refuelled. The maximum acceptable time of diverting from its present location to a refuelling station may vary from one driver to another due to their different attributes and preferences. Also, the maximum acceptable driving time may differ between CV and EV drivers. Therefore, respondents were asked to choose their maximum acceptable diverting time in three given scenarios in which they were assumed to drive CV, PHEV and BEV, respectively. Their choices were related to their individual and household attributes, and the differences between CV and EV drivers were also compared. It was hoped that the respondents would compare the differences among CV, PHEV and BEV in diverting time when they answered the questions one by one; for example, after a respondent chose 10 min for CV, he would think whether a longer diverting time would be acceptable for PHEV. As mentioned above, the survey here focused on the general choice behaviour, without considering some other possible influential factors, such as the state of energy and trip purpose.
(2) The maximum acceptable time of waiting (or queueing) at a station
Drivers may have to queue at a refuelling station, especially during the peak period. They may not choose those refuelling stations with too many vehicles queueing. Therefore, respondents were also asked about the maximum acceptable waiting time at a refuelling station. The waiting time may vary from one to another and also differ between CV and EV drivers. The respondents were given three scenarios in which they were assumed to drive CV, PHEV and BEV, respectively. Their choices were also related to their individual and household attributes, and the differences between CV and EV drivers were compared.
(3) Refuelling Modes
Better understanding how people refuel their vehicles could help explicitly model the refuelling behaviour and estimate the en route refuelling demand. Essentially, there are three modes to refuel vehicles, namely full refuelling, refuelling with a specific cost and refuelling with a specific amount of fuel. Respondents were asked to choose the way in which they usually refuel their vehicles. Furthermore, the refuelling costs they generally spent at a refuelling station were also asked. Such information can be used to estimate the amount of fuel that the respondents usually get.
(4) Obtained Electric Driving Ranges
As reviewed above, the range anxiety is a key characteristic of charging behaviour of EVs. Therefore, the respondents were asked what driving ranges they wanted to obtain at a fast charging station in the following two scenarios where they used PHEVs and BEVs, respectively:
  • Scenario 1 (PHEVs): Given that the driving range of PHEV was 50 km and their PHEVs were about to use up their electricity;
  • Scenario 2 (BEVs): Given that they were about to use up their electricity but were about 25 km away from the next charging facility.

2.2. Survey Design

This survey was delivered in Beijing from September 2015 to March 2016, covering all of its 16 administrative regions and targeting at those driving license holders. The target sample size was set to 550, which was calculated based on the formula by Krejcie and Morgan [39]), with the assumption that only 70% of the collected samples would be effective and could be used for further analysis [3]. In order to mitigate the potential spatial biases, the target sample size of each administrative region was determined based on their population sizes [3]. In each administrative region, shopping malls were chosen as the survey locations as this could allow survey assistants to get access to more potential respondents [3]. Although the target respondents were driving license holders who more or less had driving experience, they might know little about EVs or had no EV driving experience. The following survey strategy was used to mitigate the survey bias as far as possible: The questionnaire survey was paper-based and the face-to-face sampling method was used, which allows survey assistants to explain about EVs to some respondents who might not know EVs well. Specifically, at the beginning of each survey, assistants gave the definitions of BEV and PHEV as well as their driving ranges and the ways to refuel/recharge them. During the survey, the assistants also explained about the different scenarios when the respondents felt confused.

2.3. Relating Refuelling Behaviour to Individual Attributes: Multinomial Logit (MNL) Model

In order to explore the possible relationships between refuelling behaviour and individual attributes, several discrete choice models will be developed particularly for the maximum acceptable time of diverting to a refuelling station and the maximum acceptable time of waiting at a station. Since we have several discrete data categories and the alternatives are both discrete and multiple, the MNL and ordered logit (OL) models are two traditional approaches to analysing such data and to estimating the extent to which a factor might influence individual behaviour. In general, the OL model can be applied in those cases where the alternatives are ordinal (e.g., “Very good”, “Good” and “Bad”); while the MNL model can be applied to the cases where alternatives can be either nominal or ordinal, but it needs to incorporate more parameters and thus tends to be more difficult to interpret [40]; specifically, the OL model only has one set of coefficients for all of the alternatives, while the MNL model has separate coefficient sets for each alternative. This is because the OL model assumes that the relationship between each alternative and independent variables is the same and can be described with the only set of coefficients, which is known as the proportional odds assumption or the parallel regression assumption [41]. However, this assumption was not always true [40]. Furthermore, the OL model cannot consider the residual variability across alternatives [42]. Therefore, this paper used the MNL model. To deal with its limitation in the interpretation, the relationships between the statistically significant variables identified with the MNL models and the alternatives will be further plotted, and the resulting charts can help interpret the results.
The MNL model is briefly introduced as follows [3,43,44,45]: Given a set of alternatives ( J ), the probability ( P n i ) for individual n to choose a specific alternative i . ( i = 1 , 2 , , J ) can be calculated by Equation (1);
P n i = e u n i j = 1 J e u n j
where, u n i is the utility of alternative i , which is composed of both observable and unobservable components (denoted as V n i and ε n i , respectively). This can be mathematically formulated as u n i = V n i + ε n i . The observable component V n i can be calculated by multiplying the vector of observable variables ( X n = ( x n , 1 , x n , 2 , , x n , M ) ) by the corresponding coefficients ( β i = ( β i , 1 , β i , 2 , , β i , M ) ) [3,43,44,45]. The coefficients here will be estimated with Stata [43]. Apart from model coefficients, some indicators, such as z value, can be calculated to help interpret the estimation results. In general, a variable can be considered as statistically significant (or important) when the z value is greater than 1.96 with the confidence level of 95% [3].

3. Survey Results

In total, the survey collected 601 samples, which was over the target sample size of 550. The potential survey bias is examined in Appendix A.

3.1. Maximum Acceptable Time of Diverting to a Station for En Route Refuelling

When becoming aware of the low states of energy of their vehicles, drivers start searching for a refuelling station around its current location and may have to divert to a station in order to get their vehicles refuelled. Given the three scenarios in which drivers were assumed to drive CV, BEV and PHEV, respondents were asked to choose their maximum acceptable diverting times. Figure 1 shows the difference between CV and EV drivers in the diverting time, suggesting that the difference is slight, but EV drivers (especially BEV drivers) somewhat tend to choose a longer diverting time above 10 min. In addition, the diverting time of 10 min are mostly chosen among the five choices, accounting for around 40% for both CVs and EVs. The diverting time of 5 min comes in second with a percentage of around 25%. To most respondents, the maximum acceptable diverting time falls into a range from 5 to 15 min, accounting for around 85%. Furthermore, the diverting time roughly follows a normal distribution based on a normality test (specifically, Lilliefors test) for each vehicle type.
In order to further explore the relationships between the maximum acceptable diverting time and individual attributes, three multinomial logit (MNL) models were developed, as shown in Table 2. For each vehicle type, the statistically significant variables are identified as follows:
(1)
CV. The z value of household income is −2.06, suggesting that household income is a statistically significant factor that could heavily influence the individual choice of the diverting time. Specifically, people with a higher household income are more unlikely to choose Choice 2 (=5 min), which is also shown by Figure A1 (in Appendix B) presenting the relationship between the diverting time and household income.
(2)
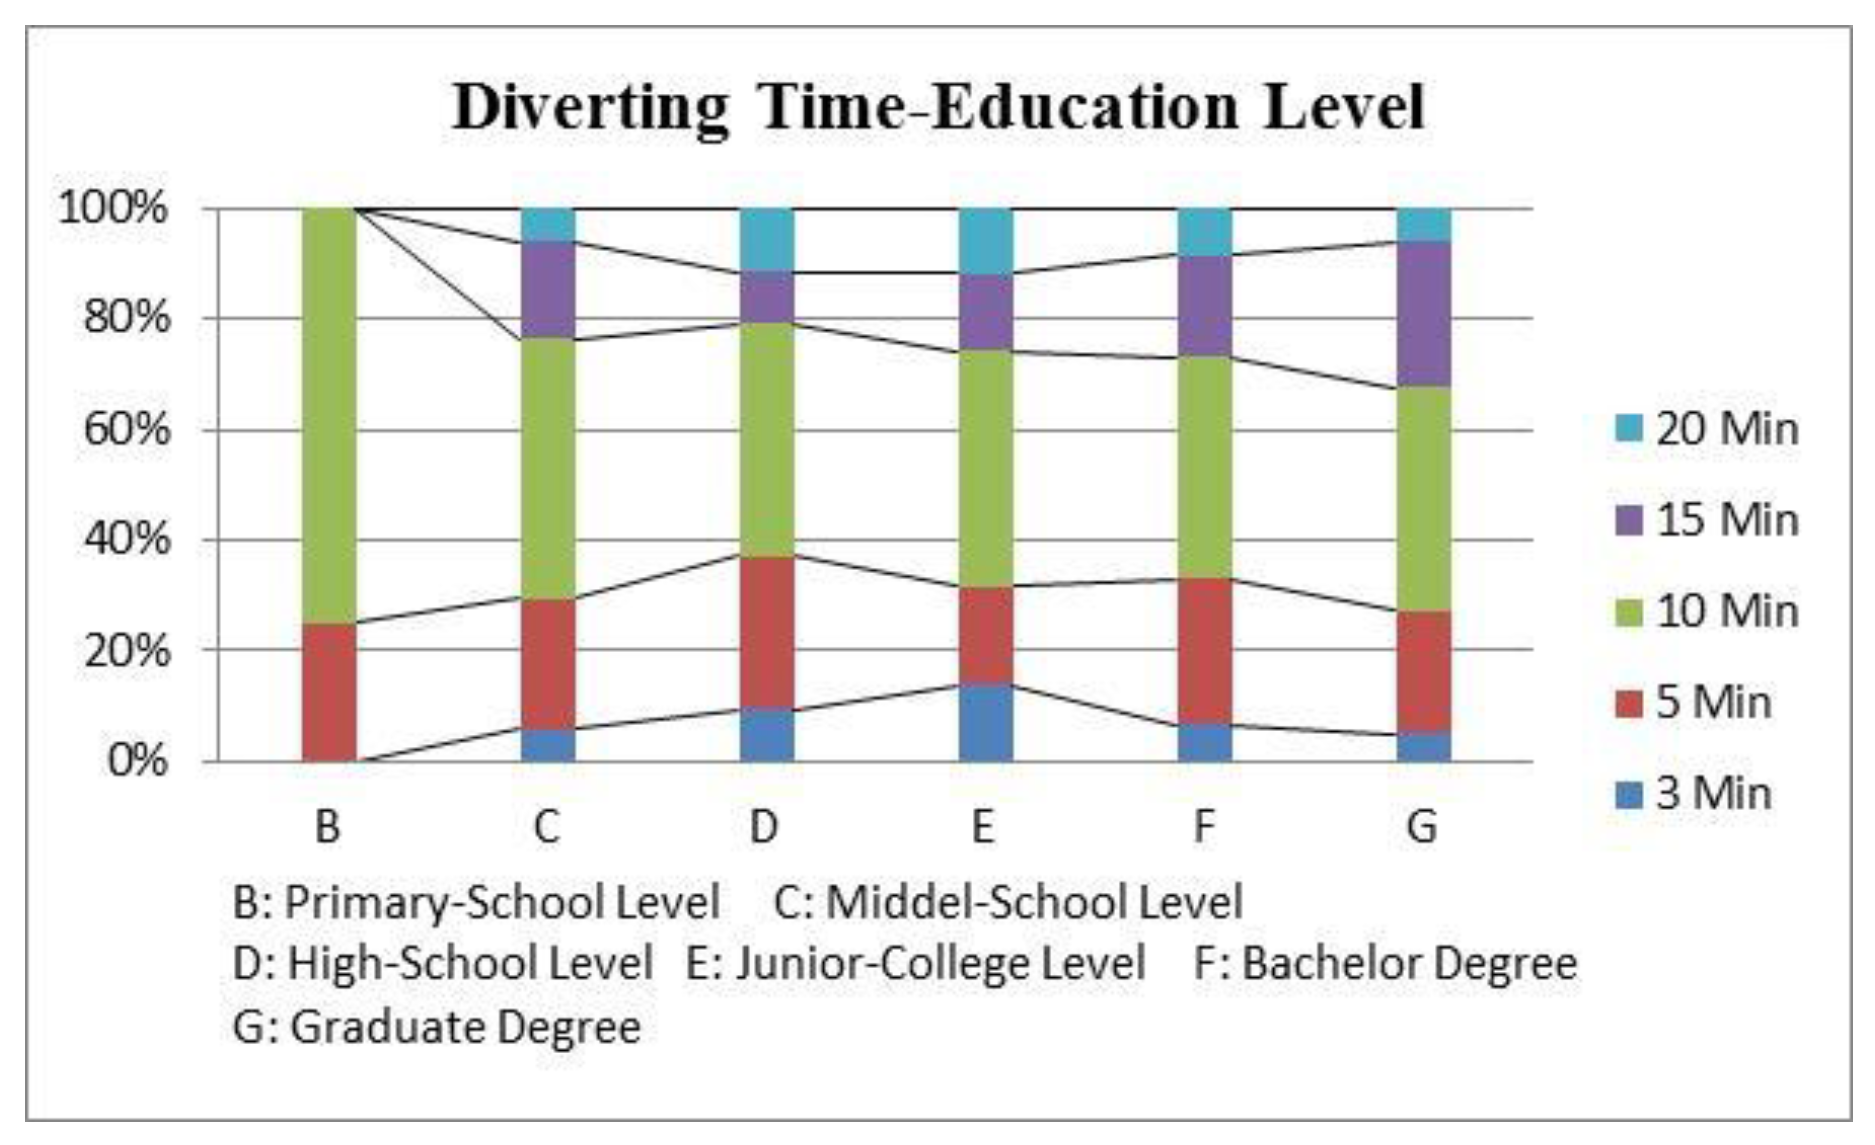
PHEV. The diverting time of PHEV drivers is only associated with the highest level of education. Specifically, people with higher education level are more likely to choose Choice 4 that is 15-min diverting time, according to the z value of 2.08 and Figure A2 (in Appendix B) showing the relationship between the diverting time and the highest level of education. This may be because people with higher level of education tend to have higher environmental awareness and thus be more willing to use electricity.
(3)
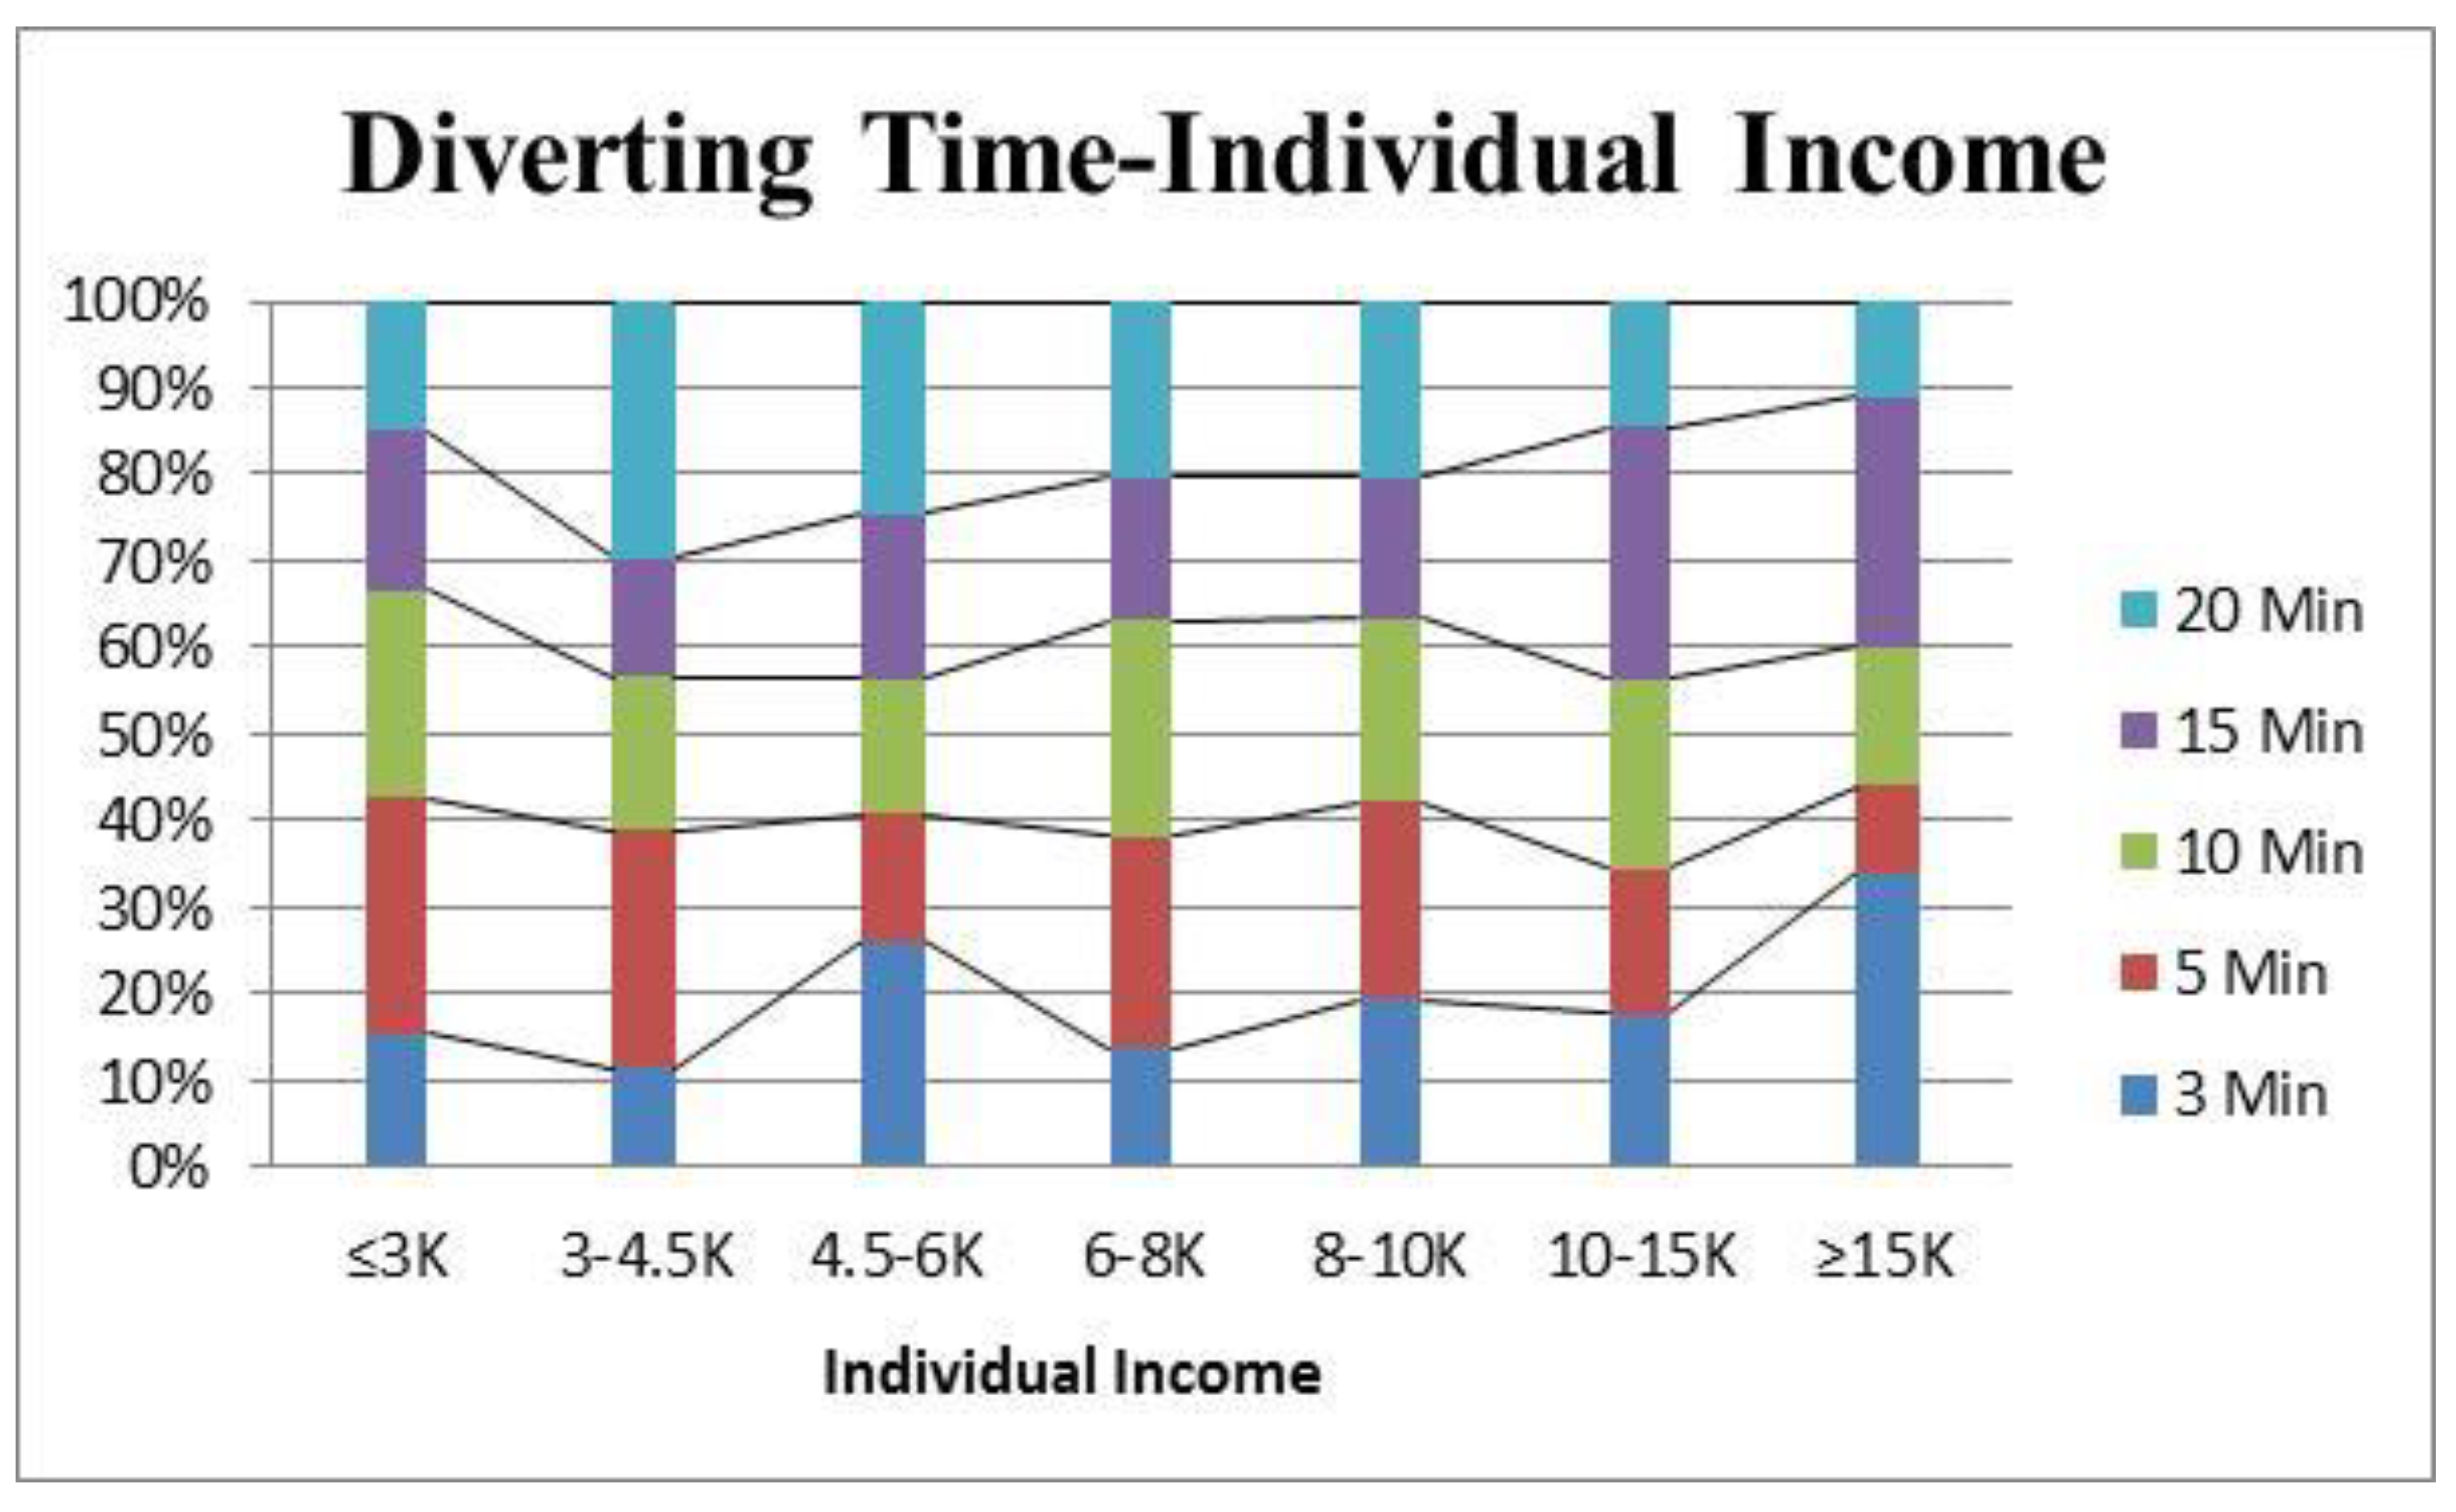
BEV. BEV drivers with higher individual income are more likely to choose 3 min or 15 min as their maximum acceptable diverting times, as evident from both the z values and the relationship shown by Figure A3 (in Appendix B). Again, this may be because some of the people with higher income would like to save more time, and the others may have a stronger desire to use electricity because of their higher environmental awareness.
Overall, the maximum acceptable diverting time varies from one to another and is associated with some individual attributes, including income and the level of education. This may be because these two attributes are related to affordability and the environmental awareness, which are associated with the basic characteristics of EVs: Using EVs could benefit the environment and also save travel costs (with electricity). Furthermore, the associated attributes also vary across vehicle types.

3.2. Maximum Acceptable Time of Waiting at a Station for En Route Refuelling

Drivers may have to queue at refuelling stations, for example, during peak hours. Respondents were asked about the maximum acceptable waiting time in three given scenarios in which they were assumed to drive CV, PHEV, and BEV, respectively. Figure 2 shows the distributions of their choices, suggesting that there is a difference between CV and EV drivers in the maximum acceptable waiting time: EVs tend to bear a longer waiting time above 10 min. For instance, for the 15-min waiting, the percentages of CV, PHEV and BEV are about 12%, 16% and 18%, respectively. In addition, for most of the respondents (about 70%), the maximum acceptable waiting time falls into the range from 5 to 10 min.
In order to further explore the relationships between the maximum acceptable waiting time and individual attributes, another three multinomial logit (MNL) models were developed, as shown in Table 3. According to the z values, the statistically significant variables for each vehicle type are identified as follows:
(1)
CV. Both household income (z = −2.5) and individual income (z = 2.08) are identified as statistically significant variables, but they have opposite relationships with waiting time. Specifically, people with higher individual income tend to choose the Choice 2 of 3 min (see Figure A4 in Appendix C) as these people may have higher time values and do not want to wait for a long time, while people with higher household income have the opposite tendency. This opposite tendency suggests that people with higher household income may not have high time value and are different from those people who themselves have high income.
(2)
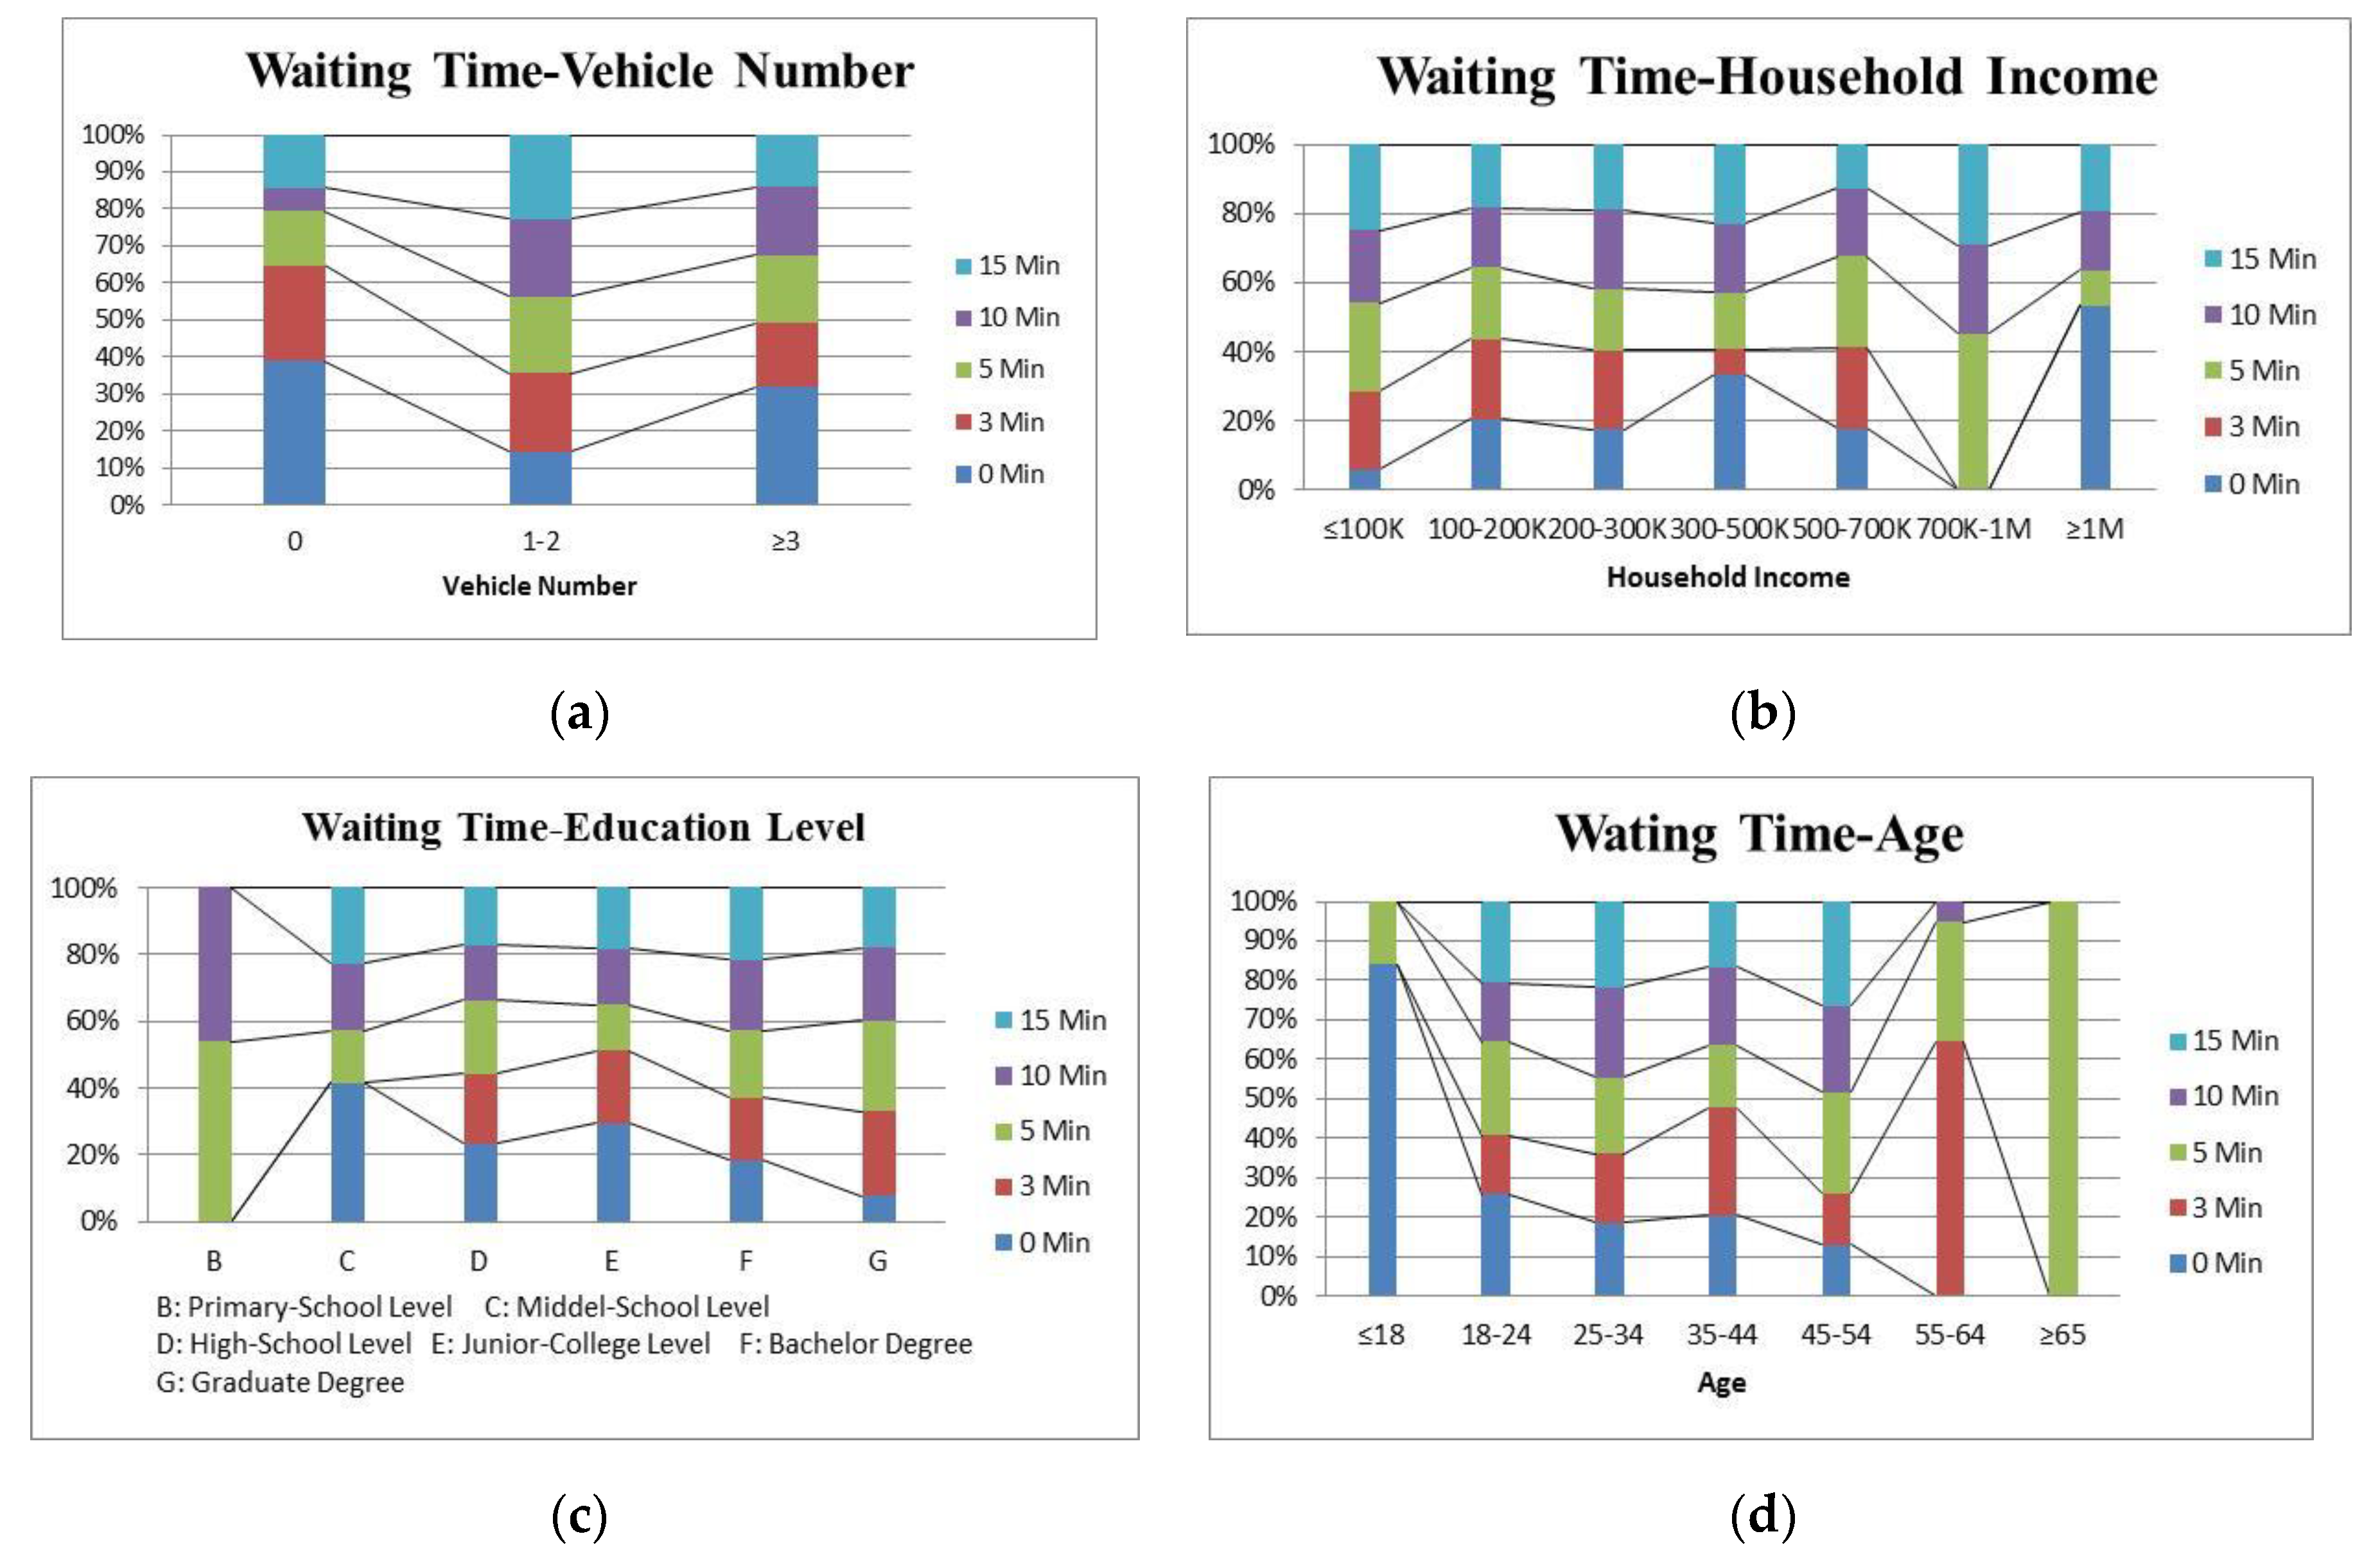
PHEV. The statistically significant variables for PHEVs include the number of vehicles owned (z = 2.3), the highest level of education (z = −2.26), household income (z = −1.99) and age (z = 2). The following conclusions can be drawn based on both the model coefficients and the relationships shown by Figure A5 (in Appendix C): (1) older people tend to choose the Choice of 3 min and do not want to queue for a long time, while people with higher household income tend not to choose the Choice of 3 min; (2) people with more vehicles tend not to queue at stations (or to choose Choice 1 = 0 Min); In contrast, people with higher level of education are likely willing to queue (or not to choose Choice 1 = 0 Min).
(3)
BEV. The number of driving licenses owned (z = 2.05) is the only statistically significant variable for BEVs. Specifically, the more licenses owned, the more likely the people choose not to queue at charging stations, according to both the model coefficients and Figure A6 (in Appendix C).
Overall, the maximum acceptable waiting time is also associated with several individual attributes, but the variables associated with waiting time vary across vehicle types. Among the attributes, income tends to be the most statistically significant variable to both CVs and EVs. This may be because income is closely associated to the time value.

3.3. Refuelling Refuelling Modes of CV and PHEV

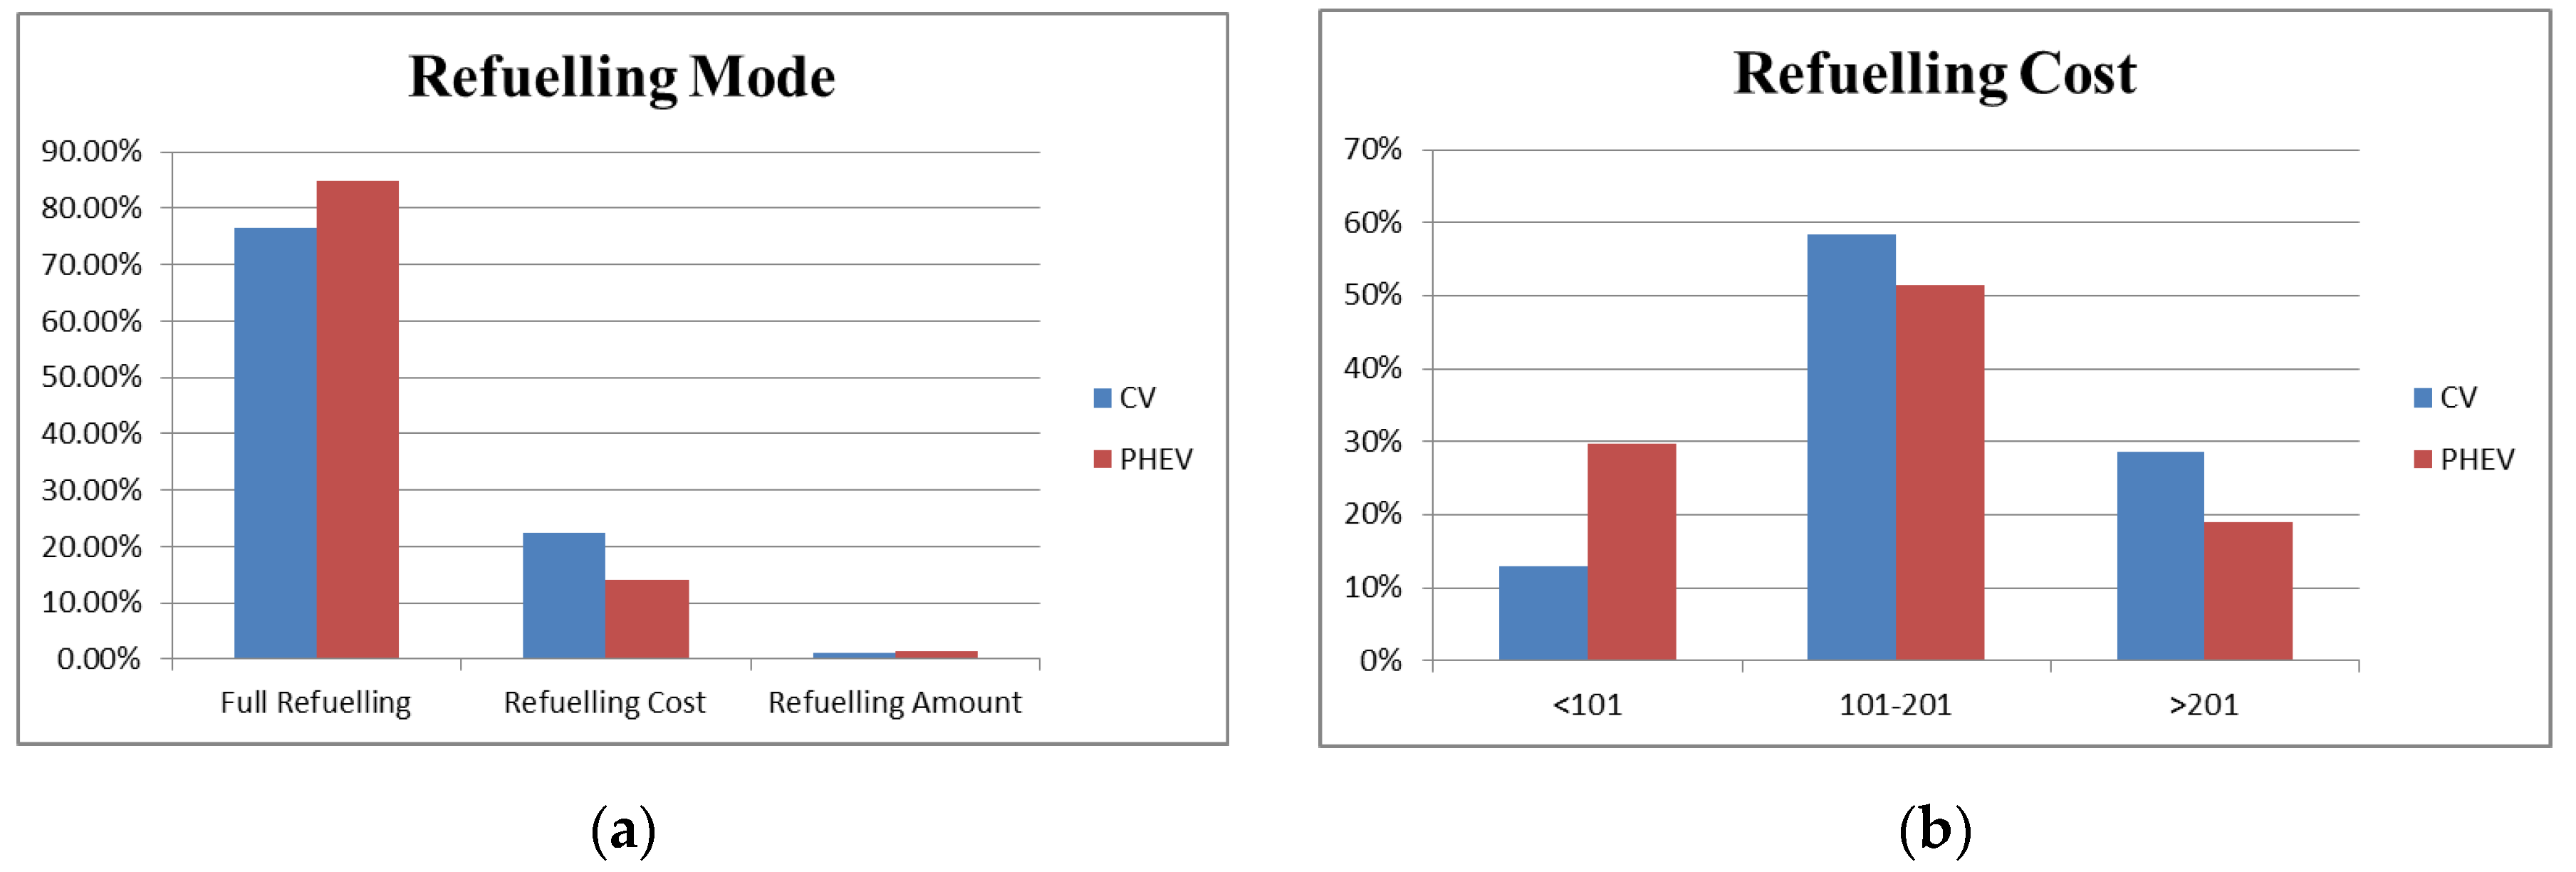
Essentially, drivers may choose one of the following three modes to refuel their vehicles: Full refuelling, refuelling with a specific cost and refuelling with a specific amount of fuel. It can be found from Figure 3 that CVs and PHEVs differ in refuelling mode and cost when they refuel their vehicles at a refuelling station. In terms of refuelling mode, full refuelling is most frequently chosen for both vehicle types, accounting for about 77% and 85% for CVs and PHEVs, respectively. The refuelling amount chosen is only around 1% for both. The reason why more PHEV drivers want to fully refuel may be because they have some electric range and thus visit the petrol station less often. For refuelling cost, most people spend money ranging from 101 to 201 RMB on refuelling each time, but PHEVs tend to spend less. This may be because PHEVs would like to save money and try to get their vehicles recharged at their trip destinations with slow charging posts, for example, at home and workplaces (note that PHEVs can save cost by running on electricity instead of petrol).

3.4. Obtained Electric Driving Ranges of PHEV and BEV

As described in Section 2.1, the respondents were asked about the desired electric driving ranges that they wanted to obtain when their BEVs and PHEVs were in a low state of charge. As shown by Figure 4, EV drivers differ significantly in the driving range obtained. Specifically, the majority of PHEV drivers want to obtain high driving ranges at changing stations, and more than half of PHEV drivers want to fully charge their vehicles at charging stations with the obtained range of 50 km. In comparison, slightly over half of BEV drivers want to charge their BEVs with 1/3 of total range obtained, which is equal to 40–50 km. Therefore, the most preferred driving ranges obtained for BEVs and PHEVs are both around 50 km, suggesting that EV drivers may just prefer to charge for a specific time ranging from 8 to 10 min (note that the charging speed at fast charging stations was given as 5 km/min in the survey). For BEV drivers, the driving range of 50 km is mostly chosen and is also a turning point, after which the number of people choosing higher driving ranges decreases. However, fully or nearly fully charging BEVs (with obtained driving ranges of 100 km or 150 km, respectively) are still preferable to a relatively considerable number of people.
In addition, another two MNL models were developed to explore the relationships between the obtained driving ranges and individual attributes (see Table A2 and Table A3 in Appendix D), suggesting that the level of education, which is associated with the environmental awareness, tends to be more statistically significant to both PHEV and BEV drivers.

4. Potential Applications of Empirical Findings in Infrastructure Planning

The empirical findings could provide some guidance on locating and optimizing the locations of refuelling stations for both EVs and CVs. Two specific examples are given as follows:
(1) Locating en route fast charging stations close to refuelling stations
Since the difference between CV and EV in the maximum acceptable diverting time is slight (see Section 3.1), the new fast charging stations could be simply located close to existing refuelling stations, given there is enough space for construction. In addition, with the increase in the number of EV adopters, the number of CVs may decrease. As a result, some refuelling stations may need to be removed due to the decreasing refuelling demand. These refuelling stations with low refuelling demand could be simply replaced by fast charging stations as they should fall into the maximum acceptable diverting times of both CVs and EVs.
(2) Adding proper number of charging posts at en route fast charging stations
The empirical findings suggest that the most preferred driving ranges obtained for BEVs and PHEVs are both around 50 km (see Section 3.4), indicating that EV drivers may just prefer to charge for a specific time ranging from 8 to 10 min. In addition, it is also found that CV and EV drivers do differ from each other in the maximum acceptable waiting time: EVs tend to bear longer waiting time above 10 min (see Section 3.2). This information could be very useful for determining the station capacity (or the number of charging posts). For example, given that the estimated number of EVs arriving at a station per hour is 70, the station capacity could be set to 10, meaning that the number of charging posts is 10 and could serve around 60 EVs per hour (as mentioned above, the charging time per vehicle is around 10 min). The remaining 10 vehicles could queue at a station for a specific charging post as their maximum acceptable waiting times tend to be longer than 10 min.
It is worth noting that the two specific examples above are just used to show how the empirical findings obtained through the survey could be applied in planning charging infrastructures. However, in practice, the infrastructure planning can be much more complicated, and many other factors need to be considered: (1) Cost of fast charging stations. The deployment of fast charging infrastructures could be costly and thus may not be infeasible. Therefore, a good business model is needed to develop fast charging facilities in a strategic way. (2) EV usage behaviour. The survey here focused on the general charging behaviour of EVs, which means those specific influential factors were not considered. For example, EV drivers may plan their trips, estimate the associated electricity consumption and figure out where to recharge their EVs before their departures. Such factors could also influence charging behaviour and further the way to locate charging infrastructures. (3) Constraints of land use and power grid system. The location of charging infrastructure could also be influenced by land use patterns and the capacity of the grid system to accommodate the additional electricity demand from EVs.

5. Conclusions

An empirical and comparative study was carried out in this paper to compare the differences between conventional and electric vehicles (CVs and EVs) in the en route refuelling behaviour, with a focus on the maximum acceptable time of diverting to a refuelling station on the journey, the maximum acceptable time of waiting (or queueing) at a station, refuelling modes and obtained electric driving ranges. Several multinomial logit (MNL) models were developed to relate the maximum acceptable diverting and waiting times to individual attributes (e.g., income), identifying the statistically significant variables. The results suggested that the difference between CV and EV in the maximum acceptable diverting time is slight, but EV drivers (especially BEV drivers) somewhat tend to choose a longer diverting time above 10 min. To the majority of respondents, the maximum acceptable diverting time falls into a range from 5 to 15 min, accounting for around 85%. Furthermore, the diverting time roughly follows a normal distribution based on a normality test for each vehicle type. In terms of the maximum acceptable waiting time, CV and EV drivers do differ from each other, and EVs tend to bear longer waiting time above 10 min. Furthermore, most people choose the waiting time ranging from 5 to 10 min, accounting for around 70%. According to the z values and coefficients of the estimated MNL models, income and the level of education tend to be more statistically significant as probably they are related to environmental awareness and affordability, which are associated with basic characteristics of EVs—using EVs could benefit the environment and also save travel costs (with electricity). In terms of refuelling modes, full refuelling is most frequently chosen for both vehicles types, accounting for about 77% and 85% for CVs and PHEVs, respectively, while only 1% of the respondents refuel their vehicles with a specific amount of fuel. For the obtained electric driving ranges of PHEVs and BEVs, the most preferred driving ranges obtained are both around 50 km, accounting for around 57% and 31%, respectively, indicating that EV drivers may just prefer to charge for a specific time ranging from 8 to 10 min.
The empirical findings above could contribute to the studies of refuelling behaviour from both theoretical and practical perspectives. On the theoretical side, the en route charging behaviours of BEVs and PHEVs and how they differ from the refuelling behaviour of CVs have received scant attention in the previous studies. The empirical findings in this paper could provide a better understanding of charging behaviour of EVs, which could be further used for explicitly modelling of the charging behaviour at the individual level, for example, by coupling an agent-based model [9,46] with the estimated MNL models. On the practical side, the empirical findings could help electricity utilities invest in electricity infrastructures to accommodate the additional en route charging demand from EVs, help urban planners to locate en route fast charging stations considering heterogeneous charging preferences (e.g., maximum acceptable diverting and waiting times) as well as the interactions between fast charging stations and refuelling stations and also help governments to design policies and make investment decisions on the technologies and infrastructures for EVs.
However, this study has some limitations which remain to be overcome in future work: First, the survey focused on the general choice behaviour, and ignored the potential influence of some important factors, such as trip purpose and state of energy, on the refuelling behaviour. In response to these, the questionnaire could be extended to include more details on trip purpose and the state of fuel (and charge), but the survey time and cost are likely to increase and a trade-off between them needs to be made. Second, the MNL model, which is a typical type of discrete choice model, was used to provide insights into the basic relationships between individual attributes and refuelling behaviour. More complex discrete choice models, such as the nested logit model, could be used to further explore the relationships among different individual choices, such as the relationship between the maximum acceptable diverting and waiting times. Third, there are some biases in the survey compared to a more general sample, in terms of the age and sex distributions. However, these may not be too problematic to a study of EV purchase behaviour as a young male tends to be more likely to purchase a vehicle (see Appendix A for a more detailed discussion). In order to explore the potential influence of the survey biases on the empirical findings obtained from this paper, further analyses are needed. For example, the survey samples can be preprocessed to find a relatively balanced distribution for each indicator (e.g., age, sex and income), and then the resulting samples can be used for estimation. The results from these two different samples can be compared, providing insights into the possible influence of the survey biases.

Author Contributions

C.Z. designed the survey and analysed the results; C.S. advised on the survey design and analysis of results; X.L. advised on methodology and applying empirical findings. All the authors wrote and edited the paper.

Funding

This research was funded by the National Natural Science Foundation of China (grant numbers 51678044; 71401012), and the Hebei Natural Science Foundation (grant number E2016513016).

Conflicts of Interest

The authors declare no conflicts of interest.

Appendix A. Examining Survey Bias

In order to further examine the bias of the questionnaire survey, the distributions of sex, age and individual income extracted from the surveys were compared with those extracted from other surveys with larger samples sizes (see Table A1). In the comparison, the reference distributions of sex and age were obtained from the 2014 Beijing Statistics Yearbook, and the individual income was obtained from a survey with a larger sample size of 322,401. Table 2 shows the results of the comparison. It should be noted that the questionnaire survey only interviewed driving license holders, but the reference distributions considered the people in general, so the comparison might not be able to present the exact differences: (1) Sex. More male respondents (61.3%) were surveyed in this study, but this might be consistent with the fact that males were more likely to have a driving license. For example, in 2010, 80% of males and 66% of females in the UK had a license [47]. (2) Age. Most of the respondents were young people aged from 18 to 34. In general, however, young people were more likely to purchase vehicles, and therefore more samples biased toward the young should not introduce too much error for this study of car travel behaviour. For example, the latest figures in 2017 suggested that young Chinese people (who were born between 1980 and 1999) tended more to purchase their first vehicles, accounting for 83.2% (source: http://www.chyxx.com/industry/201709/564387.html). (3) Income. The difference in the income distribution was small. Overall, while there are some biases in the surveys compared to a more general sample, the influence is probably slight for this study. However, the possible influences need to be borne in mind when considering the results below.
Table A1. Comparisons between the questionnaire survey and other surveys in sample distributions.
Individual AttributesActual DistributionReference Distributions
SexMale61.3%51.0%
Female38.7%49.0%
Age<180.3%24.2%
18–2416.4%
25–3446.5%22.0%
35–4424.6%16.4%
45–5410.3%15.5%
55–641.7%12.1%
>650.2%9.9%
Income (RMB)<30009.0%11.1%
3001–450011.1%12.2%
4501–600018.8%18.7%
6001–800019.8%18.5%
8001–10,00016.2%10.5%
10,001–15,00014.7%12.7%
>15,00010.5%13.3%
(Source: The income distribution is obtained from the webpage below: http://salarycalculator.sinaapp.com/report/%E5%8C%97%E4%BA%AC).

Appendix B. Figures for Maximum Acceptable Diverting Time

Appendix B.1. CV Diverting Time
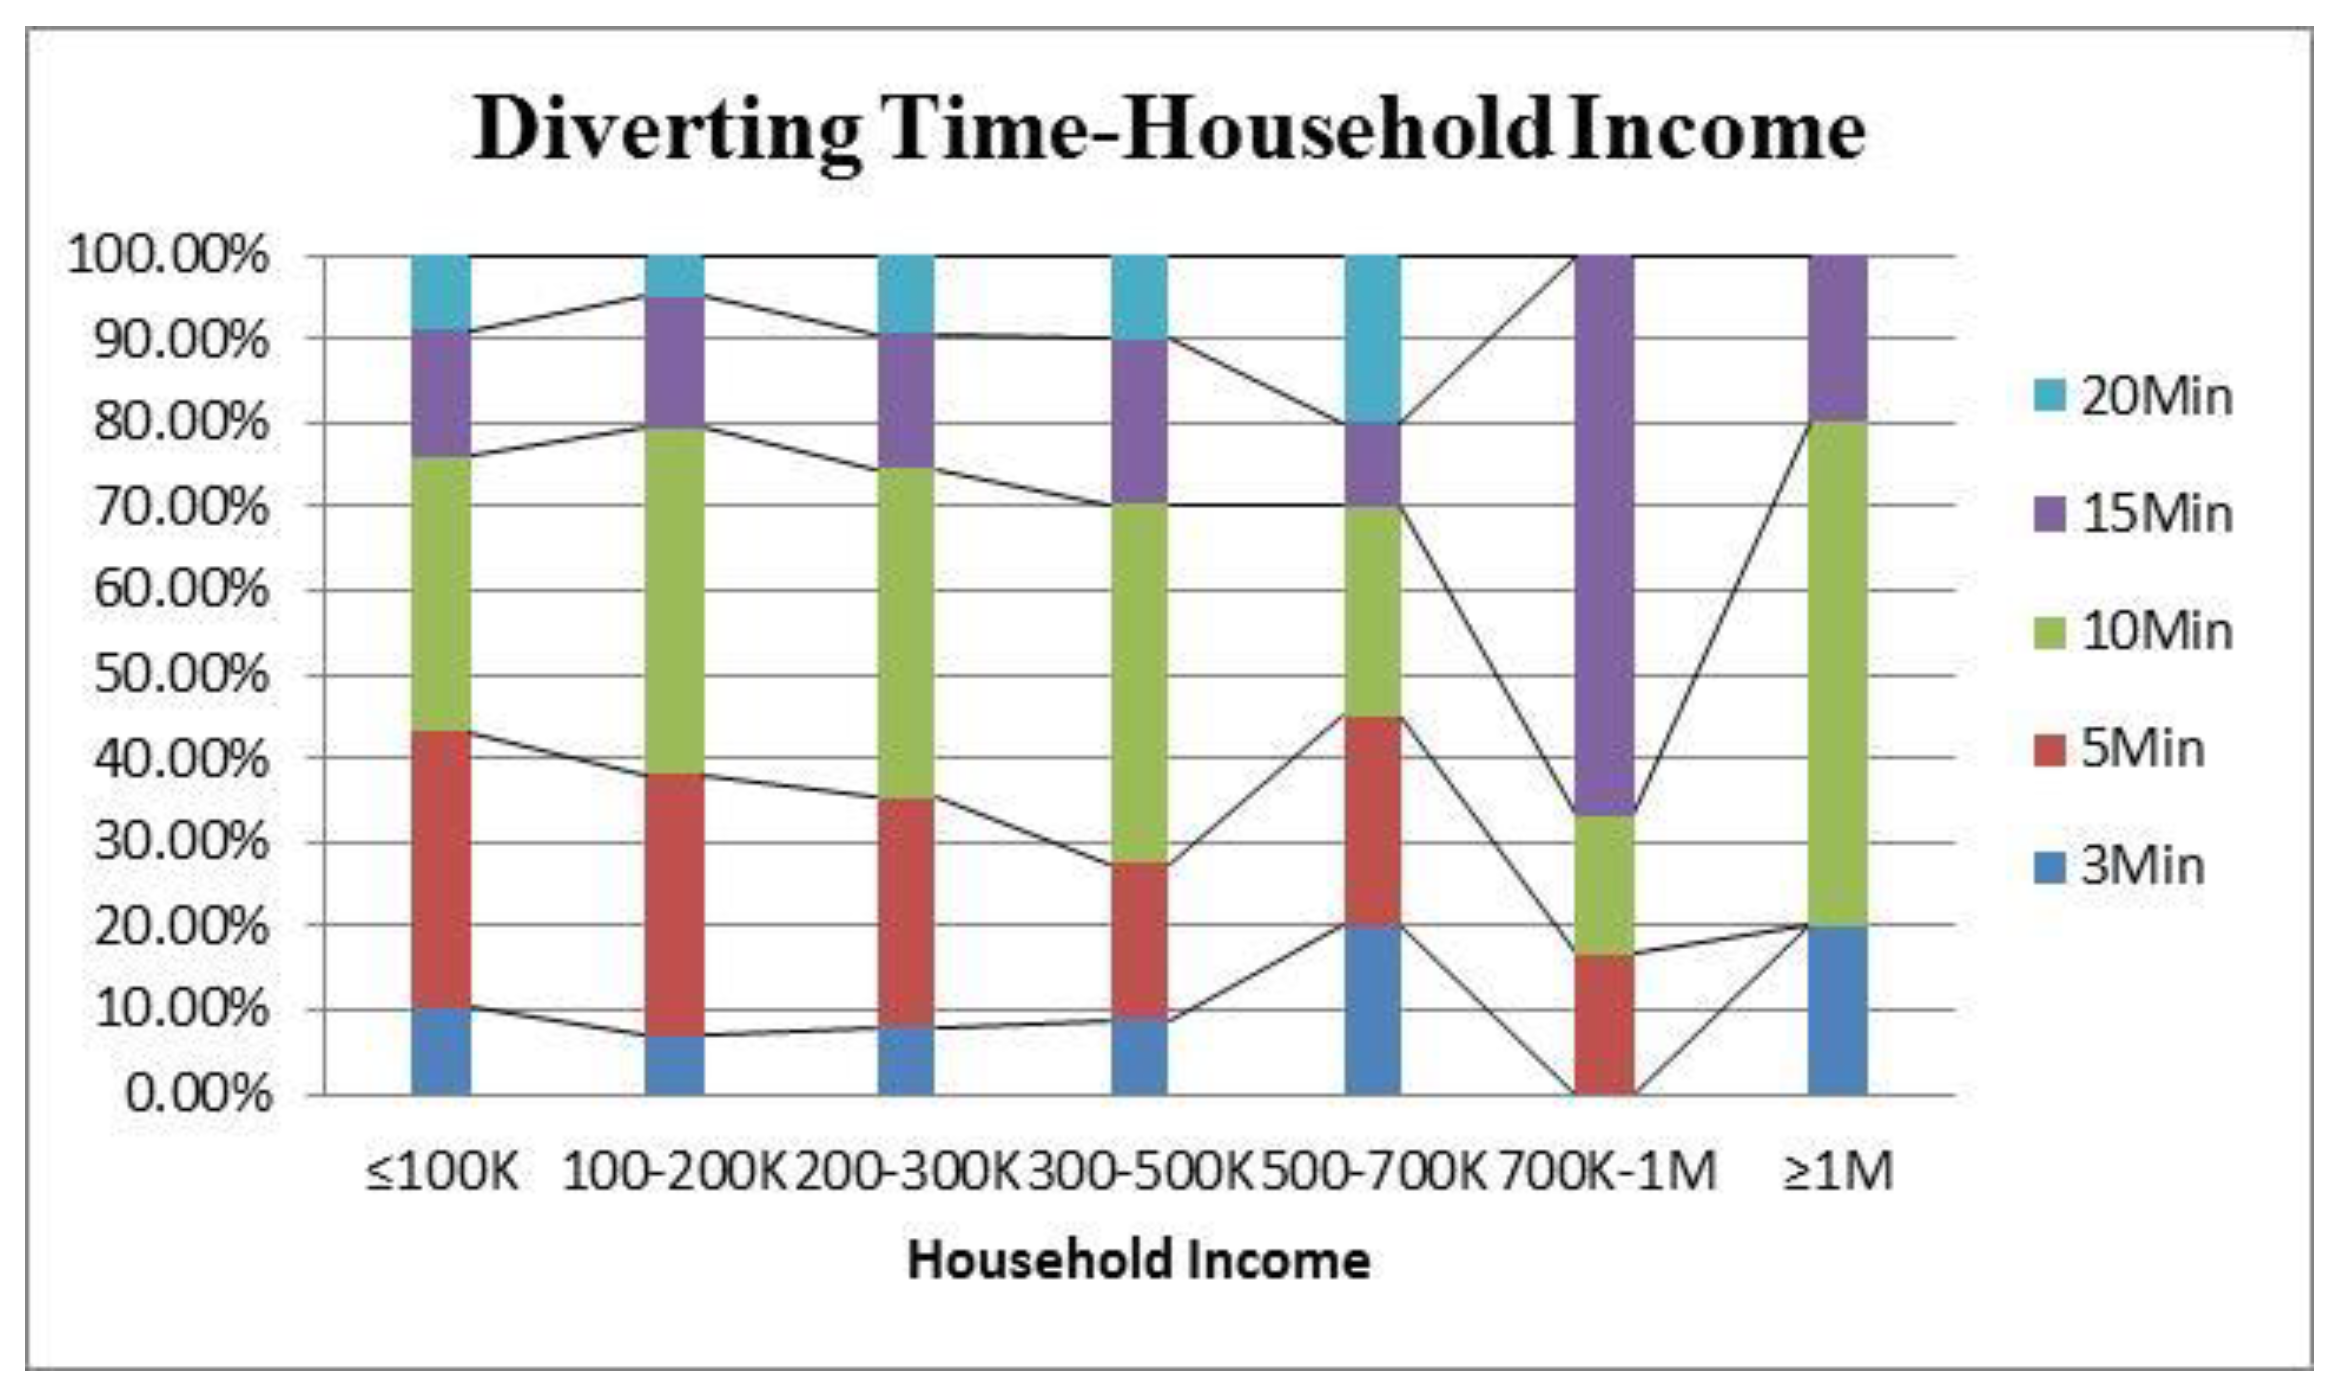
Figure A1. Relationship between diverting time of CVS and household income.
Sustainability 11 03869 g0a1

Appendix B.2. PHEV Diverting Time

Figure A2. Relationship between diverting time of PHEVs and education level.
Sustainability 11 03869 g0a2

Appendix B.3. BEV Diverting Time

Figure A3. Relationship between diverting time of BEVs and individual income.
Sustainability 11 03869 g0a3

Appendix C. Figures for Maximum Acceptable Waiting Time

Appendix C.1. CV Waiting Time
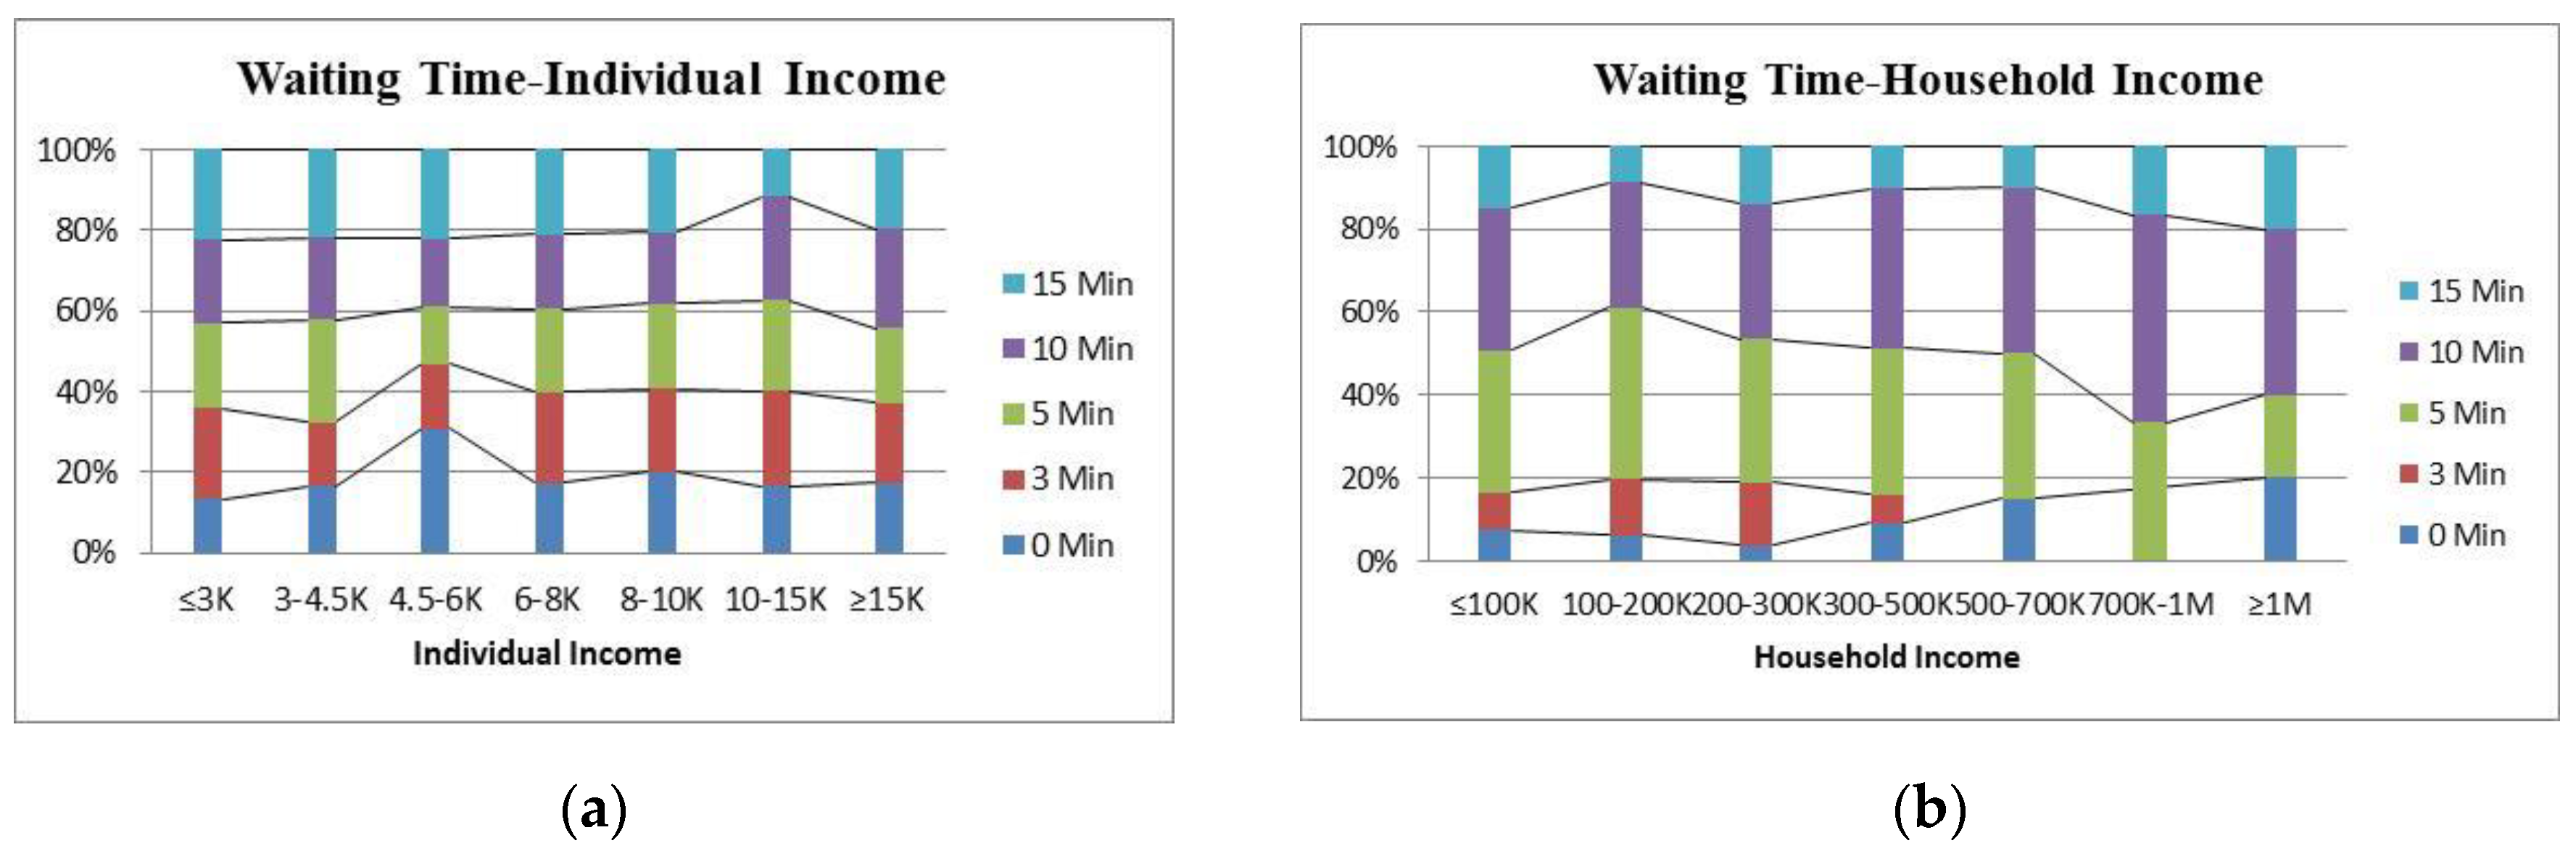
Figure A4. Relationship between diverting time of BEVs and individual income: (a) Relationship between waiting time and individual income. (b) Relationship between waiting time and household income.
Sustainability 11 03869 g0a4

Appendix C.2. PHEV Waiting Time

Figure A5. Relationships between the waiting time of PHEVs and significant variables. (a) Relationship between waiting time and vehicle number. (b) Relationship between waiting time and household income. (c) Relationship between waiting time and education level. (d) Relationship between waiting time and age.
Sustainability 11 03869 g0a5

Appendix C.3. BEV Waiting Time

Figure A6. Relationship between waiting time of BEVs and license number.
Sustainability 11 03869 g0a6

Appendix D. MNL Models for Obtained Electric Driving Range

Appendix D.1. PHEV Obtained Driving Range

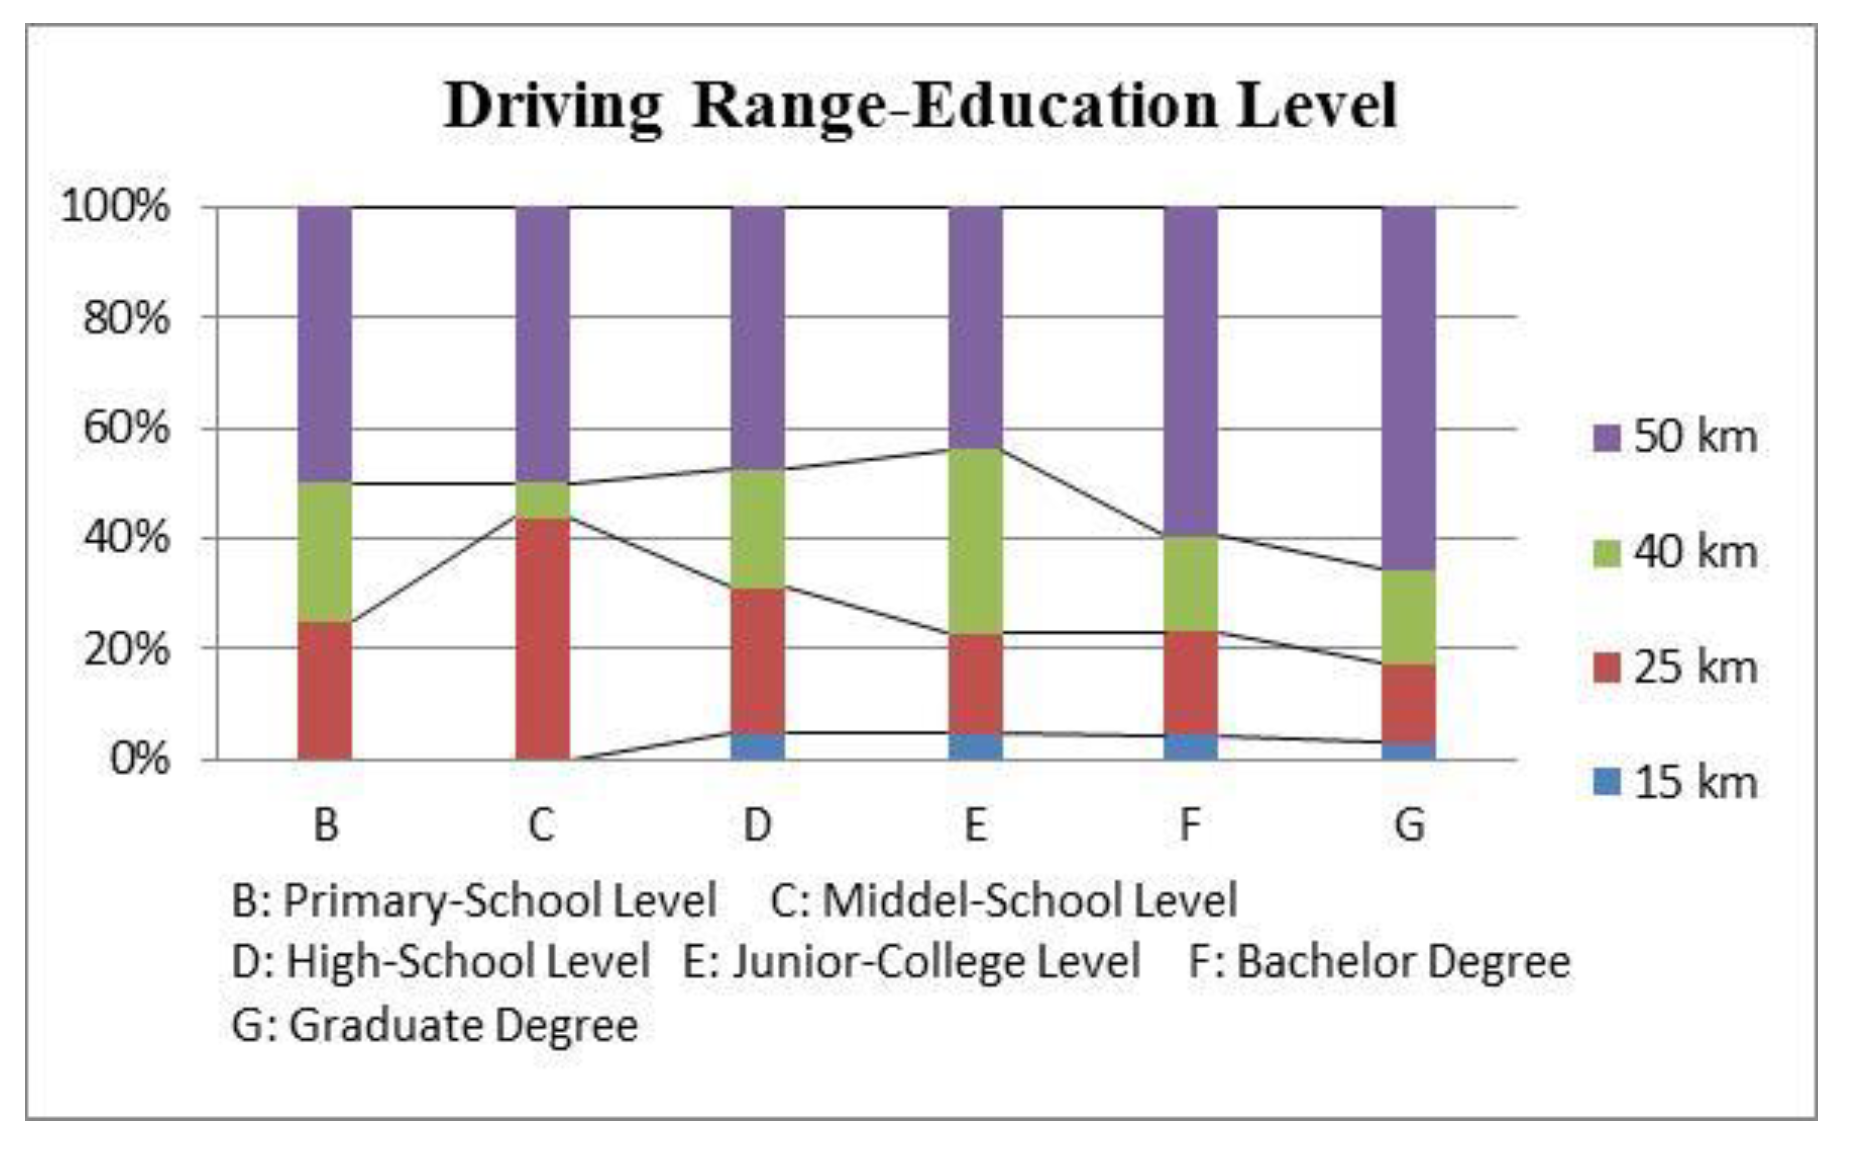
According to Table A2, the highest level of education is identified as a statistically significant variable for the obtained driving ranges of PHEVs. The relationship shown by Figure A7 suggests that people with higher level of education tend to choose either the highest (50 km) or lowest (10 km) driving ranges.
Table A2. MNL Model for obtained driving ranges of PHEVs.
PHEV Driving RangeCoef.Std. Err.zP > z[95% Conf.Interval]
Choice 1 = 15 km
Education−0.11930.226016−0.530.598−0.562280.323686
Constant−1.95571.314935−1.490.137−4.532920.621524
Choice 2 = 25 km
Education−0.32690.1105582.960.003−0.54359−0.11021
Constant0.7739350.6309991.230.22−0.46282.01067
Choice 3 = 40 km
Education−0.228580.1108752.060.039−0.44589−0.01127
Constant0.2916690.6400380.460.649−0.962781.546119
Note: Choice 4 (=50 km) is the base outcome
Figure A7. Relationship between PHEV driving range and education level.
Sustainability 11 03869 g0a7

Appendix D.2. BEV Obtained Driving Range

According to Table A3, the statistically significant factors for the obtained driving ranges of BEVs include sex, age, the number of vehicles owned and the highest level of education. The following conclusions can be made based on both Table A3 and Figure A8: (1) older people tend to have higher driving ranges (with Choices of 50 km, 80 km and 100 km), perhaps because their time values are relatively lower; (2) females have the tendency to choose either higher (100 km) or lower (25 km) driving ranges, rather than the middle-level range; (3) people with more vehicles are unlikely to choose the choices of 40 km or 80 km; (4) people with higher level of education are more willing to obtain relatively higher driving ranges (choices of 80 km and 10 km) as they may be more willing to use electricity for environmental purposes.
Table A3. MNL Model for obtained driving ranges of BEVs.
BEV Driving RangeCoef.Std. Err.zP > z[95% Conf.Interval]
Choice 1 = 25 km
VehicleNum−0.264710.458154−0.580.563−1.162670.633256
Sex1.1123410.4415822.520.0120.2468561.977825
Education0.0271770.211550.130.898−0.387450.441808
Age0.249490.2337151.070.286−0.208580.707563
Constant−3.219961.850266−1.740.082−6.846420.406491
Choice 2 = 40 km
VehicleNum−0.849280.2966272.860.004−1.43066−0.2679
Sex0.3397540.2831351.20.23−0.215180.894689
Education0.0363620.1266440.290.774−0.211850.284579
Age0.1981580.1469141.350.177−0.089790.486104
Constant0.9139181.1103880.820.41−1.26243.090238
Choice 3 = 50 km
VehicleNum−0.476070.27227−1.750.08−1.009710.057566
Sex0.2891160.2732681.060.29−0.246480.824711
Education0.3494210.1314662.660.0080.0917530.607089
Age0.4464530.1404443.180.0010.1711880.721718
Constant−2.242051.119828−20.045−4.43688−0.04723
Choice 4 = 80 km
VehicleNum−0.969990.4393152.210.027−1.83103−0.10895
Sex0.165350.40270.410.681−0.623930.954627
Education0.5613310.2186522.570.010.132780.989882
Age0.4455050.2095232.130.0330.0348490.856162
Constant−3.677941.829451−2.010.044−7.2636−0.09228
Choice 5 = 100 km
VehicleNum−0.282150.327767−0.860.389−0.924560.36026
Sex0.7738110.3212392.410.0160.1441951.403427
Education0.2137470.1585881.350.178−0.097080.524574
Age0.4034460.1678662.40.0160.0744340.732458
Constant−3.271651.364242−2.40.016−5.94552−0.59779
Note: Choice 6 (=150 km) is the base outcome
Figure A8. Results about obtained driving ranges of BEVs. (a) Relationship between driving range and sex. (b) Relationship between driving range and education level. (c) Relationship between driving range and vehicle number. (d) Relationship between driving range and age.
Sustainability 11 03869 g0a8

References

  1. Chen, X.; Zhang, H.; Xu, Z.; Nielsen, C.P.; McElroy, M.B.; Lv, J. Impacts of fleet types and charging modes for electric vehicles on emissions under different penetrations of wind power. Nat. Energy 2018, 3, 413–421. [Google Scholar] [CrossRef]
  2. Melton, N.; Axsen, J.; Sperling, D. Moving beyond alternative fuel hype to decarbonize transportation. Nat. Energy 2016, 1, 16013. [Google Scholar] [CrossRef]
  3. Zhuge, C.; Shao, C. Investigating the factors influencing the uptake of electric vehicles in Beijing, China: Statistical and spatial perspectives. J. Clean. Prod. 2019, 213, 199–216. [Google Scholar] [CrossRef]
  4. Shafie-khah, M.; Heydarian-Forushani, E.; Osório, G.J.; Gil, F.A.; Aghaei, J.; Barani, M.; Catalão, J.P. Optimal behavior of electric vehicle parking lots as demand response aggregation agents. IEEE Trans. Smart Grid 2016, 7, 2654–2665. [Google Scholar] [CrossRef]
  5. Amini, M.; Islam, A. Allocation of electric vehicles’ parking lots in distribution network. In Proceedings of the 2014 IEEE PES Innovative Smart Grid Technologies Conference (ISGT), Washington DC, USA, 19–22 February 2014; pp. 1–5. [Google Scholar]
  6. Li, G.; Zhang, X.-P. Modeling of plug-in hybrid electric vehicle charging demand in probabilistic power flow calculations. IEEE Trans. Smart Grid 2012, 3, 492–499. [Google Scholar] [CrossRef]
  7. Steen, D.; Carlson, O.; Bertling, L. Assessment of electric vehicle charging scenarios based on demographical data. IEEE Trans. Smart Grid 2012, 3, 1457–1468. [Google Scholar] [CrossRef]
  8. Zhuge, C.; Wei, B.; Dong, C.; Shao, C.; Shan, Y. Exploring the future electric vehicle market and its impacts with an agent-based spatial integrated framework: A case study of Beijing, China. J. Clean. Prod. 2019, 221, 710–737. [Google Scholar] [CrossRef] [Green Version]
  9. Zhuge, C.; Shao, C. Agent-based modelling of locating public transport facilities for conventional and electric vehicles. In Net. Sp. Econ. 2018, 18, 875–908. [Google Scholar] [CrossRef]
  10. Daina, N.; Sivakumar, A.; Polak, J.W. Electric vehicle charging choices: Modelling and implications for smart charging services. Transp. Res. Part C Emerg. Technol. 2017, 81, 36–56. [Google Scholar] [CrossRef]
  11. Daina, N.; Sivakumar, A.; Polak, J.W. Modelling electric vehicles use: A survey on the methods. Renew. Sustain. Energy Rev. 2017, 68, 447–460. [Google Scholar] [CrossRef]
  12. Corchero García, C. European Electric Vehicle Fleet: Driving and Charging Behaviors; X Congreso de la Asociación Española para la Economía Energética: Madrid, Spain, 2015; pp. 1–11. [Google Scholar]
  13. Robinson, A.; Blythe, P.; Bell, M.; Hübner, Y.; Hill, G. Analysis of electric vehicle driver recharging demand profiles and subsequent impacts on the carbon content of electric vehicle trips. Energy Policy 2013, 61, 337–348. [Google Scholar] [CrossRef] [Green Version]
  14. Zoepf, S.; MacKenzie, D.; Keith, D.; Chernicoff, W. Charging choices and fuel displacement in a large-scale demonstration of plug-in hybrid electric vehicles. Transp. Res. Rec. 2013. [Google Scholar] [CrossRef]
  15. Hill, G.; Blythe, P.T.; Hübner, Y.; Neaimeh, M.; Higgins, C.; Suresh, V. Monitoring and predicting charging behaviour for electric vehicles. In Proceedings of the 2012 IEEE Intelligent Vehicles Symposium (IV), Alcalá de Henares, Spain, 3–7 June 2012; pp. 914–919. [Google Scholar]
  16. Morrissey, P.; Weldon, P.; O’Mahony, M. Electric vehicle household charging behaviour in Ireland and aims for a carbon neutral electric fleet by 2020. World Rev. Intermodal Transp. Res. 2015, 5, 336–352. [Google Scholar] [CrossRef]
  17. Kim, S.; Yang, D.; Rasouli, S.; Timmermans, H. Heterogeneous hazard model of PEV users charging intervals: Analysis of four years charging transactions data. Transp. Res. Part C Emerg. Technol. 2017, 82, 248–260. [Google Scholar] [CrossRef]
  18. Kelley, S.; Kuby, M. On the way or around the corner? Observed refueling choices of alternative-fuel drivers in Southern California. J. Transp. Geogr. 2013, 33, 258–267. [Google Scholar] [CrossRef]
  19. Brey, J.J.; Brey, R.; Carazo, A.F.; Ruiz-Montero, M.; Tejada, M. Incorporating refuelling behaviour and drivers’ preferences in the design of alternative fuels infrastructure in a city. Transp. Res. Part C Emerg. Technol. 2016, 65, 144–155. [Google Scholar] [CrossRef]
  20. Kitamura, R.; Sperling, D. Refueling behavior of automobile drivers. Transp. Res. Part A Gen. 1987, 21, 235–245. [Google Scholar] [CrossRef]
  21. Sun, X.-H.; Yamamoto, T.; Morikawa, T. Fast-charging station choice behavior among battery electric vehicle users. Transp. Res. Part D Transp. Environ. 2016, 46, 26–39. [Google Scholar] [CrossRef]
  22. Bunzeck, I.; Feenstra, C.F.J.Y.; Paukovic, M. Preferences of Potential Users of Electric Cars Related to Charging—A Survey in Eight EU Countries. 2011. Available online: http://www.d-incert.nl/wp-content/uploads/2011/05/rapportage_ECN.pdf (accessed on 13 November 2017).
  23. DoE, U. Evaluating Electric Vehicle Charging Impacts and Customer Charging Behaviors—Experiences from Six Smart Grid Investment Grant Projects; Smart Grid Investment Grant Program: Washington, DC, USA, 2016; p. 12. [Google Scholar]
  24. Yang, Y.; Yao, E.; Yang, Z.; Zhang, R. Modeling the charging and route choice behavior of BEV drivers. Transp. Res. Part C Emerg. Technol. 2016, 65, 190–204. [Google Scholar] [CrossRef]
  25. Spoelstra, J. Charging Behaviour of Dutch EV Drivers. Master’s Thesis, Utrecht University, Utrecht, The Netherlands, 2014. [Google Scholar]
  26. Franke, T.; Krems, J.F. Understanding charging behaviour of electric vehicle users. Transp. Res. Part F Traffic Psychol. Behav. 2013, 21, 75–89. [Google Scholar] [CrossRef]
  27. Kelly, J.C.; MacDonald, J.S.; Keoleian, G.A. Time-dependent plug-in hybrid electric vehicle charging based on national driving patterns and demographics. Appl. Energy 2012, 94, 395–405. [Google Scholar] [CrossRef]
  28. Tal, G.; Nicholas, M.; Davies, J.; Woodjack, J. Charging Behavior Impacts on Electric Vehicle Miles Traveled: Who Is Not Plugging In? Transp. Res. Record 2014, 2454, 53–60. [Google Scholar] [CrossRef]
  29. Pearre, N.S.; Kempton, W.; Guensler, R.L.; Elango, V.V. Electric vehicles: How much range is required for a day’s driving? Transp. Res. Part C Emerg. Technol. 2011, 19, 1171–1184. [Google Scholar] [CrossRef]
  30. Dallinger, D.; Krampe, D.; Wietschel, M. Vehicle-to-grid regulation reserves based on a dynamic simulation of mobility behavior. IEEE Trans. Smart Grid 2011, 2, 302–313. [Google Scholar] [CrossRef]
  31. Mwasilu, F.; Justo, J.J.; Kim, E.-K.; Do, T.D.; Jung, J.-W. Electric vehicles and smart grid interaction: A review on vehicle to grid and renewable energy sources integration. Renew. Sustain. Energy Rev. 2014, 34, 501–516. [Google Scholar] [CrossRef]
  32. Greaves, S.; Backman, H.; Ellison, A.B. An empirical assessment of the feasibility of battery electric vehicles for day-to-day driving. Transp. Res. Part A Policy Pract. 2014, 66, 226–237. [Google Scholar] [CrossRef] [Green Version]
  33. Adamowicz, W.; Louviere, J.; Williams, M. Combining revealed and stated preference methods for valuing environmental amenities. J. Environ. Econ. Manag. 1994, 26, 271–292. [Google Scholar] [CrossRef]
  34. Kroes, E.P.; Sheldon, R.J. Stated Preference Method: An Introduction. J. Transp. Econ. Policy 1988, 22, 11–25. [Google Scholar]
  35. Wardman, M. A comparison of revealed preference and stated preference models of travel behaviour. J. Transp. Econ. Policy 1988, 22, 71–91. [Google Scholar]
  36. Bunce, L.; Harris, M.; Burgess, M. Charge up then charge out? Drivers’ perceptions and experiences of electric vehicles in the UK. Transp. Res. Part A Policy Pract. 2014, 59, 278–287. [Google Scholar] [CrossRef]
  37. Zhang, Q. The Number of BEVs in Beijing Exceeds 6000. 2014. Available online: http://www.bjrd.gov.cn/xwzx_1/xwkx/yfly/201412/t20141229_142058.html (accessed on 14 May 2015).
  38. Bierlaire, M. Discrete choice models. In Operations Research and Decision Aid Methodologies in Traffic and Transportation Management; Springer: New York, NY, USA, 1998; pp. 203–227. [Google Scholar]
  39. Krejcie, R.V.; Morgan, D.W. Determining sample size for research activities. Educ. Psychol. Meas. 1970, 30, 607–610. [Google Scholar] [CrossRef]
  40. Long, J.S. Regression Models for Nominal and Ordinal Outcomes. In The SAGE Handbook of Regression Analysis and Causal Inference; SAGE Publications Ltd.: London, UK, 2014; pp. 173–204. [Google Scholar]
  41. Arı, E.; Yıldız, Z. Paralel lines assumption in ordinal logistic regression and analyses aprroaches. Int. Interdiscip. J. Sci. Res. 2013, 1, 8–23. [Google Scholar]
  42. Williams, R. Ordinal regression models: Problems, solutions, and problems with the solutions. In Proceedings of the German State User Group Meetings, Indianapolis, Indiana, 22 June 2008; Available online: http://www.stata.com/meeting/germany08/GSUG2008-Handout (accessed on 13 March 2019).
  43. Stata, Mlogit—Multinomial (polytomous) Logistic Regression. 2016. Available online: http://www.stata.com/manuals13/rmlogit.pdf (accessed on 22 March 2016).
  44. Hosmer, D.W.J.; Lemeshow, S. Applied Logistic Regression; John Wiley & Sons: Somerset, NJ, USA, 2004. [Google Scholar]
  45. Long, J.S.; Freese, J. Regression Models for Categorical Dependent Variables Using Stata; Stata Press: College Station, TX, USA, 2006. [Google Scholar]
  46. Kangur, A.; Jager, W.; Verbrugge, R.; Bockarjova, M. An agent-based model for diffusion of electric vehicles. J. Environ. Psychol. 2017, 52, 166–182. [Google Scholar] [CrossRef] [Green Version]
  47. Department-for-Transport. Driving licence holding and vehicle availability. In National Travel Survey: 2010; Department for Transport: London, UK, 2010. [Google Scholar]
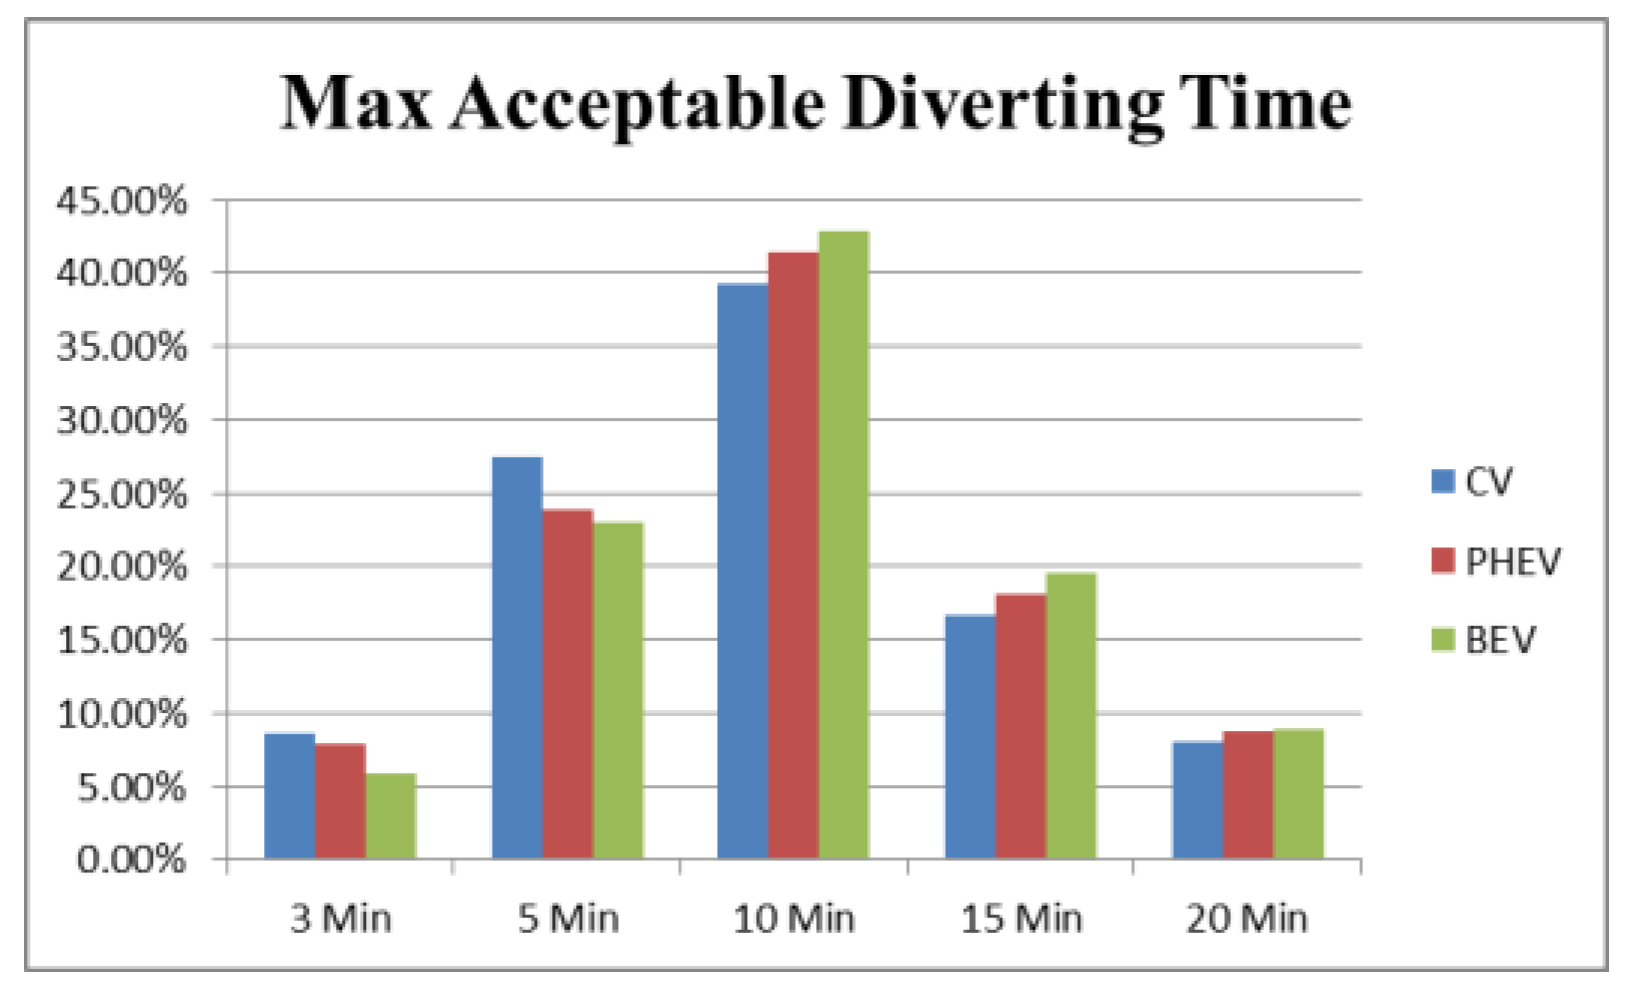
Figure 1. Distribution of max acceptable diverting time.
Sustainability 11 03869 g001
Figure 2. Distribution of max acceptable waiting time.
Sustainability 11 03869 g002
Figure 3. Refuelling modes of CV and PHEV (a) Distribution of refuelling modes; (b) Distribution of refuelling cost (RMB).
Sustainability 11 03869 g003
Figure 4. Distribution of obtained electric driving ranges (a) PHEV; (b) BEV.
Sustainability 11 03869 g004
Table 1. Design of questionnaire.
QuestionnaireQuestion TypesDescription
Part 1Individual attributesSex, age, individual monthly income, highest level of education and job type
Household attributesHousehold income per year, number of driving licenses, number of children, number of vehicles owned, number of household members
Part 2Maximum acceptable diverting timeMaximum acceptable diverting time to reach a station for en route refuelling of CV, BEV and PHEV (five choices: 3, 5, 10, 15 and 20 min)
Maximum acceptable waiting timeMaximum acceptable waiting time at a station for en route refuelling of CV, BEV and PHEV (five choices: 0, 3, 5, 10 and 15 min)
Refuelling modesRefuelling modes of CV and PHEV (three choices: Full refuelling, refuelling with a specific cost and refuelling with a specific amount of fuel)
Obtained electric driving rangesObtained electric driving ranges of PHEV and BEV (choices for PHEV:15, 25, 40 and 50 km; choices for BEV: 25, 40, 50, 80, 100 and 150 km)
Table 2. MNL models for max acceptable diverting time.
Diverting TimeCVPHEVBEV
Coef.z valueCoef.z valueCoef.z value
Choice 1 = 3 Min
Age−0.41963−1.52
Education−0.06046−0.31
Indincome0.2891932.02
Sex0.3169250.65
HouIncome−0.03938−0.23
Constant0.1785040.330.2267330.2−0.70037−0.59
Choice 2 = 5 Min
Age0.1494890.82
Education0.1157990.71
Indincome0.0016160.02
Sex0.3013930.84
HouIncome−0.304662.06
Constant2.0504394.60.3478920.370.0214030.02
Choice 3 = 10 Min
Age0.0738440.43
Education0.0693610.46
Indincome0.1158781.19
Sex0.3742971.11
HouIncome−0.12912−0.93
Constant1.9520584.561.1624341.340.3493940.43
Choice 4 = 15 Min
Age−0.1961−1
Education0.3750282.08
Indincome0.264722.45
Sex0.2003190.53
HouIncome−0.01908−0.13
Constant0.7923921.67−1.44664−1.370.0642710.07
Note: Choice5 (=20 Min) is the base outcome
Table 3. MNL Models for max acceptable waiting time.
Waiting TimeCVPHEVBEV
Coef.z valueCoef.z valueCoef.z value
Choice 1 = 0 Min
Age−0.35043−1.52
Education−0.459732.26
Indincome−0.02223−0.16
Sex−0.25702−0.56
HouIncome0.1207990.60.2702531.46
LicenseNum1.2876132.05
VehicleNum1.0448632.3
Constant−0.47787−0.53−0.50472−0.32−3.59372−2.73
Choice 2 = 3 Min
Age0.3974412
Education0.271181.34
Indincome0.2689052.08
Sex0.326380.85
HouIncome−0.429752.15−0.376011.99
LicenseNum−0.35033−0.47
VehicleNum0.2571440.61
Constant−0.42191−0.53−3.12404−1.95−0.08429−0.06
Choice 3 = 5 Min
Age0.0925180.62
Education0.1092570.77
Indincome0.1351351.33
Sex0.1440330.46
HouIncome−0.17409−1.16−0.12539−0.98
LicenseNum−0.35033−0.66
VehicleNum0.3602561.16
Constant0.8961021.42−0.73415−0.651.1904571.1
Choice 4 = 10 Min
Age0.0612020.42
Education0.0356780.26
Indincome0.1588561.55
Sex0.3668781.17
HouIncome−0.07556−0.5−0.00768−0.06
LicenseNum−0.25906−0.51
VehicleNum0.3124461.04
Constant0.1164740.18−0.25658−0.241.1889571.14
Note: Choice5 (=15 Min) is the base outcome