Article

The Three Musketeers Relationships between Hong Kong, Shanghai and Shenzhen Before and After Shanghai–Hong Kong Stock Connect

by
Andy Wui-Wing Cheng
1,
Nikolai Sheung-Chi Chow
2,*,
David Kam-Hung Chui
1 and
Wing-Keung Wong
1,3,4
1
Department of Economics and Finance, The Hang Seng University of Hong Kong, Hong Kong
2
Research School of Economics, Australian National University, Canberra 0200, Australia
3
Department of Finance, Fintech Center, and Big Data Research Center, Asia University, Taichung 41354, Taiwan
4
Department of Medical Research, China Medical University Hospital, Taichung 41354, Taiwan
*
Author to whom correspondence should be addressed.
Sustainability 2019, 11(14), 3845; https://doi.org/10.3390/su11143845
Submission received: 10 June 2019 / Revised: 8 July 2019 / Accepted: 9 July 2019 / Published: 15 July 2019

Abstract

:
This study examines the sustainability of financial integration between China (represented by Shenzhen and Shanghai) stock markets and Hong Kong stock market over the period of pre and post launch of the Stock Connect Scheme. This paper aims to fill the gap in the financial literature by providing empirical research on the dynamics of the financial integration process, and examining the sustainability of financial integration among the three Chinese stock markets. We apply cointegration and both linear and nonlinear causalities to investigate whether the Shanghai–Hong Kong Stock Connect has any impact on both market capitalizations and market indices of Hong Kong, Shanghai, and Shenzhen markets. Through cointegration tests and linear Granger causality techniques, it was found that the stock markets from mainland China are increasingly influencing the Hong Kong stock market after the introduction of the Stock Connect Scheme; however, when using nonlinear Granger causality analysis for confirming China market dominance, the result shows an reverse relationship whereby the Hong Kong stock market is still relevant to understand and predict China stock market after the introduction of the Stock Connect Scheme. Overall, our findings support the view that the Shanghai–Hong Kong Stock Connect has a significant impact on both market capitalizations and market indices of the Hong Kong, Shanghai, and Shenzhen markets, but Hong Kong stock market is still relevant to understand and predict China stock market after the introduction of the Stock Connect Scheme. The change in share premium difference between mainland China’s domestic A-share markets and Hong Kong’s H-share market could change investors’ appetites or sentiments. Further research includes examining whether there is any functional relationship including nonlinear relationship and studying the dynamic drivers of the relationships.

1. Introduction

Stock market integration is an area of considerable interest and debate among academics and market practitioners. With regard to mainland China, where there has been continuous financial reform in terms of market deregulation and an aggressive pro-growth strategy, integration with neighboring markets has intensified, and whether integration can sustain better, in particular with Hong Kong. Given their economic similarities, the financial integration of mainland China’s stock markets, Shanghai and Shenzhen, and that of Hong Kong has made remarkable progress over the past 10 years. In 2002 and 2006, the China Securities Regulatory Commission (CSRC) took to the airwaves, preempting the global financial media, to announce the Qualified Foreign Institutional Investor (QFII) and Qualified Domestic Institutional Investor (QDII) schemes respectively. The QFII scheme, under the existing restricted flow of capital accounts in China, allows qualified investors to invest in certain security products in China. In May 2007, the QDII scheme, which initially permitted Chinese institutions and residents to invest in fixed-income and money-market products overseas, was widened to include equity products in designated stock markets. These two arrangements have further increased the integration of mainland China and Hong Kong. The latter, the stock market of which is ranked as the seventh largest in the world and the third largest in Asia in terms of market capitalization (The World Federation of Exchanges and Bloomberg, June 2017), is a Special Administrative Region of China and a major financial center. Moreover, Hong Kong is committed to strengthening financial integration among the stock markets in China and make the integration sustains better. Financial theory suggests that an integrated regional market performs more efficiently than segmented individual market. Member markets can enhance the efficient allocation of capital in regions where the funding requirement is greatest. The attraction of cross-border fund flows is that they can improve the markets’ liquidity and lower the cost of capital for firms [1]. The study on presence of herd formation in Chinese markets supports rational asset pricing models and market efficiency [2]. The general cointegration relationship between the prices of H-shares and A-shares, which are cross-listed Chinese stocks in both markets, across January 1999 to March 2009. It is found that significant improvements in the long-run expectation of H-share discounts compared with A-shares, the level of short-run co-movements in prices, and the magnitude of error corrections [3]. By applying stock market capitalization as a measure to identify countries that are taking the lead in establishing an integrated stock market in the Asia–Pacific region, the authors conclude that China and Hong Kong are the potential market leaders among other advanced equity markets (Japan, Australia, Singapore, and New Zealand). The reason is that China and Hong Kong exhibit unidirectional causality toward the other markets [4]. There is an increase in market integration among the different stock markets in the Greater China region, (China, Hong Kong, and Taiwan) from July 1993 to June 2013. Further, less volatile and sensitive responsiveness indicate improved stock market efficiency among the markets due to improved regulatory frameworks and better macroprudential policies, thereby enabling the more efficient absorption of market information [5].
The economies of Shanghai, Shenzhen, and Hong Kong constitute one of the most dynamic economic zones in the region. With closer trade and financial interaction, such as the QFII, QDII, RQFII, and RQDII (the Renminbi QFII and the Renminbi QDII respectively), the Shanghai–Hong Kong Stock Connect in 2014, and the Shenzhen–Hong Kong Stock Connect arrangement in 2016, the interaction of the Chinese stock markets has become a topic of global interest. However, there is a need for additional analysis regarding the nature and strength of these financial linkages. Although considerable researches have been conducted to investigate financial integration among East Asian countries and the effects on other world markets, little work has been conducted on the important aspect of financial linkages within China and the sustainability of financial integration within China. Further, given the geographic and economic closeness between the two regions of mainland China and Hong Kong, each of which could have significant influence over the other through increasing interaction [6,7], the current study fills the gap in the financial literature by providing empirical research on the dynamics of the financial integration process and examine the sustainability of financial integration among the three Chinese stock markets. In addition, this study enables us to discover the market leader within the country. The identification of the potential market leader can help policymakers to ensure policy coordination, enhance market development, and maintain market stability in the event of financial turmoil among the three stock markets. Given the decreasing benefit of diversification among these markets, this study is also of interest to investment practitioners when they allocate assets. The ‘Stock Connect’ Scheme appeared to provide a turning point in China’s financial market development. It represents a remarkable move to the quality and sustainability of the growth for China’s stock markets. The long-term objective of the scheme is to reorient growth to make it more balanced and more sustainable from different perspectives, such as market structure, connections with international practices and investors. It is a promising sign of push for reform to increase foreign investors’ access to China’s capital markets. Each of these moves had broader significance for ensuring a continue development and sustainable growth through policy reforms.
In this study, we use cointegration, linear and nonlinear causalities to investigate whether the Shanghai–Hong Kong Stock Connect has any impact on the market capitalizations and market indices of the Hong Kong, Shanghai, and Shenzhen markets. Our study deviates from the time series of the literature, which primarily examine nonlinear causal relationships using nonlinear causality tests. The nonlinear causality test can detect a nonlinear deterministic process that originally "looks" random. The nonlinear causality test used in the current study could be considered a complementary test for the linear causality test because the latter cannot detect a nonlinear type of causal relationship. The nonparametric approach adopted in this study can capture the nonlinear nature of the relationship between stock markets. The approach would not be mis-specified if the two variables, market capitalization and market index, are related nonlinearly or if regime changes (structural breaks) occur due to a crisis. We will discuss this issue further in the methodology section.
The remaining of the paper is structured as follows. Section 2 provides background information on the Shanghai–Hong Kong Stock Connect scheme. In Section 3, we present a review of the relevant literature regarding financial integration. The limitations of these studies are also noted. Section 4 describes the data and the methodology. The empirical results regarding both linear and nonlinear causality among various stock markets are discussed in Section 5. Section 6 concludes the paper.

2. Characteristics of the Shanghai–Hong Kong Stock Connect

The year 2015 marked a breakthrough in the Chinese and Hong Kong stock markets. The implementation of the Shanghai–Hong Kong Stock Connect allowed international investors direct access to the Shanghai stock market through the Hong Kong Stock Exchange. This initiative enables northbound and southbound trading within aggregate quotas of RMB300 billion and RMB250 billion, respectively. The quotas are calculated on a netting basis at the end of each trading day. Under the scheme, the daily quotas set a limit for daily net buy value of cross-boundary trades. The northbound daily quota is around RMB13 billion, while the southbound daily quota is around RMB10.5 billion. Under the scheme, except B-shares and shares included on the Risk Alert Board, investors can trade certain stocks listed on the Shanghai Stock Exchange that are not included as constituent stocks of the relevant indices but have corresponding H-shares listed in Hong Kong. The scheme also indicates that only mainland institutional investors and individual investors who have RMB500,000 in their accounts are allowed to trade stocks of the Hang Seng Composite Large Cap Index and Hang Seng Composite MidCap Index together with all H-shares that are not stocks of the relevant indices but have corresponding A-shares listed in Shanghai, except for those not traded in Hong Kong dollars and H-shares that are not listed in Shanghai. The Shanghai–Hong Kong Stock Connect helps to create a “single” stock market that ranks as the second and third largest worldwide in terms of market capitalization and turnover value respectively.

3. Literature Review

The first study in this area date back to the late 1980s and early 1990s, which apply the cointegration model to study the relationship between two stock markets [4,8,9,10]. Following this research, a substantial number of studies have focused on the degree of integration among different markets within geographic regions and the connections between international markets. The study on international stock-price linkages and co-movements of fundamentals within a multivariate cointegration framework finds that a common stochastic trend in the US, Canada, Germany, Japan, and the UK [11]. While studying the stock market linkages of a group of Pacific-Basin countries with US and Japan by estimating the multivariate cointegration model, it is suggested that the relaxation of the restrictions might have strengthened international market interrelations [12]. Furthermore, the four markets in Latin America (Argentina, Brazil, Chile, and Mexico), together with the US stock market, have significant permanent components that cause cointegration in the long run [13]. In other direction, the transmission of shocks between the U.S. and foreign markets to delineate interdependence from contagion of the US financial crisis by constructing shock models for partially overlapping and non-overlapping markets is examined [14]. The center of gravity within stock market integration studies has also moved from the markets in the Western hemisphere to the market linkages in Asian emerging markets, particularly for the periods before and after the 1997–98 Asian financial crisis. For example, the dynamic linkages of Asian stock markets before and after the crisis are examined. It is revealed that the relationships among East Asian stock markets are time-varying; for instance, Hong Kong and Singapore responded significantly sooner to the financial turmoil that was occurring in most Asian markets. More importantly, the empirical findings about the degree of stock market integration vary [15,16,17,18]. The linkages among the Southeast Asian stock markets are examined too and it is found that no evidence of a long-term relationship among the stock markets from 1988 to 1997; however, the degree of integration increases when the author conducts a correlation analysis. The results show that the returns of Indonesia, the Philippines, and Thailand were closely affected by the Singaporean market [19]. The long-term equilibrium relationships and short-term causality effects among stock markets in the US, Japan are investigated, and 10 other Asian economies, including Hong Kong, from January 1995 to May 2001. It is found that cointegration relationships both before and after the Asian financial crisis. Further, it is concluded that the degree of integration within the region increased after the crisis [20]. The degree of financial integration among selected East Asian countries from 1988 to 2006 by applying the panel unit root and cointegration approach is investigated too. The results show that high-income countries have better financial integration than middle-income countries and the sustainability of financial integration is better for high-income countries than middle-income countries [21]. The stock market integration in Asia is examined and it is found that the degrees of integration between mature and emerging equity markets differ. It is also shown that individual stock markets in Asia are more sensitive to regional events compared with global events. The difference in mature and emerging equity markets is mainly due to political, economic, and institutional issues [22]. As we can see, the above studies have a common characteristic: the comparisons are focused on different nations from a cross-country border perspective. Moreover, few studies have investigated different economies within China. The current study focuses on this less-visited field and fills the gap in the literature.
Nevertheless, there are a few related studies. The causal linkages among the Shanghai, Shenzhen, and Hong Kong stock markets are examined and it is found that the stock index series is non-stationary and that cointegrating vectors and error correction models do not exist for the index series. It is concluded that Granger causality shows a positive feedback mechanism from Shenzhen to Shanghai, while Hong Kong causes volatility in Shanghai but not vice versa [23]. By employing the daily values of the stock-price indices for the Shanghai, Shenzhen, and Hong Kong markets from 1992 to 2002, potential gains of intermarket timing for Hong Kong investors are found [24]. The financial integration in the Greater China region (China, Taiwan, and Hong Kong) is examined, it is indicated that a trend of increasing financial interaction in the region [25]. The China’s A-share market and Hong Kong’s stock market are closely integrated; however, there is little evidence to link them to the world market [26,27,28]. A similar study shows that at the time of their research, there was a spillover effect between the markets in the region and that the Chinese market was affected by its neighbors [7].
The impact of the Shanghai–Hong Kong Stock Connect is examined by using a pairwise linear causality test to check linear causal relationships between the closing prices of the SSE Composite Index and the Hong Kong Hang Seng Index (HSI). The authors find that the SSE takes a leading role after the implementation of Stock Connect Scheme [29]. The A- and H-share premium puzzle is investigated from the perspective of the effect of the Shanghai–Hong Kong Stock Connect policy. It is shown that the Shanghai–Hong Kong Stock Connect policy is effective at reducing the A- and H-share price gap [30]. A model of trading costs to consider the effect of the introduction of the Shanghai–Hong Kong Stock Connect is applied. It is found that the SSE, which may have had lower trading costs than those of the Hong Kong Stock Exchange, seems to have developed higher trading costs in the period leading to the Stock Connect’s introduction [31]. The variations in dependence and risk spillover between Chinese and London stock markets before and after Shanghai–Hong Kong Stock Connect and Shenzhen–Hong Kong Stock Connect are investigated, it is found that Shanghai–Hong Kong Stock Connect program enhances the dependence between Chinese and London stock markets, while the overall dependence decreases slightly after the Shenzhen–Hong Kong Stock Connect program [32].

4. Data and Methodology

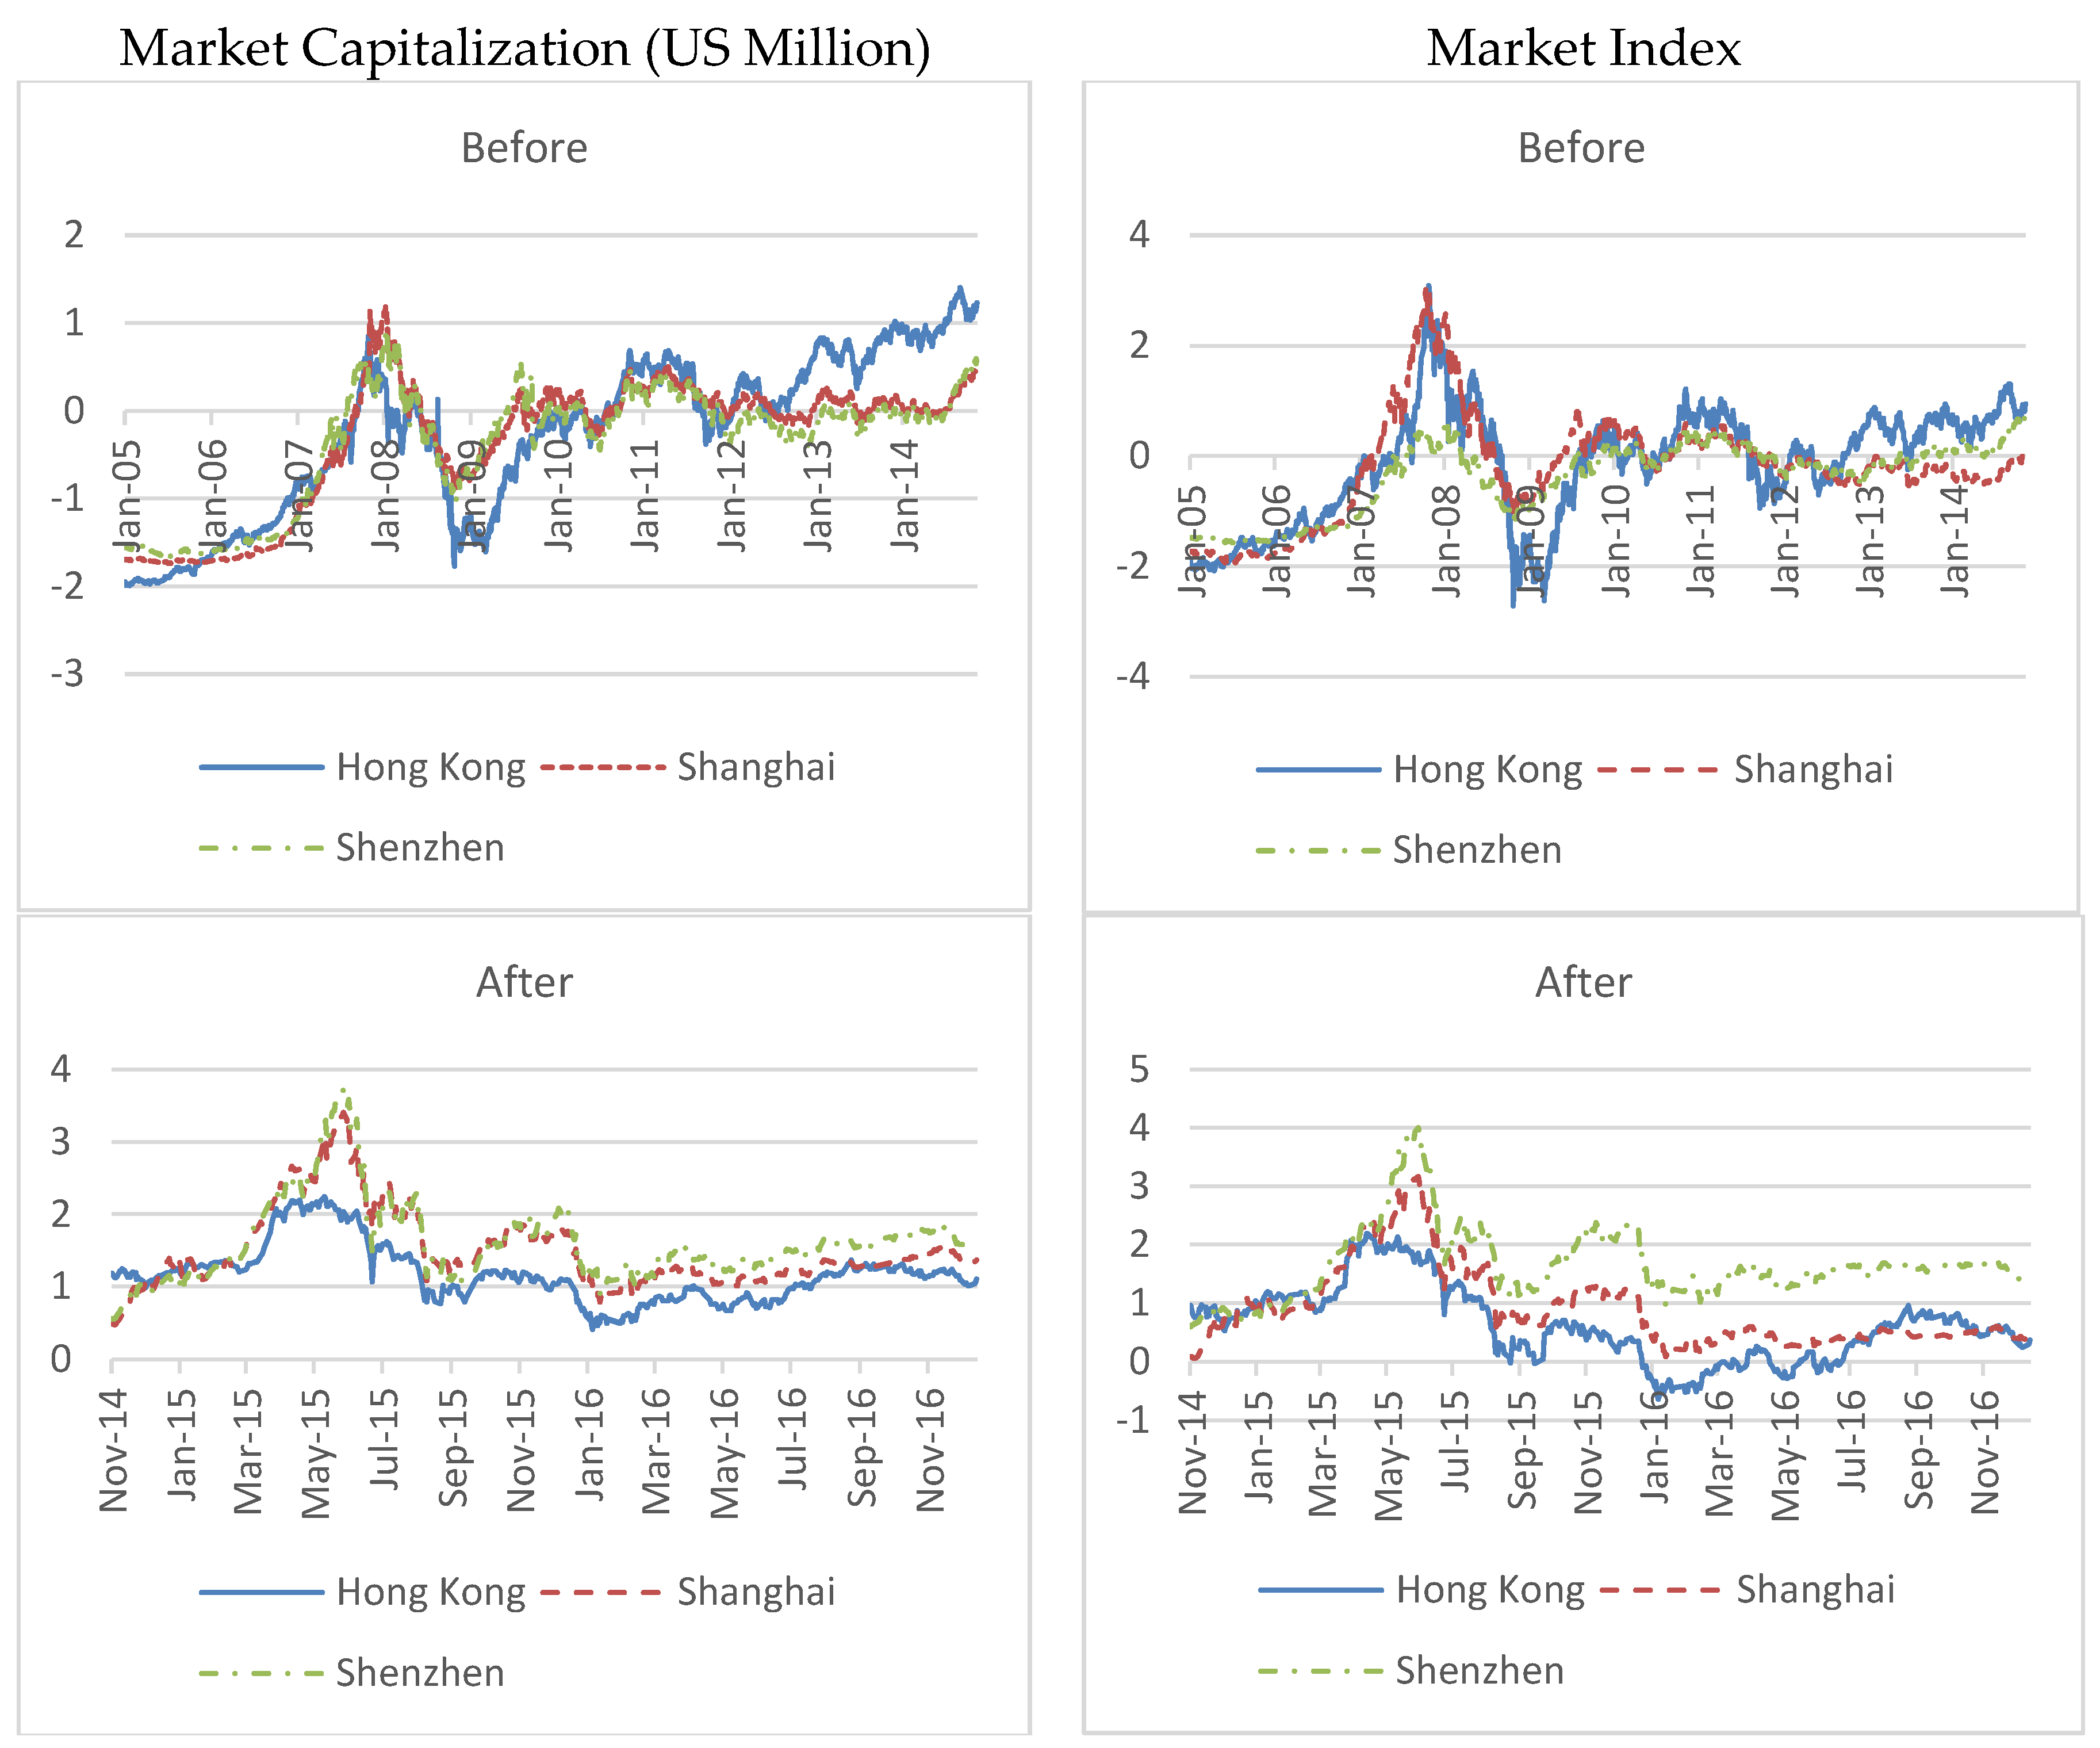
4.1. Data Description

We use the daily stock market capitalizations and market indices of Hong Kong, Shanghai, and Shenzhen from January 2005 to December 2016, a total of 2817 observations. The data employed in the analysis is obtained from Bloomberg Financial Services. The data is divided into the following two data sets: 1) the “before” period from January 2005 to November 2014, which is the period before the Shanghai–Hong Kong Stock Connect, and 2) the “after” period from November 2014 to December 2016, which is the period after the Shanghai–Hong Kong Stock Connect. The starting point in 2005 marked an important milestone for Chinese stock market reform because it was then that China started changing its state-owned securities into tradable shares.
Table 1 shows the descriptive statistics for the three markets before and after the introduction of the Shanghai–Hong Kong Stock Connect. Hong Kong has the largest market capitalization and market index in both periods. The Shanghai stock market has the largest standard deviation for market capitalization and Hong Kong has the largest standard deviation for market index. In addition, market capitalization and market index are skewed in both periods. Excess kurtosis is deemed to be kurtosis greater than 3 for both of the variables and all markets, except for the variables of Hong Kong and Shenzhen in the “before” period and Hong Kong’s market index in the “after period.” We use the Jarque–Bera (JB) test to examine whether the data are normally distributed. Both market capitalization and market index are rejected to be normally distributed in both of the periods and all markets.
The normalized time series for market capitalizations and market indices in the three markets for both periods are plotted in Figure 1. The figure shows that the variables are moving closer after the introduction of the Shanghai–Hong Kong Stock Connect in November 2014.

4.2. Methodology

4.2.1. Cointegration

We conduct bivariate and multivariate cointegration for our variables. In order to estimate the long-run relationship between x t and y t , we first employ the following simple cointegration:
y t = β 0 + β 1 x t + e t ,
where y t represents either the Hong Kong stock index or its market capitalization, x t represents either the stock index or its market capitalization in Shanghai or the Shenzhen stock markets, and e t is the residual for t = 1 ,   ,   T . The test examines the residuals in regression (1) of I (1) variables. If x t and y t are I (1) and cointegrated, e t is I (0). This finding means that the error term is stationary. Integration implies that a long-term linear relationship exists between series x t and y t .
In order to establish whether there is any cointegration relationship between the two vectors of the time series, we use three variables: x t = ( x 1 , t ,   x 2 , t ) and y t = ( y t ) , where y t represents either the Hong Kong stock index or its market capitalization, x 1 , t represents either the Shanghai stock index or its market capitalization, and x 2 , t represents either the Shenzhen stock index or its market capitalization. If all the variables ( x 1 , t , x 2 , t , y t ) are integrated in degree one, academics and practitioners will be interested to examine whether any cointegration relationship exists among them. In order to analyze this issue, we employ the Johansen cointegration test to estimate the cointegrating vectors [33,34,35]. According to Johansen’s procedure, the p-dimensional unrestricted vector autoregression (VAR) model should be first specified with k lags as follows:
Z t = 1 k A i Z t i + Ψ D t + U t ,  
where Z t = [ x 1 , t ,   x 2 , t , y t ] is a 3   ×   1 vector of stochastic variables, D t is a vector of dummies, and A i is an n × n matrix. If U t is found to be a vector of I (0) residuals, a vector error correction model (VECM) could be constructed as follows:
Δ Z t = 1 k 1 Φ i Δ Z t 1 + Π Z t 1 + Ψ D t + U t .  
The hypothesis of cointegration is formulated as a reduced rank of the Π matrix. If the rank of Π (r) is less than or equal to 2, such that Π = α β and Π Z t 1 ~ I ( 0 ) , r cointegrating vectors exist in β and the last (3-r) columns of the speed adjustment coefficients or loadings in α are zero [10]. Therefore, the matrix β Z t constitutes r cointegrating equations and β Z t 1 represents r disequilibrium error terms.
In order to conduct the cointegration test, we employ the likelihood ratio (LR) reduced rank test for the null hypothesis of, at most, r cointegrating vectors, which is given by the trace statistic, λ t r a c e . Moreover, the null hypothesis of r against the alternative of r–1 cointegrating vectors is known as the maximal eigenvalue statistic, λ m a x , as shown in the following:
λ t r a c e = T i = r + 1 n ln ( 1 λ i ) ,   λ m a x = T ln ( 1 λ i ) ,  
where λ i > > λ 3 denotes three eigenvalues of the corresponding eigenvectors.

4.2.2. Linear Granger Causality

If two I (1) vectors, x t and y t , are cointegrated, the following error-correction mechanism (ECM) should be used to test Granger causality between the variables of interest:
( Δ x t Δ y t ) = ( A x [ 2 × 1 ] A y [ 1 × 1 ] ) + ( A x x ( L ) [ 2 × 2 ] A x y ( L ) [ 2 × 1 ] A y x ( L ) [ 1 × 2 ] A y y ( L ) [ 1 × 1 ] ) ( Δ x t 1 Δ y t 1 ) + ( α x [ 2 × 1 ] α y [ 1 × 1 ] ) e c m t 1 + ( e x , t e y , t ) ,  
where e c m t 1 is lag 1 of the error correction term, α x [ 2 × 1 ] and α y [ 1 × 1 ] are the coefficient vectors for the error correction term e c m t 1 , and Δ x t = ( Δ x 1 , t ,   Δ x 2 , t ) and Δ y t = ( Δ y t ) are the corresponding stationary differencing series. There are now two sources of causation of y t ( x t ) by x t ( y t ) , either through the lagged dynamic terms, Δ x t 1 ( Δ y t 1 ) , or through the error correction term, e c m t 1 . Thereafter, the null hypothesis, H 0 : A x y ( L ) = 0 ( H 0 : A y x ( L ) = 0 ) and/or H 0 : α x = 0 ( H 0   :   α y = 0 ) , can be tested to identify the Granger causality relationship using the LR test. We will discuss testing the null hypotheses, H 0 1 : A x y ( L ) = 0 and H 0 2 :   A y x ( L ) = 0 , when two I (1) vectors, x t and y t , are not cointegrated.
However, if two I (1) vectors, x t and y t , are not cointegrated, the following VAR model should be used to test Granger causality between the variables of interest:
( Δ x t Δ y t ) = ( A x [ 2 × 1 ] A y [ 1 × 1 ] ) + ( A x x ( L ) [ 2 × 2 ] A x y ( L ) [ 2 × 1 ] A y x ( L ) [ 1 × 2 ] A y y ( L ) [ 1 × 1 ] ) ( Δ x t 1 Δ y t 1 ) + ( e x , t e y , t ) ,  
where all the terms are defined in Equation (1). Testing the linear causality relationship between x t and y t is equivalent to testing the following null hypotheses: H 0 1 : A x y ( L ) = 0 and H 0 2 :   A y x ( L ) = 0 . There are four different situations for the causality relationships between x t and y t in (4): (a) rejecting H 0 1 but not rejecting H 0 2 implies a unidirectional causality from y t to x t , (b) rejecting H 0 2 but not rejecting H 0 1 implies a unidirectional causality from x t to y t , (c) rejecting both H 0 1 and H 0 2 implies the existence of feedback relations, and (d) not rejecting both H 0 1 and H 0 2 implies that x t and y t are not rejected as independent [36,37,38].

4.2.3. Nonlinear Granger Causality

The linear Granger causality test discussed in Section 4.2.2 is based on the assumption that the relationship between the variables is linear. In order to further investigate whether any nonlinear relationship exists between vectors x t and y t , we conduct a nonlinear causality test [36,37]. Evidence of nonlinear relationships between stock markets is found in various studies. For example, The evidence of significant nonlinear dependence in stock markets is found [39,40]. It is explained that the complex and chaotic dynamics are likely to emerge in different parts of an economic system [40]. Further, the pattern between different objectives may appear random following many statistical tests; however, a more effective result may be achieved by using tests that consider the possibility of a nonlinear pattern. Therefore, some nonlinear models have been developed in studies relating to economics and finance. For example, it is noticed that the nonlinear structure in stock-price movements is motivated by asset behavior that follows nonlinear models [41]. A nonparametric test is developed to detect the nonlinear causal relationship between two variables [42]. The nonlinear causality test to the multivariate setting is extended [36,37], and the test is further extended to panel data [38]. Nonlinear Granger causality are also applied by some other scholars [43,44].
In order to identify any nonlinear Granger causality relationship from any two vector series, x t = ( x 1 , t ,   x 2 , t ) and y t = ( y t ) , we first use the linear model for { x t } and { y t } to identify their linear causal relationships and obtain the corresponding residuals, { ε ^ 1 t } and { ε ^ 2 t } . Thereafter, we apply a nonlinear Granger causality test to the residual series, { ε ^ 1 t } and { ε ^ 2 t } , of the two examined variables to identify the remaining nonlinear causal relationships between their residuals. We denote X t = ( X 1 , t , , X n 1 , t ) and Y t = ( Y 1 , t , , Y n 2 , t ) to be the corresponding residuals of any two vectors of the examined variables.
We first define the lead vector and lag vector of a time series, say X i , t , as follows: for
X i , t ,   i = 1 , , n 1 , the m x i -length lead vector and the L x i -length lag vector of X i , t are
X i , t m x i ( X i , t , X i , t + 1 , , X i , t + m x i 1 ) , m x i = 1 , 2 , , t = 1 ,   2 ,   , and
X i , t L x i L x i ( X i , t L x i , X i , t L x i + 1 , , X i , t 1 ) , L x i = 1 ,   2 ,   ,   t = L x i + 1 , L x i + 2 , ,
respectively. We denote M x = ( m x 1 , , m x n 1 ) , L x = ( L x 1 , , L x n 1 ) ,   m x = max ( m x 1 , , m n 1 ) , and l x = max ( L x 1 , , L x n 1 ) .
The m y i -length lead vector, Y i , t m y i , the L y i -length lag vector, Y i , t L y i L y i , of Y i , t , and M y , L y ,   m y , and l y can be defined similarly.
Using this modeling approach, we extend [36,37,42,45] to derive the following statistic,
H = n ( C 1 ( M x + L x , L y , e , n ) C 2 ( L x , L y , e , n ) C 3 ( M x + L x , e , n ) C 4 ( L x , e , n ) ) ,  
to test the null hypothesis, H 0 , that Y t = ( Y 1 , t , , Y n 2 , t ) does not strictly Granger cause X t = ( X 1 , t , , X n 1 , t ) . [37,38] have more information on the test statistic.

5. Empirical Results and Discussion

5.1. Unit Root Test

We employ the classical unit root augmented Dickey–Fuller (ADF) test to examine whether there is any unit root in the market capitalizations and the market indices for the “before” and “after periods” and for all markets by taking into consideration the following conditions: “without a constant and trend”, “a constant”, and “both a constant and trend”. The results of the ADF tests are presented in Table 2. From the table, the null hypothesis that the series is non-stationary cannot be rejected for market capitalizations, market indices, and for all markets in both periods. However, the hypothesis that the first differences of market capitalizations and market indices are non-stationary is rejected in all markets and in both periods, regardless of allowing for a constant, both a constant and trend, or none of these. This suggests that market capitalizations and market indices are I (1) for all markets in both periods.

5.2. Cointegration

Table 3 presents the results of the cointegration test for the market capitalizations and the major market indices of the Hong Kong, Shanghai, and Shenzhen markets in both periods, “before” and “after”. In the Johansen cointegration test, different numbers of lags and different informational criteria could suggest different lag lengths for the explanatory variable; moreover, the different criteria could cause conflicting results. In order to circumvent this limitation, we use Lag 1 to Lag 4 when applying the Johansen cointegration test for each variable. With regard to market capitalization, the Hong Kong, Shanghai, and Shenzhen markets are cointegrated at the 10% significance level at least in the “before” and “after” periods. With regard to market indices, the Hong Kong, Shanghai, and Shenzhen markets are cointegrated at the 10% significance level at least in the “after” period and are not cointegrated in the “before” period. This finding infers that the Shanghai–Hong Kong Stock Connect has a significant impact on the market indices, but not on the market capitalizations, of the Hong Kong, Shanghai, and Shenzhen markets in the sense that the market indices of these markets become cointegrated after the introduction of the Shanghai–Hong Kong Stock Connect but are not cointegrated before its introduction. Nonetheless, the market capitalizations of the Hong Kong, Shanghai, and Shenzhen markets are cointegrated before and after the introduction of the Shanghai–Hong Kong Stock Connect. Alternatively, we can say that the introduction of the Shanghai–Hong Kong Stock Connect has no effect on the cointegration of the market capitalizations in the Hong Kong, Shanghai, and Shenzhen markets.
We conduct the Engle–Granger two-step cointegration test as a complementary analysis to the Johansen cointegration test. Table 4 presents the results for each of the variables and for different pairs of markets for the “before” and “after” periods. The results suggest that a cointegration relationship exists between Hong Kong and Shanghai and between Hong Kong and Shenzhen for the market capitalizations and market indices in the “after” period but not in the “before” period. These results are consistent with those in Table 3 and provide more information. First, the results of Table 3 and Table 4 are the same for the market indices such that the Shanghai–Hong Kong Stock Connect has a significant impact on the market indices of the Hong Kong, Shanghai, and Shenzhen markets in the sense that the market indices of these markets become cointegrated after the introduction of the Shanghai–Hong Kong Stock Connect but are not cointegrated before its introduction.
However, Table 3 shows that the market capitalizations of the Hong Kong, Shanghai, and Shenzhen markets are cointegrated before and after the introduction of the Shanghai–Hong Kong Stock Connect, while Table 4 shows that the market capitalizations between the Hong Kong and Shanghai markets and between the Hong Kong and Shenzhen markets are cointegrated after, but not before, the introduction of the Shanghai–Hong Kong Stock Connect. Readers may regard these results as contradictory because Table 4 shows that the market capitalizations between the Hong Kong and Shanghai markets and between the Hong Kong and Shenzhen markets are not cointegrated before the introduction of the Shanghai–Hong Kong Stock Connect, while Table 3 shows that the market capitalizations of the Hong Kong, Shanghai, and Shenzhen markets are cointegrated in the “before” period. Nonetheless, we note that the results are still consistent. For example, the market capitalization between Hong Kong and Shanghai is not cointegrated in the “before” period; however, after including Shenzhen, the market capitalizations of the Hong Kong, Shanghai, and Shenzhen markets are cointegrated in the “before” period. There is no contradiction. Overall, the results from Table 3 and Table 4 conclude that the Shanghai–Hong Kong Stock Connect has a significant impact on the market indices and market capitalizations of the Hong Kong, Shanghai, and Shenzhen markets in the sense that in the pairings of Hong Kong–Shanghai and Hong Kong–Shenzhen, both variables are not cointegrated before the introduction of the Shanghai–Hong Kong Stock Connect but are cointegrated after its introduction. Nonetheless, the Shanghai–Hong Kong Stock Connect has a greater impact on the market indices of the Hong Kong, Shanghai, and Shenzhen markets in the sense that these market indices are not cointegrated before the introduction of the Shanghai–Hong Kong Stock Connect but are cointegrated after its introduction.

5.3. Linear Causality

Given the cointegration test results in Table 3 and Table 4, we employ VECM and VAR for the multivariate linear Granger causality test for the corresponding return data. Namely, we use the VECM for market capitalizations in the “before” and “after” periods and for market indices in the “after” period. Further, we apply VAR for the market indices in the “before” period. Because linear Granger causality test results are sensitive to the chosen number of lags [1,46,47], we perform the test by applying Lag 1 to Lag 4 to ensure the persistence of the causality effect. Table 5 presents the results.
The results in Table 5 suggest that for market capitalizations, Shanghai and Shenzhen together strongly linear cause Hong Kong only in the “after” period; however, Hong Kong does not linear cause Shanghai and Shenzhen in the “before” and “after” periods. With regard to the market indices, Table 5 also indicates that Shanghai and Shenzhen together strongly linear cause Hong Kong in the “before” and “after” periods and that Hong Kong also strongly linear causes Shanghai and Shenzhen in the “before” period. In the “after” period, Hong Kong only weakly linear causes Shanghai and Shenzhen.
Again, and as a complementary analysis to the multivariate linear causality tests for both variables, Table 6 and Table 7 exhibit the results of the individual linear causality tests for each variable of different stock exchange pairs. The results in Table 6 suggest that for market capitalizations in the “before” period, Shenzhen strongly linear causes Hong Kong, while Hong Kong strongly linear causes Shanghai and weakly linear causes Shenzhen. In the “after” period, Table 6 suggests that Shanghai strongly linear causes Hong Kong, while Hong Kong strongly linear causes Shanghai and weakly linear causes Shenzhen.
The results in Table 7 suggest that for the market indices, both Shanghai and Shenzhen strongly linear cause Hong Kong separately, but Hong Kong does not linear cause either Shanghai or Shenzhen in the “before” period. In the “after” period, both Shanghai and Shenzhen do not linear cause Hong Kong separately and Hong Kong does not linear cause Shanghai or Shenzhen.
Table 4 shows the results of the pairwise cointegrations. However, for those pairs of variables that are cointegrated, we have to include the speeds of the adjustments in the ECM linear Granger causality model in Equation (3). The estimates of the speeds of adjustments are given in Table 8 and Table 9 for market capitalizations and market indices respectively. With regard to market capitalizations, the averages of the estimated speeds of adjustments in any market are smaller than 0.049 (in absolute value), implying that in general any movement away from the long-term equilibrium between the various market pairs is slow to correct. An estimate of 0.049, at the upper limit of the means, implies a 4.9% adjustment back to equilibrium in a given trading day. Similarly, for the market indices, the averages of the estimated speeds of adjustments in any market are smaller than 0.032 (in absolute value), implying that in general any movement away from the long-term equilibrium between the various market pairs is slow to correct. An estimate of 0.032, at the upper limit of the means, implies a 3.2% adjustment back to equilibrium in a given trading day.

5.4. Nonlinear Causality

We suggest that linear and nonlinear causality relationships could be independent in the sense that the existence of a linear causality relationship does not infer the existence of a nonlinear causality relationship and vice versa. Therefore, we propose investigating whether there is any change in nonlinear causality relationships after the introduction of the Shanghai–Hong Kong Stock Connect. Consequently, we report in Table 10 the results of the multivariate nonlinear Granger causality tests of different markets’ market capitalizations and stock indices. We find that for market capitalizations and market indices, Shanghai and Shenzhen strongly nonlinearly cause Hong Kong in the “before” and “after” periods, while Hong Kong strongly nonlinearly causes Shanghai and Shenzhen in the “before” period and only weakly nonlinearly causes Shanghai and Shenzhen in the “after” period.
Again, and as a complementary analysis to the nonlinear Granger causality tests for all three stock exchanges, Table 11 and Table 12 present the results of the individual nonlinear Granger causality tests for market capitalizations and the market indices respectively for each stock exchange pair. Table 11 suggests that for market capitalizations, Shanghai–Hong Kong and Shenzhen–Hong Kong are two interactive pairwise markets in which strong bi-directional nonlinear Granger causalities are found in the “before” period. In the “after” period, Table 11 suggests that Shanghai and Shenzhen strongly nonlinearly cause Hong Kong individually, while Hong Kong only weakly nonlinearly causes Shanghai and Shenzhen individually.
With regard to the market indices, Table 12 suggests that Shanghai–Hong Kong and Shenzhen–Hong Kong are two interactive pairwise markets in which strong bi-directional nonlinear Granger causalities are found in the “before” period. In a similar way to market capitalizations (see Table 11), Table 12 indicates that Shanghai and Shenzhen strongly nonlinearly cause Hong Kong individually, while Hong Kong only weakly nonlinearly causes Shanghai and Shenzhen individually.

6. Conclusions

We summarize all our empirical results in Table 13 and Table 14. Table 13 shows that for market capitalization, Shanghai and Shenzhen exist a high degree of cointegration with Hong Kong before and after the implementation of the Stock Connect Scheme. As for causality, the strong effect found before the rollout of the Scheme under the nonlinear analysis from Shanghai and Shenzhen to Hong Kong (SH, SZ HK) remains unchanged during the post implementation period. However, the nonlinear causality effect from Hong Kong to Shanghai and Shenzhen (HK SH, SZ) decreased after the implementation of the Stock Connect Scheme.
With regard to the market indices, no cointegration is found before the Stock Connect Scheme. However, Shanghai and Shenzhen exhibit a high degree of cointegration with Hong Kong after the rollout of the scheme. Regarding causality effect, a bi-directional causality relationship between Shanghai/Shenzhen and Hong Kong (SH, SZ Δ HK) is found before the rollout of the Stock Connect Scheme, despite whether it is obtained from linear or nonlinear analysis. However, such causality relationship is changed where a uni-directional causality from Shanghai and Shenzhen to Hong Kong (SH, SZ HK) dominates after the implementation of the Stock Connect Scheme. Therefore, the causality effect from Hong Kong to Shanghai and Shenzhen (HK SH, SZ) diminished after the rollout of the Scheme.
Table 14 shows the pairwise test results. From both market capitalization and market index perspectives, neither the Shanghai nor the Shenzhen market is cointegrated with Hong Kong market before the implementation of Stock Connect Scheme. However, on a pairwise base, cointegration relationships for Shanghai/Hong Kong and Shenzhen/Hong Kong are found after the rollout of the scheme. The findings from pairwise test support the view that the Stock Connect Scheme has a significant impact on both market capitalizations and market indices of the Hong Kong, Shanghai, and Shenzhen markets. The Hong Kong stock market is still relevant to understand and predict China stock market after the implementation of the Stock Connect Scheme.
This principal contribution of this study lies in the development of a model that makes it possible to capture the degree of integration between the Chinese and Hong Kong stock markets following the implementation of the Shanghai–Hong Kong Stock Connect. Our results suggest that market integration has evolved progressively. Over the past three decades, Hong Kong has gradually become a means for international investors to access Chinese assets. The Stock Connect Scheme is an innovative move with significant impacts to both Hong Kong and mainland stock markets. Policy makers lay out a broad strategy of market-oriented reform but in a manner that is controllable and expandable for cross-border Renminbi (RMB) flow by connecting Mainland market to international investors. It paves the way and is a natural consequence of steps that China is taking to open-up its capital account and facilitate the move towards RMB internationalization, which is critical both to the political and economic developments of China. The design of the Stock Connect Scheme provides a sustainable and scalable model for further expansion to world’s major stock markets. Therefore, it is unsurprising to see the correlation of market capitalization occurring before the introduction of the Stock Connect Scheme as a positive development resulting from a wider investor base. It is also perhaps not that surprising to see the non-stationary observation of market index performance before the introduction of the scheme. This situation is reflected in the gradual growth of H-shares in the leading index constituents.
Further, as time has passed, the restrictions on accessing mainland markets have eased; thus, overseas investors can now access China’s A-share market via a qualified quota known as QFII. Likewise, the introduction of RQFII in 2011 has allowed an investment outflow to international markets. In addition, higher levels of such co-movements are expected. Figure 2 and Figure 3 show the growth of the QFII and RQFII quotas, respectively.
One of the obvious observations is that the weakening of the investment outflow from Hong Kong to China after the introduction of the Stock Connect Scheme also weakens Hong Kong’s influence on China. While this study’s tests generally agree on the evidence of linear causality for market capitalizations and the market indices before and after the introduction of the Stock Connect Scheme from China to Hong Kong, it is interesting to find nonlinear cases from 2015 onward that suggest a bilateral and possibly nonlinear degree of causal influence on each market. Heuristically, the speed of capital flow from one market to another and the difference in the H-share and A-share premium (see Figure 4) could drive the direction of funds. On the one hand, it is not difficult to see how Hong Kong has provided cheaper asset-buying opportunities in the past decade; on the other, the change in share premium difference between mainland China’s domestic A-share markets and Hong Kong’s H-share market could direct investors’ appetites or sentiments. It is suggested here that these are aspects for further research in order to establish the type of nonlinear functional relationship and the dynamic drivers of such relationships.
This paper studies sustainability of financial integration among Shenzhen, Shanghai, and Hong Kong stock markets. An extension of our paper could study sustainability of other aspects of financial markets, for example, sustainability in warrant markets [48], sustainability in REITs [49], sustainability in equity return dispersion and stock market volatility [50], sustainability in herding behaviour [51], sustainability in portfolio selection [52], and sustainability in credit risk [53].

Author Contributions

Conceptualization, A.W.-W.C. and D.K.-H.C.; methodology, N.S.-C.C. and W.-K.W.; software, N.S.-C.C.; validation, A.W.-W.C. and D.K.-H.C.; formal analysis, N.S.-C.C. and W.-K.W.; investigation, N.S.-C.C. and W.-K.W.; resources, A.W.-W.C. and D.K.-H.C.; data curation, A.W.-W.C. and D.K.-H.C.; writing—original draft preparation, N.S.-C.C. and W.-K.W.; writing—review and editing, N.S.-C.C. and W.-K.W.; visualization, N.S.-C.C. and W.-K.W.; supervision, A.W.-W.C. and W.-K.W.; project administration, A.W.-W.C. and D.K.-H.C.; funding acquisition, A.W.-W.C. and D.K.-H.C.

Funding

This research was partially funded by grants from The Hang Seng University of Hong Kong, Australian National University, Asia University, China Medical University Hospital, the Research Grants Council of Hong Kong (Project Number 12500915), and Ministry of Science and Technology (MOST, Project Numbers 106-2410-H-468-002 and 107-2410-H-468-002-MY3), Taiwan.

Acknowledgments

The fourth author would also like to thank Robert B. Miller and Howard E. Thompson for their continuous guidance and encouragement.

Conflicts of Interest

The authors declare no conflicts of interest. The funders had no role in the design of the study; in the collection, analyses, or interpretation of data; in the writing of the manuscript, or in the decision to publish the results.

References

  1. Click, R.W.; Plummer, M.G. Stock market integration in ASEAN after the Asian financial crisis. J. Asian Econ. 2005, 16, 5–28. [Google Scholar] [CrossRef]
  2. Demirer, R.; Kutan, A.M. Does herding behavior exist in Chinese stock markets? J. Int. Finac. Mark. Inst. Money 2006, 16, 123–142. [Google Scholar] [CrossRef]
  3. Cai, C.X.; McGuinness, P.B.; Zhang, Q. The pricing dynamics of cross-listed securities: The case of Chinese A-and H-shares. J. Bank. Finace 2011, 35, 2123–2136. [Google Scholar] [CrossRef]
  4. Taylor, M.P.; Tonks, I. The internationalisation of stock markets and the abolition of UK exchange control. Rev. Econ. Stat. 1989, 71, 332–336. [Google Scholar] [CrossRef]
  5. Jin, X. Volatility transmission and volatility impulse response functions among the Greater China stock markets. J. Asian Econ. 2015, 39, 43–58. [Google Scholar] [CrossRef]
  6. Janakiramanan, S.; Lamba, A.S. An empirical examination of linkages between Pacific-Basin stock markets. J. Int. Finac. Mark. Inst. Money 1998, 8, 155–173. [Google Scholar] [CrossRef]
  7. Johansson, A.C.; Ljungwall, C. Spillover effects among the Greater China stock markets. World Dev. 2009, 37, 839–851. [Google Scholar] [CrossRef]
  8. Chan, K.C.; Gup, B.E.; Pan, M.S. An empirical analysis of stock prices in major Asian markets and the United States. Financ. Rev. 1992, 27, 289–307. [Google Scholar] [CrossRef]
  9. Arshanapalli, B.; Doukas, J. International stock market linkages: Evidence from the pre-and post-October 1987 period. J. Bank. Finace 1993, 17, 193–208. [Google Scholar] [CrossRef]
  10. Engle, R.F.; Granger, C.W. Co-integration and error correction: Representation, estimation, and testing. Econometrica 1987, 55, 251–276. [Google Scholar] [CrossRef]
  11. Kasa, K. Common stochastic trends in international stock markets. J. Monet. Econ. 1992, 29, 95–124. [Google Scholar] [CrossRef]
  12. Phylaktis, K.; Ravazzolo, F. Stock market linkages in emerging markets: Implications for international portfolio diversification. J. Int. Finac. Mark. Inst. Money 2005, 15, 91–106. [Google Scholar] [CrossRef]
  13. Diamandis, P.F. International stock market linkages: Evidence from Latin America. Glob. Finance J. 2009, 20, 13–30. [Google Scholar] [CrossRef]
  14. Tan, H.B.; Cheah, E.T.; Johnson, J.E.; Sung, M.C.; Chuah, C.H. Stock market capitalization and financial integration in the Asia Pacific region. Appl. Econ. 2012, 44, 1951–1961. [Google Scholar] [CrossRef]
  15. Baharumshah, A.Z.; Sarmidi, T.; Tan, H.B. Dynamic linkages of Asian stock markets. J. Asia Pac. Econ. 2003, 8, 180–209. [Google Scholar] [CrossRef]
  16. Daly, K.J. Southeast Asian stock market linkages: Evidence from pre-and post-October 1997. ASEAN Econ. Bull. 2003, 20, 73–85. [Google Scholar] [CrossRef]
  17. Cavoli, T.; Rajan, R.; Siregar, R. A Survey of Financial Integration in East Asia: How Far? How Much Further to Go? Centre for International Economic Studies, University of Adelaide: Adelaide, Australia, 2004. [Google Scholar]
  18. Huyghebaert, N.; Wang, L. The co-movement of stock markets in East Asia: Did the 1997–1998 Asian financial crisis really strengthen stock market integration? China Econ. Rev. 2010, 21, 98–112. [Google Scholar] [CrossRef]
  19. Ng, H.T. Stock Market Linkages in South–East Asia. Asian Econ. J. 2002, 16, 353–377. [Google Scholar] [CrossRef]
  20. Yang, J.; Kolari, J.W.; Min, I. Stock market integration and financial crises: The case of Asia. Appl. Financ. Econ. 2003, 13, 477–486. [Google Scholar] [CrossRef]
  21. Guillaumin, C. Financial integration in East Asia: Evidence from panel unit root and panel cointegration tests. J. Asian Econ. 2009, 20, 314–326. [Google Scholar] [CrossRef]
  22. Yu, I.W.; Fung, K.P.; Tam, C.S. Assessing financial market integration in Asia–equity markets. J. Bank. Finace 2010, 34, 2874–2885. [Google Scholar] [CrossRef]
  23. Zhu, H.; Lu, Z.; Wang, S.; Soofi, A.S. Causal linkages among Shanghai, Shenzhen, and Hong Kong stock markets. Int. J. Theor. Appl. Finance 2004, 7, 135–149. [Google Scholar] [CrossRef]
  24. Tourani-Rad, A.; Yi, Y. A Tale of Three Stock Markets: Timing between Hong Kong, Shanghai and Shenzhen. Manag. Finance 2004, 30, 60–77. [Google Scholar] [CrossRef]
  25. Cheung, Y.W.; Chinn, M.D.; Fujii, E. China, Hong Kong, and Taiwan: A quantitative assessment of real and financial integration. China Econ. Rev. 2003, 14, 281–303. [Google Scholar] [CrossRef] [Green Version]
  26. Wang, Y.; Di Iorio, A. Are the China-related stock markets segmented with both world and regional stock markets? J. Int. Finac. Mark. Inst. Money 2007, 17, 277–290. [Google Scholar] [CrossRef]
  27. Wang, Y.; Di Iorio, A. The cross section of expected stock returns in the Chinese A-share market. Glob. Finance J. 2007, 17, 335–349. [Google Scholar] [CrossRef]
  28. Wang, Y.; Di Iorio, A. The cross-sectional relationship between stock returns and domestic and global factors in the Chinese A-share market. Rev. Quant. Finance Account. 2007, 29, 181–203. [Google Scholar] [CrossRef] [Green Version]
  29. Huo, R.; Ahmed, A.D. Return and volatility spillovers effects: Evaluating the impact of Shanghai-Hong Kong Stock Connect. Econ. Model. 2017, 61, 260–272. [Google Scholar] [CrossRef]
  30. Fan, Q.; Wang, T. The impact of Shanghai–Hong Kong Stock Connect policy on AH share price premium. Finance Res. Lett. 2017, 21, 222–227. [Google Scholar] [CrossRef]
  31. Kashyap, R. Hong Kong–Shanghai Connect/Hong Kong–Beijing Disconnect? Scaling the Great Wall of Chinese Securities Trading Costs. J. Trading 2016, 11, 81–134. [Google Scholar] [CrossRef]
  32. Yang, K.; Wei, Y.; He, J.; Li, S. Dependence and risk spillovers between mainland China and London stock markets before and after the Stock Connect programs. Phys. A Stat. Mech. Its Appl. 2019, 526, 120883. [Google Scholar] [CrossRef]
  33. Johansen, S. Statistical analysis of cointegration vectors. J. Econ. Dyn. Control 1988, 12, 231–254. [Google Scholar] [CrossRef]
  34. Johansen, S.; Juselius, K. Maximum likelihood estimation and inference on cointegration—With applications to the demand for money. Oxf. Bull. Econ. Stat. 1990, 52, 169–210. [Google Scholar] [CrossRef]
  35. Johansen, S. Estimation and hypothesis testing of cointegration vectors in Gaussian vector autoregressive models. Econometrica 1991, 59, 1551–1580. [Google Scholar] [CrossRef]
  36. Bai, Z.D.; Wong, W.K.; Zhang, B.Z. Multivariate linear and non-linear causality tests. Math. Comput. Simul. 2010, 81, 5–17. [Google Scholar] [CrossRef]
  37. Bai, Z.D.; Li, H.; Wong, W.K.; Zhang, B.Z. Multivariate causality tests with simulation and application. Stat. Probab. Lett. 2011, 81, 1063–1071. [Google Scholar] [CrossRef] [Green Version]
  38. Chow, S.C.; Cunado, J.; Gupta, R.; Wong, W.K. Causal Relationships between Economic Policy Uncertainty and Housing Market Returns in China and India: Evidence from Linear and Nonlinear Panel and Time Series Models. Stud. Nonlinear Dyn. Econom. 2018, 22. [Google Scholar] [CrossRef]
  39. Scheinkman, J.A.; LeBaron, B. Nonlinear dynamics and stock returns. J. Bus. 1989, 62, 311–337. [Google Scholar] [CrossRef]
  40. Brock, W.A.; Hsieh, D.A.; LeBaron, B.D. Nonlinear Dynamics, Chaos, and Instability: Statistical Theory and Economic Evidence; MIT Press: Cambridge, MA, USA, 1991. [Google Scholar]
  41. Hsieh, D.A. Chaos and nonlinear dynamics: Application to financial markets. J. Finance 1991, 46, 1839–1877. [Google Scholar] [CrossRef]
  42. Baek, E.; Brock, W. A General Test for Nonlinear Granger Causality: Bivariate Model; Iowa State University and University of Wisconsin at Madison Working Paper; Iowa State University and University of Wisconsin: Madison, WI, USA, 1992. [Google Scholar]
  43. Chow, S.C.; Gupta, R.; Suleman, T.; Wong, W.K. Long-Run Movement and Predictability of Bond Spread for BRICS and PIIGS: The Role of Economic, Financial and Political Risks. J. Rev. Glob. Econ. 2019, 8, 239–257. [Google Scholar] [CrossRef]
  44. Chow, S.C.; Vieito, J.P.; Wong, W.K. Do both demand-following and supply-leading theories hold true in developing countries? Phys. A Stat. Mech. Appl. 2019, 513, 536–554. [Google Scholar] [CrossRef]
  45. Hiemstra, C.; Jones, J.D. Testing for linear and nonlinear Granger causality in the stock price-volume relation. J. Finance 1994, 49, 1639–1664. [Google Scholar]
  46. Brocato, J.; Smith, K.L. Velocity and the Variability of Money Growth: Evidence from Granger-Causality Tests: Comment. J. Money Credit Bank. 1989, 21, 258–261. [Google Scholar] [CrossRef]
  47. Chung, P.J.; Liu, D.J. Common stochastic trends in Pacific Rim stock markets. Q. Rev. Econ. Finance 1994, 34, 241–259. [Google Scholar] [CrossRef]
  48. Wong, W.K.; Lean, H.H.; McAleer, M.; Tsai, F.-T. Why are Warrant Markets Sustained in Taiwan but not in China? Sustainability 2018, 10, 3748. [Google Scholar] [CrossRef]
  49. Gupta, R.; Lv, Z.H.; Wong, W.K. Macroeconomic Shocks and Changing Dynamics of the U.S. REITs Sector. Sustainability 2019, 11, 2776. [Google Scholar] [CrossRef]
  50. Demirer, R.; Gupta, R.; Lv, Z.H.; Wong, W.K. Equity Return Dispersion and Stock Market Volatility: Evidence from Multivariate Linear and Nonlinear Causality Tests. Sustainability 2019, 11, 351. [Google Scholar] [CrossRef]
  51. Batmunkh, M.-U.; McAleer, M.; Moslehpour, M.; Wong, W.K. Confucius and Herding Behaviour in the China and Taiwan Stock Markets. Sustainability 2018, 10, 4413. [Google Scholar] [CrossRef]
  52. Li, Z.; Li, X.; Hui, Y.C.; Wong, W.K. Maslow Portfolio Selection for Individuals with Low Financial Sustainability. Sustainability 2018, 10, 1128. [Google Scholar] [CrossRef]
  53. Mou, W.M.; Wong, W.K.; McAleer, M. Financial Credit Risk Evaluation Based on Core Enterprise Supply Chains. Sustainability 2018, 10, 3699. [Google Scholar] [CrossRef]
Figure 1. Shanghai, Shenzhen, and Hong Kong Stock Market Capitalizations and Market Indices.
Sustainability 11 03845 g001
Figure 2. QFII Quota (A pprovals since 2003 (US$bn), Data source: SSE).
Sustainability 11 03845 g002
Figure 3. RQFII Quota (Approvals since 2011 (RMBbn), Data source: SSE).
Sustainability 11 03845 g003
Figure 4. The Hang Seng China AH Premium Index. (Data source. Bloomberg.)
Sustainability 11 03845 g004
Table 1. Descriptive Statistics for Stock Market Capitalizations and Market Indices.
Market CapitalizationMarket Index
Hong KongShanghaiShenzhenHong KongShanghaiShenzhen
Before
Mean2149.561999.64485.122603.88364.12133.30
Maximum3424.253891.59864.104082.25810.67223.21
Minimum818.13254.3699.971420.72122.2128.66
Std. Dev.694.35915.89196.73464.31131.8253.71
Skewness−0.40 ***−0.85 ***−0.82 ***−0.30 ***0.44 ***−0.70 ***
Kurtosis2.03 ***−7.06 ***2.41 ***2.69 ***3.93 ***2.21 ***
Jarque–Bera153.81 ***306.93 ***292.79 ***43.184 ***156.95 ***247.58 ***
After
Mean3249.044274.351065.692954.59518.35306.35
Maximum4069.506623.381684.083669.84832.07505.82
Minimum2665.163002.20752.912373.58400.53215.68
Std. Dev.300.25679.62163.69292.6594.2753.67
Skewness0.91 ***1.32 ***1.46 ***0.49 ***1.40 ***1.33 ***
Kurtosis3.70 ***4.58 ***5.79 ***2.814.37 ***5.53 ***
Jarque–Bera80.22 ***197.98 ***341.85 ***21.04 ***204.03 ***282.46 ***
Notes: The figures for market capitalizations and market indices are in US billion dollars. *, **, and *** denote significance at the 10%, 5%, and 1% levels, respectively.
Table 2. ADF Unit Root Tests—Level and First Difference of Variables.
LevelFirst Difference
Variable/MarketWithout a Constant and TrendWith a ConstantWith a Constant and TrendWithout a Constant and TrendWith a ConstantWith a Constant and Trend
Market Capitalization—Before
Hong Kong1.682711−1.919425−2.205666−52.60101 ***−52.65588 ***−52.66070 ***
Shanghai2.353194−2.180448−1.120584−48.22354 ***−48.34105 ***−48.40782 ***
Shenzhen1.694196−1.698022−1.354723−45.59289 ***−45.64103 ***−45.65093 ***
Market Capitalization—After
Hong Kong−0.086144−1.584134−1.763568−20.45296 ***−20.43241 ***−20.41225 ***
Shanghai0.612571−2.410414−2.848671−16.90724 ***−16.91163 ***−16.98909 ***
Shenzhen0.627730−2.566980−2.583824−20.38275 ***−20.37833 ***−20.41032 ***
Market Index—Before
Hong Kong0.626803−2.371107−2.637028−49.52579 ***−49.52618 ***−49.51887 ***
Shanghai1.066231−1.934023−1.517596−47.77306 ***−47.79211 ***−47.81669 ***
Shenzhen1.563084−1.661637−1.471991−45.09358 ***−45.14931 ***−45.15690 ***
Market Index—After
Hong Kong−0.334852−1.494780−1.686786−21.77970 ***−21.76091 ***−21.73916 ***
Shanghai0.167181−1.673607−2.844149−16.82485 ***−16.81046 ***−16.88770 ***
Shenzhen0.456605−2.337842−2.277986−20.02130 ***−20.01022 ***−20.04949 ***
Notes: The critical ADF values are based on one-sided p-value. *, **, and *** denote significance at the 10%, 5%, and 1% levels, respectively.
Table 3. The Johansen Cointegration Test.
Trace statisticMaximal Eigenvalue Statistic
Lags12341234
Market Capitalization—Before
50.41438 ***49.85247 ***50.27316 ***48.99552 **26.82384 **26.53612 **27.53781 **28.16635 **
Market Capitalization—After
40.62609 *41.72919 *43.53722 **43.44726 **23.51745 *25.62289 *25.46559 *24.03629 *
Market Index—Before
31.6463030.9864130.3931828.5840615.4102815.0291114.6720213.22303
Market Index—After
41.76066 *43.02648 **46.48707 **47.99164 **28.48594 **29.83725 **32.73789 ***34.94959 ***
Notes: *, **, and *** denote significance at the 10%, 5%, and 1% levels, respectively.
Table 4. Cointegrations between Shanghai, Shenzhen, and Hong Kong.
Dependent VariableIndependent VariableTau-Statistic for ADF Test
BeforeAfter
Market Capitalization
Hong KongShanghai−1.807367−3.702708 ***
ShanghaiHong Kong−1.812675−3.697735 ***
Hong KongShenzhen−2.366831−3.428527 ***
ShenzhenHong Kong−2.375368−3.422214 ***
Market Index
Hong KongShanghai−1.909637−2.507151 *
ShanghaiHong Kong−1.871656−2.499474 *
Hong KongShenzhen−1.765747−2.694529 *
ShenzhenHong Kong−1.630341−2.676564 *
Notes: *, **, and *** denote significance at the 10%, 5%, and 1% levels, respectively.
Table 5. Multivariate Linear Causality Test.
Lags1234
Market Capitalization—Before
Shanghai, Shenzhen do not linear cause Hong Kong7.383719.37520410.7230513.5075
Hong Kong does not linear cause Shanghai, Shenzhen10.9160611.307312.1002315.50066
Market Capitalization—After
Shanghai, Shenzhen do not linear cause Hong Kong24.53035 ***25.04021 ***25.89332 **27.30361 **
Hong Kong does not linear cause Shanghai, Shenzhen7.54128810.5795510.3869212.52102
Market Index—Before
Shanghai, Shenzhen do not linear cause Hong Kong29.53564 ***32.25287 ***41.44762 ***45.33166 ***
Hong Kong does not linear cause Shanghai, Shenzhen26.19195 ***35.55226 ***40.05167 ***50.15208 ***
Market Index—After
Shanghai, Shenzhen do not linear cause Hong Kong16.33123 **18.64942 **21.32368 **23.37843 *
Hong Kong does not linear cause Shanghai, Shenzhen8.69126815.81915 *19.27024 *22.04703
Notes: *, **, and *** denote significance at the 10%, 5%, and 1% levels, respectively.
Table 6. Pairwise Linear Granger Causality Test—Market Capitalizations.
Null Hypothesis (Before)Lag 1Lag 2Lag 3Lag 4
Shanghai does not linear cause Hong Kong0.9785802.0122032.1927582.387463
Hong Kong does not linear cause Shanghai8.537985 ***8.480986 **9.559701 **10.36996 **
Shenzhen does not linear cause Hong Kong5.348578 **6.381996 **6.677565 *8.543683 *
Hong Kong does not linear cause Shenzhen5.051887 **4.996726 *4.7848895.999298
Null Hypothesis (After)
Shanghai does not linear cause Hong Kong3.879897 **5.268828 *7.771181 *11.00691 **
Hong Kong does not linear cause Shanghai2.926277 *4.4414866.289897 *8.776270 *
Shenzhen does not linear cause Hong Kong0.0129441.2878111.7216784.355685
Hong Kong does not linear cause Shenzhen3.585345 *4.2612395.75953210.40691 **
Notes: *, **, and *** denote significance at the 10%, 5%, and 1% levels, respectively.
Table 7. Pairwise Linear Granger Causality Test—Market Indices.
Null Hypothesis (Before)Lag 1Lag 2Lag 3Lag 4
Shanghai does not linear cause Hong Kong8.893183 ***9.610947 ***10.01526 ***9.858900 **
Hong Kong does not linear cause Shanghai1.4278371.4415291.4067332.249378
Shenzhen does not linear cause Hong Kong16.52512 ***16.90540 ***17.56947 ***17.47762 ***
Hong Kong does not linear cause Shenzhen0.1912621.1283811.0546861.968744
Null Hypothesis (After)
Shanghai does not linear cause Hong Kong1.6509463.0701474.4255126.041571
Hong Kong does not linear cause Shanghai1.0991843.3317524.8059735.678313
Shenzhen does not linear cause Hong Kong0.3094860.7872590.9785512.257896
Hong Kong does not linear cause Shenzhen0.4268390.5245471.3527282.567101
Notes: *, **, and *** denote significance at the 10%, 5%, and 1% levels, respectively.
Table 8. Speeds of Adjustments in the Linear Granger Causality Test—Market Capitalizations.
Null Hypothesis (Before)Lag 1Lag 2Lag 3Lag 4
Shanghai does not linear cause Hong Kongn/an/an/an/a
Hong Kong does not linear cause Shanghain/an/an/an/a
Shenzhen does not linear cause Hong Kongn/an/an/an/a
Hong Kong does not linear cause Shenzhenn/an/an/an/a
Null Hypothesis (After)
Shanghai does not linear cause Hong Kong−0.004669−0.005398−0.006306−0.006973
Hong Kong does not linear cause Shanghai−0.044791 ***−0.046493 ***−0.048387 ***−0.048581 ***
Shenzhen does not linear cause Hong Kong−0.007094−0.007855−0.009215−0.010231
Hong Kong does not linear cause Shenzhen−0.039959 ***−0.040460 ***−0.042351 ***−0.043781 ***
Notes: *, **, and *** denote significance at the 10%, 5%, and 1% levels, respectively.
Table 9. Speeds of Adjustments in the Linear Granger Causality Test—Market Indices.
Null Hypothesis (Before)Lag 1Lag 2Lag 3Lag 4
Shanghai does not linear cause Hong Kongn/an/an/an/a
Hong Kong does not linear cause Shanghain/an/an/an/a
Shenzhen does not linear cause Hong Kongn/an/an/an/a
Hong Kong does not linear cause Shenzhenn/an/an/an/a
Null Hypothesis (After)
Shanghai does not linear cause Hong Kong−0.000644−0.001230−0.001977−0.003281
Hong Kong does not linear cause Shanghai−0.028955 ***−0.029045 ***−0.030224 ***−0.031811 ***
Shenzhen does not linear cause Hong Kong−0.003705−0.004845−0.006024−0.007039
Hong Kong does not linear cause Shenzhen−0.020618 ***−0.021161 ***−0.021848 ***−0.023016 ***
Notes: *, **, and *** denote significance at the 10%, 5%, and 1% levels, respectively.
Table 10. Multivariate Nonlinear Causality Test.
Lags1234
Market Capitalization—Before
Shanghai, Shenzhen do not nonlinearly cause Hong Kong4.210291 ***4.920050 ***5.380364 ***4.844110 ***
Hong Kong does not nonlinearly cause Shanghai, Shenzhen4.687631 ***5.005889 ***5.065219 ***4.561966 ***
Market Capitalization—After
Shanghai, Shenzhen do not nonlinearly cause Hong Kong2.116468 **2.820839 ***2.350409 ***1.308816 *
Hong Kong does not nonlinearly cause Shanghai, Shenzhen0.6539331.520695 *0.1999580.971179
Market Index—Before
Shanghai, Shenzhen do not nonlinearly cause Hong Kong4.542631 ***4.828466 ***4.973165 ***4.293640 ***
Hong Kong does not nonlinearly cause Shanghai, Shenzhen5.358980 ***5.774119 ***4.827240 ***5.010060 ***
Market Index—After
Shanghai, Shenzhen do not nonlinearly cause Hong Kong2.037944 **2.242687 **1.624614 *1.186182
Hong Kong does not nonlinearly cause Shanghai, Shenzhen−0.2219090.426697−0.8550350.523144
Notes: *, **, and *** denote significance at the 10%, 5%, and 1% levels, respectively.
Table 11. Pairwise Nonlinear Causality Test—Market Capitalizations.
Null Hypothesis (Before)Lag 1Lag 2Lag 3Lag 4
Shanghai does not nonlinearly cause Hong Kong3.795365 ***4.551167 ***5.164434 ***4.694305 ***
Hong Kong does not nonlinearly cause Shanghai4.619768 ***5.187093 ***5.304950 ***4.865725 ***
Shenzhen does not nonlinearly cause Hong Kong3.804926 ***4.500830 ***5.043632 ***4.707949 ***
Hong Kong does not nonlinearly cause Shenzhen4.225535 ***5.039040 ***5.194823 ***4.742640 ***
Null Hypothesis (After)
Shanghai does not nonlinearly cause Hong Kong1.468207 *2.749260 ***2.277180 **1.434418 *
Hong Kong does not nonlinearly cause Shanghai0.8004581.572935 *0.5402211.133238
Shenzhen does not nonlinearly cause Hong Kong2.458619 ***2.952265 ***2.404669 ***1.366114 *
Hong Kong does not nonlinearly cause Shenzhen1.977940 **2.261325 **0.9007031.065920
Notes: The *, **, and *** denote the significance at 10%, 5% and 1% levels, respectively.
Table 12. Pairwise Nonlinear Causality Test—Market Indices.
Null Hypothesis (Before)Lag 1Lag 2Lag 3Lag 4
Shanghai does not nonlinearly cause Hong Kong4.337560 ***4.680782 ***4.778670 ***3.847159 ***
Hong Kong does not nonlinearly cause Shanghai5.296137 ***5.917483 ***5.496391 ***5.363044 ***
Shenzhen does not nonlinearly cause Hong Kong3.972803 ***4.353763 ***4.490202 ***4.149760 ***
Hong Kong does not nonlinearly cause Shenzhen4.303810 ***5.414131 ***5.009831 ***4.677395 ***
Null Hypothesis (After)
Shanghai does not nonlinearly cause Hong Kong1.565120 *2.511137 ***1.870381 **1.411452 *
Hong Kong does not nonlinearly cause Shanghai−0.1170910.654299−0.2686520.819147
Shenzhen does not nonlinearly cause Hong Kong2.348446 ***2.349964 ***1.817364 **1.465420 *
Hong Kong does not nonlinearly cause Shenzhen1.401143 *1.890706 **0.6707920.896187
Notes: *, **, and *** denote significance at the 10%, 5%, and 1% levels, respectively.
Table 13. Summary of Multivariate Test Results.
VariablesCointegrationCausality S H ,   S Z H K H K S H ,   S Z
Market CapitalizationStronglyLinear xx
(Before) Nonlinearstronglystrongly
Market CapitalizationStronglyLinear stronglyx
(After) Nonlinearstronglyweakly
Market IndexXLinear stronglystrongly
(Before) Nonlinearstronglystrongly
Market IndexStronglyLinearstronglyweakly
(After) Nonlinearstronglyx
Table 14. Summary of Pairwise Test Results.
VariablesCointegration
S H   w i t h   H K
Cointegration
S Z   w i t h   H K
Causality S H H K S Z H K H K S H H K S Z
Market CapitalizationxxLinearxstronglystronglystrongly
(Before) Nonlinearstronglystronglystronglystrongly
Market CapitalizationLinearstronglyxstronglystrongly
(After) Nonlinearstronglystronglyweaklystrongly
Market IndexxxLinearstronglystronglyxx
(Before) Nonlinearstronglystronglystronglystrongly
Market IndexLinearxxxx
(After) Nonlinearstronglystronglyxstrongly

