Analyzing Opinions on Sustainable Agriculture: Toward Increasing Farmer Knowledge of Organic Practices in Taiwan-Yuanli Township


Abstract
1. Introduction
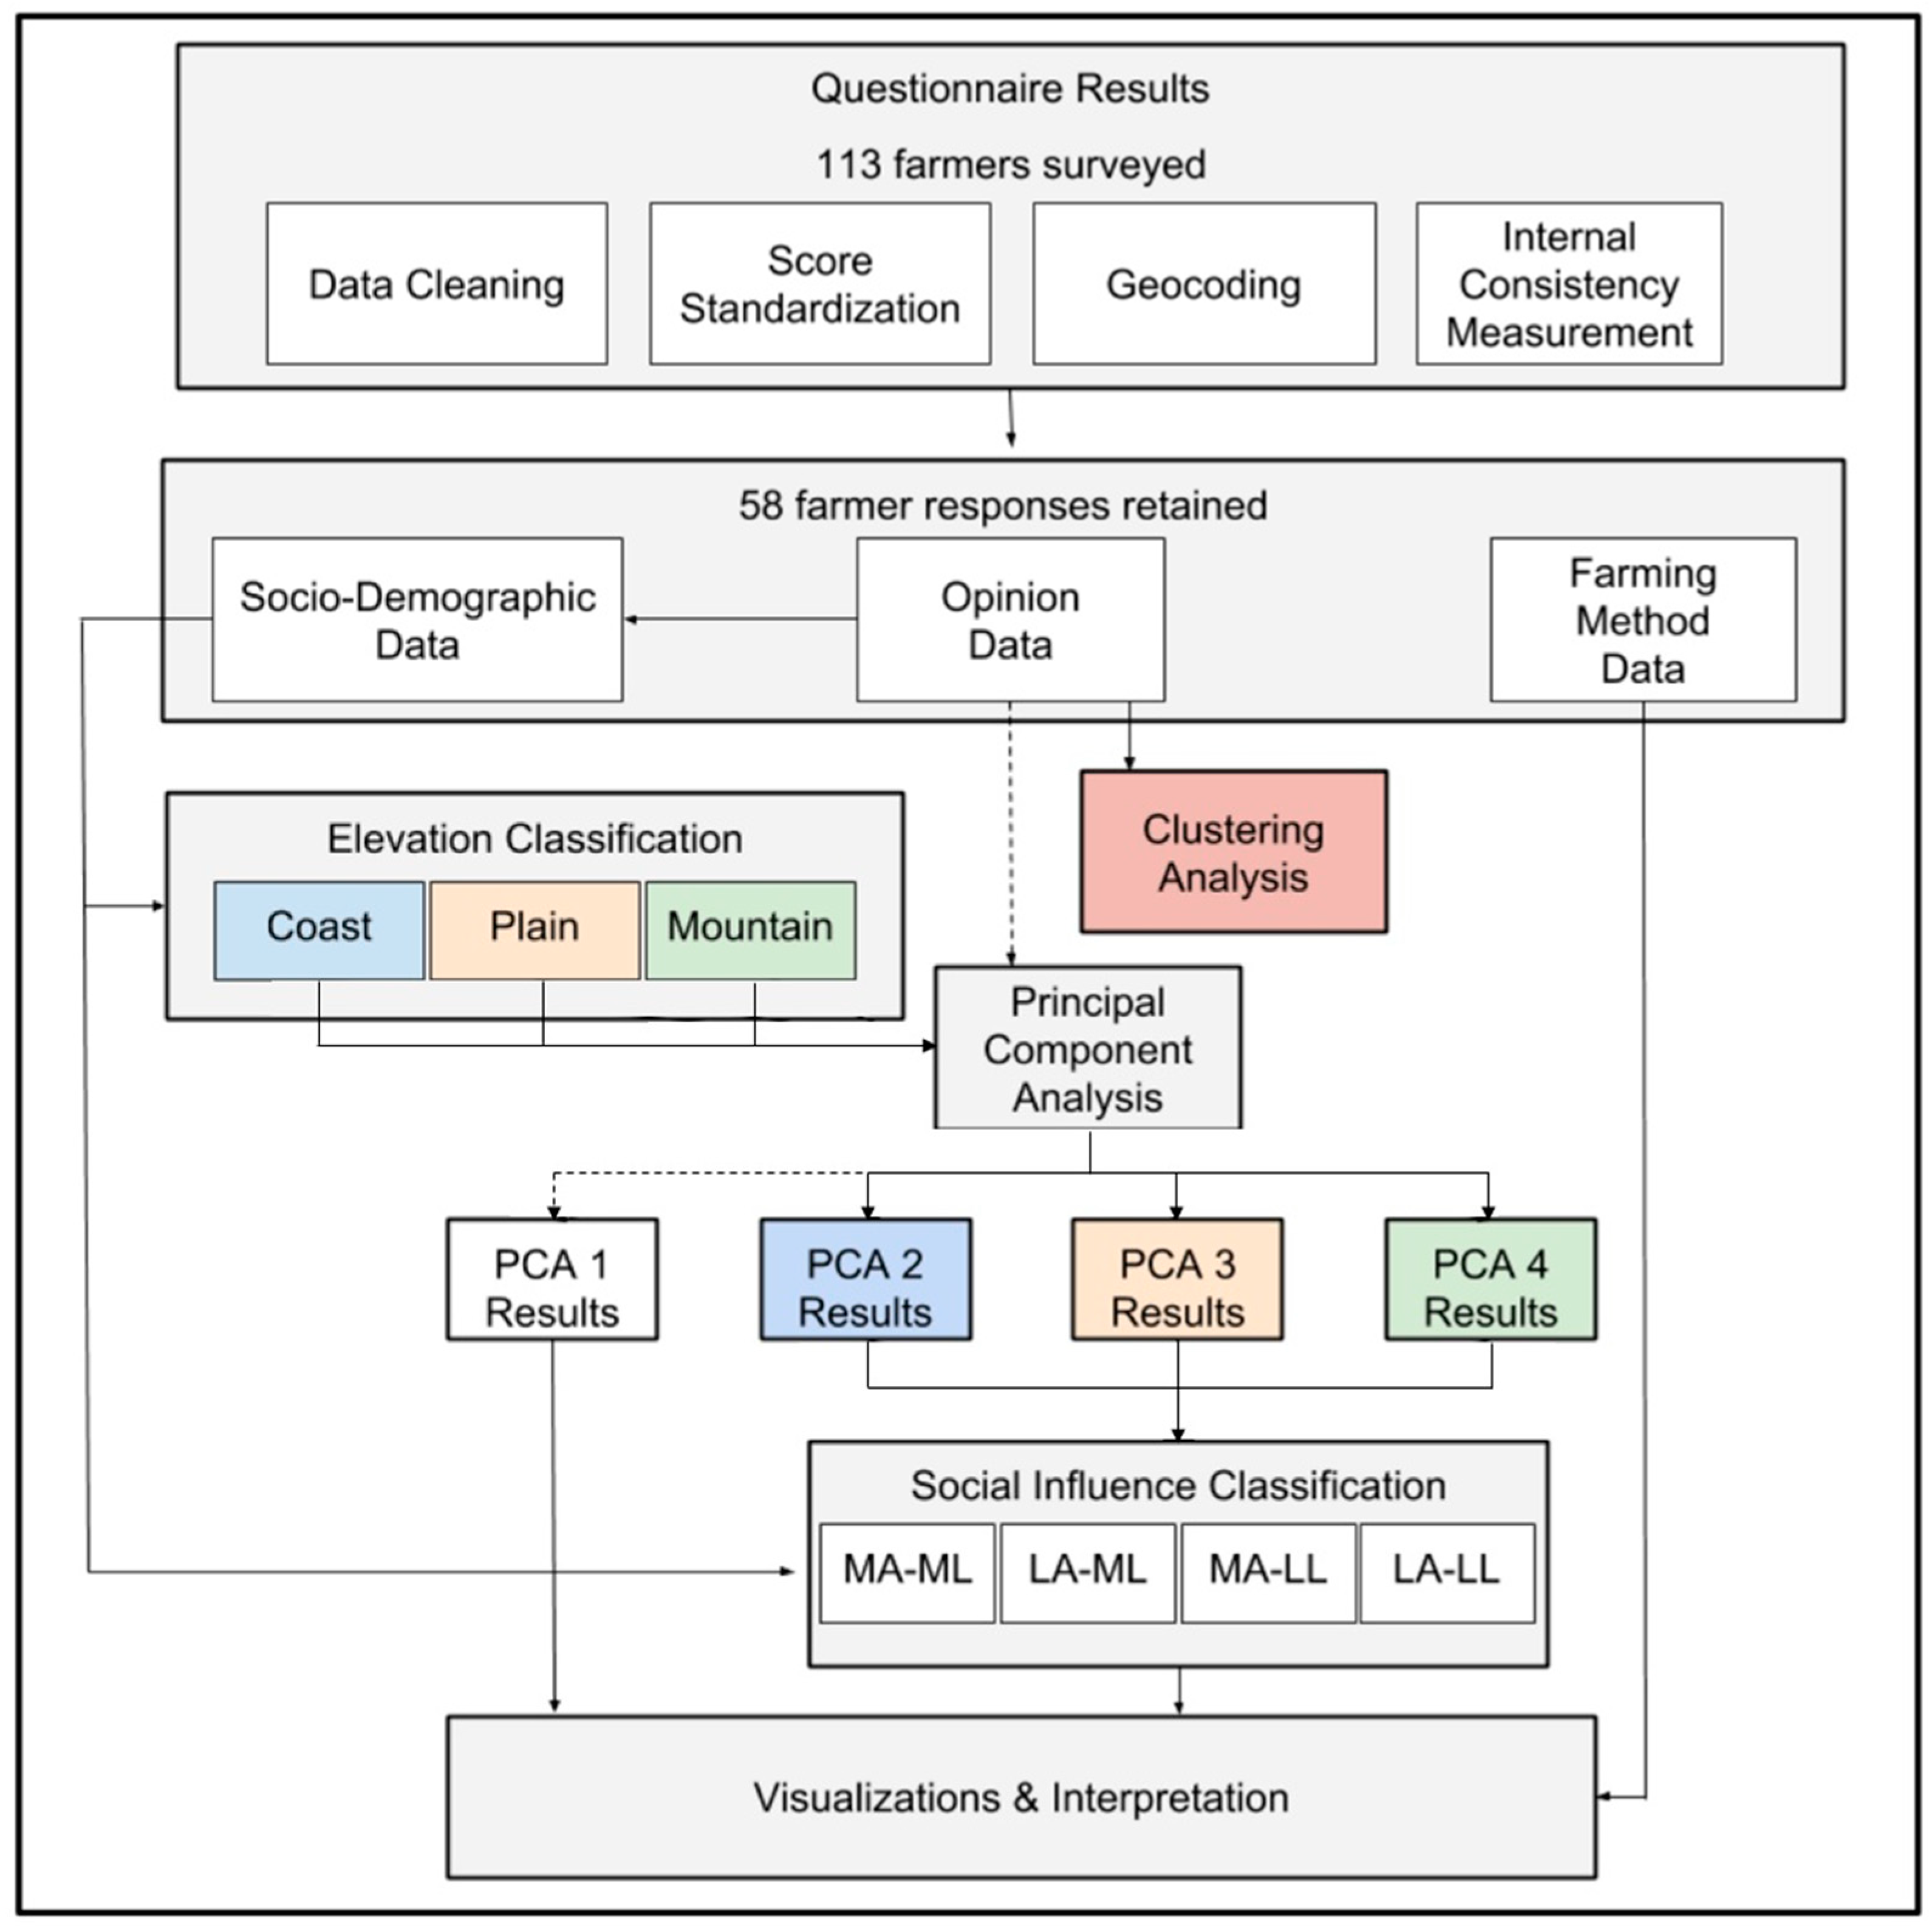
2. Materials and Methods
2.1. Study Area
2.2. Data
2.2.1. Clustering Analysis
2.2.2. Classification of Farmer Responses by Geographic Category
2.2.3. Classification of Farmer Responses by Social Influence Category
2.3. Principal Component Analysis
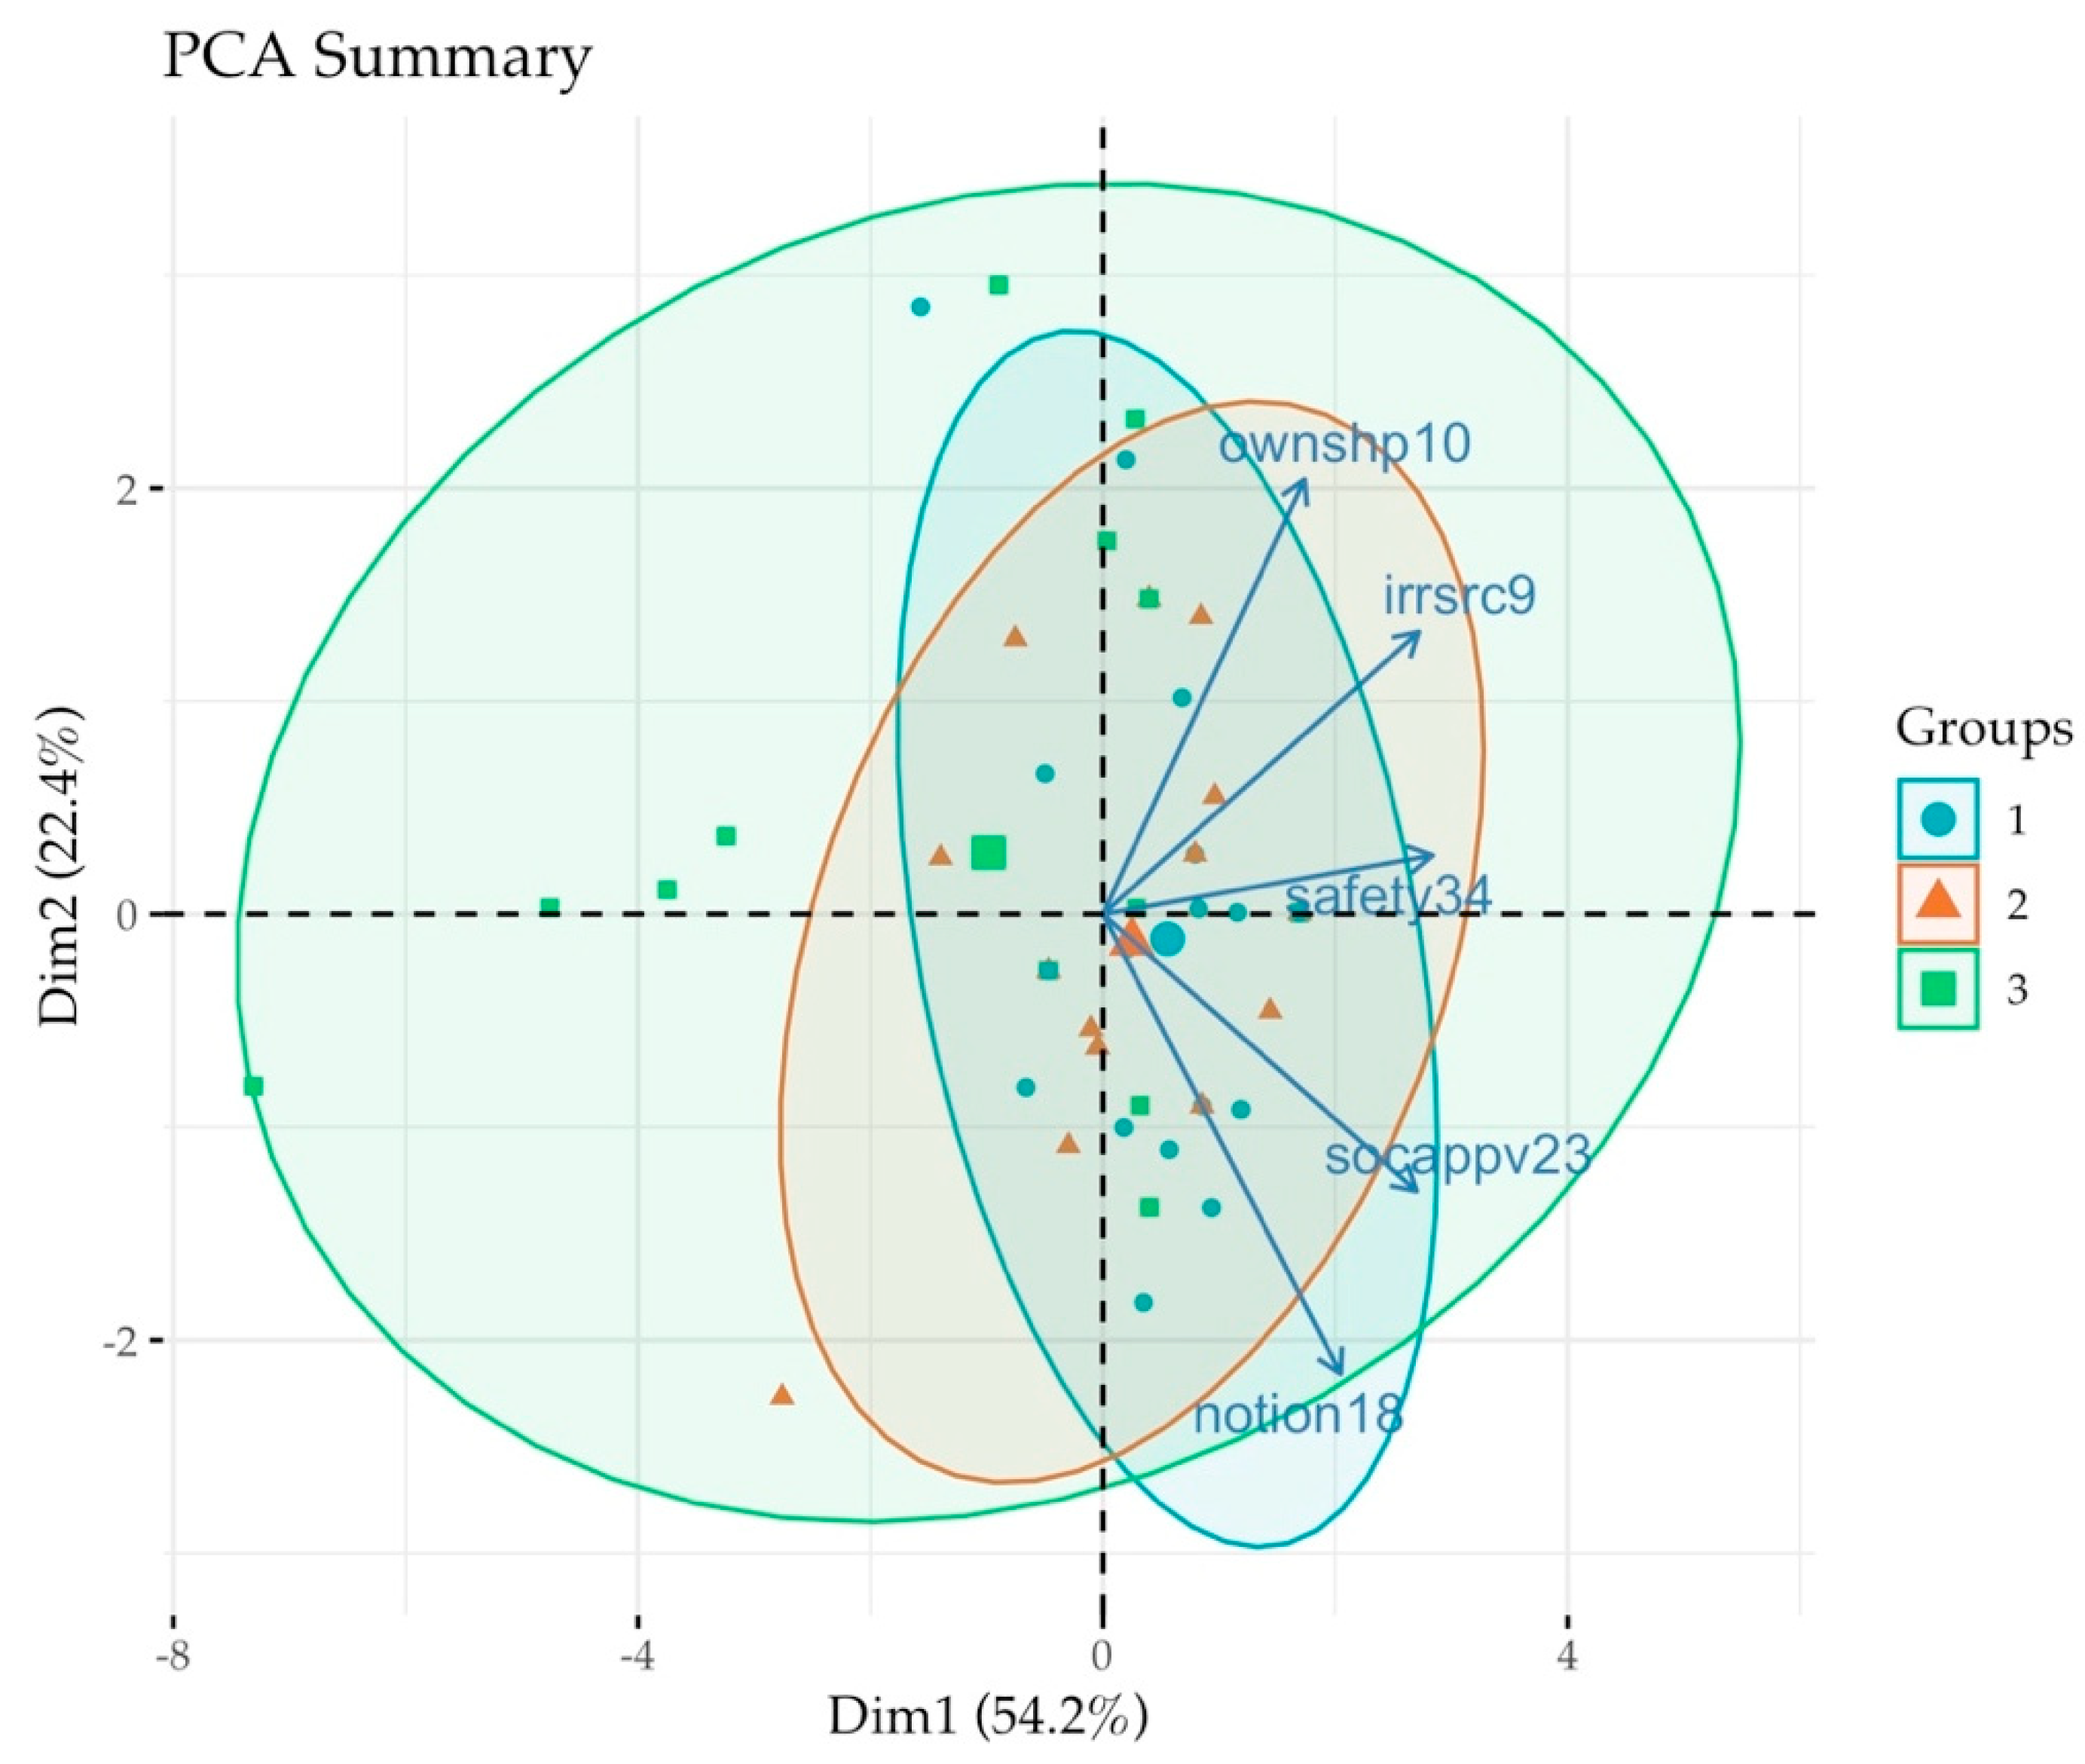
3. Results
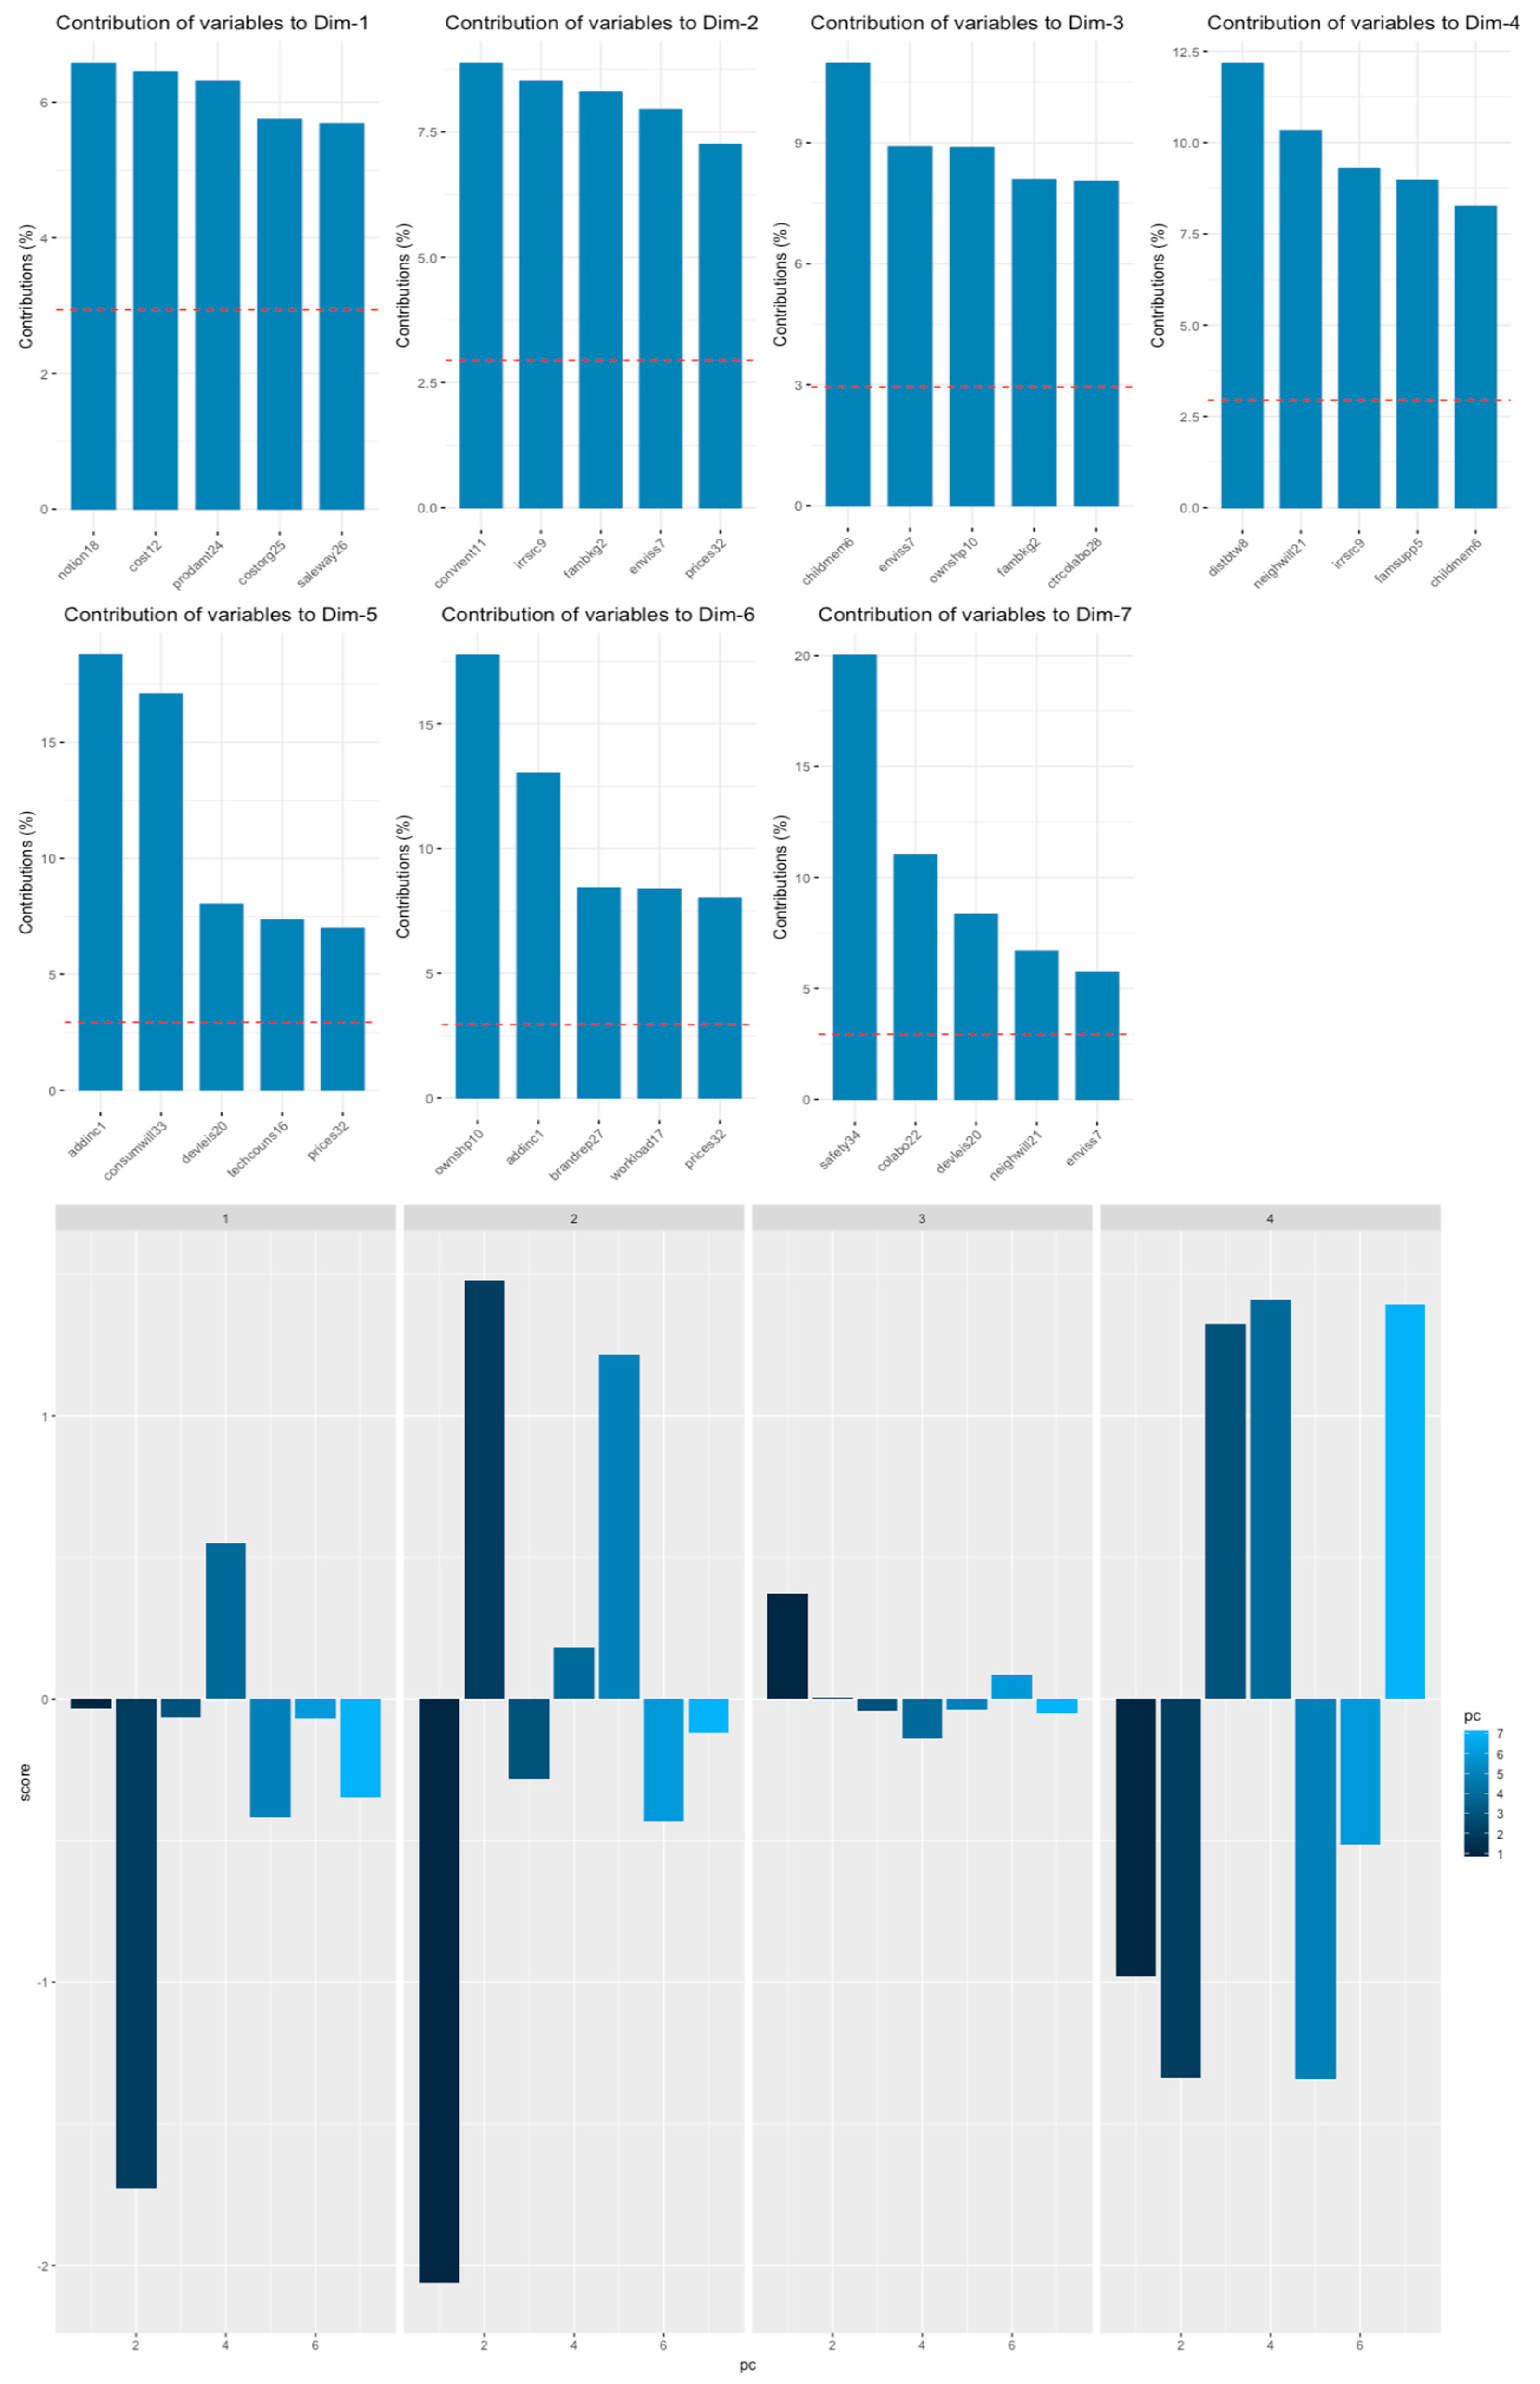
3.1. Total SEPL
Total SEPL Analysis: Transformation Cost, Family Background, and Consumer Behavior are Key
3.2. SEPL—Coast
3.2.1. Coast Analysis: The Organic Trend and Renting Farmland are Key
3.2.2. Coast Farmer Opinions Toward Organic Farming by Social Influence Category
3.3. SEPL—Plain
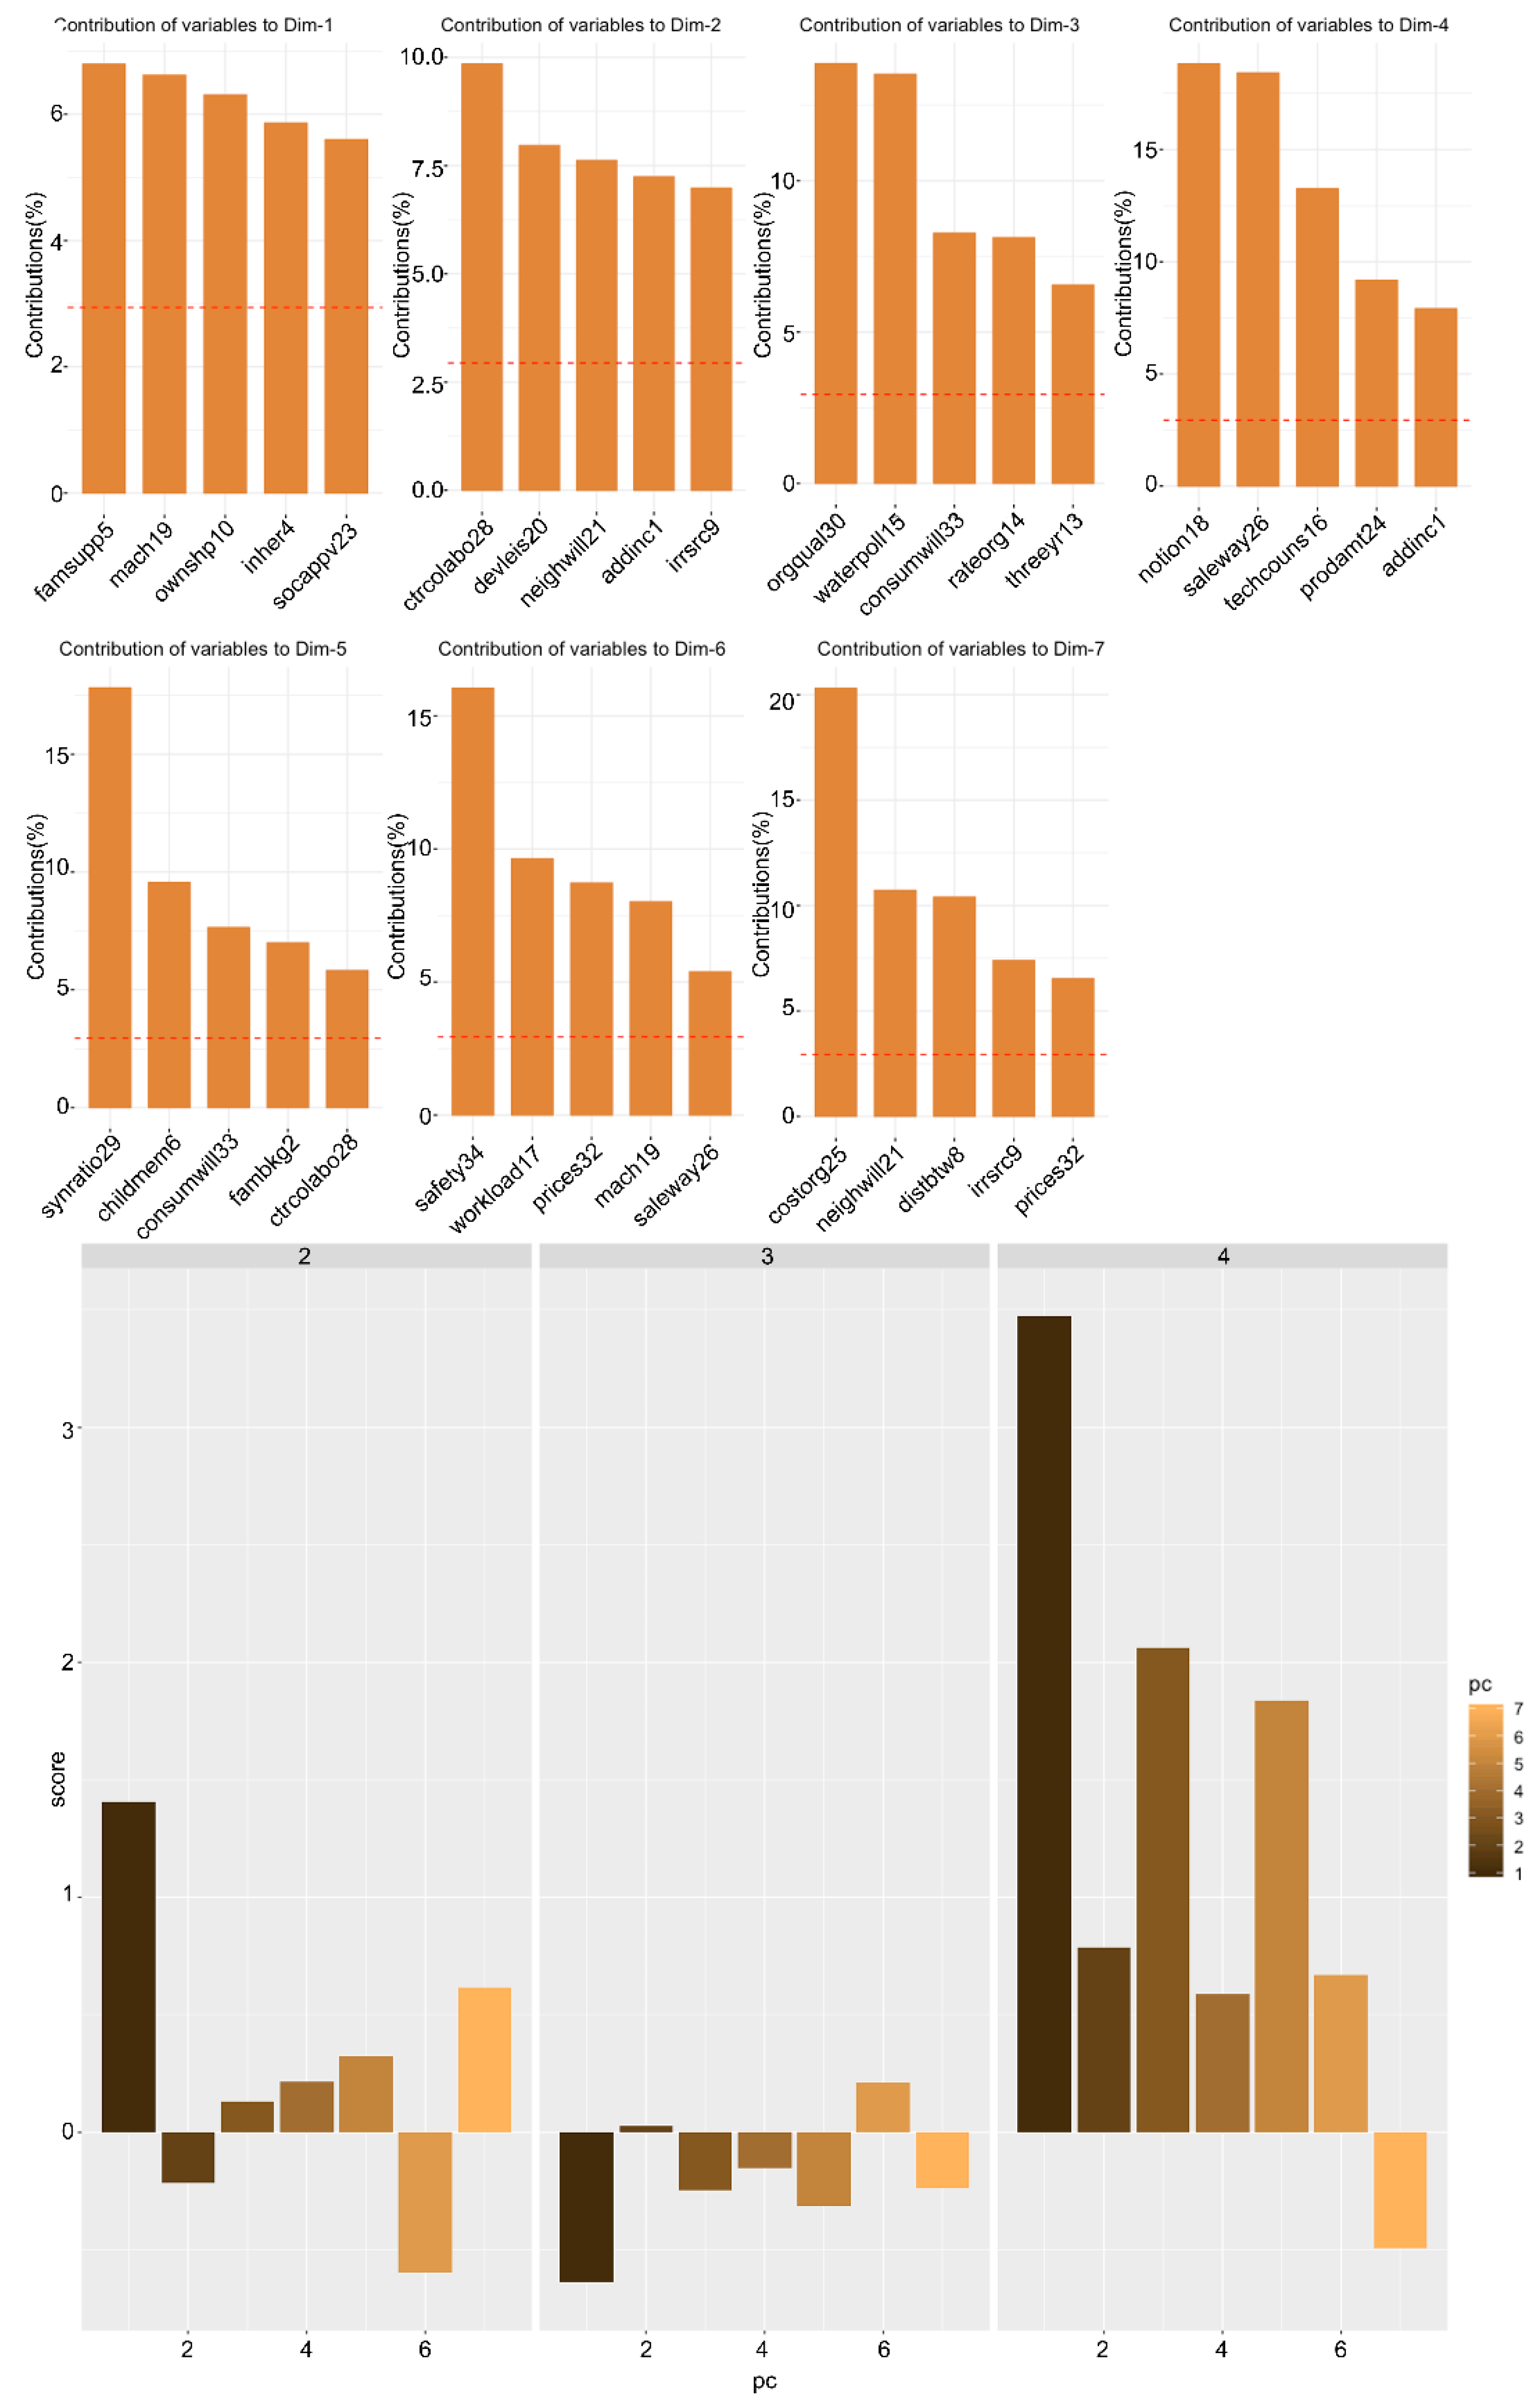
3.3.1. Plain Analysis: Family Support, Contracts, and Quality are Key
3.3.2. Plain Farmer Opinions toward Organic Farming by Social Influence Category
3.4. SEPL—Mountain
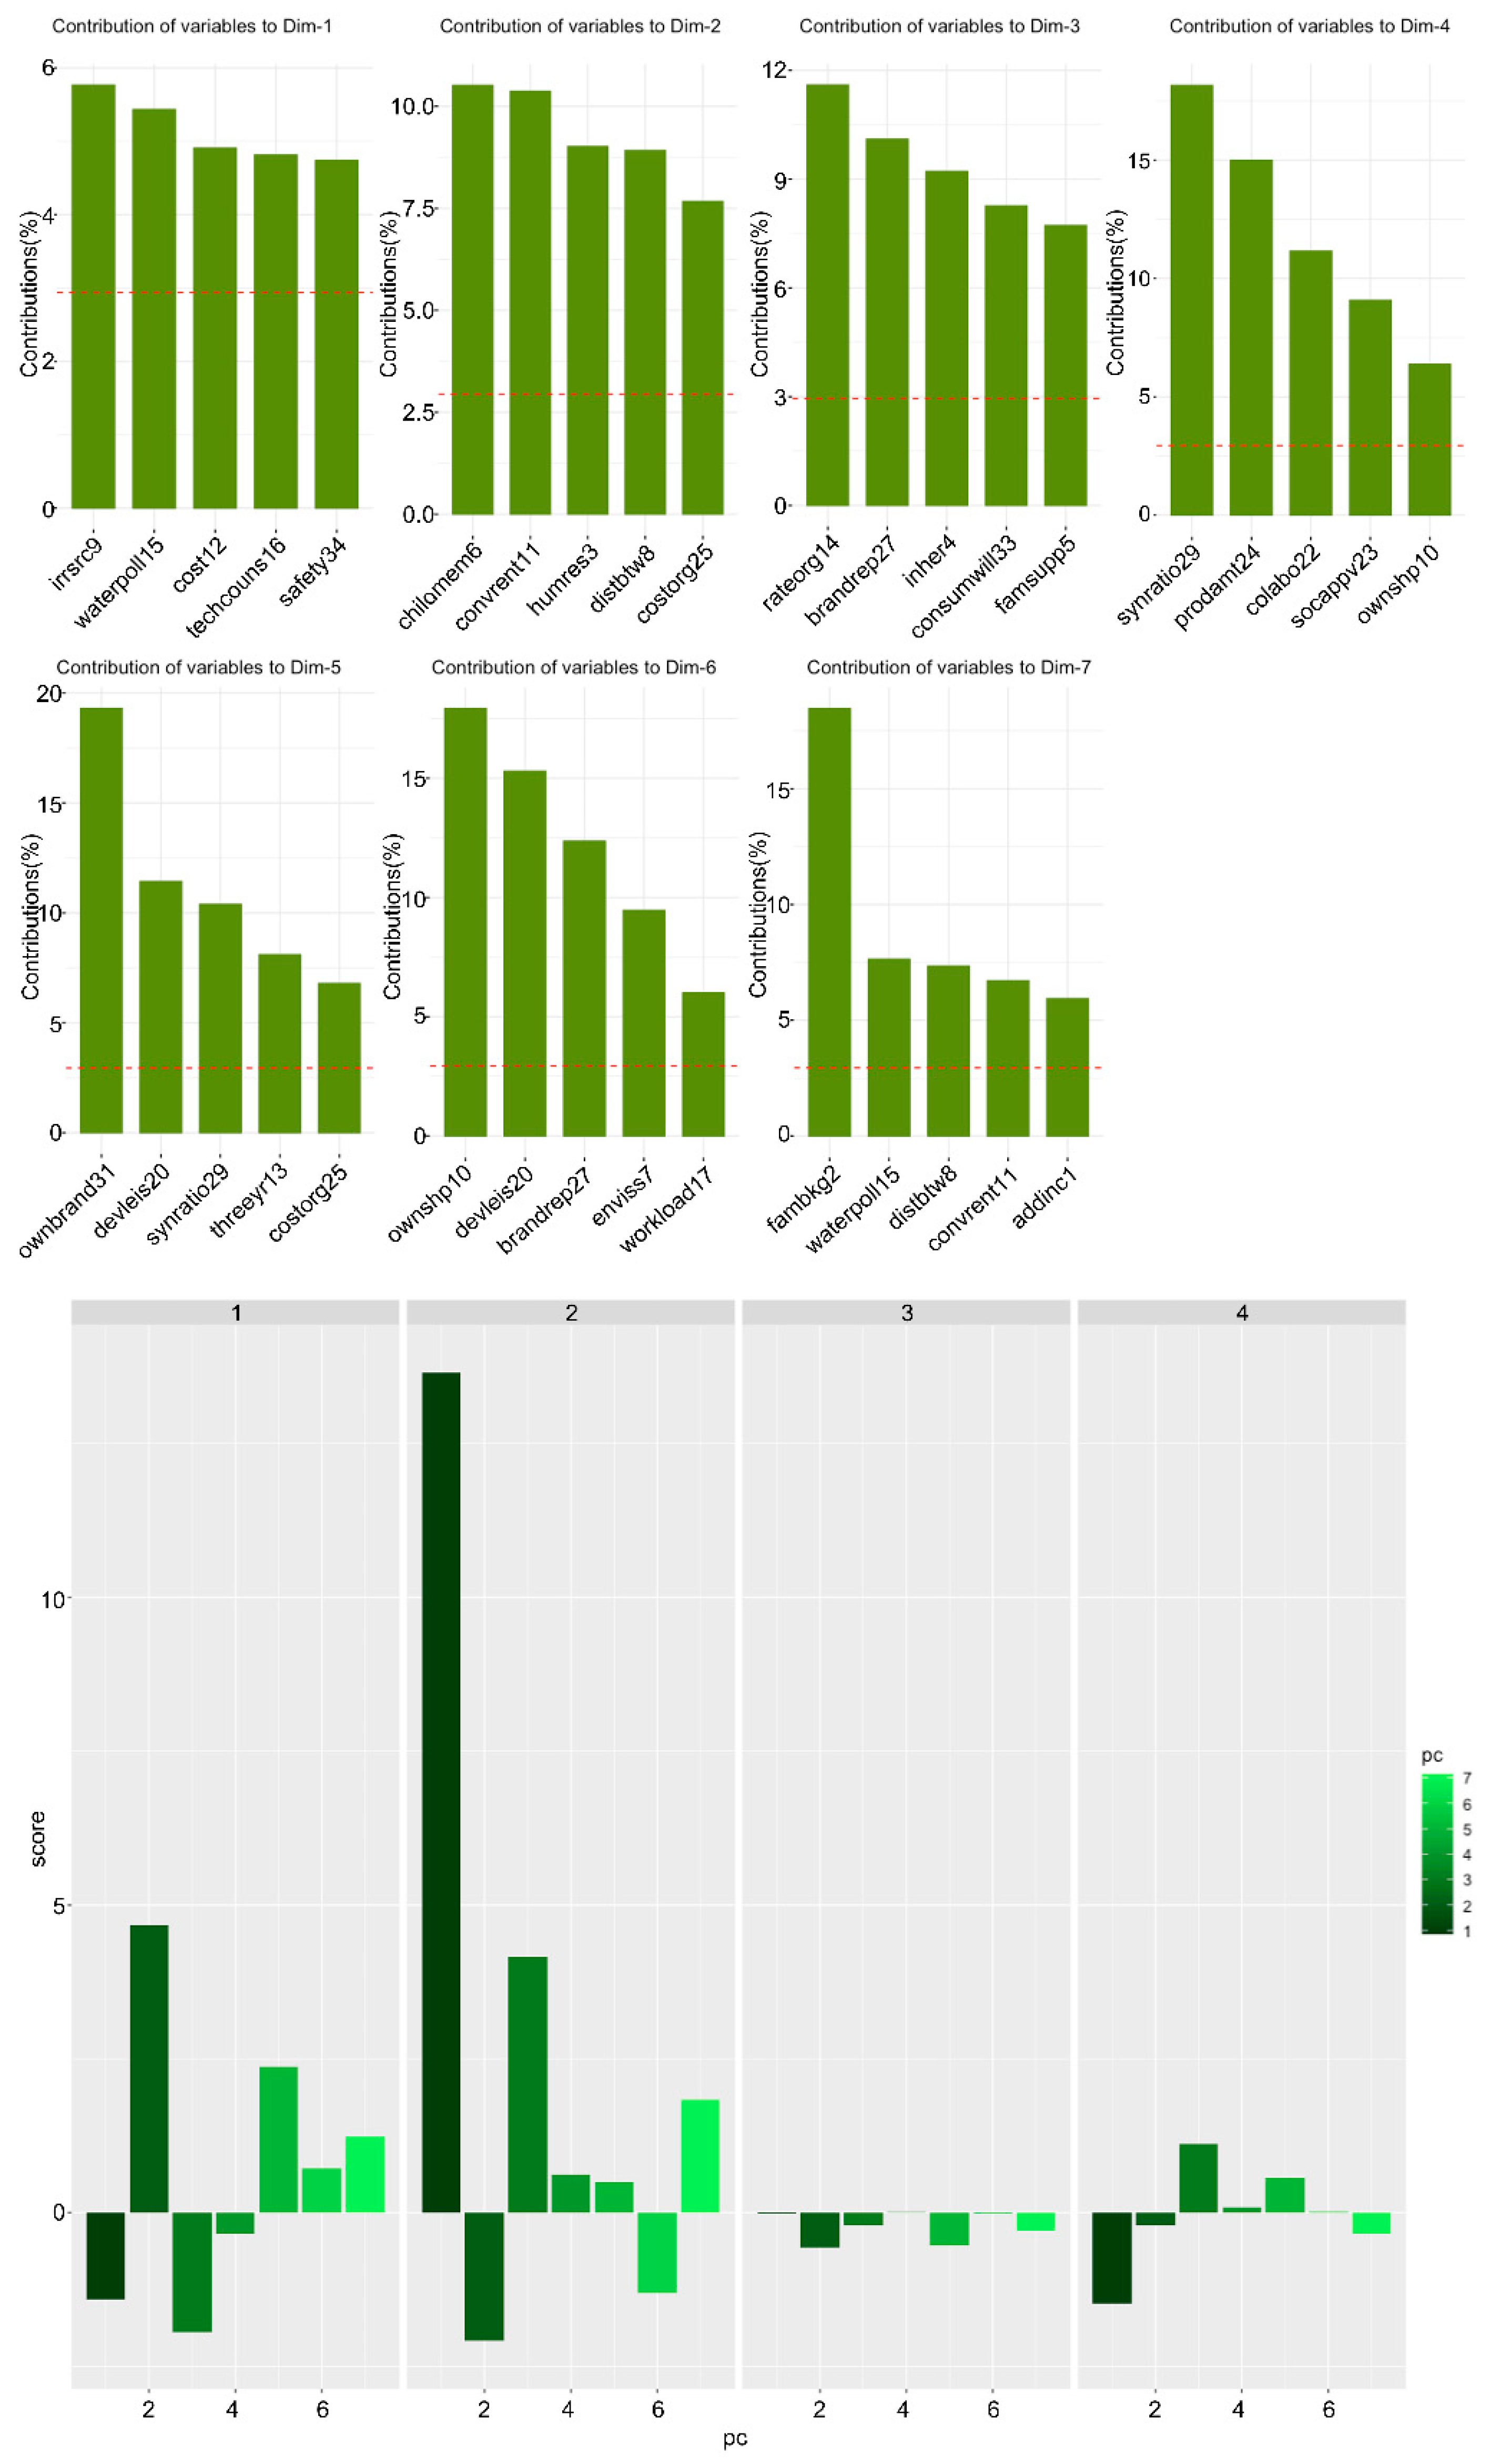
3.4.1. Mountain Analysis: Irrigation, Childhood Memories, and Neighborhood Farms are Key
3.4.2. Mountain Farmer Opinions toward Organic Farming by Social Influence Category
4. Discussion
4.1. Total SEPL
4.2. SEPL—Coast
4.3. SEPL—Plain
4.4. SEPL—Mountain
4.5. Summary
- coast farmers have the most positive opinions towards the importance of keeping up with organic farming trends as a reflection of consumer demand, though their profit motives may be stronger than environmental in deciding to farm organically;
- coast farmers have the most negative scores towards farm proximity to farmer’s residence, suggesting that farmers in this area live relatively close to their farms;
- plain farmers have positive opinions towards establishing contractual collaborations as a potential means to also achieve objectives related to consumer health and food safety, denoting a high interest in future opportunities;
- plain farmers have the most negative scores for family support (in both the material legacy sense that grants farmers access to farming resources, and the non-material sense of the term ‘support’), suggesting that family support is not lacking or problematic and may reflect a lower propensity toward risk aversion for farmers in this area with an established support system;
- mountain farmers had the most negative opinions overall, suggesting either that they perceive more barriers to transitioning to organic farming, namely, irrigation source issues, or general apathy towards influential aspects of transitioning to organic farming that were not at all addressed in the survey.
5. Limitations
6. Conclusions
Supplementary Materials
Author Contributions
Funding
Acknowledgments
Conflicts of Interest
References
- Asadollahpour, A.; Najafabadi, M.O.; Hosseini, S.J. Modeling behavior pattern of Iranian organic paddy farmers. Paddy Water Environ. 2016, 14, 221–229. [Google Scholar] [CrossRef]
- Stosch, K.C.; Quilliam, R.S.; Bunnefeld, N.; Oliver, D.M. Quantifying stakeholder understanding of an ecosystem service trade-off. Sci. Total Environ. 2019, 651, 2524–2534. [Google Scholar] [CrossRef] [PubMed]
- Tsvetkov, I.; Atanassov, A.; Vlahova, M.; Carlier, L.; Christov, N.; Lefort, F.; Tamm, L.; Iantcheva, A.; Herforth Rahmé, J.; Rakleova, G.; et al. Plant organic farming research–current status and opportunities for future development. Biotechnol. Biotechnol. Equip. 2018, 32, 241–260. [Google Scholar] [CrossRef]
- De Groot, R.; Alkemade, R.; Braat, L.; Hein, L.; Willemen, L. Challenges in integrating the concept of ecosystem services and values in landscape planning, management and decision making. Ecol. Complex. 2010, 7, 260–272. [Google Scholar] [CrossRef]
- Issa, I.; Hamm, U. Adoption of organic farming as an opportunity for Syrian farmers of fresh fruit and vegetables: An application of the theory of planned behaviour and structural equation modelling. Sustainability 2017, 9, 2024. [Google Scholar] [CrossRef]
- Pacifico, D.; Onofri, C.; Parisi, B.; Ostano, P.; Mandolino, G. Influence of Organic Farming on the Potato Transcriptome. Sustainability 2017, 9, 779. [Google Scholar] [CrossRef]
- Šūmane, S.; Kunda, I.; Knickel, K.; Strauss, A.; Tisenkopfs, T.; des Ios Rios, I.; Rivera, M.; Chebach, T.; Ashkenazy, A. Local and farmers’ knowledge matters! How integrating informal and formal knowledge enhances sustainable and resilient agriculture. J. Rural Stud. 2018, 59, 232–241. [Google Scholar] [CrossRef]
- Marsh, L.; Zoumenou, V.; Cotton, C.; Hashem, F. Organic farming: knowledge, practices, and views of limited resource farmers and non-farmers on the Delmarva Peninsula. Organ. Agric. 2017, 7, 125–132. [Google Scholar] [CrossRef]
- Vaske, J.; Donnelly, M.; Williams, D.; Jonker, S. Demographic influences on environmental value orientations and normative beliefs about national forest management. Soc. Nat. Resour. 2001, 14, 761–776. [Google Scholar]
- Van Riper, C.; Lum, C.; Kyle, G.; Wallen, K.; JAbsher, J.; Landon, A. Values, Motivations, and Intentions to Engage in Proenvironmental Behavior. Environ. Behav. 2018. [Google Scholar] [CrossRef]
- UNU-IAS and IGES. IPSI Case Study Review—A Review of 80 Case Studies under the International Partnership for the Satoyama Initiative (IPSI); United Nations University Institute for the Advanced Study of Sustainability: Tokyo, Japan, 2015. [Google Scholar]
- Morgera, E.; Caro, C.; Duran, G. Organic Agriculture and the Law, Food and Agriculture Organization of the United Nations Legislative Study 107. 2012. Available online: http://www.fao.org/docrep/016/i2718e/i2718e.pdf (accessed on 22 May 2019).
- Postma-Blaauw, M.; de Goede, R.; Bloem, J. Agricultural identification and de-intensification differentially after taxonomic diversity of predatory mites, earthworms, enchytraeids, nematodes and bacteria. Appl. Soil Ecol. 2012, 57, 39–49. [Google Scholar] [CrossRef]
- Holzschuh, A.; Steffan-Dewenter, I.; Tscharntke, T. Agricultural landscapes with organic crops support higher pollinator diversity. Oikos 2008, 117, 354–361. [Google Scholar] [CrossRef]
- Kehinde, T.; Samways, M. Endemic pollinator response to organic vs. conventional farming and landscape context in the Cape Floristic Region biodiversity hotspot. Agric. Ecosyst. Environ. 2012, 146, 162–167. [Google Scholar] [CrossRef]
- Lin, S.; Wu, R.; Yang, F.; Wang, J.; Wu, W. Spatial trade-offs and synergies among ecosystem services within a global biodiversity hotspot. Ecol. Indic. 2018, 84, 371–381. [Google Scholar] [CrossRef]
- Andersson, E.; Nykvist, B.; Malinga, R.; Jaramillo, F.; Lindborg, R. A social–ecological analysis of ecosystem services in two different farming systems. Ambio 2015, 44, 102–112. [Google Scholar] [CrossRef] [PubMed]
- International Monetary Fund. Available online: www.imf.org (accessed on 15 November 2018).
- Hsu, J.A. Globalization, land expropriation, and community resistance: A case study in Wanbao community, Miaoli County, Taiwan. M.U.P. Thesis, University of Illinois at Urbana-Champaign, Champaign, IL, USA, April 2017. [Google Scholar]
- Wei, S. The Dilemmas of Peach Blossom Valley: The Resurgence of Rice-Terrace Farming in Gongliao District, Taiwan. In The Living Politics of Self-Help Movements in East Asia; Palgrave Macmillan: Singapore, 2018; pp. 163–187. [Google Scholar]
- Bergman, M.M. A theoretical note on the differences between attitudes, opinions, and values. Swiss Political Sci. Rev. 1998, 4, 81–93. [Google Scholar] [CrossRef]
- Schultz, P.W.; Zelezny, L. Values as predictors of environmental attitudes: Evidence for consistency across 14 countries. J. Environ. Psychol. 1999, 19, 255–265. [Google Scholar] [CrossRef]
- Doshita, M. The Globalisation of Symbolic Concepts of Nature A Case Study of Satoyama; TAMA University: Tama, Japan, 2015; Available online: https://tama.repo.nii.ac.jp/?action=repository_uri&item_id=259&file_id=22&file_no=1 (accessed on 10 January 2019).
- Takeuchi, K. Rebuilding the relationship between people and nature: The Satoyama Initiative. Ecol. Res. 2010, 25, 891–897. [Google Scholar] [CrossRef]
- Chang, S.E. Blue Magpie TEAgriculture: Eco-tea Cultivation and Participatory Farming in Pinglin Satoyama, Taiwan. Procedia Soc. Behav. Sci. 2013, 101, 14–22. [Google Scholar] [CrossRef]
- Shiu, Y.S.; Lui, L.W. Crowdsourcing as a participative tool in a landscape conservation initiative at the urban rural buffer zone: A case study of the Waipu District in Taichung, Taiwan. PLERUS 2016, [Etapa I], 157–172. Available online: https://pdfs.semanticscholar.org/7166/dc3aa3da78de8dc6bc18a0559d7b990575ec.pdf (accessed on 18 January 2019).
- Willer, H.; Lernoud, J. (Eds.) The World of Organic Agriculture. Statistics and Emerging Trends 2019; Research Institute of Organic Agriculture (FiBL), Frick, and IFOAM—Organics International: Bonn, Germany, 2019; Available online: https://shop.fibl.org/CHen/mwdownloads/download/link/id/1202/?ref = 1 (accessed on 2 May 2019).
- Jiang, W.J.; Yir-Hueih, L.U.H. Does higher food safety assurance bring higher returns? Evidence from Taiwan. Agric. Econ. 2018, 64, 477–488. [Google Scholar] [CrossRef]
- Anderson-Sprecher, A.; Wu, P. Growing Demand for Organics in Taiwan Stifled by Unique Regulatory Barriers; GAIN Report Number TW17006, Global Agricultural Information Network Report; United States Department of Agriculture Foreign Agricultural Service: Washington, DC, USA, 2017. [Google Scholar]
- Sun, C.H.; Lin, L.; Hsu, C.Y.; Fan, M.L. Promotion of Organic Agriculture in Eastern Taiwan. J. World Herit. Stud. 2017, 11–16. Available online: http://doi.org/10.15068/00148443 (accessed on 5 June 2019).
- Lin, Y.-P.; Cheng, B.-Y.; Chu, H.-J.; Chang, T.-K. Assessing how heavy metal pollution and human activity are related by using logistic regressions and kriging methods. Geoderma 2011, 163, 275–282. [Google Scholar] [CrossRef]
- Miaoli County Government Household Registration Service. Available online: https://mlhr.miaoli.gov.tw/ (accessed on 1 December 2018).
- Miaoli Government. Available online: https://www.miaoli.gov.tw/eng/1-1.php (accessed on 15 November 2018).
- Miaoli Government News. The Wizard of the Green: Leopard Cat Conservation. Available online: http://www.sanyi.gov.tw/eng/8-1-1.php?forewordID = 258944&print = 1 (accessed on 15 November 2018).
- UNU-IAS; IGES. Socio-Economic Production Landscapes in Asia; University Institute for the Advanced Study of Sustainability: Tokyo, Japan, 2018. [Google Scholar]
- International Partnership for the Satoyama. Available online: https://satoyama-initiative.org (accessed on 15 January 2019).
- IPSI Secretariat. The International Partnership for the Satoyama Initiative (IPSI): Information Booklet and 2016 Annual Report; United Nations University Institute for the Advanced Study of Sustainability: Tokyo, Japan, 2017. [Google Scholar]
- National Development Council, Map of Taiwan Cities & Counties. Available online: https://data.gov.tw/dataset/7442 (accessed on 30 June 2019).
- National Land Surveying and Mapping Center. Land Use Map. Available online: http://www.nlsc.gov.tw/Land (accessed on 30 June 2019).
- Nandi, R.; Gowdru, N.V.; Bokelmann, W.; Dias, G. Smallholder organic farmer’s attitudes, objectives and barriers towards production of organic fruits and vegetables in India: A multivariate analysis. Emir. J. Food Agric. 2015, 27, 396–406. Available online: https://doi.org/10.9755/ejfa.2015.04.038 (accessed on 30 June 2019). [CrossRef]
- Revelle, W. R-Package ‘Psych’: Procedures for Personality and Psychological Research; Northwestern University: Evanston, IL, USA, 2018. [Google Scholar]
- Suzuki, R.; Shimodaira, H. R-Package ‘pvclust’. Hierarchical Clustering with P-Values via Multiscale Bootstrap Resampling. 2015. Available online: http://stat.sys.i.kyoto-u.ac.jp/prog/pvclust/ (accessed on 6 November 2018).
- United States Geological Survey Website. “What Is the Difference between ‘Mountain’, ‘Hill’, ‘Peak’; ‘Lake’ and ‘Pond’; or ‘River’ and ‘Creek’?”. Available online: https://www.usgs.gov/faqs/what-difference-between-mountain-hill-and-peak-lake-and-pond-or-river-and-creek (accessed on 11 February 2019).
- Arcury, T.; Christianson, E. Rural-Urban Differences in Environmental Knowledge and Actions. J. Environ. Educ. 1993, 25, 19–25. [Google Scholar] [CrossRef]
- Gifford, R.; Nilsson, A. Personal and social factors that influence pro-environmental concern and behaviour: A review. Int. J. Psychol. 2014, 49, 141–157. [Google Scholar] [CrossRef] [PubMed]
- Ang, S. Life course social connectedness: Age-cohort trends in social participation. Adv. Life Course Res. 2019, 39, 13–22. [Google Scholar] [CrossRef]
- Vesely, S.; Klöckner, C.A. Global social norms and environmental behavior. Environ. Behav. 2018, 50, 247–272. [Google Scholar] [CrossRef]
- Le, S.; Josse, J.; Husson, F. FactoMineR: An R Package for Multivariate Analysis. J. Stat. Softw. 2008, 25, 1–18. [Google Scholar] [CrossRef]
- The Pennsylvania State University Eberly College of Science Department of Statistics. (n.d.). “Interpretation of the Principal Components”. Available online: https://newonlinecourses.science.psu.edu/stat505/lesson/11/11.4 (accessed on 18 January 2019).
- Kassambara, A.; Mundt, F. R-Package ‘Factoextra’. Extract and Visualize the Results of Multivariate Data Analyses. 2017. Available online: https://CRAN.R-project.org/package=factoextra (accessed on 11 December 2018).
- Wickham, H. ggplot2: Elegant Graphics for Data Analysis; Springer: New York, NY, USA, 2009. [Google Scholar]
- Stacklies, W.; Redestig, H.; Wright, K. R-Package ‘pcaMethods’. A Collection of PCA Methods. 2018. Available online: https://github.com/hredestig/pcamethods (accessed on 6 November 2018).
- Abdi, H.; Williams, L. Principal Component Analysis. In Wiley Interdisciplinary Reviews: Computational Statistics; Wiley Periodicals, Inc.: Hoboken, NJ, USA, 2010; Volume 2, pp. 433–459. [Google Scholar]
- Husson, F.; Le, S.; Pages, J. Exploratory Multivariate Analysis by Example Using R, Chapman and Hall; CRC Press Book: Boca Raton, FL, USA, 2010. [Google Scholar]
- Chouichom, S.; Yamao, M. Organic Fertilizer Use in Northeastern Thailand: An Analysis of Some Factors Affecting Farmers’ Attitudes. In Sustainable Agricultural Development; Springer: Dordrecht, The Netherlands, 2011; pp. 185–196. [Google Scholar]
- Jollife, I.T. Principal Component Analysis, 2nd ed.; Springer: New York, NY, USA, 2002. [Google Scholar]
- Peres-Neto, P.R.; Jackson, D.A.; Somers, K.M. How Many Principal Components? Stopping Rules for Determining the Number of Non-Trivial Axes Revisited. Br. J. Stat. Psychol. 2005, 49, 974–997. [Google Scholar] [CrossRef]
- Thuleau, S.; Francois Husson, F. R-Package ‘FactoInvestigate’. Automatic Description of Factorial Analysis. 2018. Available online: https://cran.r-project.org/web/packages/FactoInvestigate/index.html (accessed on 9 January 2019).
- Plieninger, T.; van der Horst, D.; Schleyer, C.; Bieling, C. Sustaining ecosystem services in cultural landscapes. Ecol. Soc. 2014, 19. [Google Scholar] [CrossRef]
- Kyttä, M.; Broberg, A.; Tzoulas, T.; Snabb, K. Towards contextually sensitive urban densification: Location-based softGIS knowledge revealing perceived residential environmental quality. Landsc. Urban Plan. 2013, 113, 30–46. [Google Scholar] [CrossRef]
- Sherrouse, B.C.; Clement, J.M.; Semmens, D.J. A GIS application for assessing, mapping, and quantifying the social values of ecosystem services. Appl. Geogr. 2011, 31, 748–760. [Google Scholar] [CrossRef]
- Van Riper, C.J.; Kyle, G.T. Capturing multiple values of ecosystem services shaped by environmental worldview: a spatial analysis. J. Environ. Manag. 2014, 145, 374–384. [Google Scholar] [CrossRef] [PubMed]
- Van Riper, C.J.; Kyle, G.T.; Sherrouse, B.C.; Bagstad, K.J.; Sutton, S.G. Toward an integrated understanding of perceived biodiversity values and environmental conditions in a national park. Ecol. Indic. 2017, 72, 278–287. [Google Scholar] [CrossRef]
- Alwin, D.F.; Krosnick, J.A. The reliability of survey attitude measurement. In Sociological Methods & Research; Alwin, D.F., Ed.; Sage: Thousand Oaks, CA, USA, 1991; Volume 20, pp. 139–181. [Google Scholar]
- Agunga, R.; Igodan, C. Organic farmers need and attitude towards extension. J. Ext. 2007, 45. Available online: https://www.joe.org/joe/2007december/a6.php (accessed on 5 June 2019).
- Middendorf, G. Challenges and information needs of organic growers and retailers. J. Ext. 2007, 45. Available online: https://www.joe.org/joe/2007august/a7.php (accessed on 5 June 2019).
- Suvedi, M.; Jeong, E.; Coombs, J. Education needs of Michigan farmers. J. Ext. 2010, 48. Available online: https://www.joe.org/joe/2010june/rb7.php (accessed on 5 June 2019).
- Farmer, J.; Epstein, G.; Watkins, S.; Mincey, S. Organic farming in West Virginia: A behavioral approach. J. Agric. Food Syst. Commun. 2014, 4, 155–171. [Google Scholar] [CrossRef]
- Uetake, T.; Kabaya, K.; Ichikawa, K.; Moriwake, N.; Hashimoto, S. Quantitative analysis of national biodiversity strategy and action plans about incorporating integrated approaches in production landscapes. J. Environ. Plan. Manag. 2019, 1–25. [Google Scholar] [CrossRef]
- Gattinger, A.; Muller, A.; Haeni, M.; Skinner, C.; Fliessbach, A.; Buchmann, N.; Mäder, P.; Stolze, M.; Smith, P.; Niggli, U.; et al. Enhanced top soil carbon stocks under organic farming. Proc. Natl. Acad. Sci. USA 2012, 109, 18226–18231. [Google Scholar] [CrossRef] [PubMed]
- Mader, P.; Fliebbach, A.; Dubois, D. Soil fertility and biodiversity in organic farming. Science 2002, 296, 1696–1697. [Google Scholar] [CrossRef] [PubMed]
- Corsi, S.; Friedrich, T.; Kassam, A. Soil Organic Carbon Accumulation and Greenhouse Gas Emission Reductions from Conservation Agriculture: A Literature Review; FAO: Rome, Italy, 2012. [Google Scholar]
- Jarosch, K.; Oberson, A.; Emmanuel, F.; Gunst, L.; Dubois, D.; Mäder, P.; Mayer, J. Phosphorus (P) balances and P availability in a field trial comparing organic and conventional farming systems since 35 years. In Proceedings of the 19th EGU General Assembly (EGU2017), Vienna, Austria, 23–28 April 2017; European Geosciences Union: Munich, Germany, 2017; p. 15377. [Google Scholar]
- O’Brien, K.; Sygna, L. Responding to climate change: The three spheres of transformation. In Proceedings of the Transformation in a Changing Climate, Oslo, Norway, 19–21 June 2013; pp. 16–23. [Google Scholar]
- James, T.; Brown, K. Muck and Magic: A Resilience Lens on Organic Conversions as Transformation. Soc. Nat. Resour. 2019, 32, 133–149. [Google Scholar] [CrossRef]
- Hansson, H. How can farmer managerial capacity contribute to improved farm performance? A study of dairy farms in Sweden. Acta Agric. Scand. Sect. C 2008, 5, 44–61. [Google Scholar] [CrossRef]
- Kafle, B. Factors affecting adoption of organic vegetable farming in Chitwan District, Nepal. World J. Agric. Sci. 2011, 7, 604–606. [Google Scholar]
- Chyung, S.Y.; Roberts, K.; Swanson, I.; Hankinson, A. Evidence-based survey design: The use of a midpoint on the Likert scale. Perform. Improv. 2017, 56, 15–23. [Google Scholar] [CrossRef]


| Variable | Frequency | % | Variable | Frequency | % |
|---|---|---|---|---|---|
| Current-Future Method | Gender | ||||
| Conventional-Conventional | 17 | 29 | Male | 53 | 91 |
| Conventional-Organic | 7 | 12 | Female | 5 | 9 |
| Organic-Organic | 32 | 55 | |||
| Organic-Conventional | 2 | 3 | |||
| AGE | Education | ||||
| 20 s and under | 6 | 10 | None | 1 | 2 |
| 30 s | 6 | 10 | Elementary | 18 | 31 |
| 40 s | 9 | 16 | Junior High | 13 | 22 |
| 50 s | 16 | 28 | High School/Polytechnic | 14 | 24 |
| 60 s | 9 | 16 | Undergraduate | 11 | 19 |
| 70 s and above | 12 | 21 | Graduate | 1 | 2 |
| Government Training | Experience Farming | ||||
| 1–2 times | 40 | 69 | 1–10 years | 16 | 28 |
| 3–4 times | 5 | 9 | 11–20 years | 10 | 17 |
| 5–6 times | 7 | 12 | 21–20 years | 14 | 24 |
| 7–8 times | 1 | 2 | 31–40 years | 3 | 5 |
| 9–10 times | 1 | 2 | ≥41 years | 15 | 26 |
| ≥11 times | 4 | 7 |
| Farm Elevation (m) | Geographic Category | Sample Size |
|---|---|---|
| 9–91 | Coast | 22 |
| 92–122 | Plain | 18 |
| 123–151 | Mountain | 18 |
| Standard Scale | 0 | 1 | 2 | 3 | 4 | 5 |
|---|---|---|---|---|---|---|
| None | Elementary | Junior High | High/Poly | College | Master’s+ | |
| Academic Level Achieved | 1 | 18 | 13 | 14 | 11 | 1 |
| 20 s below | 30 s | 40 s | 50 s | 60 s | 70 s above | |
| Age | 6 | 6 | 9 | 16 | 9 | 12 |
| <1 year | 1–10 years | 11–20 years | 21–20 years | 31–40 years | 41+ years | |
| Farming Experience | 0 | 16 | 10 | 14 | 3 | 15 |
| 1–2 times | 3–4 times | 5–6 times | 7–8 times | 9–10 times | 11+ times | |
| Organic Training | 40 | 5 | 7 | 1 | 1 | 4 |
| Abbreviation | Variable | Abbreviation | Variable |
|---|---|---|---|
| addinc1 | Additional income | notion18 | Spread of organic farming notion |
| fambkg2 | Farming family background | mach19 | Access to farming tools and machines |
| humres3 | Quantity of human resources | devleis20 | Possibility of developing leisurely agricultural farming experiences |
| inher4 | Inheritance of rice farming | neighwill21 | Willingness of neighbor farmers |
| famsupp5 | Support from family | colabo22 | Collaboration network of organic farming |
| childmem6 | Childhood memories of paddies | socappv23 | Social approval of organic farming |
| enviss7 | Concerning environmental issues | prodamt24 | Amount produced by organic farming |
| distbtw8 | Distance between farmlands and home | costorg25 | Material cost of organic farming |
| irrgsrc9 | Stable irrigation source | saleway26 | Ways of sales for organic farming |
| ownshp10 | Ownership of farmland | brandrep27 | Reputation of local brand |
| converent11 | Convenience of rented farmland | ctrcolabo28 | Chance of contractual collaboration |
| cost12 | Cost of conventional farmland transforming to organic one | synratio29 | Synergistic ratio of organic purchase |
| threeyr13 | Legal limit of ‘three-year transformation period’ | orgqual30 | Quality of organic rice |
| rateorg14 | Rate of organic farmland in the neighborhood | ownbrand31 | Possibility of establishing self-own brand |
| waterpoll15 | Degree of water being polluted | prices32 | Prices of self-produced rice |
| techcouns16 | Assistance of professional technical counseling | consumwill33 | Willingness of purchase from consumers |
| labwork17 | Workload of labor | safety34 | Consumers’ health and food safety |
© 2019 by the authors. Licensee MDPI, Basel, Switzerland. This article is an open access article distributed under the terms and conditions of the Creative Commons Attribution (CC BY) license (http://creativecommons.org/licenses/by/4.0/).
Share and Cite
Petway, J.R.; Lin, Y.-P.; Wunderlich, R.F. Analyzing Opinions on Sustainable Agriculture: Toward Increasing Farmer Knowledge of Organic Practices in Taiwan-Yuanli Township. Sustainability 2019, 11, 3843. https://doi.org/10.3390/su11143843
Petway JR, Lin Y-P, Wunderlich RF. Analyzing Opinions on Sustainable Agriculture: Toward Increasing Farmer Knowledge of Organic Practices in Taiwan-Yuanli Township. Sustainability. 2019; 11(14):3843. https://doi.org/10.3390/su11143843
Chicago/Turabian StylePetway, Joy R., Yu-Pin Lin, and Rainer F. Wunderlich. 2019. "Analyzing Opinions on Sustainable Agriculture: Toward Increasing Farmer Knowledge of Organic Practices in Taiwan-Yuanli Township" Sustainability 11, no. 14: 3843. https://doi.org/10.3390/su11143843
APA StylePetway, J. R., Lin, Y.-P., & Wunderlich, R. F. (2019). Analyzing Opinions on Sustainable Agriculture: Toward Increasing Farmer Knowledge of Organic Practices in Taiwan-Yuanli Township. Sustainability, 11(14), 3843. https://doi.org/10.3390/su11143843