1. Introduction
Nowadays most of population lives in cities of medium or large size. Therefore, mobility needs are growing constantly, but the resources are limited. In such a situation the resource usage must be optimized. This also concerns taxi management systems, which are an important part of the sustainable transportation system of the modern city. For many years emphasis has been put on mass public transportation, but its disadvantages like inflexibility, long total travel time, overcrowding and insufficient service coverage, means that the taxi sector still plays an important role. Taxis provide promptness, door-to-door service, privacy, comfort, high coverage of the city space and all day availability day time, and nowadays are an inevitable part of the communication system of any big city. This is due to the above-mentioned advantages, despite the higher cost of traveling [
1,
2,
3].
The popularity of using taxis means that there is a problem of their availability. At today’s fast pace of life, a taxi passenger shows impatience when he/she has to spend a few or a dozen minutes waiting for a vacant taxi [
4]. Therefore, taxi corporations are incessantly working on improving the scheme of vehicle distribution so that taxis can travel the shortest possible route by transporting as many passengers as possible. Increasing the size of the rolling stock of taxis seems to be the simplest way to improve the level of service. Yet it could easily result in the intensification of road traffic, thus contributing to the formation of traffic congestion. The gain of taxi corporations and of individual taxi drivers is also important. The distance traveled by an unoccupied taxi cannot be too long to assure a satisfactory level of income. This means the period between leaving one passenger and taking another cannot be too long. Therefore, the issue of determining a suitable number of taxis in disposal seems to be crucial for any taxi corporation. It should be a trade-off between the passengers waiting time for an available taxi and the achieved income. The best way to get the customers’ opinions on the service quality of urban taxis is to conduct a questionnaire survey [
5,
6].
One of the first attempts to describe the performance of a taxi system was theoretically carried out by Yang and Wong in 1998 [
7]. They obtained some formulas expressing the equilibrium conditions for a uniformly structured road network. Among them the minimum fleet size for efficient service level was determined.
Some extensions to this model were introduced by Wong et al. [
8]. They added, among others, the variable customer demand and the congestion effects. Both models were formulated by a series of linear and non-linear equations, which were iteratively solved by a quasi-Newtonian algorithm. Further development of this approach was the equilibrium model, in which a taxi driver expects as low own costs or unoccupied rides as possible, meanwhile a customer wants low fares and short service times. Finally, this bilateral searching causes both expectations to meet at a stable state [
9]. In a similar manner, Bai and Wang obtained some measures of taxi system performance for supply–demand equilibrium state [
10]. Baicheng and Szeto proposed a nonlinear model, which would help taxi drivers determine the optimal area for finding clients [
11]. Salanova et al. made a review of different approaches to theoretical modeling of taxi systems and discussed some aspects of taxi system performance, including demand for trips, service supply, vacant distance, costs and access or waiting time [
12].
Many researches were focused on the issues of the optimization of taxi systems by introducing shared taxi travels. To enhance the efficiency of taxi transportation and diminish the probability of congestion formation at rush hour, the optimization of taxi routes for a shared taxi travel was proposed [
13]. Such taxis can take more unrelated passengers instead of just one. These analyses considered the expectations of taxi drivers and passengers. The objective function included the operation costs of a taxi corporation and the satisfaction level of its passengers. The calculations involved also the traveled distance, the passenger waiting time and the elongation of the journey due to shared travel. The advantages and the capabilities of shared travels were proved in other studies as well [
14]. It was also clearly shown that shared taxi travels increased the number of serviced passengers [
15]. A mathematical model of travel sharing which enabled a capability of dynamic determination of an optimal route was proposed.
Another area being willingly investigated is the issue of individual decisions made by taxi drivers. They significantly influence the operation of the whole taxi transportation system. Subjective decisions which are based on incomplete knowledge could lead to globally inefficient assignment of vacant taxis [
16]. The use of a device called Key Performance Indicator connected to a taximeter was proposed [
17]. It would allow for collection of real data on taxi routes, what could be a base for a theoretical model validation or just for real-time optimization of taxi movement in a city area. It would allow for diagnosis of taxi system efficiency and would be a tool for assessing taxi drivers’ decisions as well.
Wong et al. proposed a cell-based model, which would help the vacant taxi drivers pick up customers [
18]. The model was calibrated with GPS (Global Positioning System) data from 460 taxis in Hong Kong. This research proved that at the cells level the probability of finding a customer was not uniformly distributed—there were a few cells with high probability of picking up a customer, but many were very low. Nonetheless in a large-scale, cells of both types were almost evenly mixed. Similar work was done by Ranjit et al. for Bangkok and surrounding provinces [
19]. The issue of decisions of vacant taxi drivers was also analyzed by Wong et al. with the use of the logit approach. The model considered the data from interviews with taxi drivers [
20].
Some researchers dealing with planning taxi movement are focused on the issues of pairing a taxi driver and a passenger, and on the optimal location of pick-up spots based on GPS data. Matching the passengers and waiting for them is also the subject of studies, where a time-dependent model of taxi drivers’ behavior was proposed. The model included picking the passengers, driving with or without a passenger and parking [
21]. The distance between leaving a passenger and picking up another one, in other words, the rate of undertaking the next job, was also examined [
22]. Empirical considerations of the way drivers look for their next passenger can also be found in the literature [
23].
Taxi systems were also modeled using the evolutionary game theory [
24]. The researchers used the data from GPS devices to validate their model, which aimed to optimize the behaviors of passengers and taxi drivers. A reliable model enhancing the decisions of passengers and drivers by balancing supply and demand reduced the time to find passengers by between 2% and 46%.
The widespread availability of GPS data allowed Castro to build a model for traffic intensity prediction. The model can be applied to make forecasts regarding upcoming traffic conditions and congestion risk. It also estimates the influence of pollution emission by cars on air quality in cities [
25]. Analyses of GPS data were used for studies on taxi availability [
26] and on the efficiency of a single taxi trip [
27] as well.
As was mentioned above, the issue of air pollution due to taxi operations has also become an important research problem. Such analyses paid special attention to empty taxi travels. Empty mileages are not only a waste of fuel, but also a waste of the taxi drivers’ time, useless pollutant generation and additional traffic in a city [
28]. The researchers used Markov’s decision processes for optimization of taxi drivers’ income by better planning their routes to avoid empty travels. A similar approach was proposed by Yu et al. [
29]. The issue of carbon emissions due to taxi operation was also examined using GPS data [
30].
The problem of optimization of the management system of taxi operations is considered [
31,
32], particularly the suitable arrangement of taxi pick-up spots. A conception of recommended taxi pick-up spots was presented [
33]. Hitherto arrangement of such spots is not related to current traffic conditions and possible congestions. The dynamic identification of taxi pick-up spots dependent on different factors determining the flow of road traffic was proposed. The procedure consisted of three stages. First, the acceptable waiting time for passengers was determined; then the actual arrangement of pick-up spots was considered. Finally, using fuzzy logic the suitable pick-up spot was selected for each driver taking current traffic conditions into account.
From the passenger’s point of view, basic parameters are waiting time and price of trip, which are decisive factors for satisfaction with services. This problem is often raised by scientists. The time of arrival of a taxi is considered based on the assumption that they are dial-a-ride. The simulations consider the possibility of traffic jams, but the theoretical considerations are not verified on the example of a specific city [
34,
35]. An algorithm was proposed to create a schedule assigning empty taxis to waiting passengers. The algorithm has a flexible objective function that balances costs with customer preferences [
36].
Many researchers paid attention to methods which allow for determination of the size of the rolling stock of taxis. The reasonable amount of taxis in service is important because the transportation demands have to be met but excessive traffic should be avoided, and the business stability of taxi companies must be ensured [
37]. This work started by adopting the number of taxis in disposal, which led to satisfying the level of service. It was done based on the probability that an occupied taxi (with a passenger) could be found at a given road section. Then, a queue system theory was applied for rush hours and for zones where it was difficult to catch an empty taxi. It allowed for building a model of transportation capability, which was used to estimate the number of taxis required in different periods of the day. This model was based on real data gathered in Xi‘an city in China. The issue of the minimal number of taxis required to serve all requests without significant delays was also studied [
38]. These researchers proposed the use of a dedicated website for request registering, then the vacant taxis would be assigned to the pending requests. Additionally, the model allowed for shared travels at rush hours. The queue system theory was also used to determine the optimal number of taxis in a given area. The basic criterion was the minimum cost [
39]. Other studies were dedicated to finding the balance between the size of the rolling stock of taxis and the taxi company income [
40]. A bi-level model was proposed: the lower level concerned the demand, and the company income was optimized at the higher level. The number of taxis in disposal was determined by accounting for the demand and the service price. The results showed that although the number of taxis in disposal is most important from the point of view of a company, attraction of the potential demand depends mainly on passenger waiting time and prices.
Apart from the above-mentioned typical works aiming to optimize the taxi system performance, some new areas have emerged. Recently, due to the increasing popularity of electric vehicles, new issues have arisen, which are connected with the specific features of electric taxicabs and the necessary infrastructure [
41]. The next recent trend is shared mobility, which includes taxi systems, among others. This issue was widely discussed, and the different shared mobility modes were compared by Santos [
42]. Some authors paid attention to possibilities which come from the widespread availability of smartphones and being online. This factor linked with immediate geo-location significantly improves the process of taxi hailing [
43,
44].
It is noted that most of the above-mentioned models are theoretical: they consist of a series of a priori established equations describing the behavior of the whole model or its components. The equations are solved using different methods and the obtained results contain the desired data on the selected system features. On the contrary, the simulation models constitute a clear minority. This approach involves a large set of simple components of different kinds. The behavior of a single component is determined by a small set of very simple rules. Then the model is started, and the interactions of its components mimic the behavior of a real system; its complexity is an emerging feature. The selected data are “measured” in a way similar to a real measurement. An example of the simulation approach is the work of Maciejewski and Bischoff, who examined taxi operations in Berlin [
45]. Since the model mimics accurately the road network of a big city, the computational time was long and only dozens of simulation runs could be repeated.
The presented approach belongs to the simulation family. It contains entities of just two types: clients’ requests and taxicabs. The rules which govern their behavior are simple. Despite this simplicity, the intention of this work is to reveal the basic rules which govern the behavior of any taxi system. Therefore, attention to some important details was sacrificed in order to achieve a higher generality level. A common feature of both approaches is the belief that a taxi system is an inevitable part of a sustainable transportation system of modern cities and it is worth working on improving the service level and reducing the environmental impact. The presented approach suggests that some improvements could be done based on fundamental properties of taxi systems and not only by refining the particular details.
The paper presents some basic considerations on the efficiency of taxi system management. The research was based on a simplified simulation model, which was examined for the different request generation rates and different number of taxis in disposal. It was shown that such a model could be regarded as a queue system, and notions and relations of the queue theory could be applied to improve taxi system performance. Additionally, a method optimizing the assignment of vacant taxis to pending requests was presented and the resulting benefits were discussed. Since the presented approach is rather general, the conclusions cannot be directly applied to a real taxi system, but they indicate the issues which should be further analyzed.
The structure of this paper is as follows: first, the simulation model details are described; then the method of assignment optimization is introduced. The next section contains the direct results of the simulation experiments. Then in the discussion section some theoretical aspects of the considered issues are presented. Finally, in the last section a short summary and conclusions are provided.
2. Model Description
The model corresponds to a city of medium size with a dense network of streets and crossroads. None of the locations is distinguished: a taxi client can appear at any of them and he/she can demand the travel to any destination. The model is significantly simplified but retains the main features of a real taxi transportation system and despite its simplicity allows for testing its behavior in different conditions. The model contains a regular grid of streets, which cross each other perpendicularly and divide the analyzed area into squares. The distance between neighboring crossroads is constant; let us denote is as Δ
s. There are
M vertical streets and
N horizontal streets in the model, thus the total extent of the area is (
M − 1)Δ
s*(
N − 1)Δ
s. It is shown in
Figure 1. Such an approach to modeling of street networks is quite often applied [
35].
The next simplification is an assumption that all vehicles move with the same speed (
v) and time consumed for getting in and getting out are negligible. Hence, any event in the simulation happens at discrete time moments according to successive clock ticks:
Although the assumption of constant speed is a bit unrealistic, it is often applied while modeling taxi movement in the road network. Such an approach allows for avoiding the background traffic simulation [
9,
45].
Since all events can be assigned just to crossroads, the spatial distance between a pair of events is calculated as the Manhattan distance (
xA,
xB,
yA,
yB denote respectively the coordinates of
A and
B events):
The number of taxis is an assumed parameter. If a taxi is occupied, it moves directly towards its destination with constant speed. The presence of any other vehicles is not considered. When a passenger gets off the taxi becomes vacant. A vacant taxi roams in the streets network, choosing randomly its way at successive time moments at a crossroad. It can freely turn right or left or go forward, unless it is on the area boundary. This is schematically presented in
Figure 2.
The next simplification is that clients’ requests for transport appear independently in the system. In real taxi systems an accumulation of requests may happen due to mass events or just due to rush hours. Additionally, it is obvious that transport demands a change in time. By omitting the case of mass events, at a given time the adopted simplification is justified, therefore it can be regarded that clients’ requests form Markov’s input stream. The rate of requests generation (Rrg) is a predefined parameter. Each request contains the coordinates of a crossroad, where a client waits and the coordinates of his destination crossroad. The coordinates of origin and destination crossroads are drawn randomly. The only constraint is that they must not be the same; thus, the model allows also for short journeys, just between neighboring crossroads.
A newly generated request is not handled immediately. During a given short period all pending requests are processed. Such requests form a queue with the FIFO (first in first out) order. For the first request in the queue the nearest vacant taxi is sought; if a vacant taxi is found it is assigned to this request; then the request is removed from the queue. The procedure is repeated until the queue is empty or there is no vacant taxi.
An alternative method for the assignment of vacant taxis to the awaiting requests is considered in the work as well. In this approach, for all pending requests and all vacant taxis, a matrix which contains distances between them is created. Then pairs of a pending request and a vacant taxi are matched in such a way to minimize the total arrival time (distance).
When a vacant taxi is assigned to the request the service time of the request starts to be counted. Such dispatched taxis have to reach the client waiting and then deliver him/her to his/her destination. At this moment the service is completed, and the taxi becomes vacant again.
3. Optimization of Taxis Assignment
The above-mentioned alternative method of vacant taxis assignment to the pending requests is a typical optimization problem with binary decision variables. The task is completely determined by the cost matrix. The time consumed or the distance to travel could also be regarded as a cost. Let us denote this matrix as
, its elements
cij describe the time (distance) needed for an
i-th vacant taxi to arrive to a
j-th pending request. Such a set of
xij binary variables forming the solution matrix
is sought to minimize the total arrival time. Assuming the number of vacant taxis equal to
N and the number of requests equal to
M, the optimization problem can be expressed as follows:
Condition (4) states that all vacant taxis have to be assigned; if their number is less than the number of requests either all pending requests must be serviced in different cases. Conditions (5) and (6) express the requirements that a single request can be served by at most one taxi and a single taxi can be assigned to at most one request, respectively. If the number of requests is greater than the number of taxis some of the requests will remain unhandled (all
xij in a given
j-th column will be equal to zero); in the opposite situation some of the taxis will remain unassigned (all
xij in a given
i-th row will be equal to zero). If both numbers are equal (
M =
N), each row and each column of
matrix will contain exactly one nonzero element
xij. Despite the formal simplicity of the formulation, such problems are difficult to solve [
46]. Some researchers proposed the use of the Hungarian algorithm [
47] for this purpose [
48].
Since the original formulation of the Hungarian algorithm requires the equality of the numbers of requests and servers, and since this condition would not often be met, the simulated annealing method (SA) is proposed in the work [
49]. The SA method mimics the process of cooling of melted matter—the transition from a hot liquid to a high ordered state (crystal). The particles of the matter try to reach the state with the minimum energy. First, at a high temperature they can freely jump and occupy any place. Later, as the temperature lowers, the particles have not enough energy to move as easily and they willingly lie down at selected locations. The SA is one of the methods that explores the solution space. By a small change a candidate solution is created basing on the current one. Let us denote
f0 and
fby the values of the objective function for current and candidate solutions, respectively. In every iteration, if
f is greater than
f0 the candidate solution replaces the current one. The exchange is also possible in the opposite case, but just with the likelihood given by the expression:
The variable denoted as
T is an analogue to temperature. It is high at the beginning of the optimization process; the initial value should be of order of the objective function. It would allow for intensive exploring of the solution space. Then, in successive iterations it is continuously decreasing according to the formula:
It means that at the finish of the optimization process the large, unpredictable changes would be forbidden. The coefficient
q can be determined by an empirical formula depending on the presumed number of iterations:
SA is an efficient optimization method for such problem classes, where the “effective diameter” of the solutions space is low. It means that only a few steps are required to cross the whole domain along one of its dimensions. Since each sought variable can take only two values, the considered issue seems to be one of them.
4. Results
The model described above was implemented for the grid 100 × 100 of mesh size equal to 100 m, which corresponds to a quadratic area of 100 km2. The taxis’ speed was adopted as 30 km/h, in accordance with average road traffic speed in a congested downtown area. The frequency of managing pending requests was set to every 1 min. The simulation covered 40 h, which exceeds the life time of a single request, thus the analyzed conditions could be regarded as stable. Different request generation rates were examined (120, 240 and 600 requests per hour). For each request generation rate the dependence of the system behavior on the number of taxis in service was analyzed.
The examined system can be regarded as a queue system with multiple servers. A server here is a single taxi. Since the requests are generated independently of each other the probability of a request arrival is constant in time. Such a determined stream of requests undergoes the Poisson distribution and as a consequence the time interval between two successive requests is a random variable with the exponential distribution (λ denotes the mean length of time intervals):
Figure 3a,b show the distributions of time intervals between requests for two generation rates (360 and 600 requests per hour) compared with theoretical exponential distributions.
As can be seen the real distributions of generated requests agree almost perfectly with the theoretical ones. The slight differences are caused by grouping the requests in 3-s intervals.
The determination of the nature of the service time distribution is a more complex task. A service time of a single request consists of two components: the time needed for arrival to the awaiting client and the time needed for delivering him/her to his/her destination. The first component depends on two locations—the location of the awaiting client and the location of the selected taxi—and the second component depends on the same client location and his/her destination point. Since all three locations are determined by two coordinates it gives six variables, which are randomly drawn. The spatial distribution of the uniform (e.g., coordinates of each location) can be drawn with the same probability.
In an ideal case where there is only one request and one free taxi six variables are mutually independent and independent on any other factors. Considering the assumption on the constant vehicles’ speed, the above statement concerns the service time as well. Therefore, the service time is a random variable which is a sum of six independent random variables. Every one of the components is a random variable of the exponential distribution. The distribution of such random variables is described by Erlang’s formula:
where:
ts—service time,
k—degree of the distribution (the number of component random variables),
μ—mean value of service time.
Figure 4 shows the comparison of the distribution of simulated service times for 300,000 pairs of random requests and positions of free taxis and the theoretical Erlang’s distribution for
k = 6. The mean of the total service time was 1622 s.
As soon as the nature of the requests stream and the service process were recognized, simulations for a full system were carried out. A few measures describing the system behavior for different numbers of taxis in service were defined:
the average number of vacant taxis, such a taxi could be assigned to a pending request—Nfree;
the average pending time, which was the period between a request appearing in the system and the moment a vacant taxi was assigned—PT [s]; all awaiting requests at the moment when simulation stopped were also considered;
the average service time, which is the time of waiting for taxi arrival and the time of delivery to the client’s destination—ST [s];
the total distance traveled per hour by all taxis—TD [km];
the total distance traveled per hour by the taxis being vacant—TDfree [km];
the average queue length or the number of pending requests appearing in the system and the assignment of a vacant taxi—QL.
Figure 5 shows the dependence of the average number of vacant taxis and the average pending and service times on the total number of taxis in service for different request rates and for two different modes of handling the pending requests (FIFO and SA optimization). As can be seen the general system behavior is similar for all cases. It is possible to point out a critical number of taxis in service:
if the number of taxis in service is lower than this value, the average pending time starts to grow rapidly and there is almost no vacant taxi available;
if the number of taxis in service is greater than this value, the average pending time is low and seems to be almost independent on the total number of taxis in service (further decrease of the average waiting time is negligible); meanwhile the number of vacant taxis is growing when the total number of taxis in service is increasing.
Different requests rates lead to different values of the critical number of taxis in service. Despite the described similarity there is one fundamental difference between results obtained for both modes of handling the pending requests. It concerns the system behavior in the vicinity of the critical number of taxis in service: for FIFO the transition is sharp and strong fluctuations of both examined measures (Nfree and WT) are observed; for SA optimization there is rather a smooth transition region without significant fluctuations. Furthermore, the critical number of taxis in service is clearly lower for SA optimization.
As can be observed, the implementation of a method which optimizes the assignment of vacant taxis to pending clients clearly changes the behavior of the system. Although the general courses of the lines presenting the dependence of the average number of vacant taxis and the average waiting time on the total number taxis in service remain almost the same, the critical number of taxis in service is lower and the transition region is more stable. The latter feature means that the system with an optimization procedure is robust to fluctuations of the request rate.
Figure 6 presents the relation between requests rate and the critical number of taxis in service estimated on the base of
Figure 5. As the critical number such as the number of taxis in service was adopted, the number of vacant taxis started to grow. Both dependencies form almost linear trends (values of R
2 close to unity). Considering the direction coefficients of both trend lines one could state that the need for taxis in service is about 14% higher in a system without optimization.
The presented results have important practical consequences, which should be considered by persons who deal with taxi management:
the demand for taxis in service depends on the requests rate;
there is a critical number of taxis in service which depends on the request rate; the relation is almost linear; this number depends also on a streets topology and traffic conditions on the considered area;
if the number of taxis in disposal is too low, the whole system will be inefficient, and clients will wait too long for available taxi assignment and arrival;
if the number of taxis in disposal is close to the critical value or slightly higher, the average waiting time becomes low and the surplus of vacant (available) taxis is not significant;
if the number of taxis in disposal is much higher than the critical number the clients’ satisfaction measured by the average waiting time is not growing significantly, but surplus of vacant taxis becomes a prodigality;
since it is difficult to predict the exact value of the requests rate even in a short time the size of the stock of taxis in service should be tuned based on historical data and current conditions and a slight excess should be adopted;
the application of an optimization method for the assignment of vacant taxis to pending requests allows for a decrease of the critical number of required taxis in service and partly mitigates the effects of insufficient numbers of taxis in service.
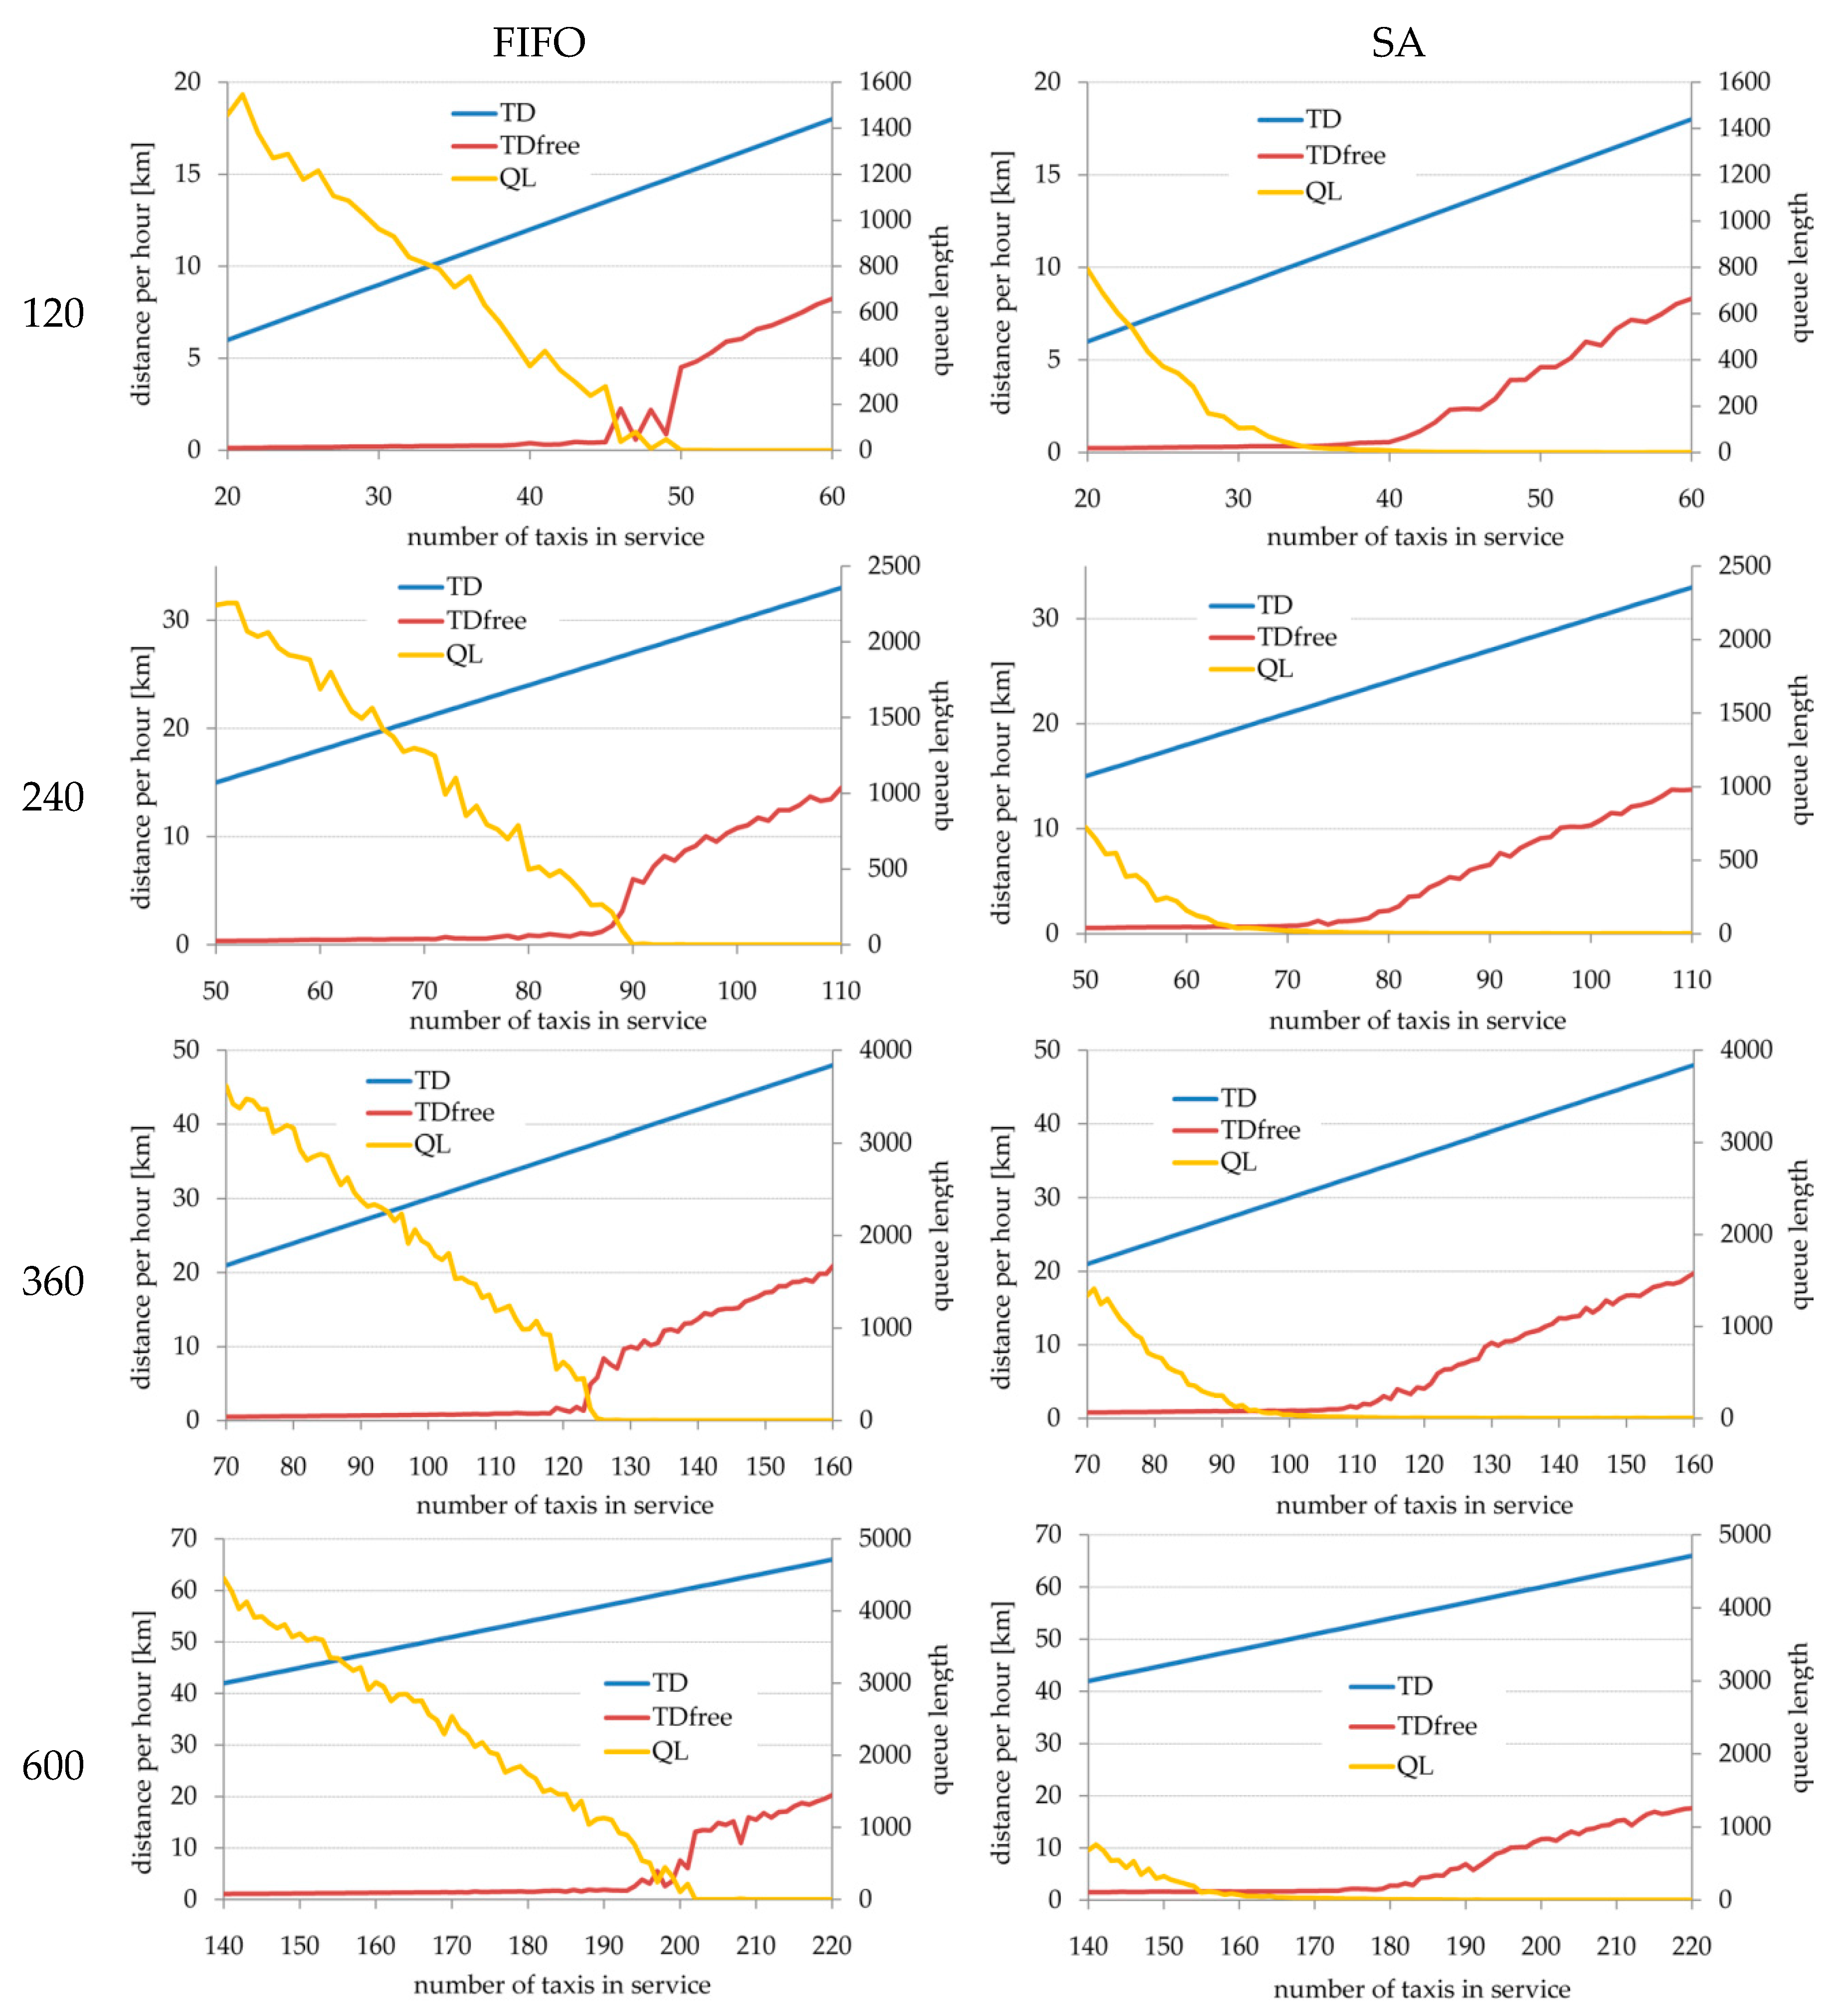
Figure 7 presents the total distance traveled by taxis, the total distance traveled by available (vacant) taxis and the average queue length. The total distance is simply proportional to the number of taxis in service, what is an obvious consequence of model assumptions—each taxi is continuously in move with a constant velocity. This is valid regardless of whether a taxi is vacant or travels to a client or delivers him/her to his/her destination. This variable (
TD) can be regarded as a measure of total cost of all taxi operations. The second measure presented (
TDfree) is a measure of the surplus of taxis in disposal. As was mentioned above, it is necessary to provide a stable service level in the face of uncertain demands and fluctuations. But too high a number of vacant taxis leads to the prodigality.
The difference of
TDfree behavior between simply FIFO and SA optimization handling of pending requests is visible mainly in the transition region—the vicinity of the critical number of taxis in service. When the optimization procedure is applied the distance traveled by vacant taxis starts to grow a bit earlier for the lower number of taxis in service. Then it grows in a smoother manner, which confirms that the transition region is less prone to fluctuations and uncertain forecasts of transportation demands. The same concerns the average queue length (
QL): apart from more stable behavior in the transition region the number of pending requests is significantly lower. The findings visible in
Figure 7 can be compared with real data reported by Amat et al. [
17]: the mileage occupancy rate for taxis in Barcelona varies between 45% and 60% which proves that the number of taxis is much more than the critical number (according to
Figure 7, the mileage occupancy rate is 100% for critical number of taxis).
As was shown earlier the input stream is of Markov’s type and the service time can be described by Erlang’s distribution. Since the taxis correspond to servers, the number of taxis in service is the number of servers. The above considerations lead to the conclusion that using the Kendall notation the model can be described as M/Ek/t (Ek denotes the Erlang’s distribution of k degree, t denotes the number of taxis in service) and then the well-known queue theory can be used to determine the model behavior. In such queue systems the queue length grows in an unlimited way tending toward infinity when servers do not keep up with the request generation rate. The finite number of requests pending in a queue in presented simulations results from the confined calculation time.
The problem arose because the service time varies in dependency on the number of taxis in service. More accurately, its component, the time of arrival, depends on the distance between the location of a request and nearby vacant taxis, which in turn depends on the total number of taxis in service. In such a situation the distributions of service time were examined under different circumstances. As discussed above, the optimal state of the taxi operation system was when the number of taxis in disposal was close to the critical number or a bit greater just such that conditions were mainly checked. A series of simulations was carried out and selected results were shown in
Figure 8. It presents distributions of simulated service time compared with relevant Erlang’s distributions for request generation rates equal to 600 req./h. Three states of the system related to the number of taxis in disposal were selected: A: just above critical number (200 for FIFO assignment and 186 for SA optimization), B: 5 above the critical number, C: 10 above the critical number.
The most important observation is that the distributions of service time remained of Erlang’s type, but the degree of the distributions did not correspond to the ideal case (shown in
Figure 4). Tests carried out for other request generation rates confirmed this finding.
Table 1 contains the parameters of Erlang’s distributions fitted to the obtained simulated distributions of service time for a generation rate equal 600 [req./h].
It is worth noting that if the number of taxis in service exceeds the critical number the system with simply FIFO assignment performs a bit better and the average service time decreases faster. Additionally, the optimization of assignment of vacant taxis could cause some drivers to be lousy. It could happen because the total travel time or distance is minimized which would force a particular driver to not take a job that is not very profitable [
50]. The next limitation concerns the fact that any optimization system can be applied for taxi systems with mainly centralized management. If a majority of vacant taxis are hailed directly by a client at the street this would not operate properly.
Obviously, the component of service time corresponding to the delivery of a client to his/her destination does not depend on the total number of taxis. The variable component is the client waiting time, which is the time between the moment a request appears in the system and the moment a dispatched taxi arrives to a client.
5. Discussion
In real systems, which are not so regularly structured, one cannot assume the distribution of service time to be so unambiguously determined. Despite this, the historical data would specify system behavior. It can be done using Kingman’s law of congestion, which accurately approximates the average waiting time for queue
G/
G/
t system by this value for
M/
M/
t system [
51,
52]:
CVr and CVs denote coefficients of variation (a ratio of the standard deviation to the mean) for inter-arrival time of requests and service time, respectively. For exponential distribution the mean is always equal to the standard deviation, thus , for Erlang’s distribution .
When considering any queue system, one should consider the fundamental quantity called utilization or traffic rate (
q). It is the ratio of request generation rate and service rate (
μs), which is the reciprocal of average service time. For system with
t servers it could be written as follows:
This parameter determines unambiguously the system behavior: if it is lower than unity, the system is stable, and the queue of pending requests does not grow in an unlimited way.
Figure 9a,b show the system performance (
t/
μs) for different values of requests generation rate (the value of
Rrg converted to one second is marked by a short horizontal dashed line).
A point corresponding to utility equal to unity is determined by the intersection of a trend line and a line denoting request generation rate. As it can be noted, this point almost corresponds to the critical number (marked by a vertical dashed line). This applies accurately to a system with SA optimization; for a simple FIFO system some discrepancies are visible. The observed mismatching is probably caused by significant fluctuations for such a system and discrepancies of determination of trend lines. Based on historical data one should be able to determine the average service time in dependence on the number of taxis in disposal and its variation. Thus, knowing or predicting in the short term the requests generation rate it is possible to estimate the critical number of taxis in disposal, which appears the same as establishing the utilization as unity. For a given urban area a chart like this one shown in
Figure 6 would be helpful. Then the number of taxis in disposal should be increased to achieve a service level, which is satisfactory to the clients.
One can try to resolve this problem with the queue theory. The average number of requests pending in
M/
M/
t queue systems is given by an auxiliary variable
K as follows:
Since for large numbers of serves these calculations lead to numerical problems (due to the term
), a recursive procedure shown by Adan and Resing [
53] was applied. The average waiting time in a queue is related with the queue length; this is expressed by Little’s law [
54,
55]:
Thus, having the values of
Rrg and
μs one can calculate the average queue length and the average waiting time for the number of servers equal to
t. These values, which are valid for a
M/
M/
t queue system can be then recalculated for a real taxi system using Equation (14) (Kingman’s law of congestion) with known values of standard deviations. In such a way the number of taxis in disposal can be adjusted to hold the waiting time acceptable by taxi clients. An example of this calculation for
Rrg = 600 req./h is shown in
Table 2. The input data came from simulations. Therefore, in this case the knowledge of the mean value of service time is sufficient to calculate other properties of this queue system. Due to the distribution of Erlang’s type the standard deviation is given by the expression:
Table 2 exposes the main weakness of this simple theoretical approach; since the calculations were done for the values of utilization close to the unity the system was extremely sensitive to the fluctuations or uncertainty of the requests generation rate. As it can be seen, if the number of taxis is a bit higher than the critical number the pending requests will be managed almost immediately. Therefore, a vacant taxi is assigned to every pending request at once and a client waits just the period equal to the time needed to drive by a dispatched taxi to the pick-up point. Hence, the higher the density of vacant taxis, the shorter distance to travel for an assigned taxi. Therefore, one could expect that the average waiting time would decrease with the growing number of taxis in disposal. The dependence of total arrival time for different rates of requests generation in system with SA optimization is shown in
Figure 10.
Since for each requests generation rate only the numbers of taxis in disposal greater than the critical number were considered, one can assume the time needed for assignment of a vacant taxi to a pending request quickly becomes negligible (according to the discussion in
Table 2). So, as it can be seen, besides the area just above the critical number, the total waiting time does not depend on the number of taxis in disposal. For all examined cases it converges to the same value—about 200 s. This value depends only on model assumptions, such streets’ topology, adopted vehicles speed and the frequency of managing of pending requests.
At the last stage of research the system behavior for varying demands was tested. The case for SA optimization and the initial rate of requests generation equal to 600 req./h was considered. The number of taxis in disposal was set again slightly above the critical number (186). After 3 h of simulated time, which assured the stable system state, the request generation rate jumped up by a given fraction. Four values of jump height were checked: 0.05, 0.1, 0.2 and 0.3. Since the whole simulation corresponded to 8 h, two variants were considered: increased value of request generation rate was kept to the very end or it returned to the initial value after 2 h. The results are shown in
Figure 11 and
Figure 12, respectively.
As it can be noted the system was really stable until the requests generation rate jumped up. Just small fluctuations are observed in this period. Then, after the jump the system behaved differently: for low values of the jump (0.05 and 0.1) the obvious increase of the queue length could not be observed, but fluctuations became very significant. Such behavior testifies that the system was just at the stability limit. For higher values of the tested jump (0.2 and 0.3), the queue started to rise clearly. This growth was unlimited in the first examined variant, and obviously the growth rate depended on the height of the jump of the requests generation rate. Meanwhile, the system returned to the initial stable state for the second examined variant. It took it above an hour. Since the time dependence of queue length was (in both variants) strongly fluctuating it was difficult to unambiguously determine if the return time significantly depended on the height of the requests generation rate jump. That the observed maximum of the queue length depended on the jump height is obvious.
The obtained results show that the system is able to operate when the number of taxis in disposal is smaller than the critical number as well, but only for short periods. The queue obviously starts to grow, but if the state of instability is short, the queue will not be too long.


