Agglomeration Economies in Small Cities and Business: The Impact of the Great Recession in Aragón (Spain)


1
Departmento de Análisis Económico, Universidad de Zaragoza Facultad de Economía y Empresa (Campus Paraíso). c/ Gran Vía 2, 50005 Zaragoza, Spain
2
Institut d'Economia de Barcelona (IEB), Facultat d’Economia i Empresa, Universitat de Barcelona, c/ John M. Keynes, 1-11, 08034 Barcelona, Spain
*
Author to whom correspondence should be addressed.
Sustainability 2019, 11(14), 3770; https://doi.org/10.3390/su11143770
Submission received: 20 May 2019
/
Revised: 5 July 2019
/
Accepted: 7 July 2019
/
Published: 10 July 2019
(This article belongs to the Special Issue Regions and Economic Resilience)
Abstract
:In this paper, we analyze the effects of productive specialization and productive diversity on employment growth at the local level during the Great Recession in Aragon, a NUTS II region in Spain. This region is characterized by (i) a high population density in the capital city (around half of the total population), giving rise to a very uneven population distribution and therefore a lot of small cities and municipalities, and (ii) a large proportion of small businesses (95% of the firms in this region have fewer than ten employees). We use annual data from 2000 to 2015 and panel data models, and grouped local business activities into three main categories: industry, construction and services. Our results show that, during this period, local specialization in any of these activities hurt local employment growth, whereas diversity had a non-significant effect on employment growth. Only in the case of services did we obtain a positive effect of diversity on local employment growth, which was restricted to the most populated cities (i.e., cities with more than 3000 inhabitants). Therefore, only diversity in services activities located in large cities contributed to employment growth during the Great Recession.
1. Introduction
The last few years of Spanish economic history have been convulsive, with a series of events (an economic crisis, a financial crisis, and a sovereign debt crisis) that generated high unemployment rates and negative economic growth (Banco de España [1]). Most experts do not hesitate to describe this period as one of the most severe economic crises in history, known as the ‘Great Recession’. Although the current recovery phase is characterized by intense job creation and economic growth, during the worst years of the crisis (2012–2013), unemployment rates were above 25%, leaving Spain with the second-highest unemployment rate in Europe (after Greece), which was triple that of the pre-crisis period, 8.3% in 2006 (source: Spanish National Institute of Statistics, Instituto Nacional de Estadística).
The impact of the crisis was uneven among regions and sectors; some regions had higher or lower unemployment rates than the country’s average, and the manufacturing and construction sectors were hit particularly hard. In this paper, we focus on job growth in Aragón, one of the NUTS 2 regions of Spain, called Autonomous Communities (NUTS regions are the European Union’s standard classification of European regions at different geographical levels of aggregation (1, 2, and 3); the acronym NUTS comes from the French term Nomenclature des unités territoriales statistiques). In particular, we study the effects of productive specialization and productive diversity on employment growth at the local level.
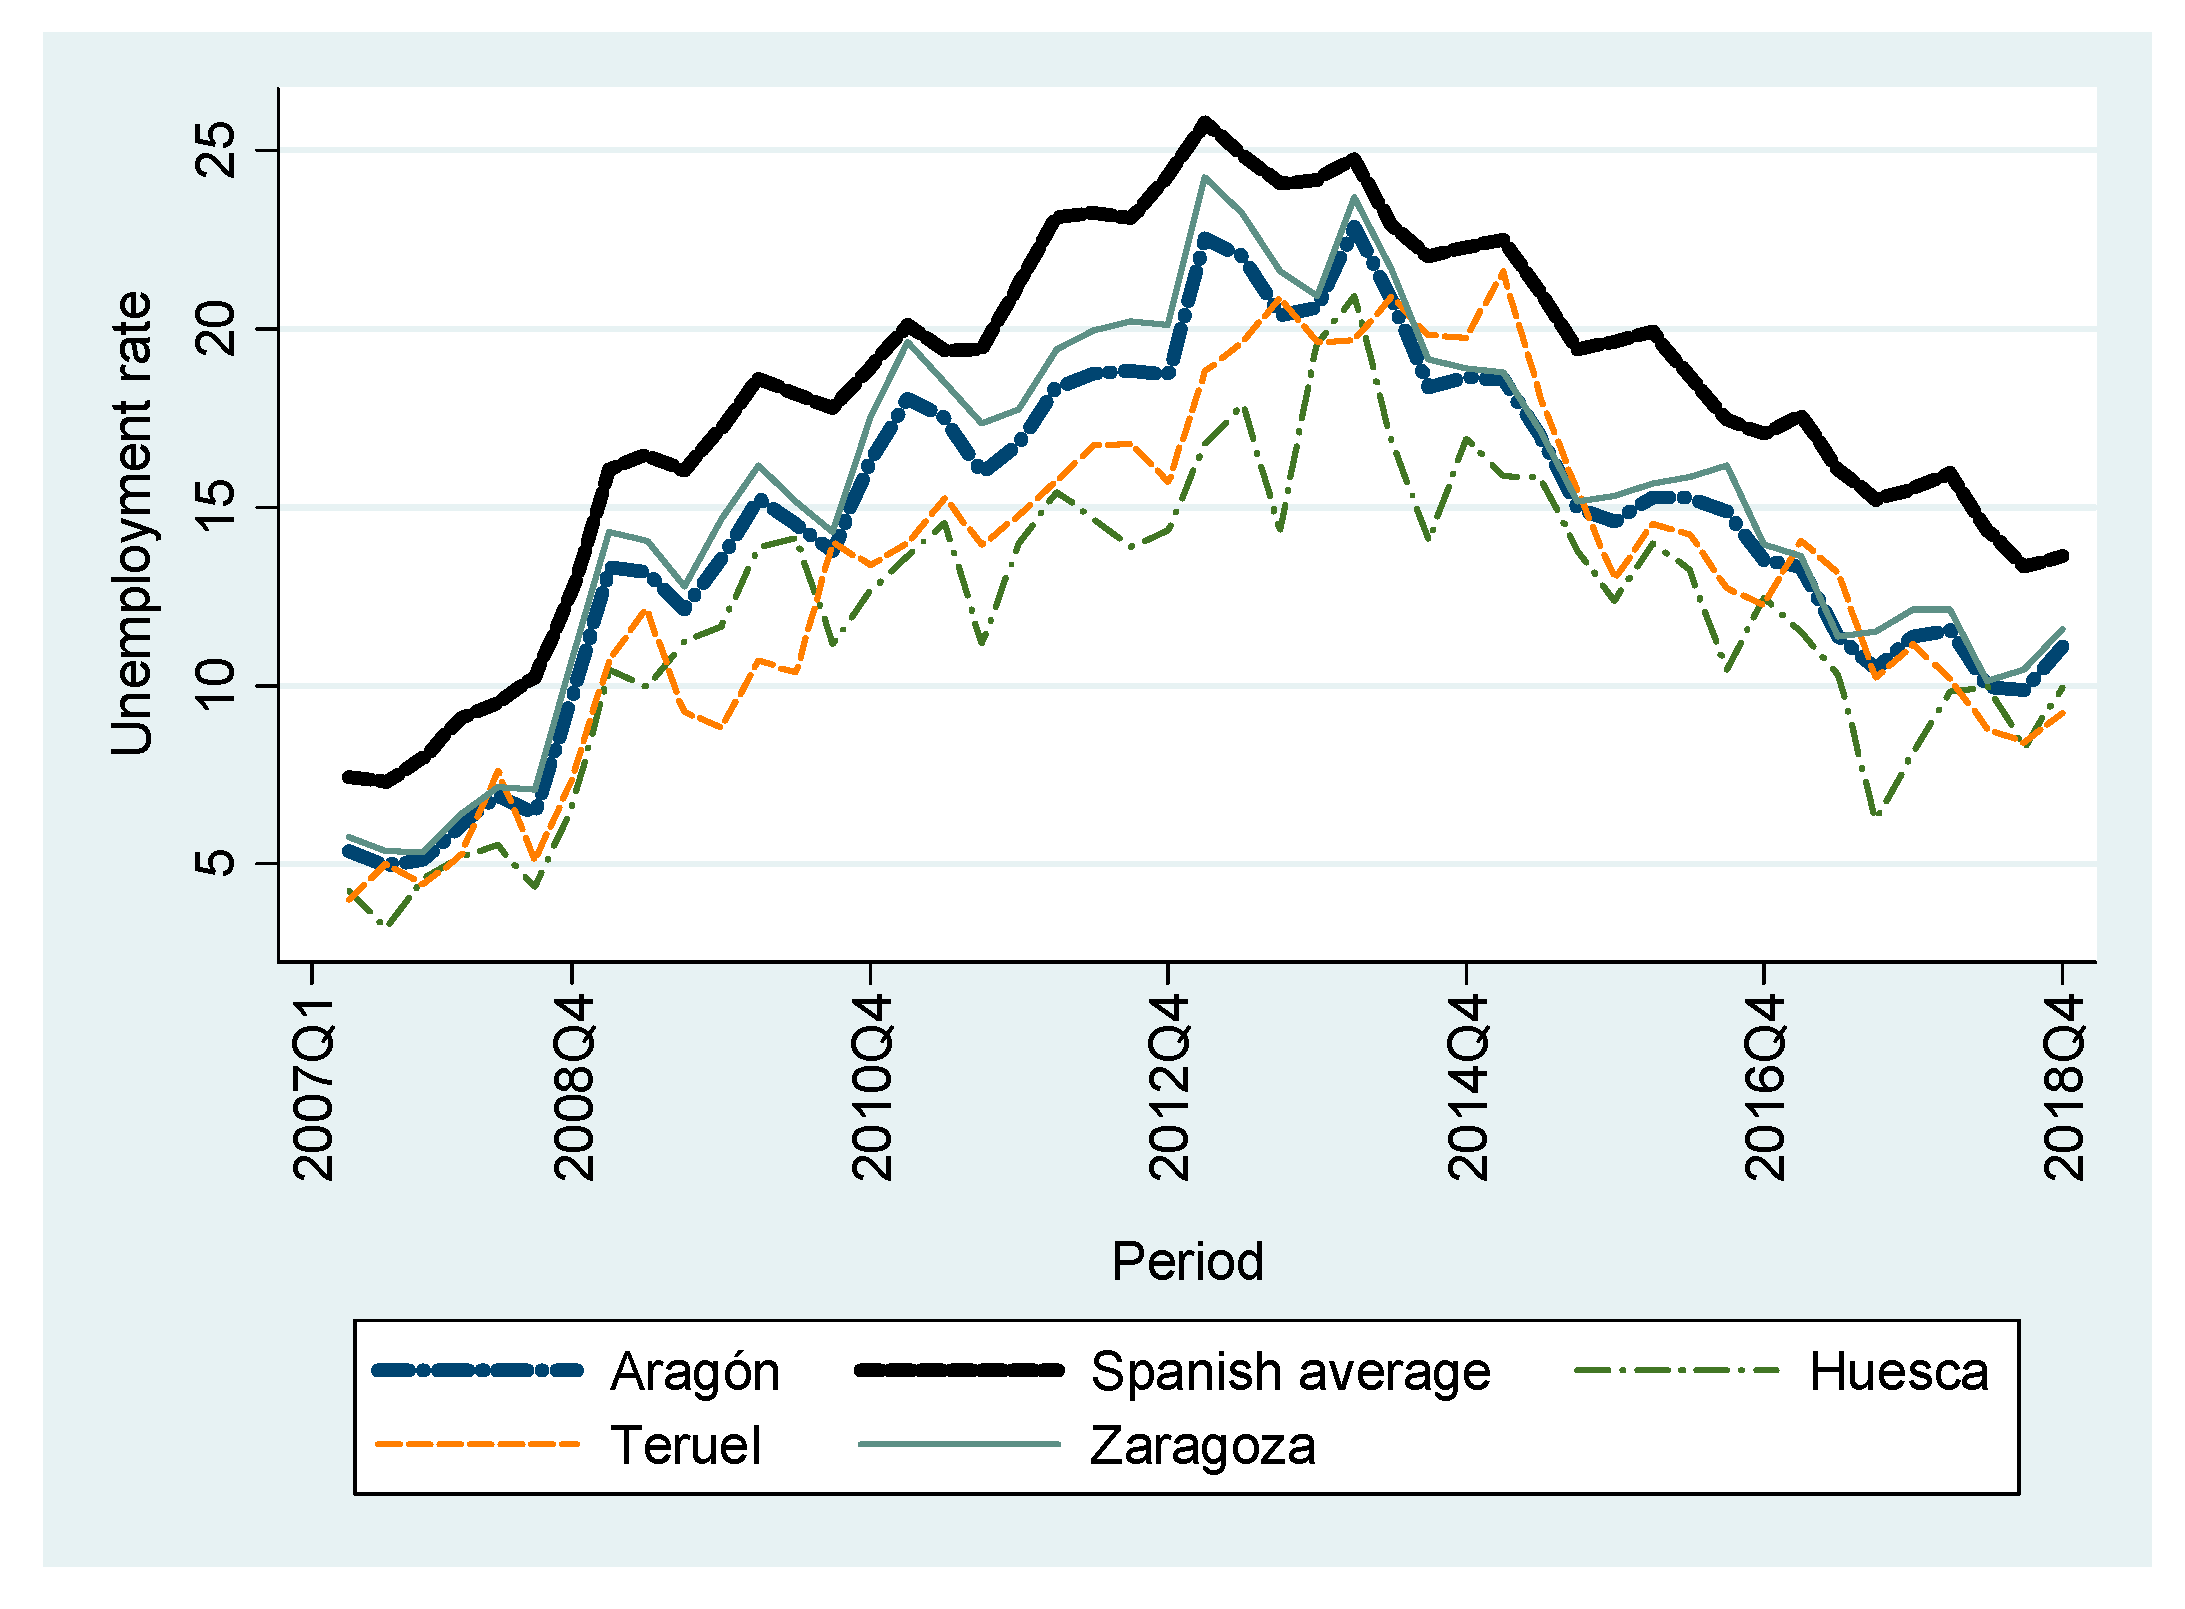
Aragón has an area of 47,720 km2 and a population of almost 1.4 million. At 28 inhabitants per km2, it is one of the most sparsely populated regions in the country; therefore, most of its cities (also called municipalities) are small. Figure 1 shows its geographical location within Spain. The map shows the territorial boundaries of the country’s various NUTS 3 regions (also known as provinces) of the country. Aragón is located in northeast Spain, and is composed of three provinces: Huesca in the north, Zaragoza in the center, and Teruel in the south. As the map indicates, the region enjoys a privileged location that is halfway between the country’s two main centers of activity: Madrid, Spain’s capital, and Catalonia, with which it shares its eastern border. To the north, Aragón is bordered by France, Spain’s most important trading partner. From an economic perspective, Aragón has a higher per capita income than the country’s average and a below-average unemployment rate. Figure 2 shows the evolution of the unemployment rate in Aragón and Spain during the last crisis; the temporal evolutions of both rates are similar, although the level of unemployment was always lower in Aragón. Within Aragón, unemployment rates in Huesca tend to be lower than the region’s average in most periods, whereas Zaragoza’s rates are similar to the average. Finally, unemployment levels are more volatile in Teruel than in the other two provinces.
There are two special characteristics of Aragón that justify our interest. First, despite the region’s vast territory, its economic activity and population are highly concentrated. The three provincial capitals (especially Zaragoza) account for more than half the population of the entire region (57% in 2017). This enormous inequality means that most cities are small. Although the key determinants of growth among cities have been studied extensively, little attention has been paid to the effects of urban agglomeration in small places (Partridge et al. [2]).
Additionally, economic activity in Aragón is also quite unequally distributed; the Zaragoza province contributes on average 85% of the gross value added (GVA) and 80% of the jobs, whereas Huesca contributes 10% of the GVA and 13.5% of the employment and Teruel contributes 5% of the GVA and 6.5% of the workers. Therefore, the distribution of firms is also very fragmented, with many firms located in Zaragoza city.
Secondly, one of the peculiarities of the Aragonese (and Spanish) economy is the importance of small- and medium-sized enterprises (SMEs). Nevertheless, despite the importance of SMEs in many developed countries, microbusinesses have been systematically overlooked in the urban economics literature (Houston and Reuschke [3]). Micro enterprises account for 95.4% of the Aragonese business sector: 54.5% have no salaried workers and 40.9% have fewer than ten workers. The proportion of small companies (those with between 10 and 49 workers) is 3.9%, of medium companies (between 50 and 249 workers) is 0.6%, and of large companies (with more than 250 workers) is a mere 0.1%, according to the last Report on the Economic and Social Situation of Aragón [4].
Considering this geographic-economic pairing of small cities and small businesses, both small dimensions that are often neglected in the literature, we question whether the theoretical advantages of business concentration (called agglomeration economies) contributed to local growth in Aragón during the Great Recession. To study this, we analyzed the effects of the agglomeration economies on job growth at the local level. Supposedly firms and workers benefit from spatial concentration; therefore, we expect that both productive specialization and diversity positively affect local employment growth, but the special features of the Aragonese case (small cities and SMEs) could generate different results.
2. Literature Review
There are two basic types of agglomeration economies: localization economies that relate to concentration within a specific sector (i.e., productive specialization) and urbanization economies that operate through the general concentration of economic activity (i.e., productive diversity, with a lot of firms from different industries). Localization economies include those external factors that come from the economic sector in which the activity is conducted: reductions in transport costs, economies of scale, specialized labor markets, or the creation of an industrial atmosphere capable of generating innovation in these fields and its rapid diffusion (knowledge spillovers). These are the so-called Marshall-Arrow-Romer external effects. Urbanization economies incorporate those external effects that do not emanate from within the company or the sector to which the company belongs, but from the location: economies of diversity, qualities of cities or regions (for example, infrastructure), or access to an efficient and skilled labor market. These spillovers between different industries at the city level were firstly documented by Jacobs [5] and later by Glaeser et al. [6] and Henderson et al. [7] for cities in the United States (US).
The theoretical underpinnings of agglomeration economies date back to what Marshall called industrial districts (Marshall [8]). Marshall observed several advantages to industrial concentration, such as (i) the availability of skilled labor, (ii) the availability of intermediate goods, and (iii) the ease of exchanging knowledge of products, processes, and innovations. More recent theoretical models have further developed the concept of agglomeration economies to adapt it to the current situation, such as the theoretical model of Duranton and Puga [9] with micro-foundations, where the authors identified three mechanisms for the transmission of the effects of company density: sharing, matching, and learning.
Theoretically and empirically, the focus tends to be on manufacturing, because it is of the greatest interest due to its traditional relationship with economic growth and its capacity to pull up the rest of the economy. However, we will also consider services, which tend to be more spatially concentrated (by their very nature, they have a high potential for codependence and agglomeration and seek to be close to their sources of demand), and construction. The construction sector in Aragón was a key player in the process of economic expansion until 2007, even more so than in the rest of Spain, but it was also the worst-affected sector during the crisis, along with industry, according to the Socio-economic Report for the Decade 2001–2010 in Aragón [10].
The two pioneering papers that initiated the study of agglomeration economies in the 1990s, Glaeser et al. [6] and Henderson et al. [7], focused on the impact of local determinants on employment growth in the US at the industry and city levels from a dynamic perspective. Although over time, many studies have attempted to identify the role of agglomeration effects on wages, productivity, or firm location decisions, a considerable portion of the literature has focused only on the effects of local sectoral specialization and diversity on local employment. Combes and Gobillon [11] reviewed the empirical literature on agglomeration, highlighting the diversity of results obtained when the studied outcome variable studied was local employment growth. Combes [12] established, for France, that the size of the local market has a positive effect on the growth of industrial employment for manufacturing industries, but a negative effect on services. For Spain, Viladecans-Marsal [13] found that the effect of market size’s on industrial employment was not significant in three of the six sectors analyzed. For Germany, Blien et al. [14] found that the local market size had a positive effect on industrial employment growth for both the manufacturing and service industries. Mameli et al. [15] concluded that total employment has a positive impact on industrial employment growth after pooling together manufacturing and services using Italian data (the literature on agglomeration economies is wide; see the meta-analysis by Melo et al. [16] and the survey by Combes and Gobillon [11]).
3. Data
To conduct this study, we use the geographical data of all Aragonese firms, considering their main activities according to the National Classification of Economic Activities CNAE-2009 (the Spanish version of the EU Statistical Classification of Economic Activities, NACE Rev. 2). The sample of firms is provided by the Iberian Balance Sheet Analysis System (Sistema de Análisis de Balances Ibéricos, SABI) database, which contains comprehensive general information and annual accounts for companies (i.e., corporations) in Spain and Portugal. The SABI data source also provides detailed geographical information on the locations of firms. We aggregated the employment data for Aragonese companies by their municipal location, for almost 600 Aragonese municipalities. Aragón has 731 municipalities: 202 are located in Huesca, 236 in Teruel, and 293 in Zaragoza; our sample size is slightly smaller because there are some municipalities (154) that do not have employment information from any company and are, therefore, excluded from the sample.
It is worth noting that the literature on the industrial spatial distribution usually focuses on the location of establishments (i.e., working centers), whereas our sample includes the locations of headquarters, which is something different. Moreover, in some cases, it is possible that the location of the headquarters is merely instrumental, and that the center of activity is located in another place (or even in another region within Spain), for instance, because of tax incentives. However, we are confident that, given that taxation in Aragón is not particularly business-friendly compared to that of the neighboring regions, and the vast majority of companies in Aragón are SMEs (95.4% are micro enterprises), both concepts (headquarters and production establishments) will coincide in most cases.
Table 1 shows the number of companies by Activity, the most aggregated section of the CNAE-2009 classification, which includes large general groups of activities. The sections are arranged in alphabetical order. Section G (wholesale and retail trade; repair of motor vehicles and motorcycles) is the most important activity in terms of the number of firms engaged in it (22% of the total and 19.89% of the total number of workers, respectively), followed by construction (Section F) and manufacturing (Section C), which is the activity that occupies the majority of the workers (32.64%). Almost half of the total number of companies in Aragón (48.90%) in 2017 and around 60% of the total number of workers were engaged in these three activities. After these, there are other activities in the services sector with a significant number of firms (but a much lower share of employees): professional, scientific, and technical activities; real estate activities; and hospitality (Sections M, L, and I, respectively). Finally, the importance of the primary sector must be highlighted: more than 1000 firms and 4.8% of workers throughout Aragón are engaged in Section A (agriculture, hunting, fishing and forestry). The remaining activities are quantitatively less important as they present much lower numbers of firms and workers.
Sectoral employment data correspond only to salaried workers; therefore, self-employed workers are excluded from this study due to the lack of available statistical data by municipality and sector. Official data regarding workers by activity sector at the aggregate municipality level are not available from the social security records. They are available at the NUTS 3 region level and for other sub-regional levels, such as the comarcas, but even in these cases, there is a break in the historical series in 2010, when there was a change in the official classification of activities from the former classification (CNAE-1993) to the current one (CNAE-2009). Therefore, if we used the social security records, our research period should start (or end) in 2010. What is available at the municipality level is aggregate total employment data, which we use in the preliminary analysis carried out in Section 5.
The sustained surge in self-employment since 2000 in many countries has largely gone unnoticed by policy makers and economic developers (Goetz and Rupasingha [17]), though many recent studies document the importance of the self-employed on regional economic growth (Glaeser et al. [18]; Stephens and Partridge [19]; Stephens et al. [20]). Regarding the relationship between self-employment and agglomeration economies, Cai [21] found, using US data, that urbanization decreases and localization increases the hours that the self-employed work. Furthermore, an important characteristic of small businesses as regional economic engines is job creation; Henderson and Weiler [22] showed that the impact of entrepreneurship on job growth is greater in areas that are more urbanized.
Therefore, given the quantitative importance of the self-employed, who represent around 20% of the total number of workers registered with social security in the Aragonese economy, it is possible that we have underestimated the effects of the different agglomeration economies on employment. In Section 5, we carry out some estimations using the total number of workers and the number of self-employed people by city, confirming that, at least when using the aggregate number of workers, agglomeration economies seem to have a stronger effect on self-employment growth than on total employment growth. Hence, our results, based on sectoral data from salaried workers, should be considered as the lower bound of the possible effects of agglomeration economies on employment.
The period considered in this study is from the year 2000 to 2015. This period (16 years) allows us to make a long-term estimate of the effect of agglomeration economies and also covers an entire economic cycle, including boom periods, such as the first half of the 2000s, and the Great Recession that began in 2008 and extended until almost the end of 2015.
4. Methodology
In this study, we follow the work of Combes [12] on agglomeration economies in France by using data from firms and employment in Aragón. More recently, this empirical strategy and the selection of variables are fully explained and discussed in the excellent survey of Combes and Gobillon [11]. Therefore, the empirical strategy and selection of variables in our study is similar to that of Combes [12], with one important difference: we use panel data rather than cross-sectional data because we have annual observations.
The first empirical question is: how can agglomeration economies be quantified at the local level? Our aim is to examine whether the external effects of sectoral concentration are important for employment growth at the local level. The most obvious way to establish such effects is to observe the growth of the sectors in different municipalities and analyze the sectors with the fastest growth. Therefore, the observation unit is every sector in each municipality; we define the variable to be explained as the relative growth of employment:
where is the employment in sector i in municipality c at time t and is the total employment in that sector in Aragón at time t. As Combes [12] explained, choosing this variable means that we are not trying to explain why the growth of a sector in a given municipality is x%, but why it is y% higher or lower in this place than the growth level of that sector in all of Aragón.
Once the variable is defined, we establish the indices to measure localization economies (productive specialization) and urbanization economies (productive diversity) at the sectoral and municipal levels. The measure of specialization () related to localization economies is as follows:
where is the total municipal employment and is the total employment in Aragón, all measured during year t. This is the ratio between the proportion (or percentage) of employment in the sector i in municipality c and the proportion of employment in that same sector in the Aragonese economy. Thus, if a municipality is more specialized in a particular sector than the Aragonese economy is, the index will take a value greater than one. Conversely, if the share of employment in that sector in the municipality in question is less than the total share of that sector in the Aragonese economy, the index will have a value of less than one.
The productive diversity () of urbanization economies is usually measured (Combes [12]; Henderson et al. [7]) through the inverse Herfindahl index, which is constructed from the share of the different sectors within local employment, except for the sector to be considered. This variable is normalized by the same index constructed for the total of Aragón:
where i is the number of productive sectors. The numerator is at its maximum value when all the sectors except the one under consideration (which we call i*) are of the same size in the municipality. This index reflects the sectoral diversity of sector i in municipality c and, therefore, is not necessarily related to the level of specialization of the analyzed sector. Keep in mind that with this definition, we obtain a different measure of diversity for each sector in each municipality.
In addition to the two indices that measure specialization and productive diversity at the municipal level representing localization and urbanization economies, respectively, the literature suggests introducing additional variables. Since large companies are more capable of internalizing some of the local effects than are small companies, Glaeser et al. [6] suggested incorporating the average size of firms within the local industry as an additional determinant of localization economies. Normalizing by the average size of the companies in the same sector in Aragón, we consider the following:
where is the number of companies in industry i in municipality c at time t and is the total number of companies in the sector i in Aragón in the same year t. Since Equation (4) is a ratio between the average size of the companies in the sector in municipality c and the average size of the companies in the same sector in Aragón, a value higher than one will indicate that the companies in that sector in municipality c are larger in size (more employees) than the average for the sector in Aragón, whereas if the ratio is less than one, it signifies that the companies in that sector in municipality c are smaller than the average in Aragón for the sector. As indicated earlier, most Aragonese companies are SMEs; therefore, this ratio is specifically intended to control the effect of company size in the case of large companies because the extreme employment values (compared to the majority of the sample, who are SMEs) could bias the analysis.
Finally, Combes [12] suggested that in order to simultaneously control the differences between cities, it is relevant to consider the density of total employment in these cities with the following indicator:
where is the geographical area of the municipality measured in km2.
Table 2 shows the descriptive statistics of the dependent variable (relative employment growth) and the different indices by sector. The statistics are calculated by considering all the sectoral values available for all the municipalities. If we look at employment growth, the sector with the highest growth (on average) in this period is construction, whereas manufacturing includes the most extreme values (the highest maximum and the lowest minimum growth). Manufacturing is the more specialized sector at the local level, whereas the highest diversity is found in the service activities. Finally, construction is the sector with the highest mean number of firms at the local level, although their average size is the lowest; in contrast, manufacturing has the lowest mean number of firms by municipality, but their average size is the largest.
Once these variables and indicators of business diversity and concentration are defined, we can estimate the econometric model where the variable to be explained is employment growth in sector i in municipality c in year t (Equation (1)) and the explanatory variables have been defined in Equations (2) to (5). The basic econometric model would be as follows:
where denotes the sectoral fixed effects (FEs), are time FEs (yearly time dummies from 2000 to 2015), indicates provincial FEs (at the NUTS 3 level), and is the error term.
However, Model (6) presents several potential econometric problems, and the most important of these is a possible selection bias. In this context, selection bias pertains to economic activities that are only present in some cities. Therefore, for each municipality, it is common to have several productive sectors without any companies, which implies that the number of employees will be zero in those cases.
There are two ways of dealing with these null observations. Some authors include only those cases in the regressions where the variables take values other than zero, but this could lead to biased parameter estimates. Therefore, as Combes [12] did, we adopt an alternative procedure that consists of a two-stage Heckman selection model [23,24], which estimates a Tobit type II model. Therefore, we distinguish between two steps in the estimation.
In the first stage, a Probit model is estimated with a dummy variable that takes the value of 1 if sectoral employment is observed in the municipality, else zero, as a function of the variables available for all cities. As in the second stage our dependent variable is the relative growth rate, which can take positive or negative values, hurdle models (Poisson or other) are discarded. The probability of a municipality having a particular productive sector is estimated using the following equation:
where S indicates the sector (, if , else ), Z is a vector of municipal explanatory variables, is the cumulative distribution function with a normal distribution, and is a vector of unknown parameters to be estimated. In our case, the explanatory variables are a constant, population density and the percentage of the population of Aragón that represents the population of the municipality (both variables in logarithms), and a series of fixed sectoral and provincial effects (provincial FEs are included because, due to multicollinearity in this case, it is not possible to include FEs at the municipal level). This estimate allows the construction of a new variable, called the inverse Mills ratio (IMR), which captures the magnitude of the bias and is incorporated into Model (6) as an additional explanatory variable to correct the aforementioned selection problem. Moreover, considering the annual time dimension of our data, this Probit model is estimated for each of the 15 years of the panel data, following the instructions of Semykina and Wooldridge [25], to correct selection bias in panel data.
In the second stage of the Tobit type II model, the following econometric model is estimated by ordinary least squares (OLS):
The difference between Models (6) and (8) is that the IMR is included in Equation (8) to correct for selection bias. Furthermore, as recommended by Semykina and Wooldridge [25], given our panel data, the IMR interacts with the annual time fixed effects ().
The second potential problem that this empirical strategy could present is that the OLS estimates are consistent but inefficient. Therefore, as Combes [12] recommends, in the second stage, Model (8) will be estimated by maximum likelihood (ML), which is efficient.
Finally, given that the different indicators are constructed from the same sectoral employment values in each municipality, there could be multicollinearity in our model. To control this, we calculate the variance inflation factor (VIF) that quantifies the intensity of multicollinearity from the OLS estimates of Model (8). The results reveal that there is no multicollinearity as the VIF always remains within the limits suggested in the literature (the VIF results are not shown in the Tables, but they are available from the authors upon request, along with the OLS estimates, which provide very similar results).
5. Results
As a preliminary analysis, let us consider the agglomeration effects on total employment growth by municipality. Total employment data come from the social security records, including both salaried workers and the self-employed. As mentioned above, unfortunately, these data are not available disaggregated by activity at this geographical level, but they can be useful for analyzing general trends at the municipality level. The sample period is slightly shorter and begins in 2003. Moreover, the indices that capture the possible agglomeration effects must be simplified because, at this point, we are not yet considering observations by sector. Thus, specialization is measured through the standard Krugman specialization index; to measure diversity, we use the inverse Herfindahl index constructed from the share of all the different sectors within local employment. The average size represents the mean firm size of all the firms in the municipality relative to the mean firm size in Aragón, and the density of total employment by city is calculated as in Equation (5). Therefore, at the aggregate municipal level , , and in municipality c at time t. As no index takes the value zero in any case, the logarithm is taken for all the variables.
Table 3 reports the results for total employment growth. To be consistent with the sectoral estimations, city-fixed effects are not included; furthermore, Combes and Gobillon [11] argue against including local FEs. Columns (1) to (3) include total employment and all municipalities. When the whole period is considered (column 1), positive and significant coefficients are obtained for both specialization and diversity, although the effect of localization (specialization) is much greater (five times) than that of urbanization (diversity). Regarding the rest of the variables, the coefficient for the average firm size is negative and significant, whereas the effect of employment density is not significant. Actually, the coefficients of these last two variables (average size and employment density) are not significant in most of the estimated models.
If we split the period before and after the beginning of the crisis in 2008, different results can be observed. The positive effect of specialization on total employment growth is more than two times higher in the period before the crisis, 2003–2007 (column 2), than in the crisis and subsequent recovery period, 2008–2015 (column 3). Furthermore, diversity changes from significant and positive in the period before 2008 (column 2) to not significant in the aftermath of the crisis (column 3). However, if we focus on larger cities with more than 3000 inhabitants (46 municipalities), where agglomeration economies should be stronger, the results change and we only obtain significant evidence of agglomeration effects on total employment growth (columns 4 to 6) in the period before the crisis (column 5), with a positive and significant effect of diversity. This indicates that, for the large cities and when considering total employment, the effect of diversity was more important than that of specialization (the specialization coefficient is only significant at the 10% level).
Finally, we consider relative growth in self-employment (columns 7 to 9), again focusing on the largest cities. As mentioned above, our sectoral employment data only include salaried workers and omit the self-employed. Thus, these aggregate estimates can give us some intuition regarding the importance of agglomeration economies on self-employment. What we find is that positive and significant coefficients are obtained for both specialization and diversity in all periods, though the effect of specialization is much greater than that of the diversity. Another shift is observed again in the magnitude of the coefficients before and after the beginning of the crisis in 2008, indicating a weakening in the strength of agglomeration economies in the aftermath of the recession. The important finding; however, is that the coefficients of the specialization and diversity variables in the self-employment regressions (columns 7 to 9) are clearly higher than those obtained using total employment (columns 1 to 6), meaning that agglomeration economies have stronger effects on self-employment growth than on total workers’ growth. Therefore, because our forthcoming analysis that considers sectoral local data includes only salaried workers, these results should be interpreted with caution, i.e., they should be considered as the lower bound of the possible effects of agglomeration economies on employment.
Next, we move to the estimation of agglomeration effects on local employment considering sectoral data. We estimate Model (8) separately for the manufacturing, construction, and services sectors (Table 4, Table 5 and Table 6, respectively), using the CNAE-2009 classification of activities for the whole period from 2000 to 2015. When using sectoral local data, changes in the coefficients across periods are not dramatic, so only results for the whole period 2000–2015 are reported in Table 4, Table 5 and Table 6. The subperiod-specific results are available from the authors upon request. All the tables have a common structure, with 5 columns representing 5 different specifications of Model (8). In columns (1) to (3), the sample of all the available municipalities is used but controls are introduced progressively: column (1) only includes the explanatory variables defined in equations (2) to (5); column (2) includes year FEs, where the changes that could be due to the temporal evolution of the variables (factors such as the economic cycle, the evolution of migratory patterns, etc.) are controlled and the IMR interacts with the time-based dummies, as recommended by Semykina and Wooldridge [25], sectoral FEs are included to control for unobservable factors at the sectoral level that could influence employment growth at the local level, and regional FEs are defined using the comarca spatial unit; the 33 comarcas are a sub-regional division between municipalities and the NUTS 3 regions that group nearby municipalities. In column (3), we use the NUTS 3 regions (provinces) to define the regional FEs; as the results using comarcas and provinces are very similar in all cases, in columns (4) and (5) we only report those results that were obtained using the NUTS 3 regional FEs.
The remaining two columns correspond to estimates in which all the controls are included, but subsamples of municipalities are used for robustness testing. In column (4), the estimate is made after excluding Zaragoza city from the sample of municipalities. As indicated earlier, Zaragoza city accounts for a large amount of Aragón’s economic activity (almost half of the total companies), so we check if the results obtained in the other estimates correspond only to the importance of Zaragoza. Finally, column (5) uses a subsample of 46 municipalities with more than 3000 inhabitants; we have carried out tests with other population thresholds and verified that, from this threshold of 3000 inhabitants, the results do not change if other minimum population levels are considered. By focusing on the most populated cities, we exclude the least-populated municipalities from the analysis, which are usually rural areas where the economies of agglomeration would not be sufficiently strong to generate any significant effect. Finally, note that the high sample sizes (the number of observations at the bottom of each column) correspond to the number of municipalities (almost 600) multiplied by the number of different activities (at the two-digit classification) in each case within each main activity (manufacturing, construction, and services) and by the number of years (which is 15 because one observation is lost when working with growth rates).
Table 4 shows the results for the industrial sector (branches of activity 10–33 according to the CNAE-2009 classification). This is the basic sector in our analysis, since the positive effects of agglomeration economies are traditionally linked to industrial activity. Aragón has a marked industrial character; its Gross Domestic Product and employment (23% and 19%, respectively) are higher than the average values for Spain [4]. The model in column (1) shows significant negative effects of specialization, size, and density. As we introduce controls, the density coefficient loses significance, but the other two variables do not, and they remain negative and significant in all the estimated models (columns 1 to 5). With respect to the coefficient of the variable that measures productive diversity, it is not significant in any case.
Therefore, we obtain a negative effect of specialization (localization economies) for industrial employment at the municipal level and no significant effect of productive diversity (urbanization economies). These results are robust, even when subsamples are considered (when excluding Zaragoza or considering only municipalities with more than 3000 inhabitants). Although there is no theoretical model that predicts a negative effect of localization economies on employment, other studies also obtained coefficients with the same sign. For instance, Combes [12] obtained the same result in his analysis of French urban areas, and Blien et al. [14] and Mameli et al. [15] also found negative effects in Germany and Italy, respectively.
Although we do not find an explanation for this coefficient in the theory of agglomeration economies, Combes [12] suggested looking for an answer in the evolution of the cycle of the considered sector at the aggregate level. His explanation is that highly specialized production implies little flexibility and worse adaptability of products, technologies, and infrastructures when the sector is in decline. We believe this explanation fits perfectly with the analyzed period (2000–2015), which included a significant reduction in employment in the industrial sector during the Great Recession. Thus, the Aragonese municipalities that were more specialized in manufacturing suffered greater reductions in employment than the Aragón average. Alternatively, Combes and Gobillon [11] suggest that this negative result may arise from a strong mean reversion that more than compensates for the positive agglomeration effects.
Finally, local average size has a significant negative effect in all cases. This negative sign provides evidence against economies of scale in the industrial sector, although it could also be a reflection of the evolution of the life cycle of industries or also represent the Aragonese business structure with its absolute dominance of SMEs in the industrial sector. Combes [12] and Blien et al. [14] also find that the presence of larger firms reduces employment growth in both manufacturing and service activities in France and Germany, respectively.
Next, we analyze the construction sector (branches of activity 41 to 43 according to the CNAE-2009 classification), one of the sectors that was badly affected by a reduction in employment during the recent economic crisis. Employment in construction in Aragón decreased since the beginning of the crisis in 2008 and did not increase again until 2015. Table 5 shows the estimates for the branches of activity of the construction sector. The results are similar to those of industrial activities: while the specialization coefficient is negative and significant, the coefficient of the variable that measures productive diversity is not significant in any case. Our interpretation of this result is that, once again, the negative effect on sectoral employment reflects the poor evolution of the sector during the crisis period; however, the exception is the model that uses a subsample of the most populated municipalities (column 5), where the effect of specialization is not significant either. This could indicate that in large cities, the construction sector is not capable of generating economies of agglomeration of either type (localization or urbanization). Furthermore, the variable measuring the average size of companies in the sector has, again, a significant negative effect in all cases, which we interpret as evidence that economies of scale are not present in the construction sector.
Finally, Table 6 presents the results for the services sector (branches of activity 49 to 96 according to the CNAE-2009 classification), which accounts for around 67% of the total employment and production of the Aragonese economy and the greatest rate of employment creation in recent years, especially since 2014.
We obtain two results common to those obtained for the other sectors: on the one hand, we observe a negative and significant effect of specialized production, which we can link to the destruction of jobs during the Great Recession, and on the other hand, we observe a negative and significant coefficient of the average size of the companies, which would once again reflect the predominance of SMEs in the Aragonese economy.
The different result shown in Table 6, which is specific to the services sector, is the positive and significant effect of productive diversity when we use the sample that includes the most-populated municipalities (column 5). This positive effect on sectoral employment can be considered favorable evidence of urbanization economies over sectoral employment: an increase in diversity in the different branches of the services sector would generate increases in employment in other branches of the sector in the same municipality, indicating supply and demand links between the different activities of the services sector. However, these results would indicate that for this positive effect to be generated, a certain economic scale or municipality size is necessary (at least 3000 inhabitants). Combes and Gobillon [11] point out that it is not unusual that productive diversity shows mixed effects on local employment growth; for instance, Combes [12] finds that the same diversity measure has a positive impact on employment growth in service activities and a negative one in most manufacturing industries in France, and Viladecans-Marsal [13] finds positive, negative and nonsignificant effects of diversity on employment for different Spanish industries in the same period.
6. Conclusions
In this study, we test the strength of agglomeration economies for a Spanish region characterized by its small cities and companies. Focusing on the differentiation between localization (specialization) and urbanization (diversity) economies, the effects of industrial concentration and diversity on employment growth at the municipal level are analyzed using panel data from 2000 to 2015, including the Great Recession period.
We estimate the effect of agglomeration economies on sectoral employment at the local level for the branches of activity of each of the main activity sectors, finding a negative and significant effect of specialization in the three major sectors of activity (manufacturing, construction, and services). Bearing in mind that the period of analysis includes the Great Recession that began in 2008 and entailed a considerable decrease in employment in these sectors, our results could indicate that the Aragonese municipalities that were more specialized in these sectors suffered higher unemployment rates than the Aragón average.
With respect to urbanization economies, we did not find any significant effect on any of the productive sectors, except for a positive effect on job creation in service sector activities when we restrict the analysis to municipalities with more than 3000 inhabitants. Therefore, the greater the diversity in the different branches of the services sector, the greater the growth in employment in other branches of the sector in the same municipality, provided that it is a large municipality—implying the existence of supply and demand links between different activities of the services sector. Therefore, only diversity in services activities located in large cities contributed to employment growth during the Great Recession.
However, these results should be taken with caution for three reasons. First, the sectoral analysis only considers salaried workers because self-employment data are not available. Our results using aggregate workers by municipality show that the effect of agglomeration economies is higher on self-employment growth than on total workers growth, suggesting that, if we could include the self-employed in the sectoral analysis, the coefficients of the productive specialization and diversity variables could be greater. Second, as most of the firms in Aragón are SMEs, the benefits from agglomeration may be more difficult to turn into employment growth, our dependent variable. For instance, Houston and Reuschke [3], studying microbusiness growth, concluded that cities provide benefits to microbusinesses for turnover growth, but not for employment growth. Third, employment growth is not the only indicator of economic growth. Although employment is a local outcome of interest, especially for policymakers, currently, most of the studies focus on productivity (Combes and Gobillon [11]. The relationship between these two variables can be positive or negative; for instance, increases in productivity may not directly imply employment growth if the firms are SMEs. Finally, in terms of adaptability, other variables could be more suitable than employment growth to evaluate if a sector has evolved or adapted poorly or properly, e.g., technological change (innovation, automation), relocation, or transformation.
To sum up, we obtain evidence that there are limited economies of localization and urbanization, but these are restricted only to the largest municipalities in Aragón. On the one hand, this could be because agglomeration economies require a minimum scale, which we put at 3000 inhabitants. For smaller municipalities, we did not find any significant effect during the considered period. However, our results are limited to the 2000–2015 period, which prevents us from predicting what the result would have been if the economic conditions of the period had not been so negative. If the economic environment had been one of job creation rather than destruction, agglomeration economies would have been strengthened, rather than attenuated.
On the other hand, if we have found some positive effect of agglomeration economies during an adverse economic period, it is possible that in periods of economic prosperity, the agglomeration economies could have played a key role in job creation. This is relevant for Aragón, as this region has a high concentration of economic activity and population in the capital, Zaragoza, and the agglomeration trend had lasted for several decades. The possible external effects generated by this agglomeration (positive or negative) should not be ruled out either since they would need to be quantified because if they persist, they can lead to an increasingly unbalanced distribution of economic activity.
Author Contributions
Conceptualization, R.G.-V. and M.M.; Funding acquisition, R.G.-V. and M.M.; Investigation, R.G.-V. and M.M.; Methodology, M.M.; Supervision, R.G.-V.; Writing—original draft, R.G.-V.; Writing—review & editing, R.G.-V. and M.M.
Funding
This research was funded by the Consejo Social y Económico de Aragón (Premio de Investigación Ángela López Jiménez, 2017). Additional financial support was provided by the Spanish Ministerio de Economía y Competitividad (ECO2017-82246-P and ECO2016-75941-R projects), the DGA (ADETRE and S32_17R research groups) and ERDF.
Acknowledgments
The authors acknowledge the financial support from the Consejo Social y Económico de Aragón, the Spanish Ministerio de Economía y Competitividad and the Aragonese Government (DGA).
Conflicts of Interest
The authors declare no conflict of interest.
References
- Banco de España. Informe Sobre la Crisis Financiera y Bancaria en España, 2008–2014. 2017. Available online: https://www.bde.es/f/webbde/Secciones/Publicaciones/OtrasPublicaciones/Fich/InformeCrisis_Completo_web.pdf (accessed on 26 June 2019).
- Partridge, M.D.; Rickman, D.S.; Ali, K.; Olfert, M.R. Lost in space: Population growth in the American hinterlands and small cities. J. Econ. Geogr. 2008, 8, 727–757. [Google Scholar] [CrossRef]
- Houston, D.; Reuschke, D. City economies and microbusiness growth. Urban Stud. 2017, 54, 3199–3217. [Google Scholar] [CrossRef] [PubMed]
- Consejo Económico y Social de Aragón. Informe Sobre la Situación Económica y Social de Aragón en 2017. 2018. Available online: https://www.aragon.es/OrganosConsultivosGobiernoAragon/OrganosConsultivos/ConsejoEconomicoSocialAragon/AreasTematicas/Actividades/ci.01_Informe_socieconomico_aragon.detalleConsejo (accessed on 31 March 2019).
- Jacobs, J. The Economy of Cities; Vintage: New York, NY, USA, 1969. [Google Scholar]
- Glaeser, E.L.; Kallal, H.; Scheinkman, J.; Shleifer, A. Growth in cities. J. Political Econ. 1992, 100, 1126–1152. [Google Scholar] [CrossRef]
- Henderson, J.; Kuncoro, A.; Turner, M. Industrial development in cities. J. Political Econ. 1995, 103, 1067–1090. [Google Scholar] [CrossRef]
- Marshall, A. Principles of Economic; Mc Millan: London, UK, 1890. [Google Scholar]
- Duranton, G.; Puga, D. Micro-foundations of urban agglomeration economies. In Handbook of Regional and Urban Economics; Henderson, V., Thisse, J.-F., Eds.; North-Holland: Amsterdam, The Netherlands, 2004; pp. 2063–2117. [Google Scholar]
- Consejo Económico y Social de Aragón. Informe Socioeconómico de la Década 2001–2010 en Aragón. 2012. Available online: https://www.aragon.es/estaticos/GobiernoAragon/OrganosConsultivos/ConsejoEconomicoSocialAragon/Areas/Publicaciones/INFORMES/INFORME_2011/INFORME_DECADA_2001_2010.pdf (accessed on 11 May 2019).
- Combes, P.P.; Gobillon, L. The Empirics of Agglomeration Economies. In Handbook of Regional and Urban Economics; Duranton, G., Henderson, V., Strange, W., Eds.; North-Holland: Amsterdam, The Netherlands, 2015; pp. 247–348. [Google Scholar] [Green Version]
- Combes, P.P. Economic structure and local growth: France, 1984–1993. J. Urban Econ. 2000, 47, 329–355. [Google Scholar] [CrossRef]
- Viladecans-Marsal, E. Agglomeration economies and industrial location: City-level evidence. J. Econ. Geogr. 2004, 4, 565–582. [Google Scholar] [CrossRef]
- Blien, U.; Suedekum, J.; Wolf, K. Productivity and the density of economic activity. Labour Econ. 2006, 13, 445–458. [Google Scholar] [CrossRef]
- Mameli, F.; Faggian, A.; McCann, P. Employment growth in Italian local labour systems: Issues of model specification and sectoral aggregation. Spat. Econ. Anal. 2008, 3, 343–360. [Google Scholar] [CrossRef]
- Melo, P.C.; Graham, D.J.; Noland, R.B. A Meta-analysis of Estimates of Urban Agglomeration Economies. Reg. Sci. Urban Econ. 2009, 39, 332–342. [Google Scholar] [CrossRef]
- Goetz, S.J.; Rupasingha, A. The Determinants of Self-Employment Growth: Insights from County-Level Data. Econ. Dev. Q. 2014, 28, 42–60. [Google Scholar] [CrossRef]
- Glaeser, E.L.; Rosenthal, S.S.; Strange, W.C. Urban economics and entrepreneurship. J. Urban Econ. 2010, 67, 1–14. [Google Scholar] [CrossRef] [Green Version]
- Stephens, H.M.; Partridge, M.D. Do entrepreneurs enhance economic growth in lagging regions? Growth Chang. 2011, 42, 431–465. [Google Scholar] [CrossRef]
- Stephens, H.M.; Partridge, M.D.; Faggian, A. Innovation, entrepreneurship and economic growth in lagging regions. J. Reg. Sci. 2013, 53, 778–812. [Google Scholar] [CrossRef]
- Cai, Z. Hours worked of the self-employed and agglomeration. Growth Chang. 2019, 50, 352–380. [Google Scholar] [CrossRef]
- Henderson, J.; Weiler, S. Entrepreneurs and job growth: Probing the boundaries of time and space. Econ. Dev. Q. 2010, 24, 23–32. [Google Scholar] [CrossRef]
- Heckman, J.J. The Common Structure of Statistical Models of Truncation, Sample Selection and Limited Dependent Variables and a Simple Estimator for Such Models. Ann. Econ. Soc. Meas. 1976, 5, 475–492. [Google Scholar]
- Heckman, J.J. Sample Selection Bias as a Specification Error. Econometrica 1979, 47, 153–161. [Google Scholar] [CrossRef]
- Semykina, A.; Wooldridge, J. Estimating panel data models in the presence of endogeneity and selection. J. Econ. 2010, 157, 375–380. [Google Scholar] [CrossRef] [Green Version]
Figure 1.
Geographical location of Aragón within Spain.
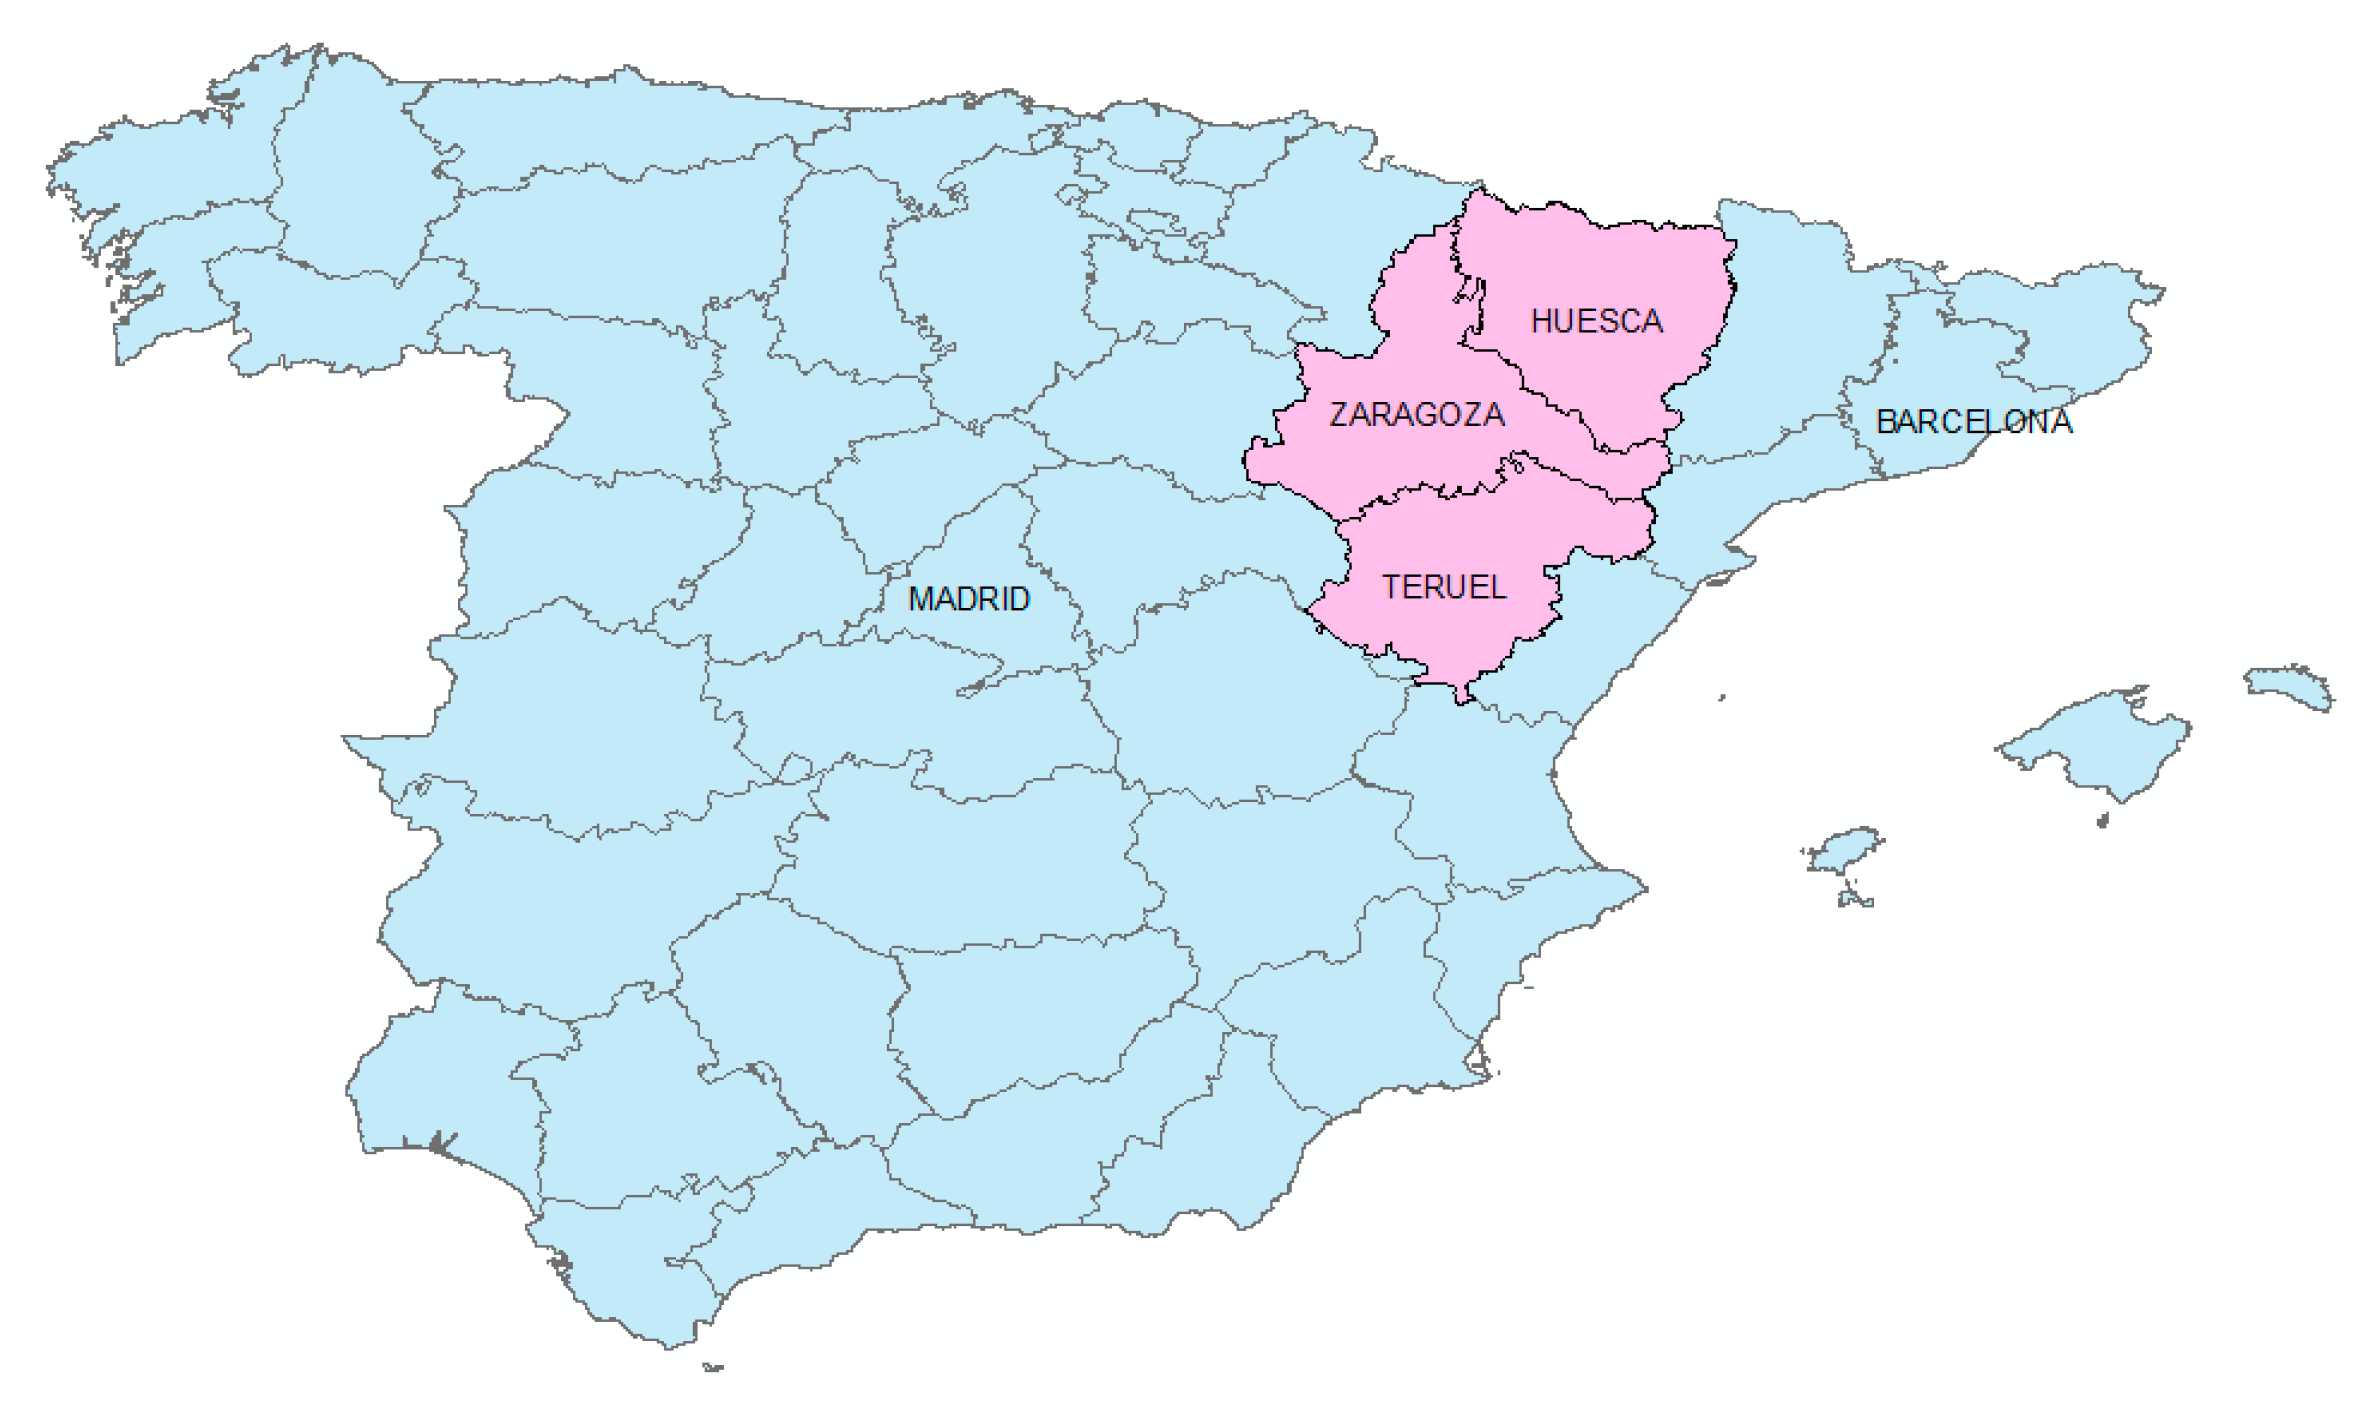
Figure 2.
Unemployment rates in Aragón and Spain. Notes: Quarterly data. Source: Labor Force Survey, Instituto Nacional de Estadística.
Figure 2.
Unemployment rates in Aragón and Spain. Notes: Quarterly data. Source: Labor Force Survey, Instituto Nacional de Estadística.


Table 1.
Distribution of firms by Activity Section in 2017, CNAE-2009 classification.
| Firms | % of Firms | % of Salaried Workers | |
|---|---|---|---|
| SECTION A: Agriculture, hunting, fishing and forestry | 1378 | 6.16 | 4.80 |
| SECTION B: Mining and quarrying | 95 | 0.42 | 0.60 |
| SECTION C: Manufacturing | 2632 | 11.77 | 32.64 |
| SECTION D: Electricity and gas supply and air conditioning | 448 | 2.00 | 0.16 |
| SECTION E: Water supply, sanitation activities, waste management and decontamination | 66 | 0.30 | 0.92 |
| SECTION F: Construction | 3376 | 15.10 | 7.93 |
| SECTION G: Wholesale and retail trade; repair of motor vehicles and motorcycles | 4924 | 22.03 | 19.89 |
| SECTION H: Transport and storage | 887 | 3.97 | 6.97 |
| SECTION I: Hotels and restaurants | 1315 | 5.88 | 5.02 |
| SECTION J: Information and communication | 465 | 2.08 | 2.30 |
| SECTION K: Financial and insurance activities | 529 | 2.37 | 0.51 |
| SECTION L: Real estate activities | 1759 | 7.87 | 1.06 |
| SECTION M: Professional, scientific and technical activities | 2053 | 9.18 | 3.68 |
| SECTION N: Administrative and support service activities | 699 | 3.13 | 5.13 |
| SECTION P: Education | 330 | 1.48 | 1.38 |
| SECTION Q: Health and social work activities | 494 | 2.21 | 4.65 |
| SECTION R: Arts, entertainment and recreation | 453 | 2.03 | 1.27 |
| SECTION S: Other service activities | 448 | 2.00 | 1.11 |
| SECTION T: Private households with employed persons | 1 | 0.00 | 0.00 |
| SECTION U: Extra-territorial organizations and bodies | 2 | 0.01 | 0.00 |
| Total | 22,354 | 100 | 100 |
Note: Data source: SABI, software version 72.00 updated to 08/08/2017.
Table 2.
Descriptive statistics by sector.
| All Sectors | ||||
|---|---|---|---|---|
| Index | Mean | Standard deviation | Minimum | Maximum |
| Relative employment growth | 0.01 | 0.46 | −5.94 | 4.38 |
| Specialization | 12.06 | 66.41 | 0.01 | 6651.8 |
| Diversity | 0.44 | 1.35 | 3.14 × 10⁻⁷ | 124.18 |
| Number of firms | 662 | 710.06 | 1 | 2547 |
| Size | 0.94 | 1.54 | 0.01 | 42.82 |
| Manufacturing | ||||
| Index | Mean | Standard deviation | Minimum | Maximum |
| Relative employment growth | 0.01 | 0.44 | −5.94 | 4.38 |
| Specialization | 14.59 | 47.28 | 0.01 | 1520.5 |
| Diversity | 0.4 | 1.43 | 3.14 × 10⁻⁷ | 124.18 |
| Number of firms | 273.39 | 209.04 | 1 | 815 |
| Size | 0.96 | 1.68 | 0.01 | 42.82 |
| Construction | ||||
| Index | Mean | Standard deviation | Minimum | Maximum |
| Relative employment growth | 0.03 | 0.44 | −2.68 | 3.06 |
| Specialization | 6.27 | 16.93 | 0.01 | 359.35 |
| Diversity | 0.37 | 1.97 | 4.25 × 10⁻⁶ | 115.52 |
| Number of firms | 1865.72 | 570.59 | 54 | 2547 |
| Size | 0.88 | 0.87 | 0.03 | 15.41 |
| Services | ||||
| Index | Mean | Standard deviation | Minimum | Maximum |
| Relative employment growth | 0.01 | 0.48 | −3.99 | 3.84 |
| Specialization | 12.29 | 90 | 0.02 | 6651.8 |
| Diversity | 0.51 | 0.85 | 4.99 × 10⁻⁶ | 43.07 |
| Number of firms | 492.41 | 454.62 | 2 | 2023 |
| Size | 0.94 | 1.62 | 0.01 | 35.07 |
Notes: Statistics calculated using all sectoral values available for all municipalities.
Table 3.
Results for aggregate employment growth.
| (1) | (2) | (3) | (4) | (5) | (6) | (7) | (8) | (9) | |
|---|---|---|---|---|---|---|---|---|---|
| Dependent: Growth in | Total workers | Total workers | Total workers | Total workers | Total workers | Total workers | Self-employees | Self-employees | Self-employees |
| Period: | 2003–2015 | 2003–2007 | 2008–2015 | 2003–2015 | 2003–2007 | 2008–2015 | 2003–2015 | 2003–2007 | 2008–2015 |
| Municipalities: | All | All | All | Pop. ≥ 3000 | Pop. ≥ 3000 | Pop. ≥ 3000 | Pop. ≥ 3000 | Pop. ≥ 3000 | Pop. ≥ 3000 |
| Specialization | 0.020 *** | 0.031 *** | 0.013 *** | 0.015 | 0.045 * | −0.010 | 0.082 *** | 0.110 *** | 0.054 *** |
| (0.004) | (0.007) | (0.005) | (0.018) | (0.024) | (0.020) | (0.015) | (0.024) | (0.014) | |
| Diversity | 0.004 *** | 0.007 *** | 0.001 | 0.005 | 0.020 ** | −0.008 | 0.028 *** | 0.039 *** | 0.018 *** |
| (0.001) | (0.002) | (0.001) | (0.007) | (0.008) | (0.008) | (0.006) | (0.011) | (0.005) | |
| Size | −0.009 *** | −0.008 * | −0.010 ** | 0.008 | 0.031 ** | −0.005 | 0.002 | 0.017 | −0.008 |
| (0.003) | (0.004) | (0.004) | (0.009) | (0.013) | (0.010) | (0.009) | (0.017) | (0.007) | |
| Density | −0.002 | −0.004 * | −0.000 | −0.003 * | −0.009 ** | 0.000 | 0.001 | −0.003 | 0.004 |
| (0.001) | (0.002) | (0.002) | (0.002) | (0.004) | (0.002) | (0.004) | (0.005) | (0.003) | |
| Regional FE (NUTS 3) | Y | Y | Y | Y | Y | Y | Y | Y | Y |
| Time FE | Y | Y | Y | Y | Y | Y | Y | Y | Y |
| Observations | 5933 | 2450 | 3483 | 494 | 186 | 308 | 494 | 186 | 308 |
| Municipalities | 577 | 577 | 577 | 46 | 46 | 46 | 46 | 46 | 46 |
| R2 | 0.098 | 0.093 | 0.039 | 0.305 | 0.561 | 0.121 | 0.603 | 0.396 | 0.367 |
Notes: Logarithm is taken for all variables. All models include a constant. Robust standard-errors in brackets, clustered by municipality. Significant at the * 10%, ** 5%, *** 1% level.
Table 4.
Manufacturing results (activities 10-33 CNAE-2009).
| (1) | (2) | (3) | (4) | (5) | |
|---|---|---|---|---|---|
| Municipalities: | All | All | All | Excluding Zaragoza | Population ≥ 3000 |
| Specialization | −0.020 *** | −0.031 *** | −0.030 *** | −0.031 *** | −0.030 *** |
| (0.004) | (0.005) | (0.005) | (0.005) | (0.007) | |
| Diversity | −0.001 | 0.002 | 0.001 | 0.000 | −0.007 |
| (0.004) | (0.005) | (0.004) | (0.004) | (0.006) | |
| Size | −0.048 *** | −0.044 *** | −0.044 *** | −0.045 *** | −0.050 *** |
| (0.005) | (0.006) | (0.006) | (0.006) | (0.011) | |
| Density | −0.008 *** | −0.005 | −0.003 | −0.003 | −0.005 |
| (0.002) | (0.004) | (0.003) | (0.003) | (0.005) | |
| IMR × Year | N | Y | Y | Y | Y |
| Time FE | N | Y | Y | Y | Y |
| Regional FE (NUTS 3) | N | N | Y | Y | Y |
| Regional FE (comarcas) | N | Y | N | N | N |
| Sectoral FE | N | Y | Y | Y | Y |
| Observations | 12,820 | 12,820 | 12,820 | 12,475 | 5829 |
| Log Likelihood | −7438.526 | −7330.318 | −7346.534 | −7296.857 | −3441.353 |
Notes: Logarithm is taken for all variables. All models include a constant. Robust standard-errors in brackets, clustered by sector and municipality. Significant at the * 10%, ** 5%, *** 1% level.
Table 5.
Construction results (activities 41-43 CNAE-2009).
| (1) | (2) | (3) | (4) | (5) | |
|---|---|---|---|---|---|
| Municipalities: | All | All | All | Excluding Zaragoza | Population ≥ 3000 |
| Specialization | −0.018 ** | −0.032 *** | −0.031 *** | −0.031 *** | −0.044 |
| (0.007) | (0.009) | (0.009) | (0.009) | (0.040) | |
| Diversity | 0.001 | −0.000 | −0.001 | −0.001 | −0.016 |
| (0.004) | (0.005) | (0.004) | (0.004) | (0.012) | |
| Size | −0.130 *** | −0.132 *** | −0.128 *** | −0.128 *** | −0.148 *** |
| (0.011) | (0.013) | (0.012) | (0.012) | (0.046) | |
| Density | −0.002 | 0.001 | 0.000 | 0.000 | −0.018 |
| (0.004) | (0.006) | (0.005) | (0.005) | (0.014) | |
| IMR×Year | N | Y | Y | Y | Y |
| Time FE | N | Y | Y | Y | Y |
| Regional FE (NUTS 3) | N | N | Y | Y | Y |
| Regional FE (comarcas) | N | Y | N | N | N |
| Sectoral FE | N | Y | Y | Y | Y |
| Observations | 6164 | 6164 | 6164 | 6119 | 779 |
| Log Likelihood | −3432.856 | −3331.414 | −3344.037 | −3341.081 | −307.100 |
Notes: Logarithm is taken for all variables. All models include a constant. Robust standard-errors in brackets, clustered by sector and municipality. Significant at the * 10%, ** 5%, *** 1% level.
Table 6.
Services results (activities 49-96 CNAE-2009).
| (1) | (2) | (3) | (4) | (5) | |
|---|---|---|---|---|---|
| Municipalities: | All | All | All | Excluding Zaragoza | Population ≥ 3000 |
| Specialization | −0.011 *** | −0.027 *** | −0.025 *** | −0.037 *** | −0.040 *** |
| (0.004) | (0.005) | (0.005) | (0.006) | (0.008) | |
| Diversity | 0.004 | 0.001 | 0.001 | 0.001 | 0.013 ** |
| (0.003) | (0.004) | (0.003) | (0.004) | (0.006) | |
| Size | −0.104 *** | −0.107 *** | −0.105 *** | −0.099 *** | −0.110 *** |
| (0.006) | (0.007) | (0.007) | (0.007) | (0.011) | |
| Density | 0.001 | −0.006 | 0.001 | 0.001 | 0.008 * |
| (0.003) | (0.004) | (0.003) | (0.003) | (0.004) | |
| IMR×Year | N | Y | Y | Y | Y |
| Time FE | N | Y | Y | Y | Y |
| Regional FE (NUTS 3) | N | N | Y | Y | Y |
| Regional FE (comarcas) | N | Y | N | N | N |
| Sectoral FE | N | Y | Y | Y | Y |
| Observations | 14,374 | 14,374 | 14,374 | 13,753 | 7989 |
| Log Likelihood | −9280.180 | −9067.900 | −9089.257 | −8915.978 | −4951.565 |
Notes: Logarithm is taken for all variables. All models include a constant. Robust standard-errors in brackets, clustered by sector and municipality. Significant at the * 10%, ** 5%, *** 1% level.
© 2019 by the authors. Licensee MDPI, Basel, Switzerland. This article is an open access article distributed under the terms and conditions of the Creative Commons Attribution (CC BY) license (http://creativecommons.org/licenses/by/4.0/).
Share and Cite
MDPI and ACS Style
González-Val, R.; Marcén, M. Agglomeration Economies in Small Cities and Business: The Impact of the Great Recession in Aragón (Spain). Sustainability 2019, 11, 3770. https://doi.org/10.3390/su11143770
AMA Style
González-Val R, Marcén M. Agglomeration Economies in Small Cities and Business: The Impact of the Great Recession in Aragón (Spain). Sustainability. 2019; 11(14):3770. https://doi.org/10.3390/su11143770
Chicago/Turabian StyleGonzález-Val, Rafael, and Miriam Marcén. 2019. "Agglomeration Economies in Small Cities and Business: The Impact of the Great Recession in Aragón (Spain)" Sustainability 11, no. 14: 3770. https://doi.org/10.3390/su11143770
Note that from the first issue of 2016, this journal uses article numbers instead of page numbers. See further details here.