Article

The Role of Embeddedness on Regional Economic Resilience: Evidence from the UK

by
Anastasios Kitsos
*,
André Carrascal-Incera
and
Raquel Ortega-Argilés
City-REDI, Department of Strategy and International Business, Birmingham Business School, University of Birmingham, Ash House, Edgbaston, Birmingham B15 2TT, UK
*
Author to whom correspondence should be addressed.
Sustainability 2019, 11(14), 3800; https://doi.org/10.3390/su11143800
Submission received: 5 June 2019 / Revised: 4 July 2019 / Accepted: 9 July 2019 / Published: 11 July 2019
(This article belongs to the Special Issue Regions and Economic Resilience)

Abstract

:
This paper examines the role of local industrial embeddedness on economic resilience in UK Nomenclature of Territorial Units for Statistics (NUTS2) regions. The 2008 financial crisis had a profound effect on the socioeconomic conditions of different places. UK regions had significantly divergent experiences based on their capacity to avoid or overcome the shock. Research has shed light on some potential drivers behind this differential resilience performance such as skills, but others, such as the degree of a production system’s local embeddedness, are largely underexplored. This paper aims at filling this gap. We hypothesise that the combination of positive external economies of complexity and negative lock-in effects lead to an inverted U-shaped relationship between embeddedness and resilience. We use a novel dataset and method for approximating embeddedness and fixed-effects panel regressions for the period 2000–2010 to control for regional heterogeneity. The results support our hypothesis and suggest that embeddedness has a positive effect on resilience up to a point, after which more embeddedness leads to negative resilience effects. The results call for greater attention on the relationships among local industries, particularly with regards to the recent development of local industrial strategies.

1. Introduction

The 2008 crisis and, in particular, its uneven impact at the subnational level, have brought economic resilience to the centre stage of regional economic research [1,2,3]. Since then, most global economies have exited the great recession of the 21st century, but the notion of resilience as the capacity to avoid or overcome a negative shock remains more crucial than ever. It is not by chance that even using a narrow understanding of economic resilience still directly relates to nine of the 17 United Nations Sustainable Development Goals, such as goals number 3 Good Health and Wellbeing and number 8 Decent Work and Economic Growth (Appendix A Table A1). Similarly, the recently developed local industrial strategies in the UK explicitly mention resilience and inclusivity as important considerations of future growth efforts [4].
The importance of resilience has led to several studies examining the determining factors that contribute or hinder the ability of a place (or an individual) to mitigate the negative impact of a crisis. As a result, several resilience-promoting factors have been identified, ranging from human capital to physical geography [1,5].
Within this literature, nuanced characteristics of local industrial structures have been largely underexplored. In fact, only recently have researchers started to examine issues such as the effects of industrial relatedness and technological coherence [6] on resilience. These studies propose links between some qualitative characteristics of local industrial structures and resilience performance. However, partly due to data constraints, it is still unknown how the input–output (I–O) relationships between industries in a locality (and thus the embeddedness of a local economic system) affect resilience performance. This has been particularly relevant at the UK subnational level since the re-emergence of the importance of place-based policies.
Our paper addresses this gap by conceptualising and operationalising the relationship between embeddedness and resilience. In particular, we hypothesise that embeddedness has an inverted U-shaped relationship with resilience, taking advantage of activity complex economies [7] and knowledge externalities. However, we expect this relationship to be positive up to an inflexion point, after which lock-in effects [8,9] impact negatively on the capacity of an area to avoid or overcome a recession.
To test our theorisation, we employ panel data econometric methods. We use employment growth to identify crisis years and approximate resilience and a novel dataset modelling intra-regional sectoral I–O relationships to estimate the level of embeddedness at NUTS2 regions in the UK during 2000–2010. We allow a recession year to vary from one region to the other and use fixed-effects regressions to account for the unobserved heterogeneity between regions. Our findings support an inverted U-shaped relationship between embeddedness and resilience during recession years. The policy implications suggest that localities need to focus on understanding the embeddedness of their industrial structures in greater detail and identify the thresholds that allow them to have a positive rather than a negative effect on resilience. This is particularly relevant to local industrial strategies currently emerging in the UK.
The paper is structured as follows. Section 2 considers the background and our conceptualisation of the relevant notions. This is followed by a description of our data and operationalisation. Section 4 presents our findings, which are discussed in Section 5 together with potential limitations and steps for further research. Section 6 concludes the paper.

2. Background and Conceptualisation

2.1. Economic Resilience and Its Drivers

Resilience has multiple meanings in different fields. As we understand the notion, it originated in environmental and ecological studies with the writings of Holling [10] then was used in hazard and disaster studies (see paper by Noy and Yonson [11] for a useful review) before finding its way into regional economics and economic geography [12,13,14]. In the latter fields, the notion moved along a spectrum of understandings, differentiated on the perspective of single vs. multiple equilibria vs. resilience as a dynamic approach of continuous adaptation (Table 1).
Initial approaches have used the notion of engineering resilience, where a crisis throws a place off their pre-determined path and a locality is resilient if it quickly bounces back [16]. Refuting this deterministic approach, multiple equilibria perspectives argued that an area might move from one equilibrium to another higher or lower one with the potential for permanent hysteretic effects [17,18,19]. This means a shift in the deterministic trend of engineering resilience approaches. The most recent understanding of the term disputes the static view of equilibrium-based approaches and treats resilience as a dynamic process. This adds an evolutionary perspective to the notion, which is seen as adaptation of socio-economic systems to continuously changing environments [3,20,21].
The pluralism of definitions has been accompanied by a variety of operationalisations that included both composite indicators as well as single proxies [15,22]. The multifaceted nature of economic resilience has prompted attempts to create composite indicators in order to reflect the notion [23,24,25]. These indicators have several advantages such that they allow the consideration of more than one aspect of the notion, they assist the comparison of different places with a single measure, and they can represent difficult concepts in a simple, widely understood metric. At the same time, though, their use is not yet universally accepted due to the influence of the creator on matters such as the aggregation and the weighting of the different dimensions [26].
Consequently, it is not surprising that the majority of empirical studies use single measures of economic output and/or labour market performance [1,2,27]. Measures such as gross value added (GVA) and labour market indicators offer the advantage of timely and regular publication, consistency in their production, and understanding by a wide range of stakeholders. In particular, labour market performance could reflect wider socioeconomic conditions, since the lack of employment could lead to significant knock-on effects on wellbeing and the economy, such as scarring effects, family breakdowns, and criminality, as well as reduced demand conditions in a local economy [28,29,30].
Using these indicators, several studies have identified factors that help or hinder local economic resilience. The range expands from skills [1,27] to economic structure characteristics [31] and from territorial capital [32] to agency, institutions, and geography [5,20,33,34].
Human capital emerges as a significant determinant of economic resilience. Predominantly proxied by the share of population with a certain qualification level (e.g., degree and above level qualifications), human capital (or the lack of it) has a positive (negative) influence on the resilience performance of localities and individuals in different countries [1,27,35,36]. This result is among the most consistent in resilience studies both in terms of the time periods considered and the areas under consideration [15].
Factors that are more inconclusive revolve around entrepreneurship and the industrial structure of localities. Through its positive effects on growth and employment [37,38], entrepreneurship would be expected to have a positive effect on the mitigation of a crisis impact. However, quantitative examinations to date suggest that the relationship between entrepreneurship and resilience is more complex and could be influenced by factors such as the local prevalence of foreign businesses [39]. Both Kitsos and Bishop [1] and Rocchetta and Mina [6] failed to identify a positive effect of new firm formation on the resilience performance of localities in the UK. Bishop [40] suggests that qualitative characteristics of local knowledge such as size, (un)relatedness, and diversity mediate the extent to which entrepreneurship can influence adaptation and resilience. Similarly, Kacher et al. [41] found evidence that higher, pre-crisis entrepreneurial dynamism was detrimental during the recession period of the 2008 crisis, whilst it bolstered growth in local areas during the recovery period.
The effects of the industrial structure on resilience are similarly perplexing. The mix of industries in an area is often a prime suspect with regards to the origin and the propagation of crises in different areas. Economic downturns usually have differential impacts on industries with varying demand, supply, location, and competition characteristics [42]. In the UK, the oil price shocks of the 1970s, for example, had a greater impact on manufacturing, whilst the 1990s shock affected services more [31].
The systemic nature of the 2008 crisis makes the identification of the sectoral impact of the crisis more difficult. Finance and business services had the highest job losses during 2008–2009, whilst manufacturing had its biggest drop in output for the last 30 years [43]. Kitsos and Bishop [1] did not find statistically significant effects of employment in a range of sectors on the resilience of UK Local Authority Districts, whilst Lee [27], focussing on UK cities, found that high employment shares in either employment in financial services or manufacturing negatively affected the crisis impact. Bristow et al. [44] examined economic resilience across Europe and found mixed results on the effect of manufacturing and a positive impact of employment in services on economic resilience, whilst Hill et al. [16] suggested that, in the US, employment in durables’ manufacturing had a negative impact during the downturn period and a positive impact during recovery.
Similarly inconclusive is the evidence on specialisation and diversity. Diversity would be expected to reduce the impact of a crisis during the recession stage (in a similar manner to portfolio diversification), whilst specialisation could increase output and employment growth at a greater pace during the recovery stage [45,46]. However, several studies failed to identify a statistically significant effect on economic resilience for either specialisation or diversification [1,27,47], whilst Di Caro [48] and Li et al. [49] found a positive effect of diversity on resilience.
Two possible and interlinked explanations are provided for the above inconclusive evidence. The first is offered by Martin et al. [31], who suggested that the importance of industrial structures on a crisis’ outlook has decreased since the 1970s. The increasing complexity of economic activities means that downturns can increasingly affect a larger number of industries, and hence their negative effects are traversing across the log established industrial classifications. Simultaneously, though, this increasing complexity means that more nuanced understandings are needed in order to unravel the relationship between local industrial structures and economic resilience.
In this sense, the latest approaches move beyond the traditional understanding of local industrial structures as the share of employment in a certain industrial code towards notions that attempt to understand the relationship between industries at a local level. Rocchetta and Mina [6], for example, used the notion of technological coherence reflected by the cognitive proximity of patenting activity in UK NUTS3 regions. They found that places with higher technological coherence exhibited better resilience performance, even when accounting for traditional measures of relatedness.
This paper aims to contribute to this discussion by considering the notion of the embeddedness of local industrial structures and its relationship to regional economic resilience. It is the first time these concepts have been considered together. This is partly due to the current state-of-the-art in the relevant literature as well as the fact that it is the first time we have a dataset that can approximate industrial relationships at the subnational level. Below, we outline the impact channels through which embeddedness is expected to affect resilience performance, as well as our theorisation on these impacts, before moving on to the methodology of measuring embeddedness.

2.2. Embeddedness and Resilience

The value of embeddedness of local economic structures is featured in a range of different literatures in economics and economic geography. Territorial embeddedness and geographical proximity may give rise to positive externalities and reduce risk. However, over-embeddedness may also lead to lock-in effects and a lack of dynamism. Consequently, it is hypothesised that embeddedness and economic resilience have an inverted U-shaped relationship where resilience is increasing with embeddedness up to a point, after which increased embeddedness reduces a system’s capacity to overcome a shock.
In 2002, Parr [50] and Parr et al. [7] built on the work of Ohlin [51], Isard [52], and Robinson [53] to unpack agglomeration economies into six categories. Figure 1 summarises their work considering externalities on the basis of:
-
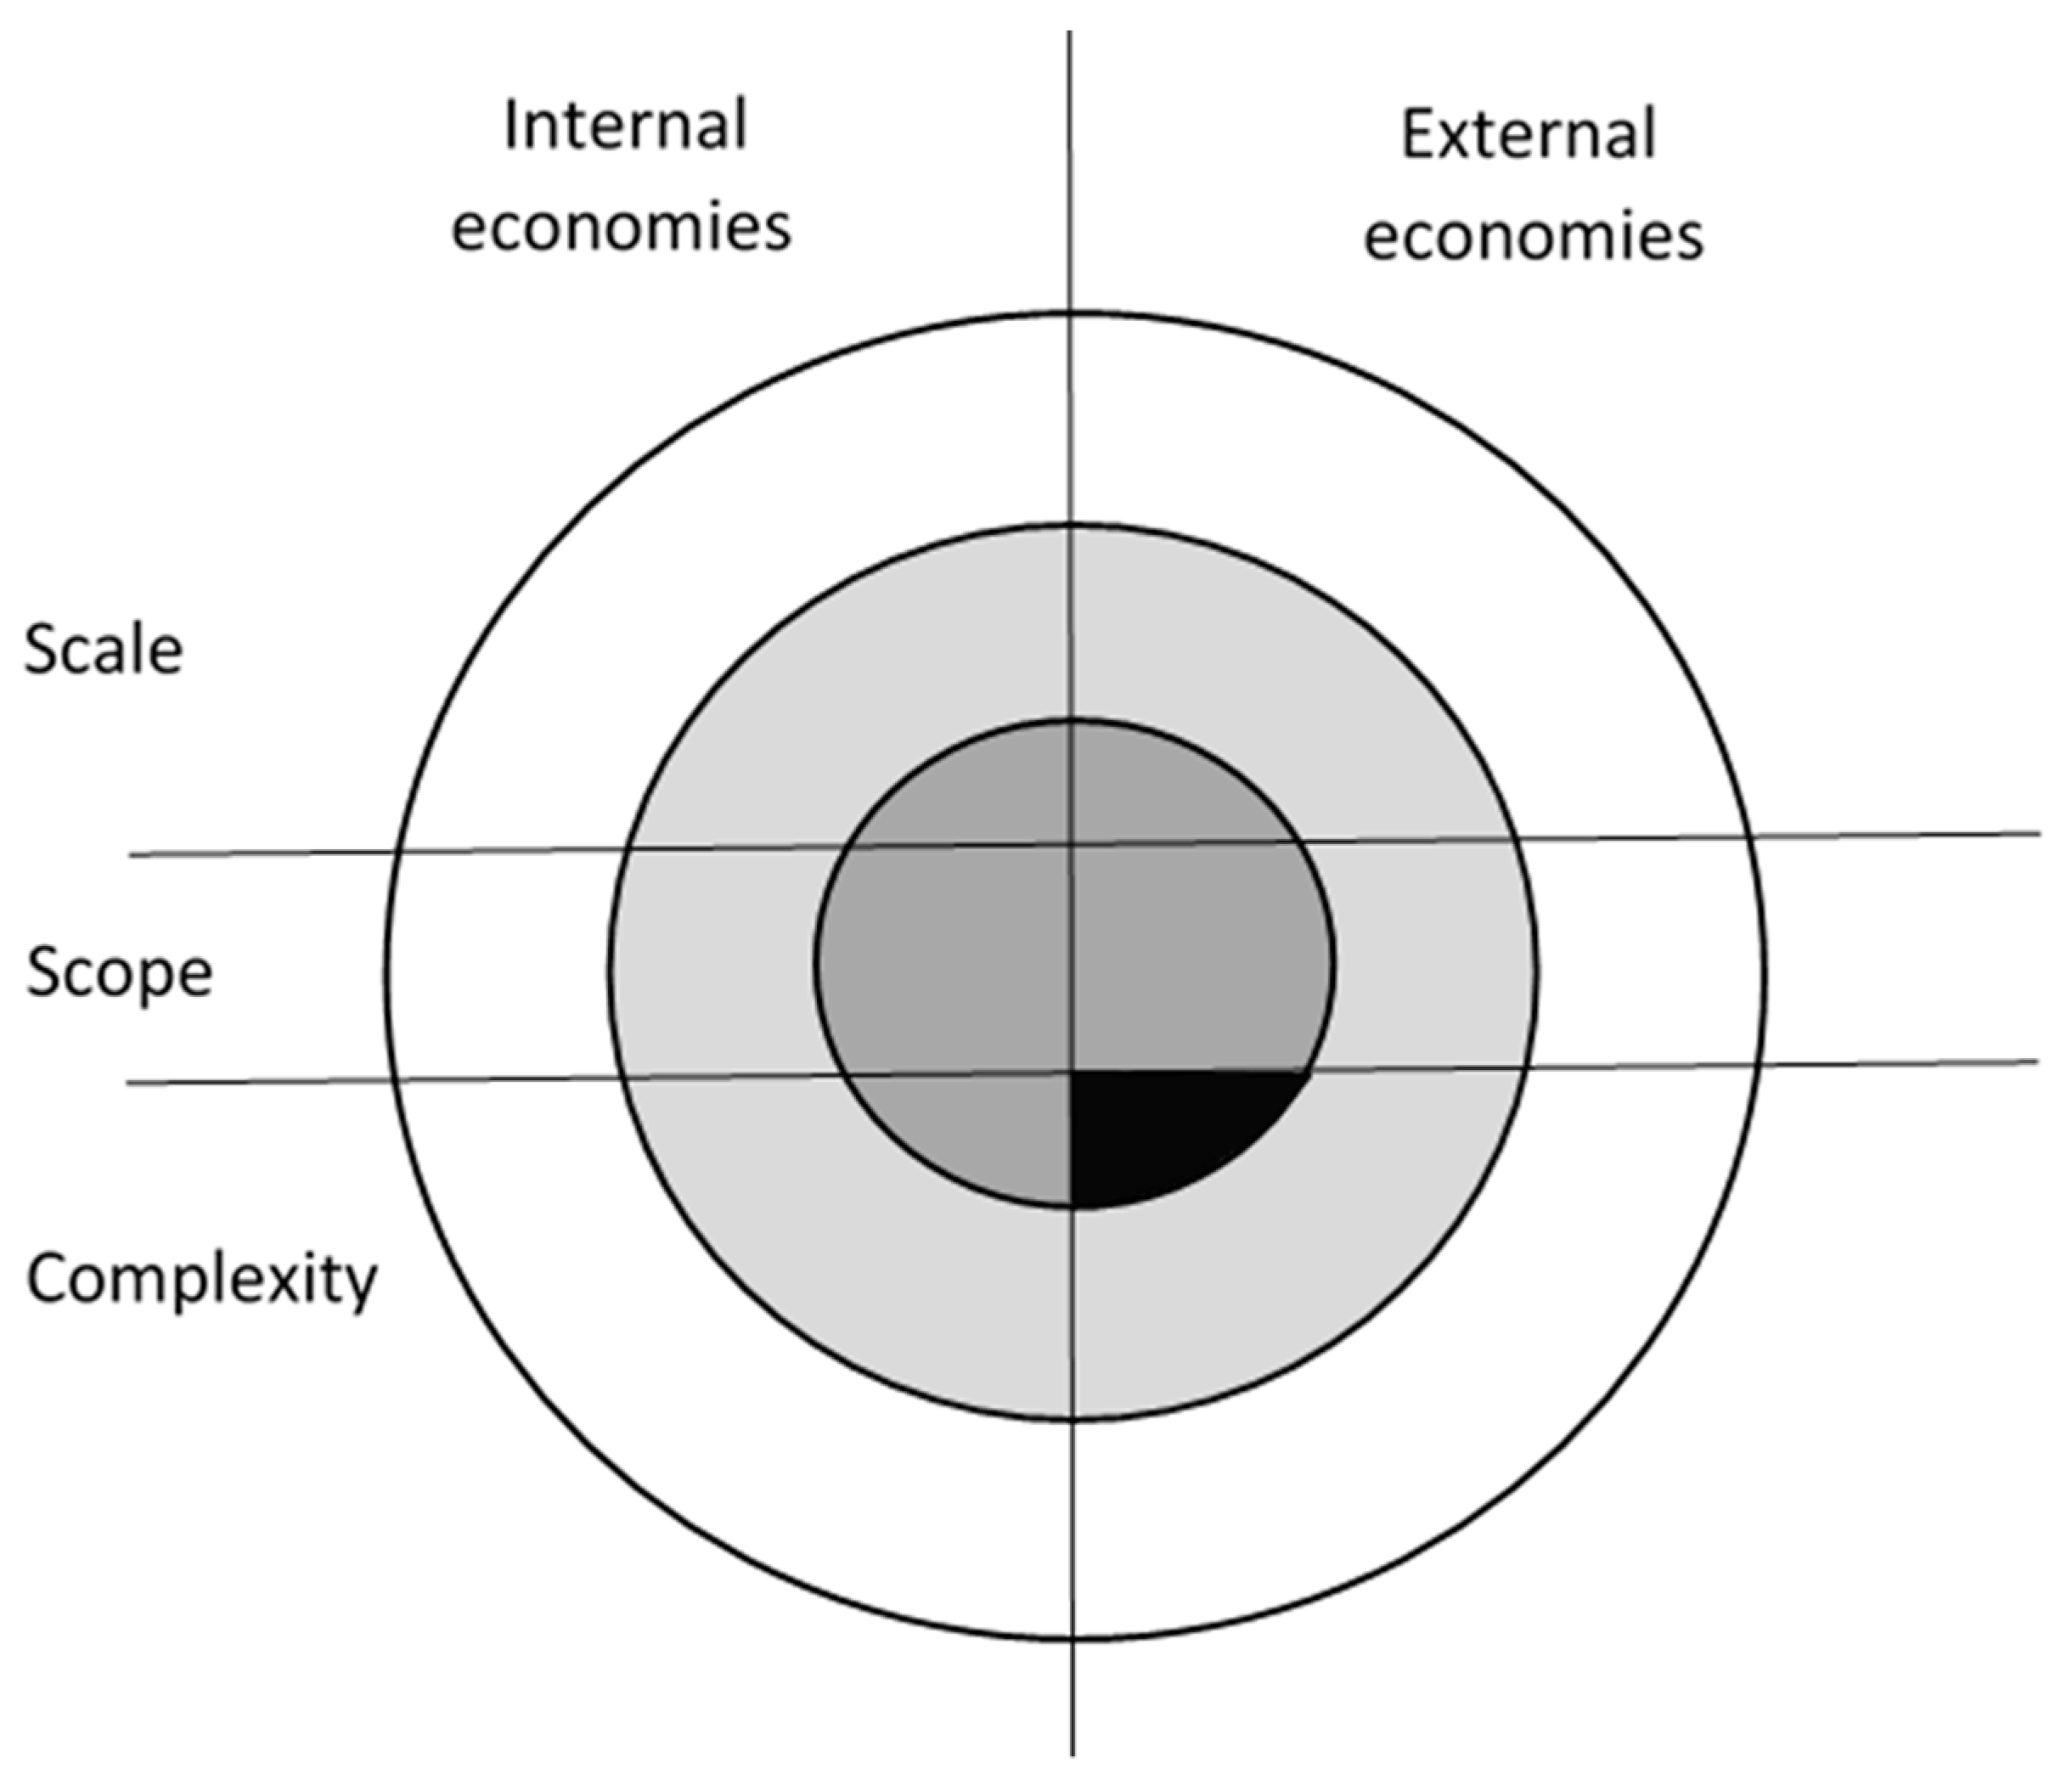
Scale, scope, and complexity (vertical categories);
-
Whether it is internal or external to the firm (horizontal dichotomy);
-
Spatial constraint (darker shades more spatially constrained externalities).
This paper focuses on the less examined, bottom right quadrant of spatially constrained complexity externalities or “activity-complex economies” [7] (p. 677). These denote economies that are derived from the collocation and the interaction of firms at the local level (e.g., locally embedded economic structures). The increased embeddedness can thus lead to reduced transport costs, the use of by-products as intermediate inputs, an improvement of communication, and reduction of hierarchy coordination costs [55]. In addition, it can lead to reduced need for inventories and more just-in-time production.
In the Global Production Networks literature, these externalities have been captured by the notion of territorial embeddedness. This type of embeddedness increases the interactions of local agents and leads to increased institutional thickness and trust. These in turn raise the probability of tacit knowledge diffusion [56,57,58].
In regional economics, embeddedness reflects the spatial proximity of different industries and actors. This proximity increases the potential for recombination of existing knowledge and gives rise to relatedness, both of which are crucial for innovative activity. In this sense, locally embedded economic systems increase knowledge diffusion and foster untraded interdependencies that generate growth [8,9].
From the above, it is clear that there is extensive literature on the benefits of geographically embedded industrial structures on local economies via numerous localised externalities. These benefits are particularly important during economic downturns. Externalities that lead to cost reductions decrease the average unit cost and allow local industries and firms to remain competitive at times of heightened competition. Similarly, externalities that increase trust and knowledge flows may assist diffusion of resilience strategies and increase innovation that generates new products and services, which ensures the sustainability of business.
However, when local economic systems are too embedded, they are liable to suffer from lock-in effects [8,9,56]. The lack of external knowledge flowing into a local economy may have adverse effects on its long-term innovative activity and competitiveness. An indicative example is given by Grabher [9] on the Ruhr area where the main elements of its successful industrial district were the ones that locked it into “rigid specialisation”. During a recession, a locked-in economy may at first avoid the crisis impact, but in the medium-term, it would be expected to suffer greater loss of employment or economic growth due to lack of adaptive capability.
It is then expected that embeddedness and resilience will have a relationship where resilience will increase together with embeddedness up to a point, after which more embedded industrial structures will exhibit reduced resilience performance. This relationship has not been examined to date, mainly due to our lack of data approximating the embeddedness of local economic systems. In this paper, we use a newly developed dataset to identify the magnitude of linkages within NUTS2 regions in the UK and examine the aforementioned hypothesis. The next section outlines how we measure embeddedness and an attempt to empirically test our hypothesis.

3. Data and Operationalisation

Before examining the relationship between embeddedness and resilience, it is crucial to operationalise the concepts and describe the database used in the empirical examination. Similar to the majority of resilience studies, we use labour market performance to approximate resilience. Our approach allows each region to have a region-specific crisis whilst we elicit resilience by examining the effect of embeddedness on labour market performance during the crisis years.
In particular, we use regional employment growth as our dependent variable and fixed-effects panel data methods with a dummy variable taking the value of 1 when a region has negative employment growth and 0 otherwise. This method allows us to control for all the region-specific time-invariant characteristics. In addition, the crisis dummy variable enables us to control for the effect of the explanatory variables on the dependent one during a downturn, revealing the relationship between embeddedness and economic resilience.
It is worth mentioning that this is one of a multitude of ways to approximate resilience, with other notable methods being the ones of Martin [18] and Lagravinese [59], who measured resilience by comparing regional to national labour market performance. In our case, the interest is in identifying the effect of embeddedness on resilience by comparing the performance of a region to itself rather than comparing regions to each other. This method is similar to that of Rocchetta and Mina [6] in the sense that it measures the effects on resilience via an interaction with a crisis dummy, and it is similar to that of Sensier et al. [22] in that it allows regions to individually have a downturn instead of being determined by national performance.
As discussed above, the local industrial structure is expected to be a significant determinant on an area’s resilience performance [18,60]. In his seminal work on regional economic structure and sensitivity to shocks, Conroy [60] also suggested that the reaction of each region to a crisis would depend on the degree of what he called “sectoral inter-relatedness”. These ripple effects (due to the sectoral interdependencies) are considered crucial in explaining how the economic structure affects the resilience performance of places and is represented in our paper in the embeddedness or the domestic production ratio concept [61].
The notion and its measurement below indicate the share of local production that is generated by using local inputs. It reflects the importance of intermediate sectoral inter-relatedness over the total production, the direct linkages in the production process, as well as the technology of production by sectors (how “independent” the intermediate inputs used in local production are). Thus, embeddedness can be defined as:
E m b j = i = 1 n Z i j d i = 1 n Z i j d + Z i j m
where Z is the intermediate flows between sectors i and j (n being the total number of sectors), d stands for domestic flows (e.g., transactions between sectors within the same region), and m represents imported inputs from outside the region.
Following the discussion in the previous section, in a context where production processes are more and more fragmented into separate activities and countries specialize more and more in particular stages of production [62], having a higher embeddedness ratio could lead to different results. It could be positive, meaning that a higher proportion of inputs from within the region could help avoid exposure to external shocks; on the contrary, it could have negative effects if it means lower productivity and the incapability to participate in international markets, limiting their potential economic growth.
The most suitable framework for analysing the domestic or the imported content of the sectoral structure is a multiregional I–O table [61]. As can be seen in Figure 2, this two-region case shows the intermediate flows between region r and region s (inter-regional flows) but also the transactions between the sectors within regions r and s (intra-regional flows).
The data used in measuring embeddedness come from the only database that provides interregional trade data at a subnational level. This is the recently published EUREGIO [63,64]. In relation to our study, it provides spatially disaggregated I–O information for 37 NUTS2 UK regions (2006 NUTS2, see Table A6 in the Appendix A) at a 14 sector disaggregation (see Table A7 in the Appendix A) and data on imports and exports by country/region of origin and destination (as a multiregional I–O framework). It was constructed using the World Input–Output Database (WIOD) [65] as the original information (which was based on national accounts) combined with Eurostat’s regional accounts on NUTS2 sectoral value-added, investment, and consumption levels. The information for the interregional trade data comes from the PBL Netherlands Environmental Assessment Agency, the only fully consistent database on trade in goods and services at the NUTS2 regional level (for 2000). Updates of this interregional trade flows are produced using freight transport data from Eurostat (for goods) and business flight ticket information (for services).
The measure of sectoral embeddedness described in Equation (1) is used to provide a single indicator of local economic embeddedness for each region. To do this, we aggregate the weighted sectoral embeddedness using the ratio between the output of each sector over the total output of the regional economy as a weight:
E m b ¯ = j = 1 n w j   E m b j j = 1 n w j
where the weight can be defined as w j =   X j r / j = 1 n X j r , with X j r being the output by sector j for each region r.
The rest of the variables used in the analysis below refer to the identification of a crisis year as well as selected control variables from the existing literature. As discussed, a new approach is introduced in identifying the crisis. Dummy variable Crisis takes the value of 1 when a region experiences negative employment growth rates and 0 otherwise. In this way, it is possible to measure the crisis on each region separately and expand the identification of a crisis year within our sample beyond the 2008 financial crisis. As a result, this approach allows each region to have a crisis year throughout the whole time period of our dataset, enabling us to measure the effect of local embeddedness on a region’s labour market performance.
Furthermore, we control for a set of characteristics expected to explain regional employment growth. The effects of entrepreneurship on employment growth are accounted for by measuring firm births per 1000 population (FB_pop) and using Value Added Tax (VAT) registrations and the Office for National Statistics’ (ONS) Business Demography data. Economic growth is accounted for by considering GVA growth (Growth) for each region, whilst the level of skills is controlled by variables measuring the share of the population with a National Vocational Qualification level 4 and above (NVQ4+) and those without any (NO_NVQ) to account for the effects of human capital on employment generation. Finally, we use population density (Pop_den) to proxy Jacobs’ externalities arising from diversification of economic activity and its benefits to employment growth. A summary of the explanatory variables used in the analysis and their main descriptive statistics is shown in Table 2. In addition, Table A8 in the Appendix A shows a correlation matrix between these variables, trying to provide a clearer picture of the possible association between them. As can be seen, embeddedness is highly correlated to higher entrepreneurship rates and greater population densities. This is expected in the sense that more urbanised or denser areas would be expected to offer greater industrial mix and opportunities for purchasing local inputs, whilst they would also exhibit higher entrepreneurship rates. In order to alleviate any multicolinearity concerns, we introduce the control variables one at a time.
The method we use to identify the effect of embeddedness on economic resilience in our panel is a fixed-effects regression. This allows us to control for the unobserved time-invariant characteristics of different regions and is expressed by the following equation:
E m p g r o w i , t = α +   β 1 * E m b i , t +   β 2 * E m b _ s q r i , t +   β 3 * C r i s i s i , t +   γ 1 *   E m b i , t * C r i s i s i , t   +   γ 2 *   E m b _ s q r i , t * C r i s i s i , t +   δ j *   Χ i , t +   u i +   ε i
where E m p g r o w i , t is the employment growth in region i and year t, E m b i , t is the weighted measure of local economic embeddedness, and E m b i , t * C r i s i s i , t is its interaction term that allows us to control for the effect of embeddedness during a downturn. Moreover, to test whether the effect of embeddedness on resilience is linear, we add the squared term of embeddedness interacted with the crisis dummy variable E m b _ s q r i , t * C r i s i s i , t . This shows us whether the relationship in question has any inflexion points, thus supporting our hypothesis. Finally, Χ i , t is the vector of control variables discussed above, whilst u i and ε i are the region-specific fixed effects and the error term, respectively.
To examine the relationship between embeddedness and resilience, we set out to test two hypothesis. The first considers the effect of embeddedness on employment growth. This allows us to identify the direct connection between them. We expect that this relationship is curvilinear, suggesting that embeddedness is beneficial to employment growth up to an inflexion point, after which the relationship turns negative. The second hypothesis looks at the moderating effect of economic crisis on the embeddedness and employment growth relationship. This means that embeddedness becomes more significant during recession conditions since it can enhance resilience up to a point, after which increased embeddedness leads to worse resilience performance.
The two hypothesis can be summarized as follows:
Hypothesis 1 (H1).
There is an inverted U-shaped relationship between local industrial embeddedness and regional employment growth.
Hypothesis 2 (H2).
An economic crisis moderates the inverted U-shaped relationship between local industrial embeddedness and regional employment growth.

4. Results

Overall, the results support our hypothesis that local economic embeddedness has an inverted U-shaped relationship to employment growth. During crisis years, this relationship is reinforced, and embeddedness contributes to regional resilience up to a point, after which the effect turns negative. Our estimation strategy starts by considering the non-linear effect of embeddedness and its squared term on employment growth controlling for different regional determinants (Table 3). This first set of results includes pre and post-crisis periods, allowing for more longitudinal variation. Following this, we incorporate the moderating effect of economic recession by adding the interaction terms of Embi,t and its squared term with C r i s i s i , t . This set of specifications allows us to isolate the effect of embeddedness on resilience during a shock (Table 4).
In Table 3, results from specifications 1–8 show that the effect of E m b i , t on employment growth is positive and significant, whilst its squared term E m b _ s q r i , t is negative (at the 10% level), indicating an inverted U-shaped relationship during the total years of our panel. Our results yield coefficients consistent in sign and significance when gradually incorporating a set of control variables, which suggests a robust relationship.
Table 4 incorporates a set of model specification results including the interaction of the embeddedness variable with the crisis dummy E m b i , t * C r i s i s i , t and the same holds for its squared term E m b _ s q r i , t * C r i s i s i , t . These interactions allow us to isolate the effect of embeddedness during recession conditions (negative employment growth). Again, the gradual introduction of a set of control variables important to our understanding of regional resilience does not alter our main results.
In this case, the variables of interest are Crisis#Emb and Crisis#Emb_sqr. As can be seen, the crisis variable moderates the inverted U-shaped relationship between embeddedness and employment growth. The statistically significant and positive coefficients for Crisis#Emb indicate that, during a crisis year (negative regional employment growth), more embedded local economic systems exhibit reduced recession impacts and higher resilience. However, the statistically significant and negative coefficients for Crisis#Emb_sqr suggest that this positive relationship holds up to a certain degree of embeddedness, after which more embedded systems exhibit lower employment growth, higher recession impact, and worse resilience performance. Finally, the fact that the coefficients on Emb and Emb_sqr lose their statistical significance in Table 4 suggests that the relationship observed between embeddedness and employment growth in Table 3 is mainly driven by the effect of the former on the latter during recession times.
With regards to the control variables, entrepreneurship (proxied by firm births per 1000 inhabitants) has its expected positive effect on employment growth, whilst GVA growth exhibits a positive effect that is lost once the human capital and the population density variables are introduced. The lower statistical significance found when introducing more control variables is likely due to the structure of our panel (n = 36, t = 11). However, the results on embeddedness and its squared term are consistent across all robustness checks in the whole range of specifications. These suggest that the inverted U-shaped relationship between embeddedness and employment growth is influenced by the variable crisis in such a way that it increases the importance of the former to the latter and reveals a similar relationship between embeddedness and resilience.

Industrial Analysis

Beyond the embeddedness of the total regional economy, we also consider the effects of the embeddedness of specific sectors. This is because it is likely that the embeddedness of manufacturing, services, agriculture, or construction industries may affect resilience in a different way. To estimate the embeddedness of each sector, we use the formulas:
E m b m a n = j = s s 3 s s 8 w j   E m b j
E m b s e r = j = s s 10 s s 15 w j   E m b j
E m b a g r = E m b s s 1
E m b c o n = E m b s s 9
Running similar model specifications (see Appendix A Table A2, Table A3, Table A4 and Table A5), the findings suggest that, except for agriculture, the embeddedness of manufacturing, services, and construction sectors follow a similar pattern. Their embeddedness is positively associated with employment growth during the crisis period, whilst the negative coefficient on the squared term suggests an inverted U-shaped relationship. The effects remain stable across different specifications.

5. Discussion

We analyse the relationship between embeddedness and regional resilience by focusing on the impact of the former on employment generation. Our findings reveal the existence of a curvilinear relationship between local embeddedness and employment growth, which is becoming more pronounced during crisis years. These results suggest there is a “tipping point” in this relationship. Embeddedness is beneficial to resilience up to a point, after which increased embeddedness is detrimental to the capacity of a place to avoid or overcome a shock. This means that the right amount of embeddedness can assist a region to mitigate the negative effects of a downturn and hence contribute to its resilience.
This is in accordance with our hypothesis and theorisation. Embedded systems seem to enjoy the positive externalities of complexity that are geographically constrained. Simultaneously, more embedded systems also have the negative effects of lock-in. At the inflexion point, these negative effects become greater, and the total impact of embeddedness on resilience becomes negative.
The strongest policy implication of these results is that local governments should aim to better understand the actual level of embeddedness in their areas. Then, they should attempt to influence it in order to maximise the resilience capacity of their locality. Our research highlights the importance of embeddedness for resilience by proxying it using the best data that are currently available. However, local deep dives clarify relationships and highlight specific action points. It is also worth noting that the above is only one measure in a suite of tools policymakers may use to improve resilience in their areas. These other tools are related to drivers of resilience such as human capital and diversification that have previously been identified [1,27,35].
The paper is subject to limitations that open avenues for further research. The notion of embeddedness examined here looks only into the input relationships in a local economy, paying scant attention to the historical patterns of embeddedness or the role of local competitive conditions. Future alternative measures could reflect embeddedness by taking into account forward links (e.g., output relationships) or a combination of the two. In addition, the expansion of the panel with data from other NUTS2 regions and/or time periods will assist us in validating and generalising the findings beyond UK regions.

6. Conclusions

This paper examines the role of local economic embeddedness on regional resilience. The 2008 crisis prompted a breadth of research on why some places perform better than others during a downturn. This literature identified important drivers of resilience such as the supply of skills, agency, and other socio-economic characteristics [1,20,66], but gaps still remain on the effects of industrial structures and, in particular, their qualitative characteristics on the resilience performance of local economies.
We contribute to the recent stream of literature of regional resilience [2,6,31] by using the concept of external economies of complexity [7] in order to understand how the embeddedness of a local economic system can improve resilience in an area. We suggest that the external economies of complexity can decrease the unit cost and as such increase the resilience of local firms. However, at the same time, we expect that too-embedded systems may suffer from lock-in effects that would be detrimental to economic resilience.
To reflect embeddedness, we devise a measure that uses a novel dataset. The EUREGIO provides insight into the input–output relationships among sectors in UK NUTS2 regions and hence allows us to approximate the degree to which the inputs in a region come from within the region. We then test the effect of embeddedness and its squared term on employment growth and further examine this relationship during negative employment growth conditions using fixed-effects panel regressions. In this way, we draw significant conclusions on the relationship between embeddedness and resilience.
The results support our hypothesis. We find that embeddedness has a positive effect on employment growth when employment growth is negative (downturn period), whilst the negative coefficients on the squared term suggest that this is an inverted U-shaped relationship. This means that embeddedness improves resilience up to a point, after which more embedded systems tend to have worse resilience performance. Recession seems to accentuate this non-linear effect.

Author Contributions

Conceptualization, A.K., A.C.-I., and R.O.-A.; methodology, A.K., A.C.-I., and R.O.-A.; software, A.K., A.C.-I.; validation, A.K., A.C.-I., and R.O.-A.; formal analysis, A.K., A.C.-I., and R.O.-A.; investigation, A.K., A.C.-I., and R.O.-A.; resources, A.K., A.C.-I.; data curation, A.K., A.C.-I.; writing—original draft preparation, A.K., A.C.-I.; writing—review and editing, A.K., A.C.-I., and R.O.-A.; supervision, R.O.-A.; project administration, A.K.

Funding

“Kitsos’ contribution was funded by the Economic and Social Research Council, grant number ES/S011226/1”.

Acknowledgments

The authors would like to thank participants of the City-REDI seminars and the Regional Studies Association 2019 conference for useful comments and suggestions. All errors and omissions remain the responsibility of the authors.

Conflicts of Interest

The authors declare no conflict of interest.

Appendix A

Table A1. Sustainable development goals related to resilience.
Goal nr.Short descriptionResilience as…
1No Povertycapacity to shield local populations from the effects of a crisis
3Good Health and Well-beingability to ensure health and well-being is not negatively affected by a shock
4Quality Educationa direct outcome of quality education
8Decent Work and Economic Growtha catalyst for decent work and economic growth
9Industry, Innovation, and Infrastructurean enabler of continuous investment in innovation and infrastructure
10Reduced Inequalitiesa facilitator to reduce inequalities
11Sustainable Cities and Communitiesa contributor to sustainable cities and communities
12Responsible Production and Consumptiona framework for responsible production and consumption
17Partnership for Goalsan example of multi-stakeholder endeavour
Source: Authors’ elaboration.
Table A2. The effect of manufacturing embeddedness on resilience during shocks.
(1)(2)(3)(4)(5)(6)(7)
Emb_man−0.0418
(0.0767)
0.0920
(0.228)
0.361
(0.277)
0.279
(0.317)
0.0360
(0.532)
−0.0285
(0.541)
−0.0285
(0.541)
Crisis−0.0611 ***
(0.0163)
−0.0848 ***
(0.0196)
−0.0840 ***
(0.0198)
−0.0837 ***
(0.0202)
−0.0833 ***
(0.0204)
−0.0827 ***
(0.0207)
−0.0827 ***
(0.0207)
Crisis#Emb_man0.295 *
(0.153)
1.037 **
(0.391)
1.083 **
(0.391)
1.095 **
(0.402)
1.092 **
(0.406)
1.063 **
(0.415)
1.064 **
(0.415)
Emb_man_sqr −0.108
(1.017)
−0.741
(1.058)
−0.451
(1.191)
0.242
(1.834)
0.368
(1.858)
0.368
(1.861)
Crisis#Emb_man_sqr −4.537 **
(1.848)
−4.800 **
(1.864)
−4.899 **
(1.922)
−4.916 **
(1.955)
−4.747 **
(2.002)
−4.747 **
(1.999)
FB_Pop 0.00565 **
(0.00194)
0.00541 **
(0.00206)
0.00593 **
(0.00188)
0.00583 ***
(0.00177)
0.00583 ***
(0.00174)
Growth 0.0321
(0.0240)
0.0199
(0.0261)
0.0180
(0.0260)
0.0179
(0.0248)
NVQ4+ −0.000921
(0.00103)
0.00000042
(0.00125)
0.00000194
(0.00138)
NO_NVQ 0.00177 **
(0.000744)
0.00176 **
(0.000722)
Pop_den −0.000345
(0.0564)
Constant0.0225 **
(0.00764)
0.0115
(0.0114)
−0.0278
(0.0220)
−0.0237
(0.0241)
0.0137
(0.0585)
−0.0301
(0.0663)
−0.0282
(0.312)
Observations396396396396396396396
N_g36363636363636
sigma_e0.02340.02320.02290.02290.02290.02290.0229
sigma_u0.006200.009770.01680.01550.01210.01070.0104
rho0.06560.1510.3490.3130.2180.1790.171
* p < 0.10, ** p < 0.05, *** p < 0.01. Fixed-effects regressions with robust standard errors in parentheses. The dependent variable is employment growth. The independent variables include the embeddedness of manufacturing and its squared term interacted with the crisis dummy variable as well as entrepreneurship, economic growth, human capital, and population density.
Table A3. The effect of services embeddedness on resilience during shocks.
(1)(2)(3)(4)(5)(6)(7)
Emb_ser−0.0545
(0.0399)
0.197
(0.164)
0.100
(0.212)
0.0864
(0.213)
0.160
(0.238)
0.270
(0.226)
0.271
(0.229)
Crisis−0.0706 ***
(0.0148)
−0.0938 ***
(0.0119)
−0.0935 ***
(0.0130)
−0.0927 ***
(0.0141)
−0.0919 ***
(0.0134)
−0.0914 ***
(0.0129)
−0.0914 ***
(0.0129)
Crisis#Emb_ser0.110 **
(0.0389)
0.294 ***
(0.0568)
0.301 ***
(0.0628)
0.304 ***
(0.0695)
0.302 ***
(0.0661)
0.295 ***
(0.0652)
0.295 ***
(0.0657)
Emb_ser_sqr −0.352
(0.217)
−0.362
(0.226)
−0.317
(0.223)
−0.296
(0.249)
−0.391
(0.232)
−0.398
(0.241)
Crisis#Emb_ser_sqr −0.312 ***
(0.0737)
−0.325 ***
(0.0839)
−0.325 ***
(0.0931)
−0.323 ***
(0.0885)
−0.313 ***
(0.0882)
−0.314 ***
(0.0906)
FB_Pop 0.00415 **
(0.00185)
0.00411 *
(0.00185)
0.00557 **
(0.00180)
0.00547 ***
(0.00165)
0.00540 ***
(0.00168)
Growth 0.0738 ***
(0.0218)
0.0352
(0.0269)
0.0291
(0.0293)
0.0315
(0.0255)
NVQ4+ −0.00120 **
(0.000462)
0.0000242
(0.000810)
−0.000109
(0.00114)
NO_NVQ 0.00218 **
(0.000964)
0.00221 **
(0.000914)
Pop_den 0.0263
(0.0755)
Constant0.0366 **
(0.0132)
−0.00202
(0.0287)
0.0152
(0.0377)
0.0110
(0.0380)
0.0116
(0.0399)
−0.0747
(0.0622)
−0.224
(0.427)
Observations396396396396396396396
N_g36363636363636
sigma_e0.02330.02320.02300.02300.02290.02280.0228
sigma_u0.007130.01630.02050.01790.01580.01750.0438
rho0.08560.3310.4420.3790.3240.3700.787
* p < 0.10, ** p < 0.05, *** p < 0.01. Fixed-effects regressions with robust standard errors in parentheses. The dependent variable is employment growth. The independent variables include the embeddedness of services and its squared term interacted with the crisis dummy variable as well as entrepreneurship, economic growth, human capital, and population density.
Table A4. The effect of agriculture embeddedness on resilience during shocks.
(1)(2)(3)(4)(5)(6)(7)
Emb_agr0.721
(0.943)
3.480
(1.949)
4.687 **
(1.886)
4.668 **
(1.829)
3.902 *
(1.997)
3.912 *
(1.973)
3.837 *
(2.008)
Crisis−0.0362 ***
(0.00761)
−0.0367 ***
(0.00594)
−0.0366 ***
(0.00599)
−0.0347 ***
(0.00702)
−0.0343 ***
(0.00692)
−0.0347 ***
(0.00657)
−0.0346 ***
(0.00645)
Crisis#Emb_agr0.0299
(0.398)
0.129
(0.776)
0.266
(0.759)
0.201
(0.667)
0.237
(0.770)
0.349
(0.802)
0.307
(0.830)
Emb_agr_sqr −130.6
(115.1)
−136.9
(114.4)
−125.3
(115.3)
−96.83
(114.9)
−116.2
(121.6)
−107.2
(120.7)
Crisis#Emb_agr_sqr −2.517
(52.18)
−8.897
(52.31)
−6.435
(45.28)
−3.031
(49.52)
−12.13
(53.23)
−10.56
(55.44)
FB_Pop 0.00375 **
(0.00133)
0.00394 **
(0.00137)
0.00613 ***
(0.00157)
0.00599 ***
(0.00143)
0.00587 ***
(0.00150)
Growth 0.0720 *
(0.0347)
0.0279
(0.0434)
0.0232
(0.0440)
0.0278
(0.0368)
NVQ4+ −0.00125 ***
(0.000347)
−0.0000216
(0.000710)
−0.000290
(0.00118)
NO_NVQ 0.00201 **
(0.000719)
0.00205 **
(0.000653)
Pop_den 0.0468
(0.0984)
Constant0.0142 **
(0.00569)
0.00517
(0.00482)
−0.0162 *
(0.00878)
−0.0208 *
(0.0106)
0.00806
(0.0173)
−0.0502
(0.0318)
−0.315
(0.533)
Observations396396396396396396396
N_g36363636363636
sigma_e0.02400.02400.02390.02390.02370.02370.0237
sigma_u0.007080.01020.01540.01610.01610.01220.0618
rho0.08010.1520.2920.3120.3150.2100.872
* p < 0.10, ** p < 0.05, *** p < 0.01. Fixed-effects regressions with robust standard errors in parentheses. The dependent variable is employment growth. The independent variables include the embeddedness of agriculture and its squared term interacted with the crisis dummy variable as well as entrepreneurship, economic growth, human capital, and population density.
Table A5. The effect of construction embeddedness on resilience during shocks.
(1)(2)(3)(4)(5)(6)(7)
Emb_con0.440
(0.324)
1.370
(0.971)
1.086
(0.828)
0.806
(0.951)
0.900
(1.138)
0.773
(1.035)
0.755
(1.029)
Crisis−0.0730 ***
(0.0202)
−0.101 ***
(0.0202)
−0.101 ***
(0.0208)
−0.101 ***
(0.0220)
−0.0994 ***
(0.0220)
−0.0992 ***
(0.0216)
−0.0994 ***
(0.0218)
Crisis#Emb_con0.863 *
(0.394)
2.695 ***
(0.702)
2.708 ***
(0.717)
2.803 ***
(0.767)
2.749 ***
(0.758)
2.747 ***
(0.742)
2.761 ***
(0.758)
Emb_con_sqr −7.774
(10.55)
−6.244
(9.495)
−4.600
(10.26)
−5.262
(11.73)
−4.094
(10.87)
−3.717
(10.97)
Crisis#Emb_con_sqr −25.14 ***
(6.947)
−25.37 ***
(6.874)
−26.67 ***
(7.407)
−25.87 ***
(7.157)
−26.06 ***
(7.032)
−26.31 ***
(7.298)
FB_Pop 0.00255 *
(0.00134)
0.00276 *
(0.00131)
0.00507 **
(0.00171)
0.00513 ***
(0.00152)
0.00498 ***
(0.00155)
Growth 0.0700 ***
(0.0213)
0.0227
(0.0237)
0.0198
(0.0260)
0.0236
(0.0228)
NVQ4+ −0.00131 ***
(0.000301)
−0.000175
(0.000718)
−0.000412
(0.00111)
NO_NVQ 0.00188 **
(0.000790)
0.00194 **
(0.000695)
Pop_den 0.0443
(0.0906)
Constant−0.000410
(0.0145)
−0.0249
(0.0229)
−0.0252
(0.0209)
−0.0203
(0.0243)
0.00402
(0.0309)
−0.0489
(0.0459)
−0.300
(0.484)
Observations396396396396396396396
N_g36363636363636
sigma_e0.02340.02330.02330.02320.02310.02300.0231
sigma_u0.01130.01630.01480.01310.01560.01420.0671
rho0.1890.3270.2880.2400.3120.2760.894
* p < 0.10, ** p < 0.05, *** p < 0.01. Fixed-effects regressions with robust standard errors in parentheses. The dependent variable is employment growth. The independent variables include the embeddedness of construction and its squared term interacted with the crisis dummy variable as well as entrepreneurship, economic growth, human capital, and population density.
Table A6. UK regions included in EUREGIO.
Region NumberCodeRegion Name
R220UKC1Tees Valley and Durham
R221UKC2Northumberland Tyne and Wear
R222UKD1Cumbria
R223UKD2Cheshire
R224UKD3Greater Manchester
R225UKD4Lancashire
R226UKD5Merseyside
R227UKE1East Riding and North Lincolnshire
R228UKE2North Yorkshire
R229UKE3South Yorkshire
R230UKE4West Yorkshire
R231UKF1Derbyshire and Nottinghamshire
R232UKF2Leicestershire Rutland and Northants
R233UKF3Lincolnshire
R234UKG1Herefordshire Worcestershire and Warks
R235UKG2Shropshire and Staffordshire
R236UKG3West Midlands
R237UKH1East Anglia
R238UKH2Bedfordshire Hertfordshire
R239UKH3Essex
R240UKI1Inner London
R241UKI2Outer London
R242UKJ1Berkshire Bucks and Oxfordshire
R243UKJ2Surrey East and West Sussex
R244UKJ3Hampshireand Isle of Wight
R245UKJ4Kent
R246UKK1Gloucestershire Wiltshire and North Somerset
R247UKK2Dorset and Somerset
R248UKK3Cornwall and Isles of Scilly
R249UKK4Devon
R250UKL1West Wales and The Valleys
R251UKL2East Wales
R252UKM2North Eastern Scotland
R253UKM3Eastern Scotland
R254UKM5South Western Scotland
R255UKM6Highlands and Islands
R256UKN0Northern Ireland
Table A7. Sectors included in EUREGIO.
CodeSector Name
ss1Agriculture
ss2Mining quarrying and energy supply
ss3Food beverages and tobacco
ss4Textiles and leather, etc.
ss5Coke, refined petroleum, nuclear fuel, and chemicals, etc.
ss6Electrical and optical equipment and Transport equipment
ss8Other manufacturing
ss9Construction
ss10Distribution
ss11Hotels and restaurant
ss12Transport storage and communication
ss13Financial intermediation
ss14Real estate, renting and business activities
ss15Non-Market services
Table A8. Correlation matrix of the explanatory variables used in the analysis.
EmbEmb_sqrEmb_manEmb_man_sqrEmb_agrEmb_agr_sqrEmb_conEmb_con_sqrEmb_serEmb_ser_sqrCrisisFB_PopGrowthNVQ4+NO_NVQPop_den
Emb1
Emb_sqr0.961
Emb_man0.430.261
Emb_man_sqr0.30.160.961
Emb_agr0.09−0.040.540.51
Emb_agr_sqr0.06−0.040.410.380.951
Emb_con0.720.580.510.330.280.181
Emb_con_sqr0.660.570.390.220.20.120.971
Emb_ser0.940.970.130.01−0.13−0.120.560.541
Emb_ser_sqr0.820.93−0.08−0.15−0.25−0.20.330.350.951
Crisis−0.04−0.07−0.02−0.040.060.040.030.02−0.05−0.081
FB_Pop0.490.58−0.11−0.13−0.04−0.040.090.10.590.67−0.151
Growth0.030.050.090.12−0.01−0.02−0.02−0.010.010.03−0.360.071
NVQ4+0.060.22−0.52−0.48−0.24−0.2−0.28−0.240.260.420.020.6−0.131
NO_NVQ−0.09−0.140.060.05−0.3−0.23−0.05−0.09−0.09−0.12−0.06−0.390.15−0.631
Pop_den0.720.730.06−0.04−0.43−0.370.410.390.80.76−0.050.37−0.020.060.31

References

  1. Kitsos, A.; Bishop, P. Economic resilience in Great Britain: The crisis impact and its determining factors for local authority districts. Ann. Reg. Sci. 2018, 60, 329–347. [Google Scholar] [CrossRef]
  2. Martin, R.; Gardiner, B. The resilience of cities to economic shocks: A tale of four recessions (and the challenge of Brexit). Pap. Reg. Sci. 2019, 1–32. [Google Scholar] [CrossRef]
  3. Modica, M.; Reggiani, A. Spatial Economic Resilience: Overview and Perspectives. Netw. Spat. Econ. 2014, 5, 211–233. [Google Scholar] [CrossRef]
  4. West Midlands Combined Authority. West Midlands Local Industrial Strategy; Strategy, Ministry of Housing, Communities & Local Government and Department for Business, Energy & Industrial Strategy: London, UK, 2019; p. 84. [Google Scholar]
  5. Fratesi, U.; Rodríguez-Pose, A. The crisis and regional employment in Europe: What role for sheltered economies? Camb. J. Reg. Econ. Soc. 2016, 9, 33–57. [Google Scholar] [CrossRef]
  6. Rocchetta, S.; Mina, A. Technological coherence and the adaptive resilience of regional economies. Reg. Stud. 2019, 1–14. [Google Scholar] [CrossRef]
  7. Parr, J.B.; Hewings, G.J.D.; Sohn, J.; Nazara, S. Agglomeration and Trade: Some Additional Perspectives. Reg. Stud. 2002, 36, 675–684. [Google Scholar] [CrossRef]
  8. Boschma, R.; Iammarino, S. Related Variety, Trade Linkages, and Regional Growth in Italy. Econ. Geogr. 2009, 85, 289–311. [Google Scholar] [CrossRef]
  9. Grabher, G. The Embedded Firm; Routledge: London, UK, 1993. [Google Scholar]
  10. Holling, C.S. Resilience and Stability of Ecological Systems. Annu. Rev. Ecol. Syst. 1973, 4, 1–23. [Google Scholar] [CrossRef] [Green Version]
  11. Noy, I.; Yonson, R. Economic Vulnerability and Resilience to Natural Hazards: A Survey of Concepts and Measurements. Sustainability 2018, 10, 2850. [Google Scholar] [CrossRef]
  12. Evenhuis, E. New directions in researching regional economic resilience and adaptation. Geogr. Compass 2017, 11, e12333. [Google Scholar] [CrossRef]
  13. Faggian, A.; Gemmiti, R.; Jaquet, T.; Santini, I. Regional economic resilience: The experience of the Italian local labor systems. Ann. Reg. Sci. 2018, 60, 393–410. [Google Scholar] [CrossRef]
  14. Martin, R.; Sunley, P. On the notion of regional economic resilience: Conceptualization and explanation. J. Econ. Geogr. 2014, 15, 1–42. [Google Scholar] [CrossRef]
  15. Kitsos, A. Economic resilience in Great Britain: an examination of the determinants of the 2008 crisis impact on GB’s local authority districts. Ph.D. Thesis, University of Plymouth, Plymouth, UK, 2018. [Google Scholar]
  16. Hill, E.; Clair, T.; Wial, H.; Wolman, H.; Atkins, P.; Blumenthal, P.; Ficenec, S.; Fiedhoff, A. Economic shocks and regional economic resilience. In Urban and Regional Policy and Its Effects: Building Resilient Regions; Brookings Institution Press: Washington, DC, USA, 2012; pp. 20–21. [Google Scholar]
  17. Reggiani, A.; De Graaff, T.; Nijkamp, P. Resilience: An Evolutionary Approach to Spatial Economic Systems. Netw. Spat. Econ. 2002, 2, 211–229. [Google Scholar] [CrossRef]
  18. Martin, R. Regional economic resilience, hysteresis and recessionary shocks. J. Econ. Geogr. 2012, 12, 1–32. [Google Scholar] [CrossRef]
  19. Cross, R.; Grinfeld, M.; Lamba, H. Hysteresis and economics. Control Syst. IEEE 2009, 29, 30–43. [Google Scholar] [CrossRef] [Green Version]
  20. Bristow, G.; Healy, A. Regional Resilience: An Agency Perspective. Reg. Stud. 2013, 48, 923–935. [Google Scholar] [CrossRef]
  21. Bristow, G.; Healy, A. Crisis response, choice and resilience: Insights from complexity thinking. Camb. J. Reg. Econ. Soc. 2015, 8, 241–256. [Google Scholar] [CrossRef]
  22. Sensier, M.; Bristow, G.; Healy, A. Measuring Regional Economic Resilience across Europe: Operationalizing a complex concept. Spat. Econ. Anal. 2016, 11, 128–151. [Google Scholar] [CrossRef]
  23. Psycharis, Y.; Kallioras, D.; Pantazis, P. Economic crisis and regional resilience: Detecting the ‘geographical footprint’ of economic crisis in Greece. Reg. Sci. Policy Pract. 2014, 6, 121–141. [Google Scholar] [CrossRef]
  24. Pontarollo, N.; Serpieri, C. A composite policy tool to measure territorial resilience capacity. Socio-Econ. Plan. Sci. 2018. [Google Scholar] [CrossRef]
  25. Yu, H.; Liu, Y.; Liu, C.; Fan, F. Spatiotemporal Variation and Inequality in China’s Economic Resilience across Cities and Urban Agglomerations. Sustainability 2018, 10, 4754. [Google Scholar] [CrossRef]
  26. Giovannini, E.; Nardo, M.; Saisana, M.; Saltelli, A.; Tarantola, A.; Hoffman, A. Handbook on Constructing Composite Indicators: Methodology and User Guide; OECD: Paris, France, 2008. [Google Scholar]
  27. Lee, N. Grim down South? The Determinants of Unemployment Increases in British Cities in the 2008–2009 Recession. Reg. Stud. 2014, 48, 1761–1778. [Google Scholar] [CrossRef]
  28. Clayton, N. The spatial impacts of the recession. In The Recession and beyond: Local and Regional Responses to the Downturn; Bailey, D., Chapain, C., Eds.; Routledge: New York, NY, USA, 2011; pp. 27–44. [Google Scholar]
  29. Brinkley, I.; Clayton, N.; Coats, D.; Hutton, W.; Overell, S. Hard Labour: Jobs, Unemployment and the Recession; Work Foundation: London, UK, 2008. [Google Scholar]
  30. Bell, D.N.F.; Blanchflower, D.G. UK Unemployment in the Great Recession. Natl. Inst. Econ. Rev. 2010, 214, R3–R25. [Google Scholar] [CrossRef] [Green Version]
  31. Martin, R.; Sunley, P.; Gardiner, B.; Tyler, P. How Regions React to Recessions: Resilience and the Role of Economic Structure. Reg. Stud. 2016, 50, 561–585. [Google Scholar] [CrossRef] [Green Version]
  32. Fratesi, U.; Perucca, G. Territorial capital and the resilience of European regions. Ann. Reg. Sci. 2018, 60, 241–264. [Google Scholar] [CrossRef]
  33. Urso, G.; Modica, M.; Faggian, A. Resilience and Sectoral Composition Change of Italian Inner Areas in Response to the Great Recession. Sustainability 2019, 11, 2679. [Google Scholar] [CrossRef]
  34. Holtermann, L.; Hundt, C. Hierarchically Structured Determinants and Phaserelated Patterns of Economic Resilience: An Empirical Case Study for European Regions; Working Papers on Innovation and Space; EconStor: Kiel, Germany, 2018. [Google Scholar]
  35. Di Caro, P. Testing and explaining economic resilience with an application to Italian regions. Pap. Reg. Sci. 2017, 96, 93–113. [Google Scholar] [CrossRef]
  36. Doran, J.; Fingleton, B. Employment Resilience in Europe and the 2008 Economic Crisis: Insights from Micro-Level Data. Reg. Stud. 2016, 50, 644–656. [Google Scholar] [CrossRef]
  37. Acs, Z.; Armington, C. Employment Growth and Entrepreneurial Activity in Cities. Reg. Stud. 2004, 38, 911–927. [Google Scholar] [CrossRef] [Green Version]
  38. Doran, J.; McCarthy, N.; O’Connor, M. Entrepreneurship and employment growth across European regions. Reg. Stud. Reg. Sci. 2016, 3, 121–128. [Google Scholar] [CrossRef]
  39. Thompson, P.; Zang, W. The foreign business and domestic enterprise relationship: Its implications for local entrepreneurial resilience. Local Econ. 2018, 33, 10–39. [Google Scholar] [CrossRef] [Green Version]
  40. Bishop, P. Knowledge diversity and entrepreneurship following an economic crisis: An empirical study of regional resilience in Great Britain. Entrep. Reg. Dev. 2018, 31, 496–515. [Google Scholar] [CrossRef]
  41. Kacher, N.; Kitsos, A.; Petach, L.; Ortega-Argilés, R.; Weiler, S. Entrepreneurship and Resilience: Implications for Regional Development in the US and UK. In Proceedings of the North American Regional Science Association, 65th Annual Meeting, San Antonio, TX, USA, 7–10 November 2018. [Google Scholar]
  42. Klimek, P.; Poledna, S.; Thurner, S. Economic resilience from input-output susceptibility improves predictions of economic growth and recovery. arXiv 2019, arXiv:1903.03203. [Google Scholar] [CrossRef] [PubMed]
  43. ONS. The Impact of the Recession on the Labour Market; Office for National Statistics: Newport, UK, 2009. [Google Scholar]
  44. Bristow, G.I.; Healy, A.; Norris, L.; Wink, R.; Kafkalas, G.; Kakderi, C.; Espenberg, K.; Varblane, U.; Sepp, V.; Sagan, I.; et al. ECR2. In Economic Crisis: Regional Economic Resilience; ESPON: Brussels, Belgium, 2014; pp. 1–110. [Google Scholar]
  45. Bishop, P.; Gripaios, P. Spatial Externalities, Relatedness and Sector Employment Growth in Great Britain. Reg. Stud. 2010, 44, 443–454. [Google Scholar] [CrossRef]
  46. De Groot, H.L.; Poot, J.; Smit, M.J. Which Agglomeration Externalities Matter Most and Why? J. Econ. Surv. 2016, 30, 756–782. [Google Scholar] [CrossRef]
  47. Tan, J.; Lo, K.; Qiu, F.; Liu, W.; Li, J.; Zhang, P. Regional economic resilience: Resistance and recoverability of resource-based cities during economic crises in Northeast China. Sustainability 2017, 9, 2136. [Google Scholar] [CrossRef]
  48. Di Caro, P. Recessions, recoveries and regional resilience: Evidence on Italy. Camb. J. Reg. Econ. Soc. 2015, 8, 273–291. [Google Scholar] [CrossRef]
  49. Li, L.; Zhang, P.; Li, X. Regional Economic Resilience of the Old Industrial Bases in China—A Case Study of Liaoning Province. Sustainability 2019, 11, 723. [Google Scholar] [CrossRef]
  50. Parr, J.B. Agglomeration Economies: Ambiguities and Confusions. Environ. Plan. A Econ. Space 2002, 34, 717–731. [Google Scholar] [CrossRef] [Green Version]
  51. Ohlin, B. Interregional and International Trade; Harvard University Press: Cambridge, MA, USA, 1933. [Google Scholar]
  52. Isard, W. Location and Space-Economy; The Technology Press of Massachusetts Institute of Technology: Cambridge, MA, USA, 1956. [Google Scholar]
  53. Robinson, E. The Structure of Competitive Industry; Cambridge University Press: Cambridge, MA, USA, 1958. [Google Scholar]
  54. Parr, J.B. Missing Elements in the Analysis of Agglomeration Economies. Int. Reg. Sci. Rev. 2002, 25, 151–168. [Google Scholar] [CrossRef]
  55. McCann, P. Rethinking the Economics of Location and Agglomeration. Urban Stud. 1995, 32, 563–577. [Google Scholar] [CrossRef]
  56. Hess, M. ‘Spatial’ relationships? Towards a reconceptualization of embeddedness. Prog. Hum. Geogr. 2004, 28, 165–186. [Google Scholar] [CrossRef]
  57. Hess, M.; Coe, N.M. Making Connections: Global Production Networks, Standards, and Embeddedness in the Mobile-Telecommunications Industry. Environ. Plan. A Econ. Space 2006, 38, 1205–1227. [Google Scholar] [CrossRef]
  58. Amin, A.; Thrift, N. Neo-Marshallian nodes in global networks. Int. J. Urban Reg. Res. 1992, 16, 571–587. [Google Scholar] [CrossRef]
  59. Lagravinese, R. Economic crisis and rising gaps North–South: Evidence from the Italian regions. Camb. J. Reg. Econ. Soc. 2015, 8, 331–342. [Google Scholar] [CrossRef]
  60. Conroy, M.E. Regional Economic Diversification; Praeger: New York, NY, USA, 1975. [Google Scholar]
  61. Miller, R.E.; Blair, P.D. Input-output Analysis: Foundations and Extensions; Cambridge University Press: Cambridge, UK, 2009. [Google Scholar]
  62. Los, B.; Timmer, M.P.; de Vries, G.J. How Global are Global Value Chains? A New Approach to Measure International Fragmentation. J. Reg. Sci. 2015, 55, 66–92. [Google Scholar] [CrossRef]
  63. Chen, W.; Los, B.; McCann, P.; Ortega-Argilés, R.; Thissen, M.; van Oort, F. The continental divide? Economic exposure to Brexit in regions and countries on both sides of The Channel. Pap. Reg. Sci. 2018, 97, 25–54. [Google Scholar] [CrossRef]
  64. Thissen, M.; Lankhuizen, M.; van Oort, F.; Los, B.; Diodato, D. EUREGIO: The Construction of a Global IO Database with Regional Detail for Europe for 2000–2010; Tinbergen Institute Discussion Paper; No. TI 2018-084/VI; Tinbergen Institute: Amsterdam, The Netherlands, 2018. [Google Scholar]
  65. Timmer, M.P.; Dietzenbacher, E.; Los, B.; Stehrer, R.; de Vries, G.J. An Illustrated User Guide to the World Input–Output Database: The Case of Global Automotive Production. Rev. Int. Econ. 2015, 23, 575–605. [Google Scholar] [CrossRef]
  66. Simmie, J.; Martin, R. The economic resilience of regions: Towards an evolutionary approach. Camb. J. Reg. Econ. Soc. 2010, 3, 27–43. [Google Scholar] [CrossRef]
Figure 1. Categorisation of agglomeration economies according to Parr and Parr et al. [7,50,54].
Sustainability 11 03800 g001
Figure 2. Representation of a multiregional input–output framework.
Sustainability 11 03800 g002
Table 1. Understandings of resilience.
PerspectiveMeaningMeasurement
Resilience of ecosystems (Engineering resilience)Movement back to equilibrium (Single equilibrium approach)Speed or amount of force counterbalanced
Ecology (Ecological resilience)Movement to new equilibrium point or stability domain (multiple equilibria with adaptation perspectives)Amount of force sustained until change of structural characteristics
Resilience as a dynamic processAdaptation to continuously changing environmentsCapacity to adapt and create new development paths
Source: Kitsos (2018) [15].
Table 2. Descriptive statistics of the explanatory variables.
VariableObs.MeanStd. Dev.MinMax
Emb3960.4870.1520.0560.811
Emb_sqr3960.2600.1330.0030.658
Emb_man3960.0870.0390.0060.172
Emb_man_sqr3960.0090.0070.0000.030
Emb_agr3960.0070.0050.0000.023
Emb_agr_sqr3960.0000.0000.0000.001
Emb_con3960.0430.0130.0070.069
Emb_con_sqr3960.0020.0010.0000.005
Emb_ser3960.3280.1290.0310.751
Emb_ser_sqr3960.1240.0970.0010.564
Crisis3960.3280.4700.0001.000
FB_Pop3963.6561.2151.56210.218
Growth3960.0380.030−0.0570.119
NVQ4+39625.9665.25117.30048.400
NO_NVQ39614.1403.5377.40023.600
Pop_den3965.8041.2582.1979.207
The independent variables include our embeddedness measure Emb and its square term Emb_sqr as well as their sectoral equivalents for manufacturing (Emb_man and Emb_man_sqr), agriculture (Emb_agr and Emb_agr_sqr), construction (Emb_con and Emb_con_sqr) and services (Emb_ser and Emb_ser_sqr). They also include a Crisis dummy variable as well as entrepreneurship FB_pop, economic growth Growth, human capital NVQ4+ and NO_NVQ and population density Pop_den.
Table 3. The effect of embeddedness on employment growth during 2000–2010.
(1)(2)(3)(4)(5)(6)(7)
Emb0.552
(0.602)
0.575 **
(0.235)
0.561 **
(0.218)
0.539 **
(0.211)
0.504 **
(0.218)
0.464 *
(0.224)
0.455 **
(0.204)
Emb_sqr−0.229
(0.563)
−0.491 *
(0.253)
−0.437
(0.243)
−0.463 *
(0.231)
−0.500 *
(0.262)
−0.462
(0.276)
−0.445 *
(0.242)
Crisis −0.0355 ***
(0.00527)
−0.0346 ***
(0.00563)
−0.0335 ***
(0.00589)
−0.0328 ***
(0.00580)
−0.0331 ***
(0.00579)
−0.0331 ***
(0.00587)
FB_pop 0.00329 *
(0.00150)
0.00320 *
(0.00151)
0.00530 ***
(0.00161)
0.00535 ***
(0.00143)
0.00525 ***
(0.00147)
Growth 0.0587 **
(0.0238)
0.0238
(0.0334)
0.0203
(0.0344)
0.0224
(0.0305)
NVQ4+ −0.00131 **
(0.000477)
−0.000107
(0.000881)
−0.000264
(0.00122)
NO_NVQ 0.00200 **
(0.000734)
0.00204 **
(0.000663)
Pop_den 0.0318
(0.0860)
Constant−0.202
(0.148)
−0.133 **
(0.0521)
−0.153 ***
(0.0460)
−0.138 **
(0.0449)
−0.0837 *
(0.0396)
−0.134 **
(0.0506)
−0.314
(0.487)
Observations396396396396396396396
N_g36363636363636
sigma_e0.02920.02390.02380.02380.02370.02360.0237
sigma_u0.05740.03310.03720.03170.02770.02450.0571
Rho0.7950.6570.7090.6400.5770.5180.853
* p < 0.10, ** p < 0.05, *** p < 0.01. Fixed-effects regressions with robust standard errors in parentheses. The dependent variable is employment growth. The independent variables include our embeddedness measure Emb and its square term Emb_sqr, a Crisis dummy variable as well as entrepreneurship FB_pop, economic growth Growth, human capital NVQ4+ and NO_NVQ and population density Pop_den.
Table 4. The effect of embeddedness on resilience during shocks.
(1)(2)(3)(4)(5)(6)(7)
Emb0.0919
(0.0587)
0.424 ***
(0.123)
0.407 **
(0.135)
0.384 **
(0.161)
0.355 *
(0.181)
0.319
(0.195)
0.317
(0.195)
Crisis−0.0805 ***
(0.0138)
−0.0938 ***
(0.0121)
−0.0932 ***
(0.0129)
−0.0929 ***
(0.0139)
−0.0921 ***
(0.0141)
−0.0916 ***
(0.0141)
−0.0916 ***
(0.0142)
Crisis#Emb0.0952 ***
(0.0248)
0.182 ***
(0.0383)
0.183 ***
(0.0423)
0.188 ***
(0.0466)
0.190 ***
(0.0473)
0.187 ***
(0.0485)
0.187 ***
(0.0496)
Emb_sqr −0.327 ***
(0.100)
−0.266 **
(0.103)
−0.292 **
(0.121)
−0.327 **
(0.146)
−0.293
(0.162)
−0.290 *
(0.155)
Crisis#Emb_sqr −0.115 **
(0.0370)
−0.113 **
(0.0424)
−0.120 **
(0.0468)
−0.126 **
(0.0478)
−0.122 **
(0.0502)
−0.122 **
(0.0523)
FB_Pop 0.00361 **
(0.00130)
0.00352 **
(0.00132)
0.00538 ***
(0.00163)
0.00544 ***
(0.00148)
0.00542 ***
(0.00148)
Growth 0.0607 **
(0.0206)
0.0295
(0.0218)
0.0262
(0.0228)
0.0266
(0.0208)
NVQ4+ −0.00117 **
(0.000499)
−0.0000524
(0.000993)
−0.0000818
(0.00126)
NO_NVQ 0.00186 *
(0.000846)
0.00187 **
(0.000797)
Pop_den 0.00593
(0.0787)
Constant−0.0261
(0.0289)
−0.103 **
(0.0375)
−0.124 **
(0.0433)
−0.108 *
(0.0510)
−0.0602
(0.0621)
−0.107
(0.0836)
−0.141
(0.428)
Observations396396396396396396396
N_g36363636363636
sigma_e0.02310.02310.02300.02290.02290.02280.0228
sigma_u0.02010.03240.03780.03160.02650.02390.0292
rho0.4300.6630.7300.6560.5740.5230.621
* p < 0.10, ** p < 0.05, *** p < 0.01. Fixed-effects regressions with robust standard errors in parentheses. The dependent variable is employment growth. The independent variables include our embeddedness measure and its squared term interacted with the crisis dummy variable as well as entrepreneurship, economic growth, human capital, and population density.

