Abstract
The aging population in China highlights the significance of elderly long-term care (LTC) services. The number of people aged 65 and above increased from 96 million in 2003 to 150 million in 2016, some of whom were disabled due to chronic diseases or the natural effects of aging on bodily functions. Therefore, the measurement of future LTC costs is of crucial value. Following the basic framework but using different empirical methods from those presented in previous literature, this paper attempts to use the Bayesian quantile regression (BQR) method, which has many advantages over traditional linear regression. Another innovation consists of setting and measuring the high, middle, and low levels of LTC cost prediction for each disability state among the elderly in 2020–2050. Our projections suggest that by 2020, LTC costs will increase to median values of 39.46, 8.98, and 20.25 billion dollars for mild, moderate, and severe disabilities, respectively; these numbers will reach 141.7, 32.28, and 72.78 billion dollars by 2050. The median level of daily life care for mild, moderate, and severe disabilities will increase to 26.23, 6.36, and 27 billion dollars. Our results showed that future LTC cost increases will be enormous, and therefore, the establishment of a reasonable individual-social-government payment mechanism is necessary for the LTC system. The future design of an LTCI system must take into account a variety of factors, including the future elderly population, different care conditions, the financial burden of the government, etc., in order to maintain the sustainable development of the LTC system.
1. Introduction
The topics of long-term care (LTC) and associated costs are attracting more attention from academia and governments; it is believed that an aging population will significantly increase demands for LTC and will generate significant public expenditure due to increasing disability trends [1]. One of the core issues to be addressed is how LTC demand and its costs will grow in the future. LTC is for people who are at a stage when they rely on others, i.e., from society or the medical system [2]. LTC is usually associated with the disabled elderly, but in fact, it also applies to people of any age, regardless of the cause of the disability, e.g., traffic accident, mental illness, or congenital illness. This paper focuses on the disabled elderly because they represent the greatest demand for LTC; it attempts to find out how demand for LTC will evolve, and then analyzes the sustainability of LTC systems such as LTC insurance (LTCI) according to the health status of the elderly and economic development in the future.
1.1. Long-Term Care System in China and Other Countries
Germany, Japan, Sweden, and other Western countries successively introduced LTC insurance systems in the 1960s, which have succeeded in dealing with the aged LTC service cost crisis due to the aging of the population, although some difficulties remain.
In the UK, LTC is less dependent on public funds than in most other European countries. LTC services are financed by two different channels: the National Health Service (NHS) and local governments. The funding provided by local governments comes from government grants and local government taxes revenue. The funds were not earmarked, but recommendations and management objectives were made on how to use them and the expected level of service. In comparison, the NHS, funded mainly by income taxes, is responsible for funding some care homes and other care settings according to health-related standards [3].
In Japan, National Long-Term Care Insurance (LTCI) for the elderly was implemented in 2000 and is based on a detailed and formal assessment for LTC demands of each elderly person [4,5,6]. Under the assistance of a professional nursing manager, the applicant decides the care level according to the amount available; care beyond the fixed amount must be undertaken privately. In recent years, LTC costs have been continuously increasing, raising serious questions about the future viability of the LTCI system.
In Sweden, a tax-based LTC system was established in the 1970s. Under the Social Service Act, every city must provide help if the care demands of an individual cannot be satisfied by any other approach [7]. Of course, some factors such as family environment were taken into account in assessing the demands of the LTC system. The scope of LTC and the cost of providing it have been limited since a severe economic crisis in the 1990s. As a consequence, Sweden will face substantial sustainability problems in providing LTC in the future.
In China, as a result of accelerated industrialization and an aging population, the development of health services is unbalanced and inadequate, which highlights the urgency of the crisis in elderly care services. The number of people aged 65 and above increased from 96 million in 2003 to about 150 million in 2016, some of whom were disabled due to chronic diseases or the natural effects of aging on bodily functions. Therefore, the demand for LTC services among the disabled elderly is increasing rapidly, but unfortunately, the supply of LTC services, especially in terms of policymaking and fund collection, lags far behind. In recent years, the central government and some local governments have introduced a series of policies and measures, such as the pilot of LTC insurance (LTCI), to establish a comprehensive urban and rural old-age service system with individuals, families, communities, and old-age care institutions as the main body. In 2012, Qingdao took the lead in introducing LTCI covering people who were insured. The money comes from the surplus of the Medicare budget; as such, there is no need for individuals or employers to contribute. In 2016, China published the “Guidelines on Carrying out LTCI System Pilots”, which is a significant institutional arrangement for coping with the aging population trend [8]. Fifteen major cities were selected as pilot areas to establish a multichannel funding mechanism for mutual assistance and responsibility [9]. Some cities such as Shanghai and Chongqing have already taken LTCI as a key objective for the period of 2016–2019.
Financing supply, which should meet the LTC cost demands, is one of the most important research topics in both present and future China. Therefore, the measurement of LTC costs is a subject of great importance. This paper predicts the LTC demands among the elderly from 2020 to 2050 in China, on the basis of the changing trend of elderly disabilities in different states and seeks to provide a decision-making basis for the government’s future LTC policy.
1.2. Previous Research
Nutall et al. was probably the first researcher to study the future costs of LTC based on disabilities using the multi-state model [10]. Following this work, many researchers and government organizations have predicted future cost trends for LTC, and these trends have been calculated at fixed or current inflation rates or have been shown as a percentage of gross domestic product (GDP). The most common approach is to measure LTC cost by gender or age group and to then apply population projections to determine future costs, assuming that costs for each gender or age group remain constant. Such an approach might have some disadvantages; for instance, it may not deal with changes in the cost of each service unit resulting from inflation, actual increases in staff salaries, or changes in the price of other items, and it does not take into account the possible changes in demands by gender or age group [11,12].
A number of researchers around the world have discussed the predictors of future LTC cost. The European Commission discussed the sensitivity of future LTC cost forecasts in Germany, UK, Italy, and Spain, where the models included population by dependency rates and the probability of LTC types and led to a series of scenarios about future LTC cost [13]. The OECD (Organisation for Economic Co-operation and Development) considered a scenario where government LTC cost is a share of GDP between 2005 and 2050, and multiple assumptions of income elasticity and cost control were made. The result showed that LTC cost as a percentage of GDP will increase from 0.9% in 2005 to 2.4–3.1% in 2050 [14]. The Japanese government had put forward another estimation, in which LTC cost was to rise from 8.9 trillion in 2012 to 18–21 trillion yen in 2025 [15]. The Swedish government, assuming fixed prices and constant levels of demand by gender and age, came to the conclusion that LTC costs would enhance by 30% during 2012–2025 [16,17].
In China, research related to LTC, being a relatively new concept, began to rise, with pilot practices of the LTCI system in Qingdao, Shanghai, Chongqing, and other areas. However, there are many difficulties in these studies, especially in the empirical research, due to the shortage of official statistical data and the unified standard of the LTC cost. Therefore, scholars rarely perform empirical studies on LTC financing; the majority has provided policy suggestions to improve the LTCI system in China [18]. Empirical studies of LTC demand fall into two main categories: measuring LTC cost using macro-data such as disability rates [19,20,21,22,23] and discussing LTC service trends using micro-data from field investigations in various cities, based on such surveys as CLHLS (Chinese Longitudinal Healthy Longevity Survey, Peking University), SSAPUR (Survey of the Aged Population in Urban/Rural China, China Research Center on Aging, CRCA), and CHRLS (China Health and Retirement Longitudinal Study, CHARLS, Peking University) [24,25,26,27,28]. Among them, Activities of Daily Life (ADL) was a very important and basic indicator for measuring disability levels, which is not an official classification. This paper refers to the definitions by CRCA [29,30,31,32,33,34].
Based on the above research, this paper attempts to predict LTC cost demands among the elderly from 2020 to 2050 in China, on the basis of the changing trends of the disabled elderly in different states and discusses the government’s ability to meet the LTC demands and the reform directions of the LTC system in the future. The novelty of this paper is the attempt of a new empirical method—Bayesian quantile regression (BQR)—in existing research fields. It is organized as follows: In Section 2, the prediction method for LTC demand and the data sources are presented in more detail. In Section 3, we show the results including population prediction for LTC demand and future projections of LTC costs in different states of disability. Section 4 provides a discussion.
2. Materials and Methods
2.1. Prediction Method and Procedures for LTC Demand
Previous research designs have laid a basic research path, which divides calculations and predictions of the LTC into four steps: the aging population, the demand for LTC, provided services, and costs of the services provided. Following this basic research path, the research focus of this paper is to predict the number of disabled elderly in different states and to estimate the amount of LTC cost through the demand rate of disabled elderly in different states in China during 2020–2050. The innovation of this paper lies in the application of the new empirical method—Bayesian quantile regression (BQR)—in the prediction of the number of disabled elderly in different states.
The first step in this analysis was to measure LTC demands by predicting the number of disabled elderly in different states for 2020–2050. The different states of the disabled elderly are based on people over 65 since they are the primary target of LTC. We divided the different states of disabled elderly into the following three categories: severe disability, moderate disability, and mild disability. This was based on Activities of Daily Living (ADLs) and was defined as follows: 1–2 lost ADLs: mild disability; 3–4 lost ADLs: moderate disability; 5 or more lost ADLs: severe disability.
Weighted log-linear regression was used to project future dependency trends in most previous literature studies. Instead, this paper innovatively applied the BQR method, which has many advantages over the traditional linear regression such as OLS (Ordinary least squares). For example, quantile regression can offer more additional flexibility than traditional linear regression and Bayesian ALD approach does assume independent and identically distributed errors [35,36,37]. These estimates were, of course, subject to estimated errors. The novelty of this paper is the attempt of a new empirical method in existing research fields. As we all know, the Bayesian method is mainly used in micro-data set analysis, such as that of medical experiments. This paper attempts to apply it to macro-data analysis, although there may be many immature problems that need to be solved in the future. A detailed mathematical formula derivation of the BQR method can be provided by the R package—bayesQR for reference.
We used the data from 2003 to 2016 in China and built a regression model for the BQR analysis as follows (Equation (1)):
Equation (1) is composed of four sub-equations, where t refers to the time period and here refers to 2003–2016. I = 1,2,3,4 (that is, the dependent variables (Yi) represented the different types of disabled elderly over 65: total disability, mild disability, moderate disability, and severe disability). The independent variables (X) mainly included chronic diseases (aged over 65), per capita medical care cost, health technicians (per thousand population), and so on. All variables were subjected to Log transformation before empirical analysis, in order to reduce dimensional effects.
The following step was to predict the unit price of the service items provided in the future. Unlike the research of Yang et al. [9] and Mossialos et al. [11], the type of LTC (home-based vs. institutional care) or the mapping from disability to care setting was not emphasized; the subdivided service items provided by LTC were of focus (in this way, the composition structure and characteristics of nursing cost could be explored in detail, which increases the detail and depth of the analysis and increases the scientificity and accuracy of the projection of future LTC cost). According to the subdivided service item category of LTC in the American Association of Health Insurance (HIAA) (“health services” and “psychological nursing” were added on the basis of the OECD and the WHO), the Chinese Elderly Households and Pension Comprehensive Service (2015), and the Chinese Long-Term Care Survey Report (2017), LTC services for the elderly were divided into daily life care, basic medical care, and psychological care, each of which included a number of subdivided service items, which was also apparent in the LTC insurance (LTCI) pilot practices in Qingdao city.
In China, detailed data on LTC costs are difficult to find. Therefore, this paper adopted the method by referring to Hongwei et al. [38,39]. The specific approach was made as follows. First, we calculated the unit price of each subdivided service item in Qingdao in 2016. Second, the unit price of each subdivided service item in the whole country and in other cities was obtained by comparing the CPI (consumer price index) of other cities with that of Qingdao. Finally, based on this, the unit price of each subdivided service item was predicted from 2020 to 2050. In the calculation process, we assumed that the demand rate of the subdivided service items for the disabled elderly in different states remains unchanged. We also assumed that, first of all, the demand rate for psychological care for all disabled elderly people is 100%; secondly, the demand rate of the severely disabled elderly for all service items is 100%; and thirdly, the demand rate of service items for the moderately disabled elderly is higher than that for the mildly disabled elderly.
It should be noted that there were two ways the unit price of each subdivided service item was predicted. The first way was a direct forward method, which predicts the approximate value of the future CPI based on previous CPI and then obtains the unit price of each subdivided service item from 2020 to 2050. The second way was the indirect method. The GDP of 2020–2050 was predicted by the economic growth prediction model, and the total LTC costs in 2020–2050 were obtained in turn according to the proportion of the LTC costs to GDP. In this paper, the CPI way was used, and the GDP method will be considered in a future study for comparison.
2.2. Data Sources
The first step in this analysis was to measure LTC demands by predicting the number of disabled elderly people in different states for 2020–2050. A BQR model was established, and the data sources of related variables were as follows. National population data were obtained from the National Bureau of Statistics in China. We calculated the number of the disabled elderly from 2003 to 2016 based on the analysis of activities of daily living (ADLs) in China Health and Family Planning Statistics Yearbook. The data on chronic diseases (aged over 65) were from the China Statistics Yearbook and the China Health and Family Planning Statistics Yearbook. According to the statistical investigation, the prevalence rate of chronic disease in the elderly (over 65) has remained relatively stable (538.8‰ in 2003 and 539.9‰ in 2013). Therefore, this paper used the latest prevalence rate of chronic disease in 2013, based on which the calculated data are basically consistent with those reported by authorities over the years. The data of per capita medical care cost were obtained from China Health and Family Planning Statistics Yearbook, the China Insurance Yearbook, and the China Statistics Yearbook. All the data were calculated at the current price. In particular, the data (after 2013) were obtained directly from the survey data of the National Bureau of Statistics of China, and the data (in and before 2013) were weighted according to the proportion of urban to rural population. The data on health technicians (per thousand population) were directly from the China Health and Family Planning Statistics Yearbook, where the molecule was the sum of medical personnel and nurses, and the denominator was the number of permanent residents. Finally, all variables were Log transformed before model regression, in order to reduce dimensional effects, minimize linearization, and normalize requirements.
The following step was to predict the unit price of the service items provided in the future. The subdivided service item category of LTC mainly refers to the American Association of Health Insurance (HIAA) and China’s Long-Term Care Survey Report (2017). The statistics of nursing service demand content, the potential demand proportion, the effective demand proportion, the project unit price, and other parameter information were mainly from CLHLS (Chinese Longitudinal Healthy Longevity Survey, Peking University), SSAPUR (Survey of the Aged Population in Urban/Rural China, China Research Center on Aging (CRCA)), and CLASS (China Longitudinal Aging Social Survey).
Chinese currency, when used, was converted to USD at a fixed exchange rate of 6.8:1.
3. Results
3.1. Population Prediction for LTC Demand
From the BQR analysis, it was found that there was a relatively stable proportional relationship between chronic diseases and disabled elderly, which changed in the same direction. Therefore, the demand space for LTC for the elderly in China can be predicted by the scale of chronic diseases in the future.
The first step was to estimate the coefficient relationship between disability and chronic diseases by BQR. As shown in Figure 1, there was a relatively stable proportional relationship between chronic diseases and disabled elderly in different states.
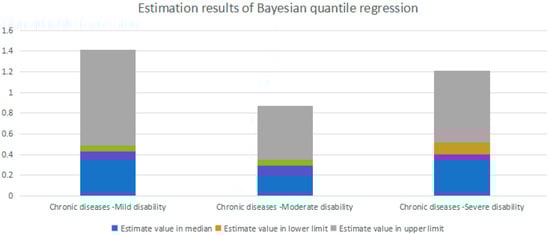
Figure 1.
Parameter estimation results of Bayesian quantile regression (BQR) methods (tau = 0.5/mean). Note: All of the outcomes of Quantile Regression had credible intervals of 95%; the coefficient of estimated regression represents the elastic relationship between the dependent variable and the independent variable, since all the variable data were logicized in advance.
BQR not only provided the estimates on all the quantiles, but also provided upper and lower values of a certain confidence interval in a particular quantile. More noteworthy, BQR provided a reasonable trend in elastic relationships; for example, our results revealed that the number of mildly disabled individuals increases by about 0.47%, when chronic diseases increase 1% (as shown in the first figure in Figure 1).
The second step was to predict the scale of the disabled elderly (the aged over 65) in China from 2020 to 2050 (based on the regression results of the quantile = 0.5).
As shown in Table 1, the number of severely disabled individuals will reach to 7.773 million in 2020, 12.99 million in 2035, and 15.41 million in 2050, which were basically consistent with the predictions obtained by Xu and Chen [23] and the CWCA (China Working Committee on Aging). Furthermore, Table 1 also showed the number range (high and low) of different disabled states, which provided the scientific basis for the future implementation of LTC policy.

Table 1.
Prediction of the disabled elderly (the aged over 65) in China during 2020–2050 (unit: 1000 people).
3.2. The Types and Demand Rates of LTC Service Items for Disabled Elderly in Different States
According to the subdivided service item category of LTC in the American Association of Health Insurance (HIAA) (“health services” and “psychological nursing” were added on the basis of the OECD and the WHO including them), the Chinese Elderly Households and Pension Comprehensive Service, and China’s Long-Term Care Survey Report (2017), the elderly LTC services can be divided into daily life care, basic medical care, and psychological care, each of which includes a number of subdivided service items, which was also shown in the LTCI pilot practices in Qingdao city.
The requirement level of nursing varies with the degree of disability. Therefore, it is necessary to analyze the demand ratio of each item in different disability states in order to calculate the itemized care cost in detail. Data results were collected by the Chinese Elderly Households and Pension Comprehensive Service (2015). Data may be slightly erroneous, but this does not affect the actual research. It should be noted that the results of some small nursing services items were the same, which is mainly due to the fact that the contents of each small item were close to each other during the survey and were integrated into each question. In addition, this part of the study followed the basic assumptions mentioned in Section 2.1, which were reflected in Figure 2. As Hong-Wei [39] mentioned, the elderly have a certain degree of stability in the demand for different LTC services, and the fluctuation is small. Therefore, this paper assumes that the demand ratio was basically stable during the forecast period.
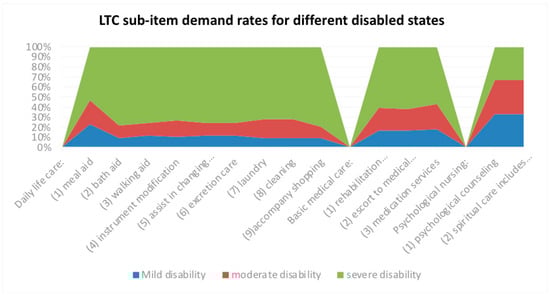
Figure 2.
Long-term care (LTC) sub-item demand rates for different disabled states.
3.3. Future Prediction for the Unit Price of Each Long-term Care Service Item
The first step was to calculate the current unit price of each LTC service item. The unit price of LTC service items in Qingdao was used as a basis. Qingdao was the earliest and most successful LTCI pilot city in China, and its LTC cost level is a good reference. The CPIs (consumer price indexes) of the nation and of Qingdao were compared, and the pricing standard of LTC service items nationwide was then obtained. In view of the fact that prices of LTC service items are typically set annually rather than each time in real life, unit prices used in the following studies refer to the costs listed in the last column (each year) of Table 2.
Table 2.
The unit price of each long-term care (LTC) service item from 2020 to 2050 (dollars/year).
The second step was to predict the unit price of each LTC service item based on the CPI from 2020 to 2050. First, a simple forecast of the CPI for 2020–2050 is needed. This is obtained by smoothing the CPI in previous years used the moving average (MA) method. The advantage of the MA method is that it can predict the long-term trend of a sequence according to trend line analysis, where the influence of periodic and random fluctuations is eliminated, although some limitations were inevitable. It was found that 2% of the CPI is quite reasonable. Of course, bias was unavoidable. Second, the unit price of each LTC service item (from the first step) was multiplied by the ratio of the future and current CPIs, and the unit price of each LTC service item from 2020 to 2050 was obtained.
As shown in Table 2, in 2016, the total LTC cost was about $2133.96 a year, which was equivalent to 1.1% of the per capita public financial expenditure and 0.25% of the per capita GDP, while the LTC cost of OECD was 1.6% of the per capita GDP in the same period. The cost of psychological counseling and meal aid accounts for the largest proportion, and nursing amounted to about $441 and $440 a year, while the cost of instrument modification was only $8.86 a year, which can be ignored. Assuming that this proportion remains stable, the cost of psychological counseling and meal aid accounts will reach about $1323.39 and $882.26 a year, respectively, in 2050.
3.4. Future Projections of LTC Costs in Different States of Disability
The objective of this study was to predict LTC costs in different states of disability in the future. After the analyses of Section 3.1 and Section 3.2, the number of disabled elderly in different states was multiplied by the rate of demand for LTC service items among different states of disability, and then multiplied by the unit price of each LTC service item. The LTC costs from 2020 to 2050 were thus obtained.
As shown in Table 3, Table 4 and Table 5, in 2020, the median level of LTC cost for mild disability, moderate disability, and severe disability will reach 39.46 (daily life care: 7.3, basic medical care: 4.45, psychological nursing: 27.7), 8.98 (daily life care: 1.77, basic medical care: 1.27, psychological nursing: 5.94), and 20.25 (daily life care: 7.51, basic medical care: 4.54, psychological nursing: 8.2) billion dollars, respectively. In 2035, the median level of LTC cost for mild disability, moderate disability, and severe disability will reach 88.76, 20.21, and 45.57 billion dollars. Among them, the median level of daily life care for mild disability, moderate disability, and severe disability will reach 16.42, 3.98, and 16.91 billion dollars. In 2050, the median level of LTC cost for mild disability, moderate disability, and severe disability will reach 141.7, 32.28, and 72.78 billion dollars. Among them, the median level of daily life care for mild disability, moderate disability, and severe disability will reach 26.23, 6.36, and 27 billion dollars. (see Figure 3)
Table 3.
Total LTC cost for each item in 2020 (billions).
Table 4.
Total LTC cost for each item in 2035 (billions).
Table 5.
Total LTC cost for each item in 2050 (billions).
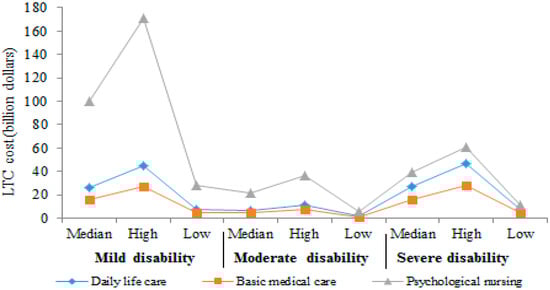
Figure 3.
LTC cost of each sub-item for different disabled states in 2050.
Meanwhile, LTC cost under different LTC levels was found. In 2050, the daily life care cost under different LTC levels was projected to be $27 billion at the median level, $46.54 billion at high level and $7.49 billion at the low level.
4. Discussion
The aging of the population has led to the huge challenge of solving the LTC needs of the elderly in China. As a complex issue, the development of demand for LTC services depends on the prevalence of disability in the population, economic factors, institutional environment, preferences, family structures, and their interactions. Correspondingly, financing supply, which should meet the LTC cost demands, is one of the most important research topics. Therefore, the measurement of LTC cost is a necessary subject.
Follow the basic framework and steps of previous research designs, which divided the calculations and predictions of LTC into four steps—the aging population, the demand for LTC, provided services, and costs of the services provided—we predicted the LTC demands among the elderly from 2020 to 2050 in China on the basis of the changing trend of the disabled elderly in different states and expected to provide a decision-making basis for the government’s future LTC policy.
However, different from previous literature that mostly used weighted log-linear regression method, we attempted to use a different empirical method, Bayesian quantile regression (BQR), which has many advantages over traditional linear regression. Another innovation is that we set and measured the high, middle, and low levels of LTC cost prediction for each disability state among the elderly. Therefore, the theoretical significance of our study is that it provides a different and referential way to predict future LTC costs.
Our projections of future LTC cost suggested that, based on our core assumptions, the LTC cost will increase to $39.46, 8.98, and 20.25 billion in the median level for mild disability, moderate disability, and severe disability, respectively, in 2020 ($68.69 billion dollars for all disabled elderly), and this number will reach $141.7, 32.28, and 72.78 billion in 2050 accordingly ($246.76 billion for all disabled elderly). The median level of daily life care for mild disability, moderate disability, and severe disability will increase to $26.23, 6.36, and 27 billion. These results are similar to previous studies. For instance, Hong-Wei [39] predicted LTC would reach RMB 1601.8 billion yuan (that is, about USD $235.56 billion converted by the fixed exchange rate 6.8:1) in 2050. Fengyue and Junko [33] predicted that LTC would reach RMB 251.5 billion yuan (that is, about USD $36.98 billion converted by the fixed exchange rate 6.8:1) in 2020. Of course, differences in research results were inevitable because of differences in forecasting methods and assumptions. Our predictions are based on our predictions of the number of different states of disabled elderly through a different empirical method, namely BQR, and some important assumptions: for example, that the elderly have a certain degree of stability in the demand for different LTC services and that the fluctuation is small. Therefore, this paper assumes, among other things, that the demand ratio will be basically stable during the forecast period.
In addition to the above theoretical significance, our research also has some practical and policy significance. Our results showed that future increases in LTC cost will be enormous, so the establishment of a reasonable individual-social-government payment mechanism is necessary for the LTC system. The current LTCI pilot in China still needs to be improved and deepened in order to promote the popularization of the LTCI system in all regions of the country. In particular, the design of the LTCI system must take into account a variety of factors, including the future elderly population, the ratio of the disabled to the total population, the level of wages and retirement, different care conditions, commercial insurance payment, and the financial burden of the government, in order to maintain the sustainable development of LTC in the future. In addition, considering that the supply of LTC costs may not meet the demand, commercial private LTC insurance may also exist as a beneficial supplement to the government LTCI system.
5. Conclusions
In summary, our research attempts to introduce the BQR model for the projection of LTC cost in China. To obtain interesting conclusions, there must be little error or omissions. This needs to be addressed in future studies. For example, a different conclusion would be obtained if the assumptions of the demand ratio of LTC and CPI changed. In terms of research samples, it can be also further conducted a comparative analysis and heterogeneity analysis for the LTC cost projection in regions with different levels of economic development.
Author Contributions
X.X. conceived and designed the experiments: L.C. analyzed the data: X.X. contributed analysis tools: L.C. wrote the paper: X.X. wrote the second draft.
Funding
This study was funded by Project (No: 2016QNSH24) supported by the China Chongqing Social Science Planning Fund, and Project (No: 19SKGH089) supported by the Chongqing Education Commission Humanities and Social Sciences Research Project.
Acknowledgments
We thank Professor Timothy Kyng and Professor Fei Guo at Macquarie University for their thoughtful guidance.
Conflicts of Interest
The authors declare that they have no competing interests.
References
- Robine, J.M.; Michel, J.P. Looking forward to a general theory on population aging. J. Gerontol. A Biol. 2004, 59, 590–597. [Google Scholar] [CrossRef] [PubMed]
- Madge, A. Long-Term Aged Care: Expenditure Trends and Projections. 2000. Available online: https://www.pc.gov.au/research/supporting/long-term-aged-care (accessed on 20 June 2019).
- Robinson, R.; Dixon, A. United Kingdom Health Care Systems in Transition; European Observatory on Health Care Systems: Copenhagen, Denmark, 1999. [Google Scholar]
- Campbell, J.C.; Ikegami, N. Long-term insurance comes to Japan. Health Aff. 2000, 19, 26–39. [Google Scholar] [CrossRef]
- Hiraoka, K. Long-Term Care Insurance and Welfare Mix in Japan; Ochanomizu Joshi Daigaku Jinbunkagaku Kiyo, Ochanomizu University: Tokyo, Japan, 2001; Volume 54, pp. 133–147. [Google Scholar]
- Tsutsui, T.; Muramatsu, N. Care needs certification in the long-term care insurance system of Japan. J. Am. Geriatr. Soc. 2005, 53, 522–527. [Google Scholar] [CrossRef] [PubMed]
- Lagergren, M. The systems of care for frail elderly persons: the case of Sweden. Aging Clin. Exp. Res. 2002, 14, 252–257. [Google Scholar] [CrossRef] [PubMed]
- Ministry of Human Resources and Social Security of the People’s Republic of China. Instructions on Carrying Out Long-Term Care Insurance System Pilots. The Portal Website of the State Council of the People’s Republic of China. Available online: http://www.gov.cn/xinwen/2016-07/08/content_5089283.htm (accessed on 6 September 2016).
- Yang, W.; He, J.; Mossialos, E. Financing institutional long-term care for the elderly in China: a policy evaluation of new models. Health Policy Plan. 2016, 31, 1391–1401. [Google Scholar] [CrossRef]
- Nutall, S.R.; Blackwood, R.J.L.; Bussell, B.M.H.; Cliff, J.P.; Cornall, M.J.; Cowley, A.; Gatenby, P.L.; Webber, J.M. Financing long-term care in Great Britain. J. Inst. Actuar. 1994, 121, 1–68. [Google Scholar] [CrossRef]
- Martin, K.; Les, M.; Ben, R. Future costs for long-term care cost projections for long-term care for older people in the United Kingdom. Health Policy 2006, 75, 187–213. [Google Scholar]
- Vidal-Meliá, C.; Ventura-Marco, M.; Pérez-Salamero González, J.M. Social Insurance Accounting for a Notional Defined Contribution Scheme Combining Retirement and Long-Term Care Benefits. Sustainability 2018, 10, 2832. [Google Scholar] [CrossRef]
- European Commission. 2015 Aging Report-Economic and Budgetary Projections for the 28 EU Member States (2013–2060); European Commission: Luxembourg, 2015. [Google Scholar]
- OECD. Projecting OECD Health and Long-Term Care Expenditures: What Are the Main Drivers? Economics Department Working Papers No. 477; OECD: Paris, France, 2006. [Google Scholar]
- Hayashi, M. Long-Term Insurance in Japan-Social Background, Evaluation and Future; Ministry of Health, Labor and Welfare: Tokyo, Japan, 2013. Available online: http://www. nuffieldtrust.org.uk/talks/slideshows/masahiko-hayashi-long-term-care-insurancejapan (accessed on 7 August 2017).
- Swedish Agency for Health and Care Services Analysis. Home help, Institutional Care or Something in Between; Report 2015:8; Swedish Agency for Health and Care Services Analysis: Stockholm, Sweden, 2015.
- Marten, L.; Noriko, K.; Yasuhiko, S. Future Costs of Long-term Care in Japan and Sweden. Int. J. Health Serv. 2018, 48, 128–147. [Google Scholar] [CrossRef]
- Chen, L.; Xu, N. Fiscal burden of long term care social insurance system in China: Measurement based on social insurance systems of Germany and Japan. Insur Stud. 2013, 34, 106–118. [Google Scholar] [CrossRef]
- Gu, D.; Zeng, Y. Changes of disability in activities of daily living among Chinese elderly from 1992 to 2002. Popul. Econ. 2006, 157, 9–13. [Google Scholar]
- Huang, F.; Wu, C. A study of long-term care demand of the elderly in China: Based on multi-status transition model. Econ. Res. J. 2012, s2, 119–130. [Google Scholar]
- Lu, B.; Liu, X.; Yang, M. A budget proposal for China’s public long-term care policy. J. Aging Soc. Policy 2017, 29, 84–103. [Google Scholar] [CrossRef] [PubMed]
- Zhu, M.; Jia, Q. The analysis of demand for long term care and its insurance system constructing in China. Chin. J. Health Policy 2009, 2, 32–38. [Google Scholar]
- Xu, X.; Chen, L. Influencing factors of disability among the elderly in China, 2003–2016: Application of Bayesian quantile regression. J. Med. Econ. 2019, 22, 605–611. [Google Scholar] [CrossRef] [PubMed]
- Feng, Q.; Zhen, Z.; Purser, J. Trends in ADL and IADL disability in community-dwelling older adults in Shanghai, China, 1998–2008. J. Gerontol. B Psychol. Sci. Soc. Sci. 2013, 68, 476–485. [Google Scholar] [CrossRef] [PubMed]
- Gao, X.; Yan, B. Planning response to older people’s long-term care needs: Evidence from Beijing, China. Gerontechnology 2016, 14, 210–217. [Google Scholar] [CrossRef]
- Qiu, F.; Stegall, S.; Fitzpatrick, P. A primary study on long term care in China: perceptions of the elderly. J. Manag. Policy Pract. 2013, 14, 115–122. [Google Scholar]
- Shen, S.; Li, F.; Kipkorir, T. Long-term care insurance in China: public or private? Soc. Work Health Care 2014, 53, 679–692. [Google Scholar] [CrossRef]
- Peking University, China Health and Retirement Longitudinal Study (CHARLS). 2015. Available online: http://charls.pku.edu.cn/en/page/data/2015-charls-wave4 (accessed on 31 May 2017).
- The Research Group of Chinese Research Center on Aging. Research on situation of urban and rural disabled elderly. Disabil. Res. 2011, 2, 16. [Google Scholar]
- Jiang, X.; Wei, M. Activity of daily living of the Chinese oldest-old and its change between 2002 and 2011. Popul. Dev. 2015, 21, 93–100. [Google Scholar]
- Du, P.; Wu, C. Ability of daily life of the Chinese elderly: Status and changes. Popul. Res. 2006, 30, 50–56. [Google Scholar]
- United Nations, Word Population Prospects: The 2015 Revision Population on Database. Available online: https://www.un.org/en/development/desa/population/publications/ageing/WPA2015_Infochart.asp (accessed on 30 June 2015).
- Fengyue, L.; Junko, O. Financing elderly people’s long-term care needs: Evidence from China. Int. J. Health Plan. Manag. 2018, 33, 479–488. [Google Scholar] [CrossRef]
- Song, B.; Sun, Q.; Li, Y.; Que, C. Evaluating the Sustainability of Community-Based Long-Term Care Programmes: A Hybrid Multi-Criteria Decision Making Approach. Sustainability 2016, 8, 657. [Google Scholar] [CrossRef]
- Sriram, K.; Ramamoorthi, R.V.; Ghosh, P. Posterior Consistency of Bayesian Quantile Regression Based on the Misspecified Asymmetric Laplace Density. Bayesian Anal. 2013, 8, 269–504. [Google Scholar] [CrossRef]
- Yang, Y.; Wang, H.J.; He, X. Posterior inference in Bayesian quantile regression with asymmetric Laplace likelihood. Int. Stat. Rev. 2016, 84, 327–344. [Google Scholar] [CrossRef]
- Benoit, D.F.; Van den Poel, D. bayesQR: A Bayesian approach to quantile regression. J. Stat. Softw. 2017, 76, 1–32. [Google Scholar] [CrossRef]
- Jing, Y.; Li, H.; Li, Y. Quantitative forecast analysis of the quantity and structure of disability old in China. Popul. J. 2017, 6, 81–89. [Google Scholar] [CrossRef]
- Hong-wei, H. Demand assessment and forecast of China’s elderly Long-Term Care services. China Popul. Sci. 2015, 3, 79–89. [Google Scholar]


© 2019 by the authors. Licensee MDPI, Basel, Switzerland. This article is an open access article distributed under the terms and conditions of the Creative Commons Attribution (CC BY) license (http://creativecommons.org/licenses/by/4.0/).