A Novel on Transmission Line Tower Big Data Analysis Model Using Altered K-means and ADQL


Abstract
1. Introduction
2. Related Research
2.1. K-Means Algorithm

2.2. Reinforcement Learning
2.3. Electric Power Prediction System
3. Proposed Transmission Line Tower Analysis Algorithm
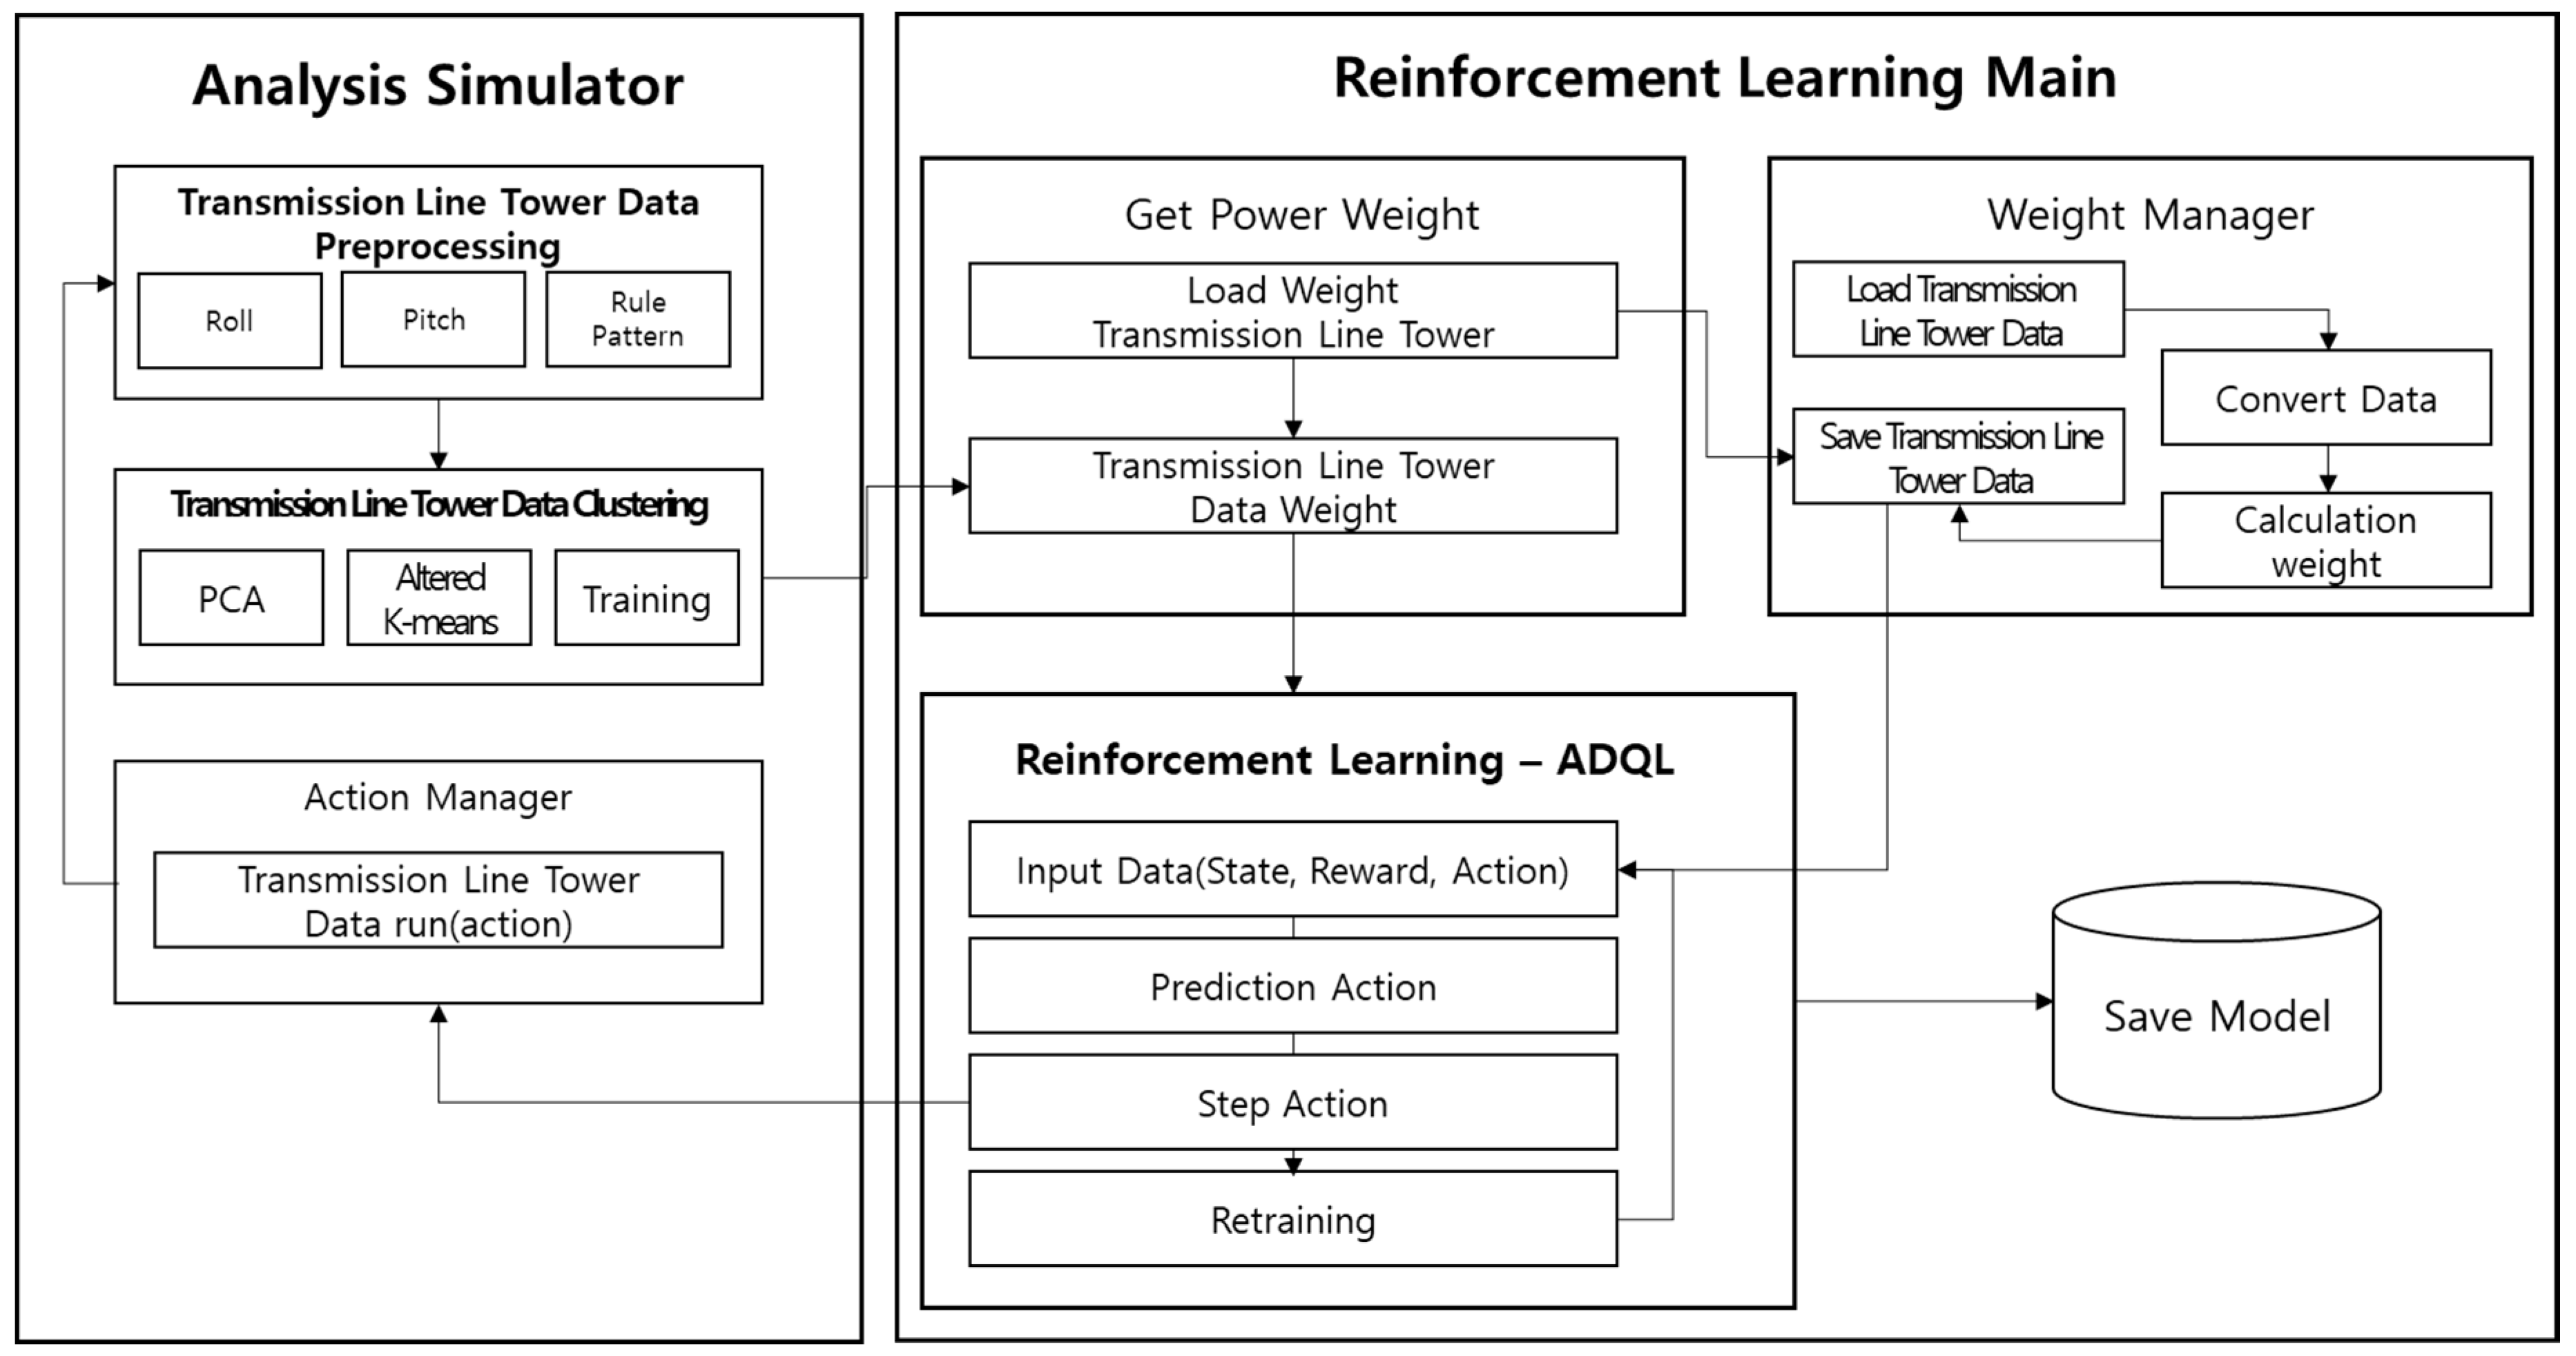
3.1. Structure of the Proposed System
3.2. Raw Data Level
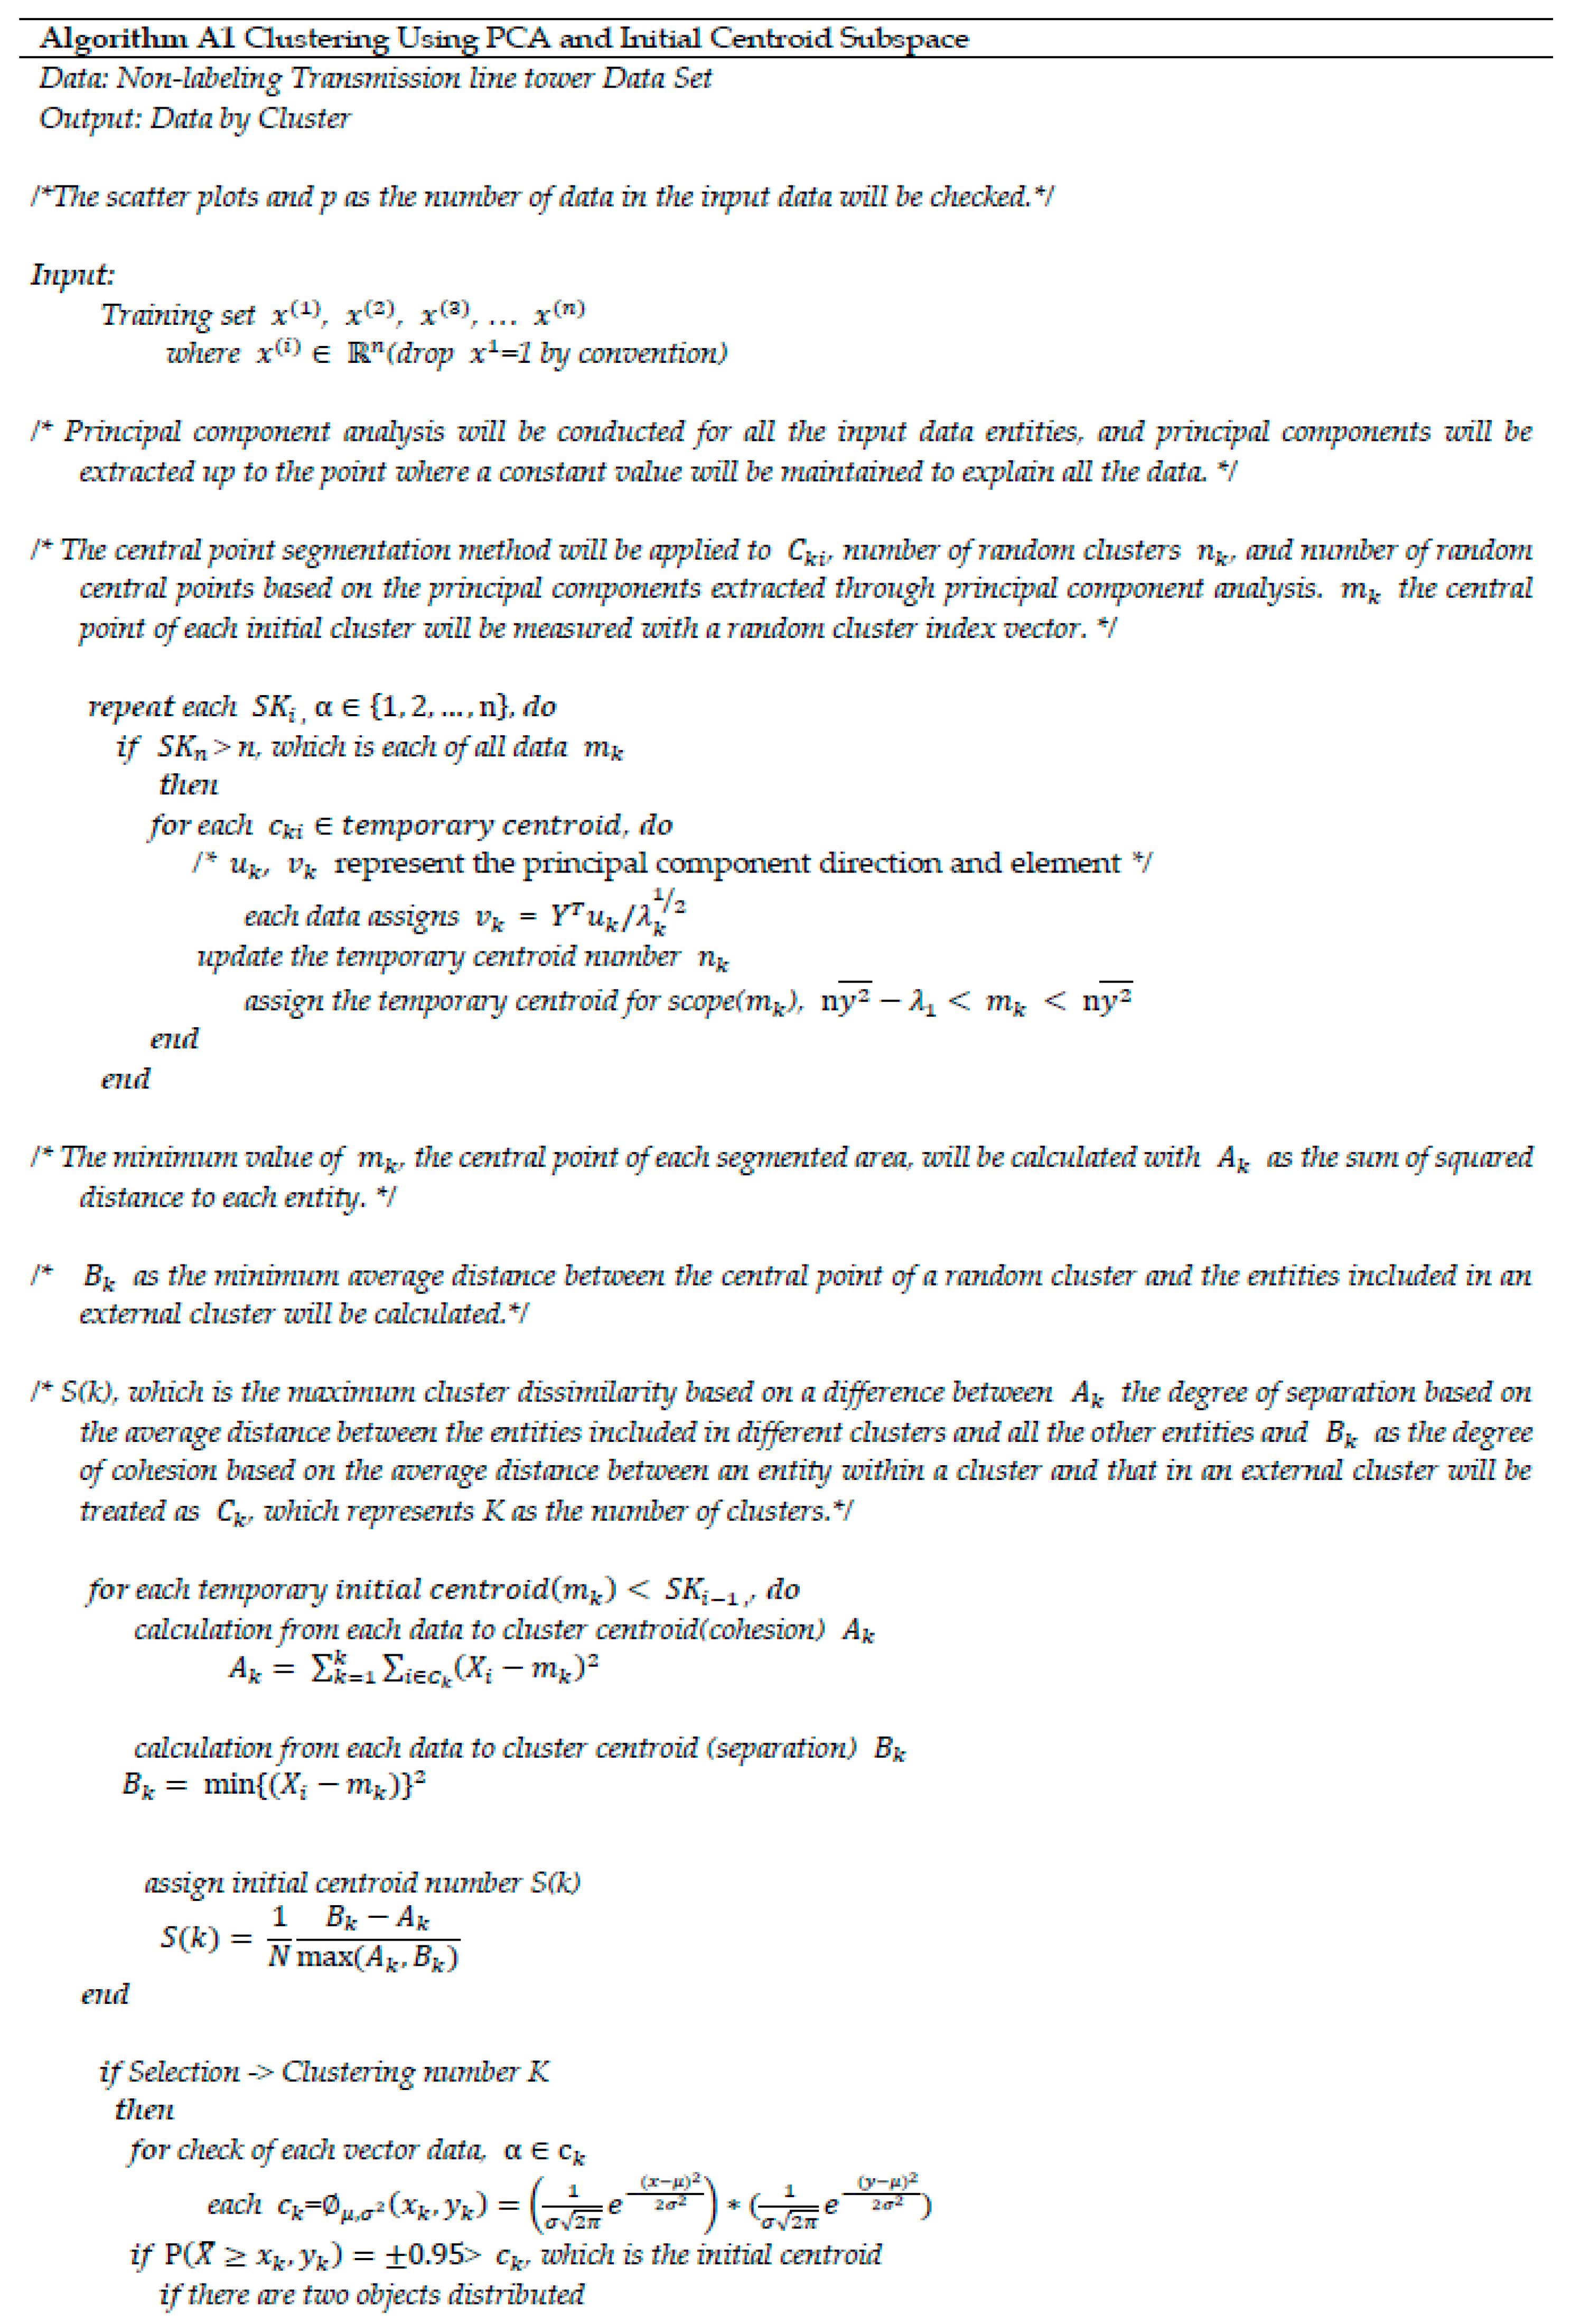
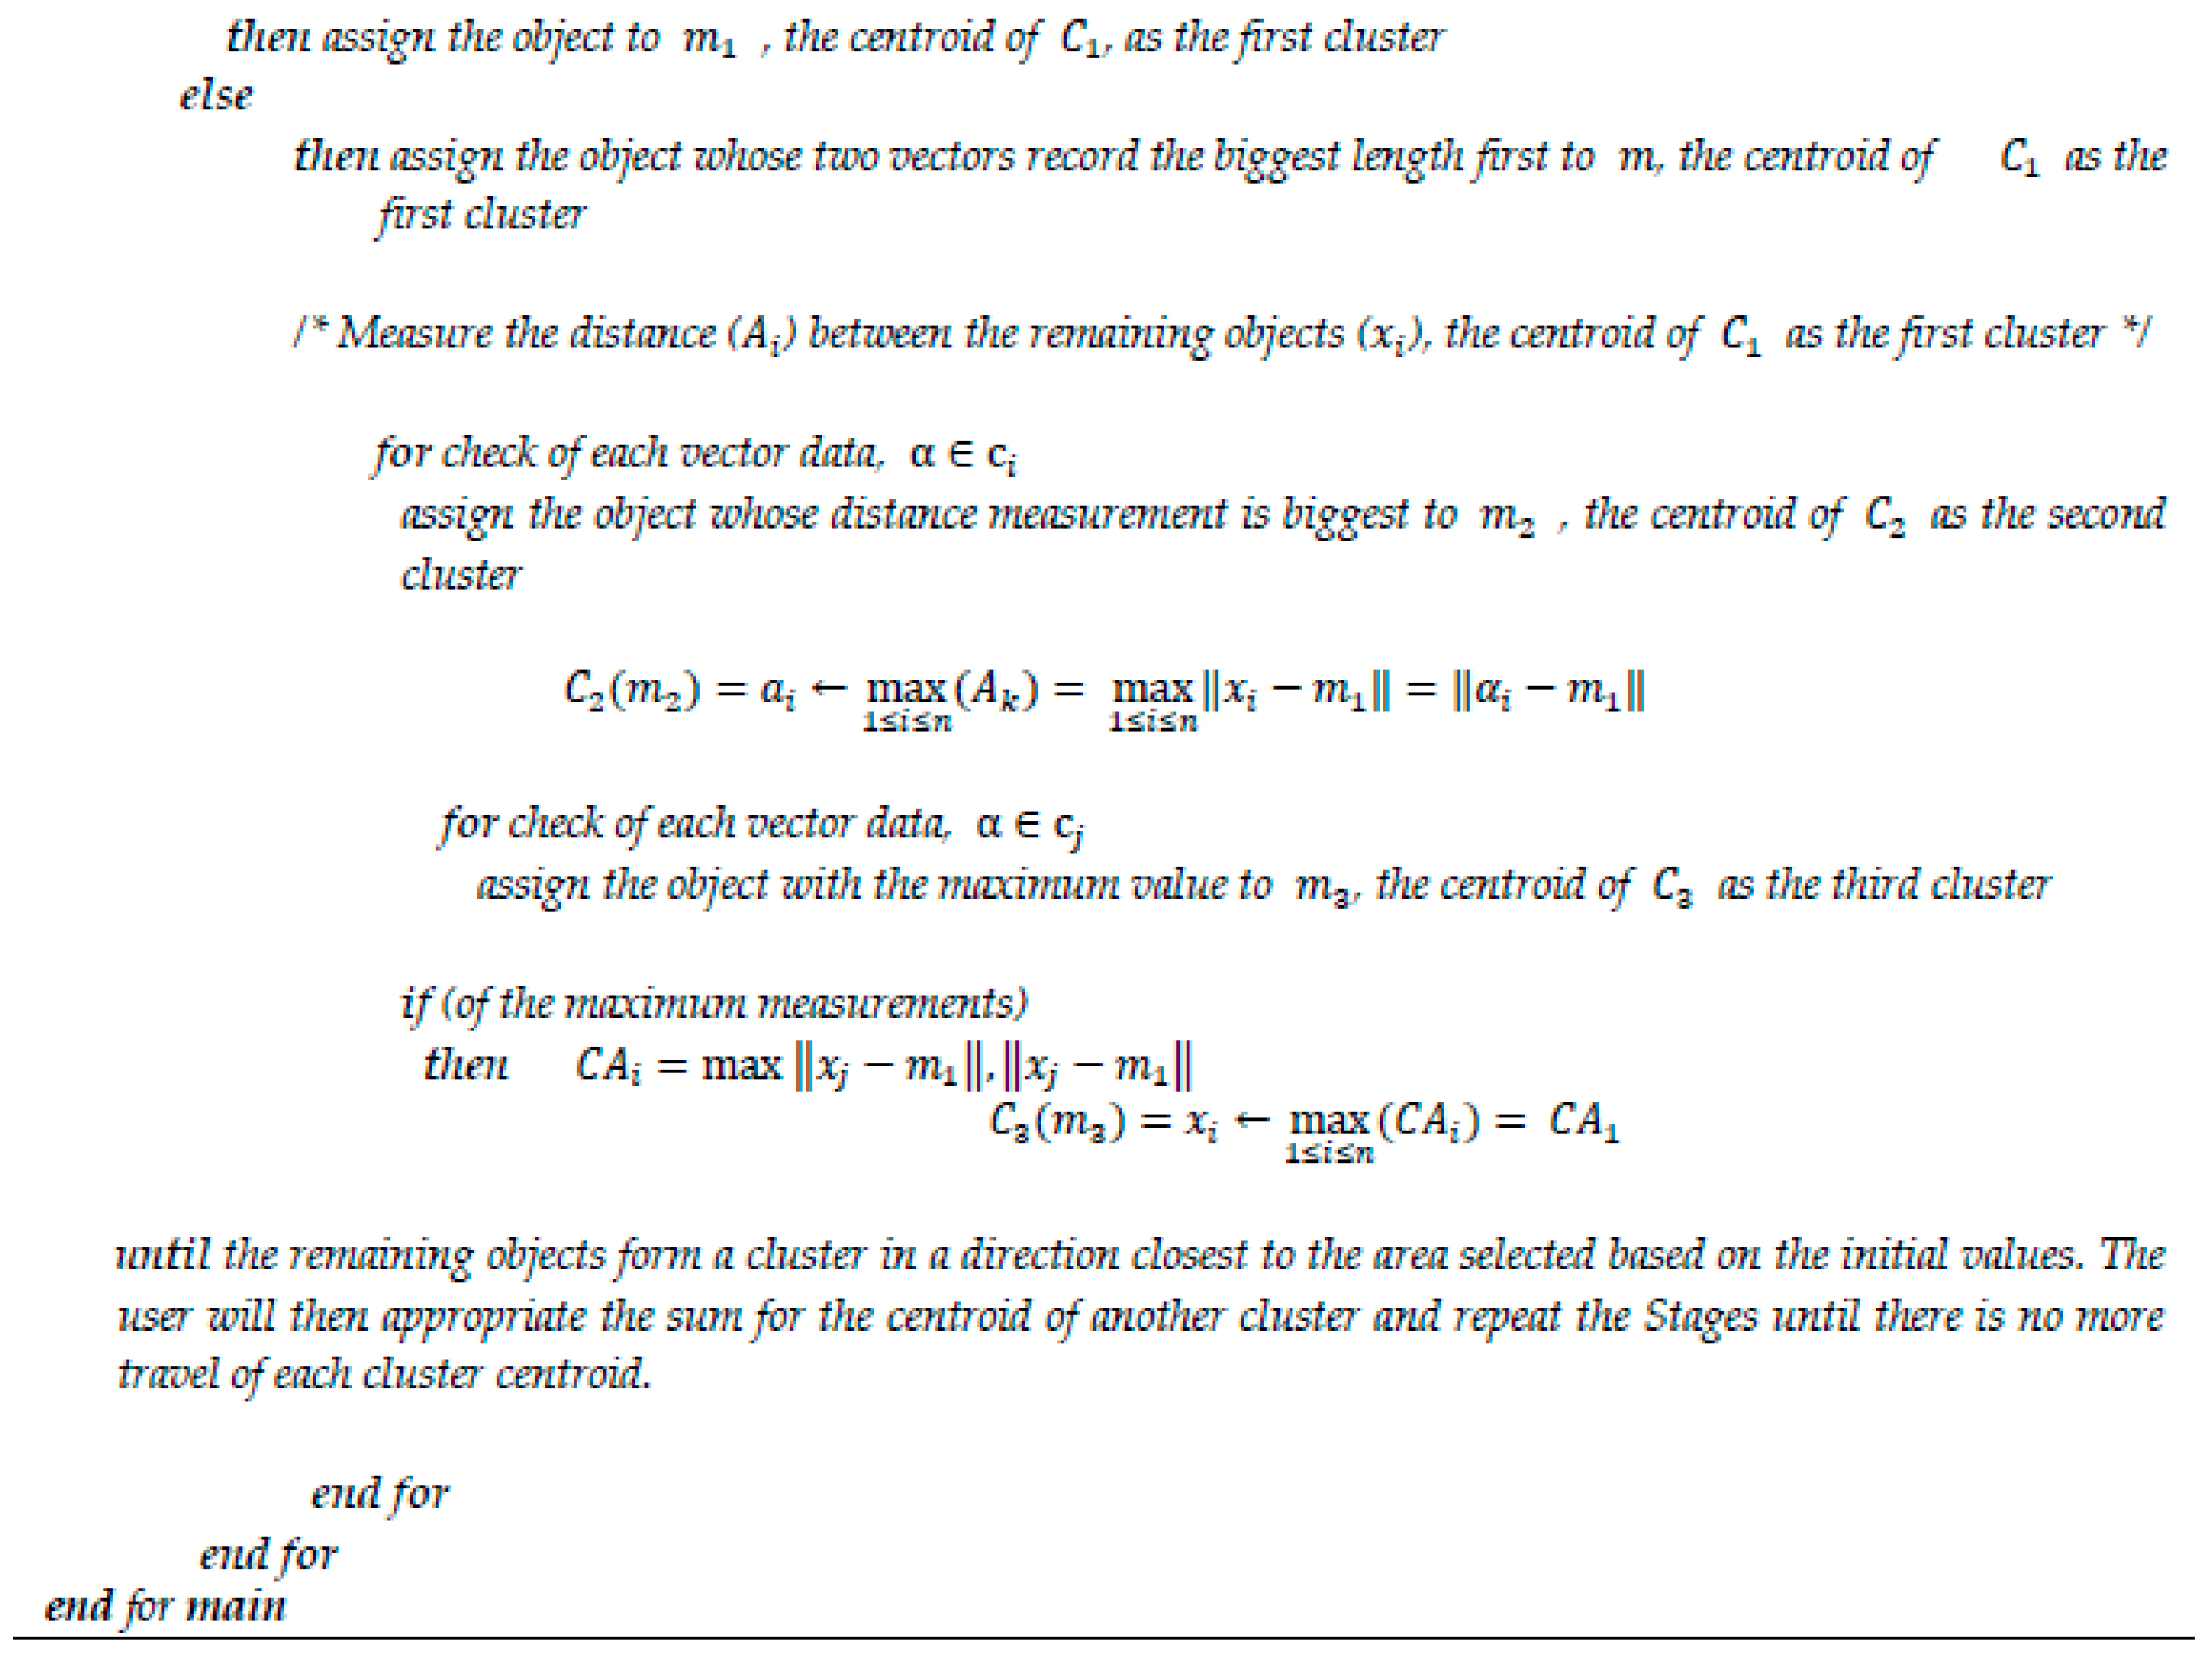
3.3. Clustering Level : Altered K-Means Algorithm
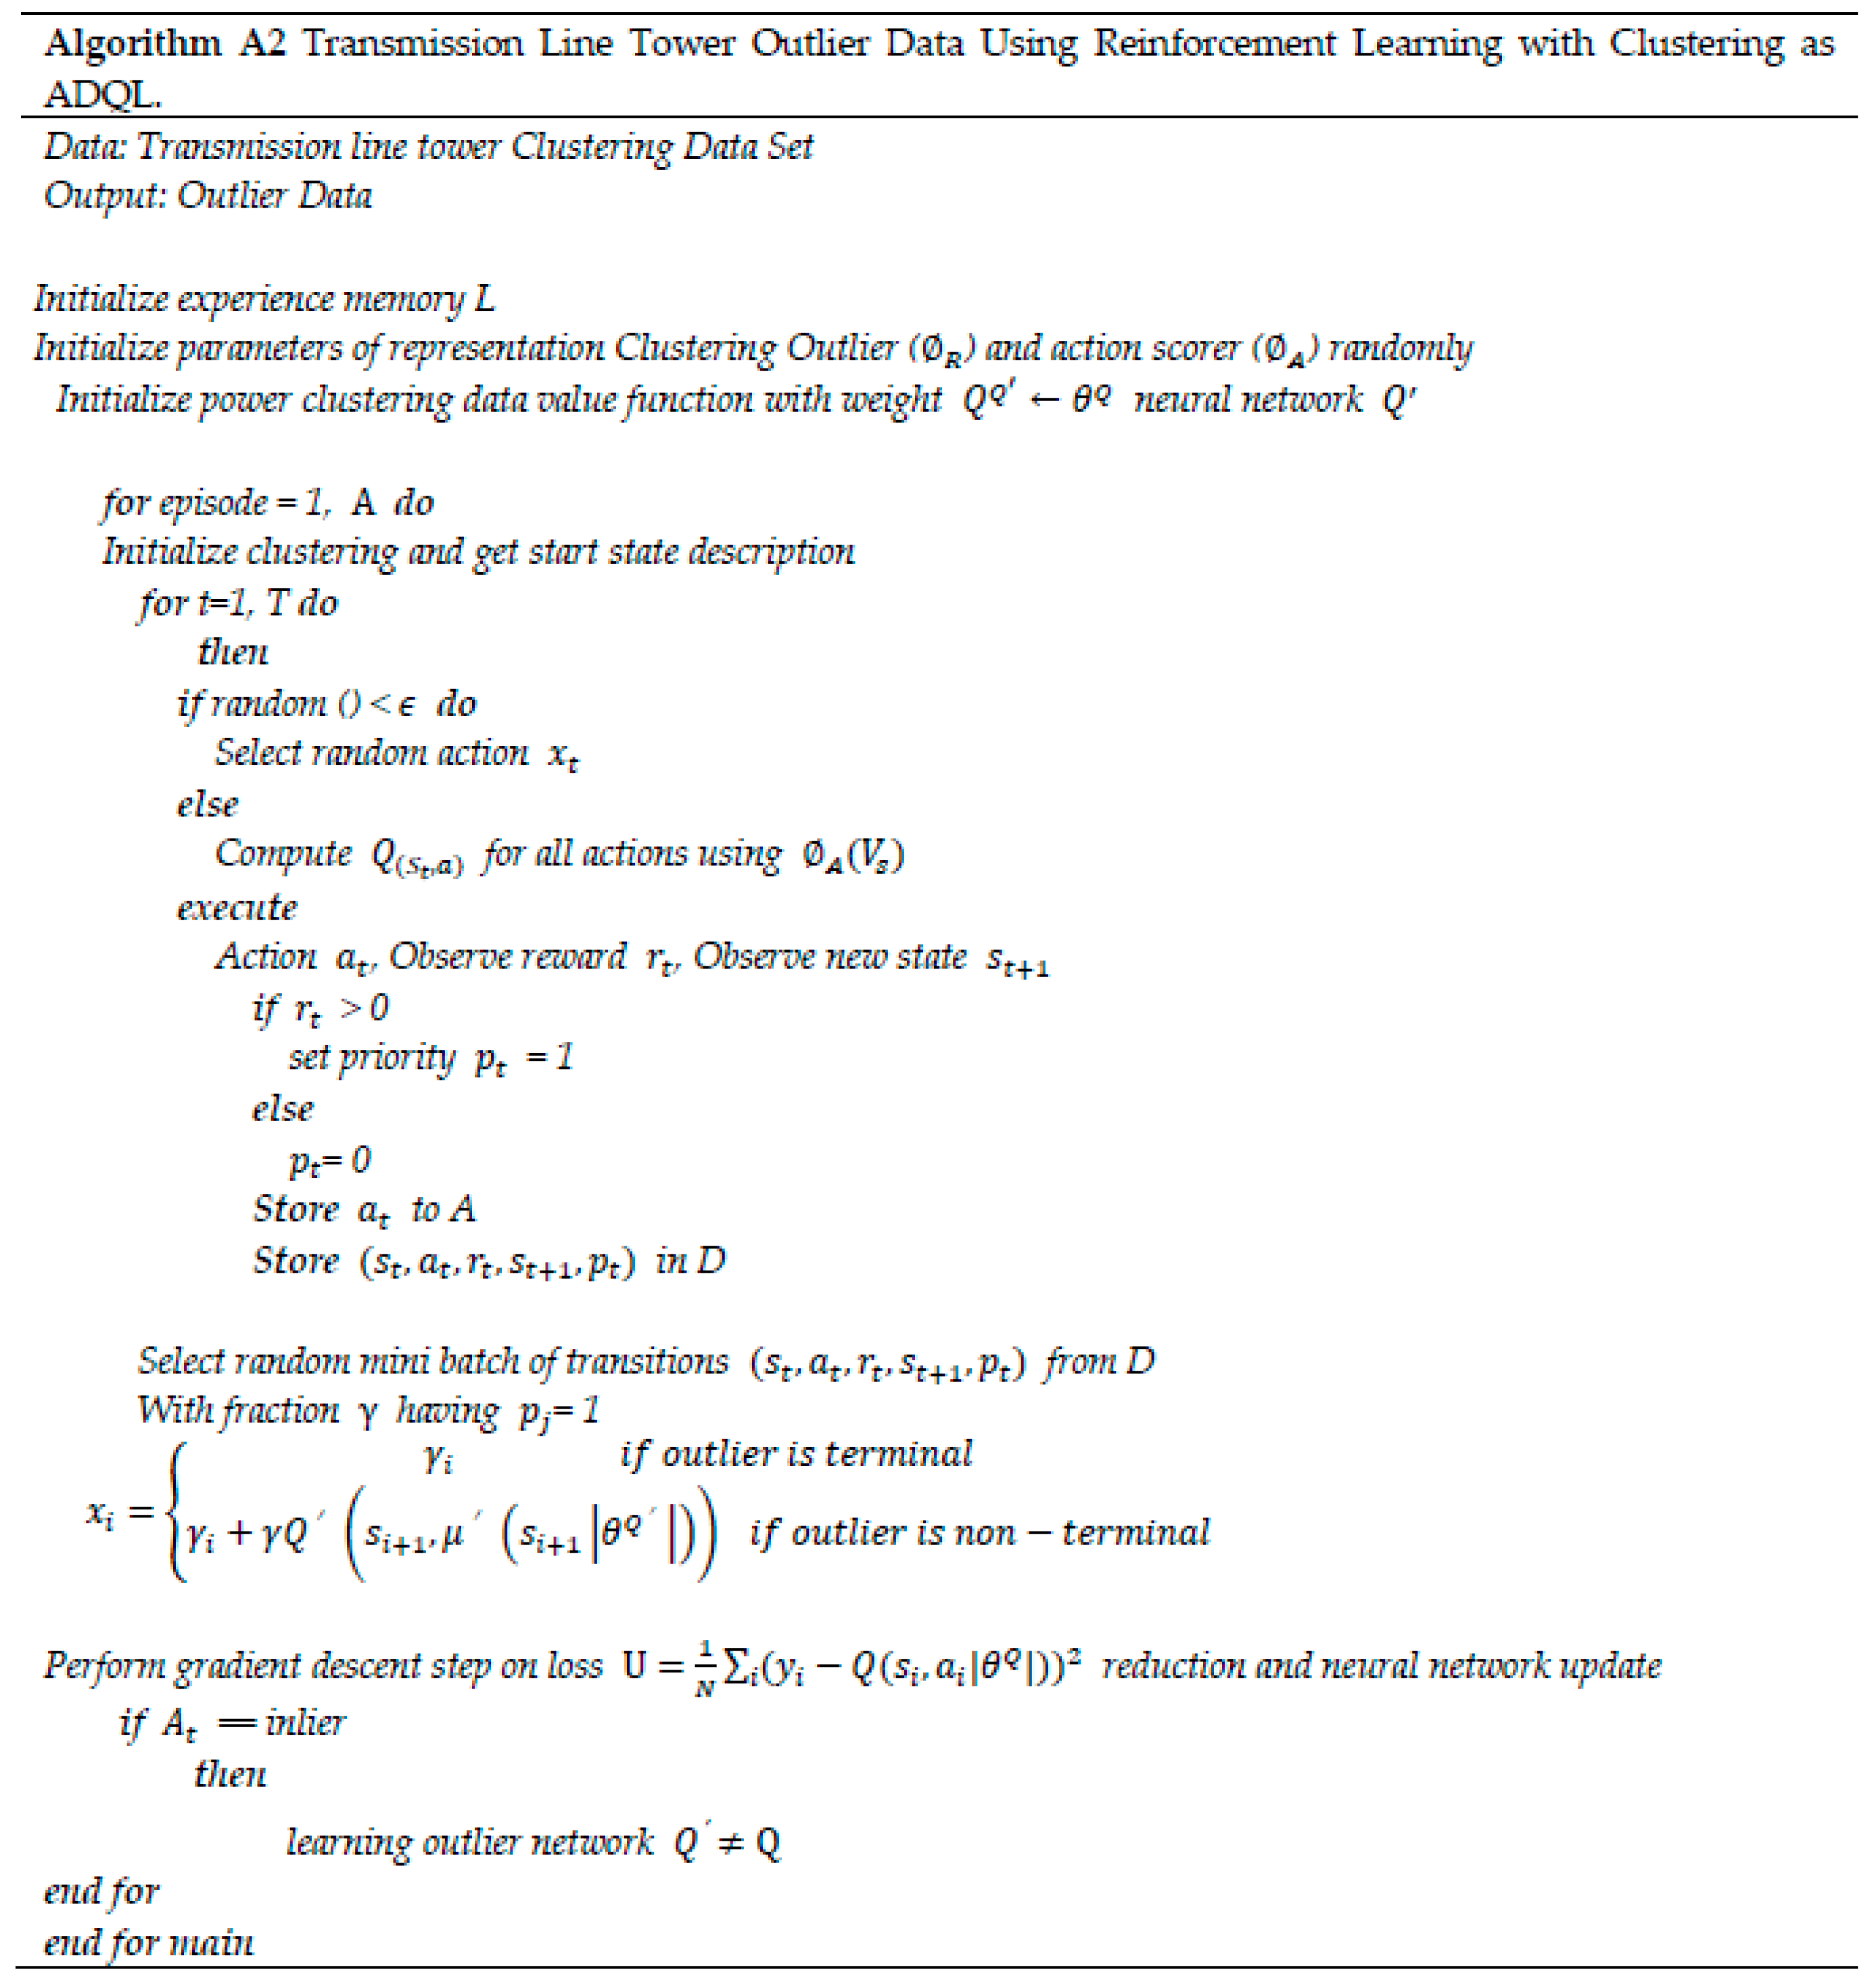
3.4. Reinforcement Learning Level: A-Deep Q-Learning Algorithm

4. Reinforcement Learning Policy Simulation of Transmission Line Tower Data
5. Experiment
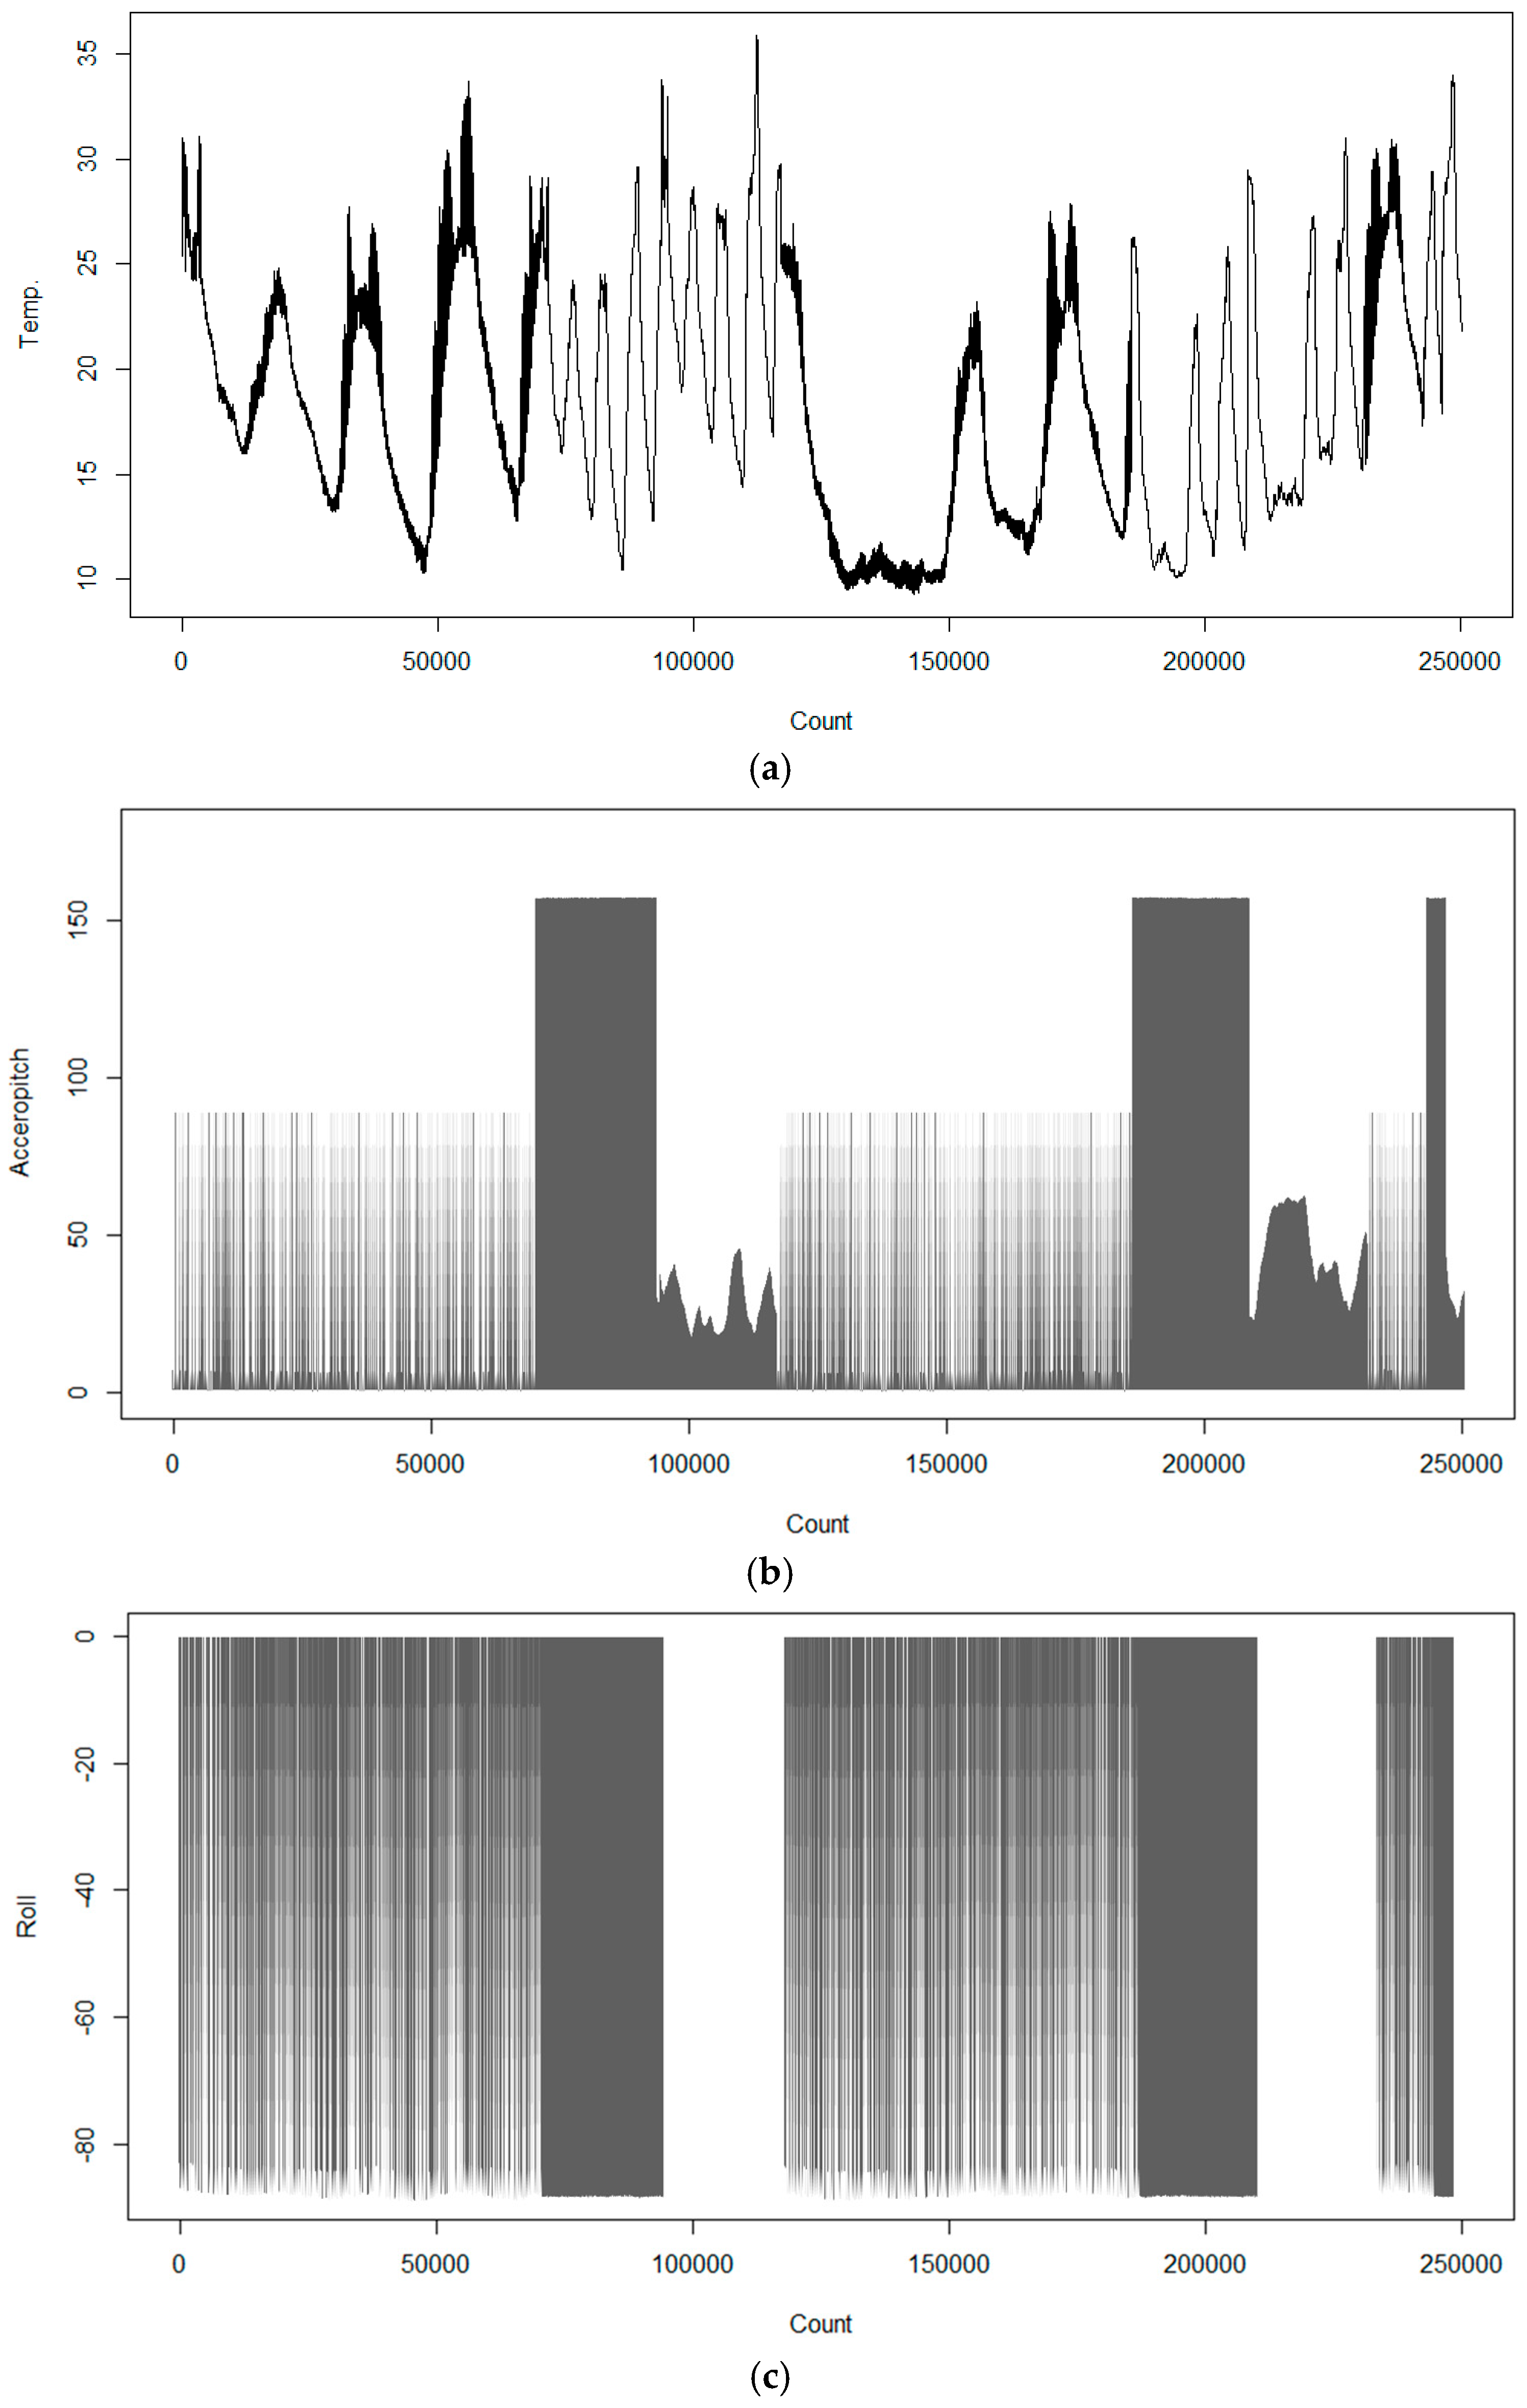
5.1. Big Data Set
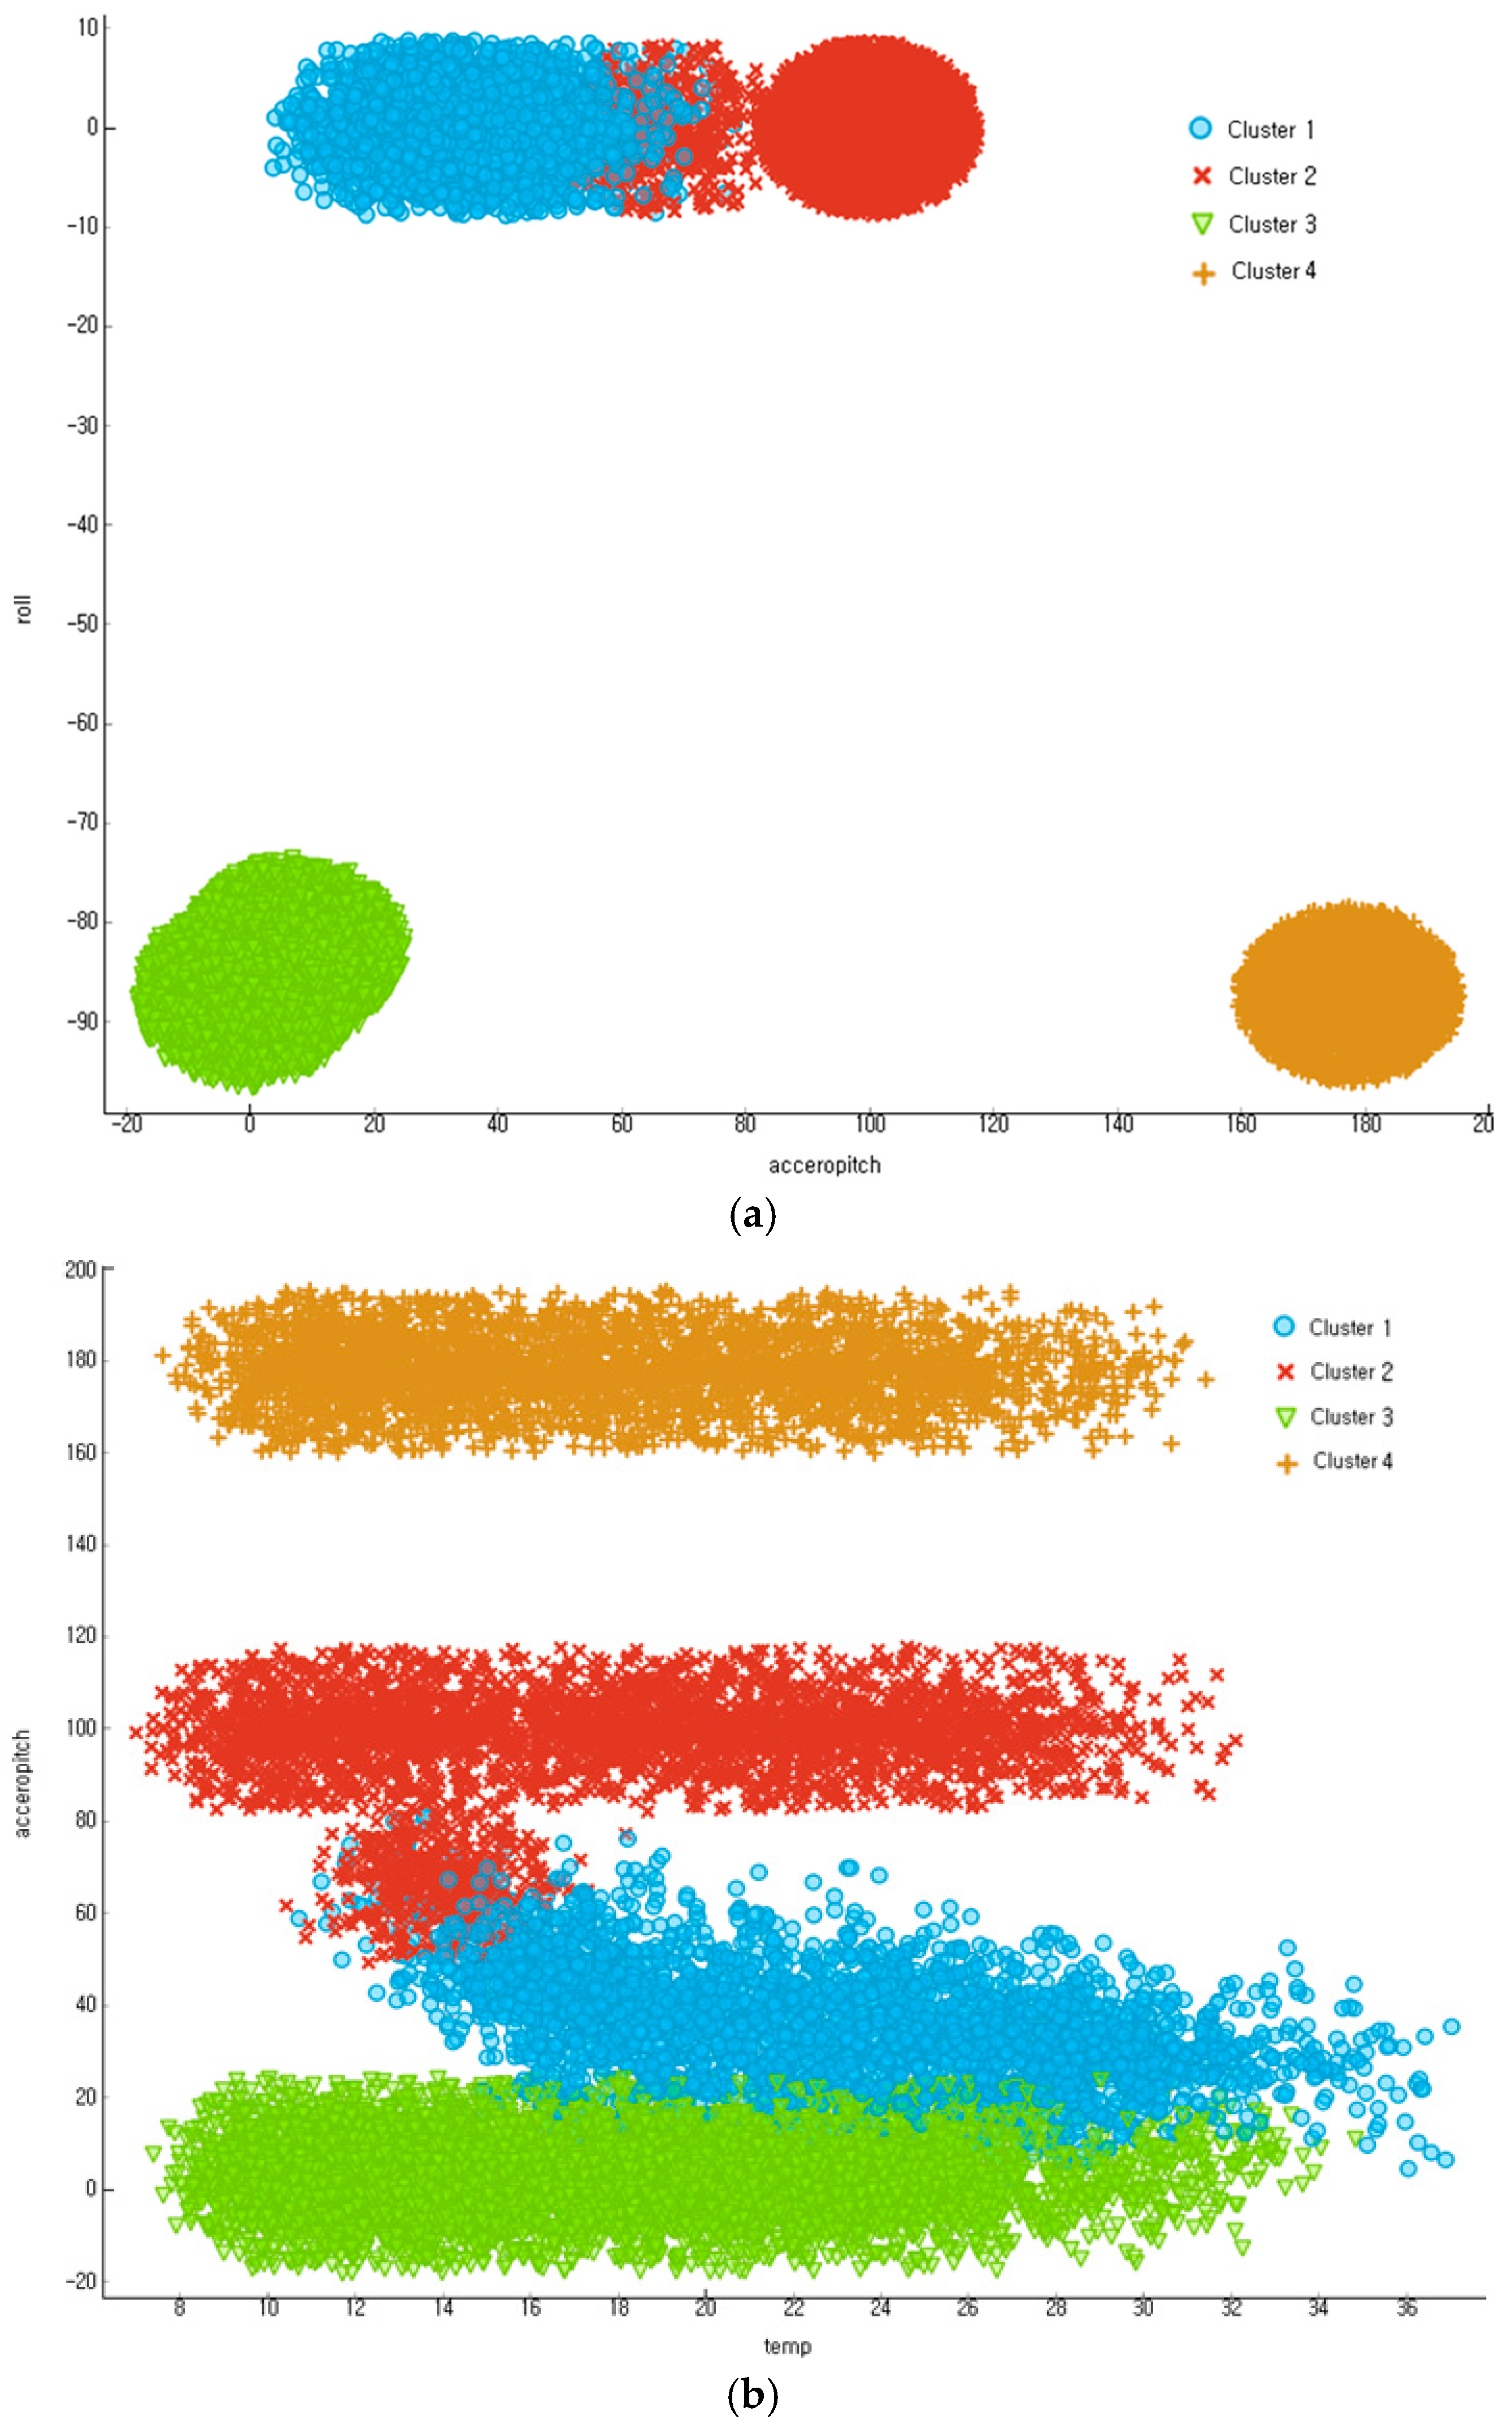
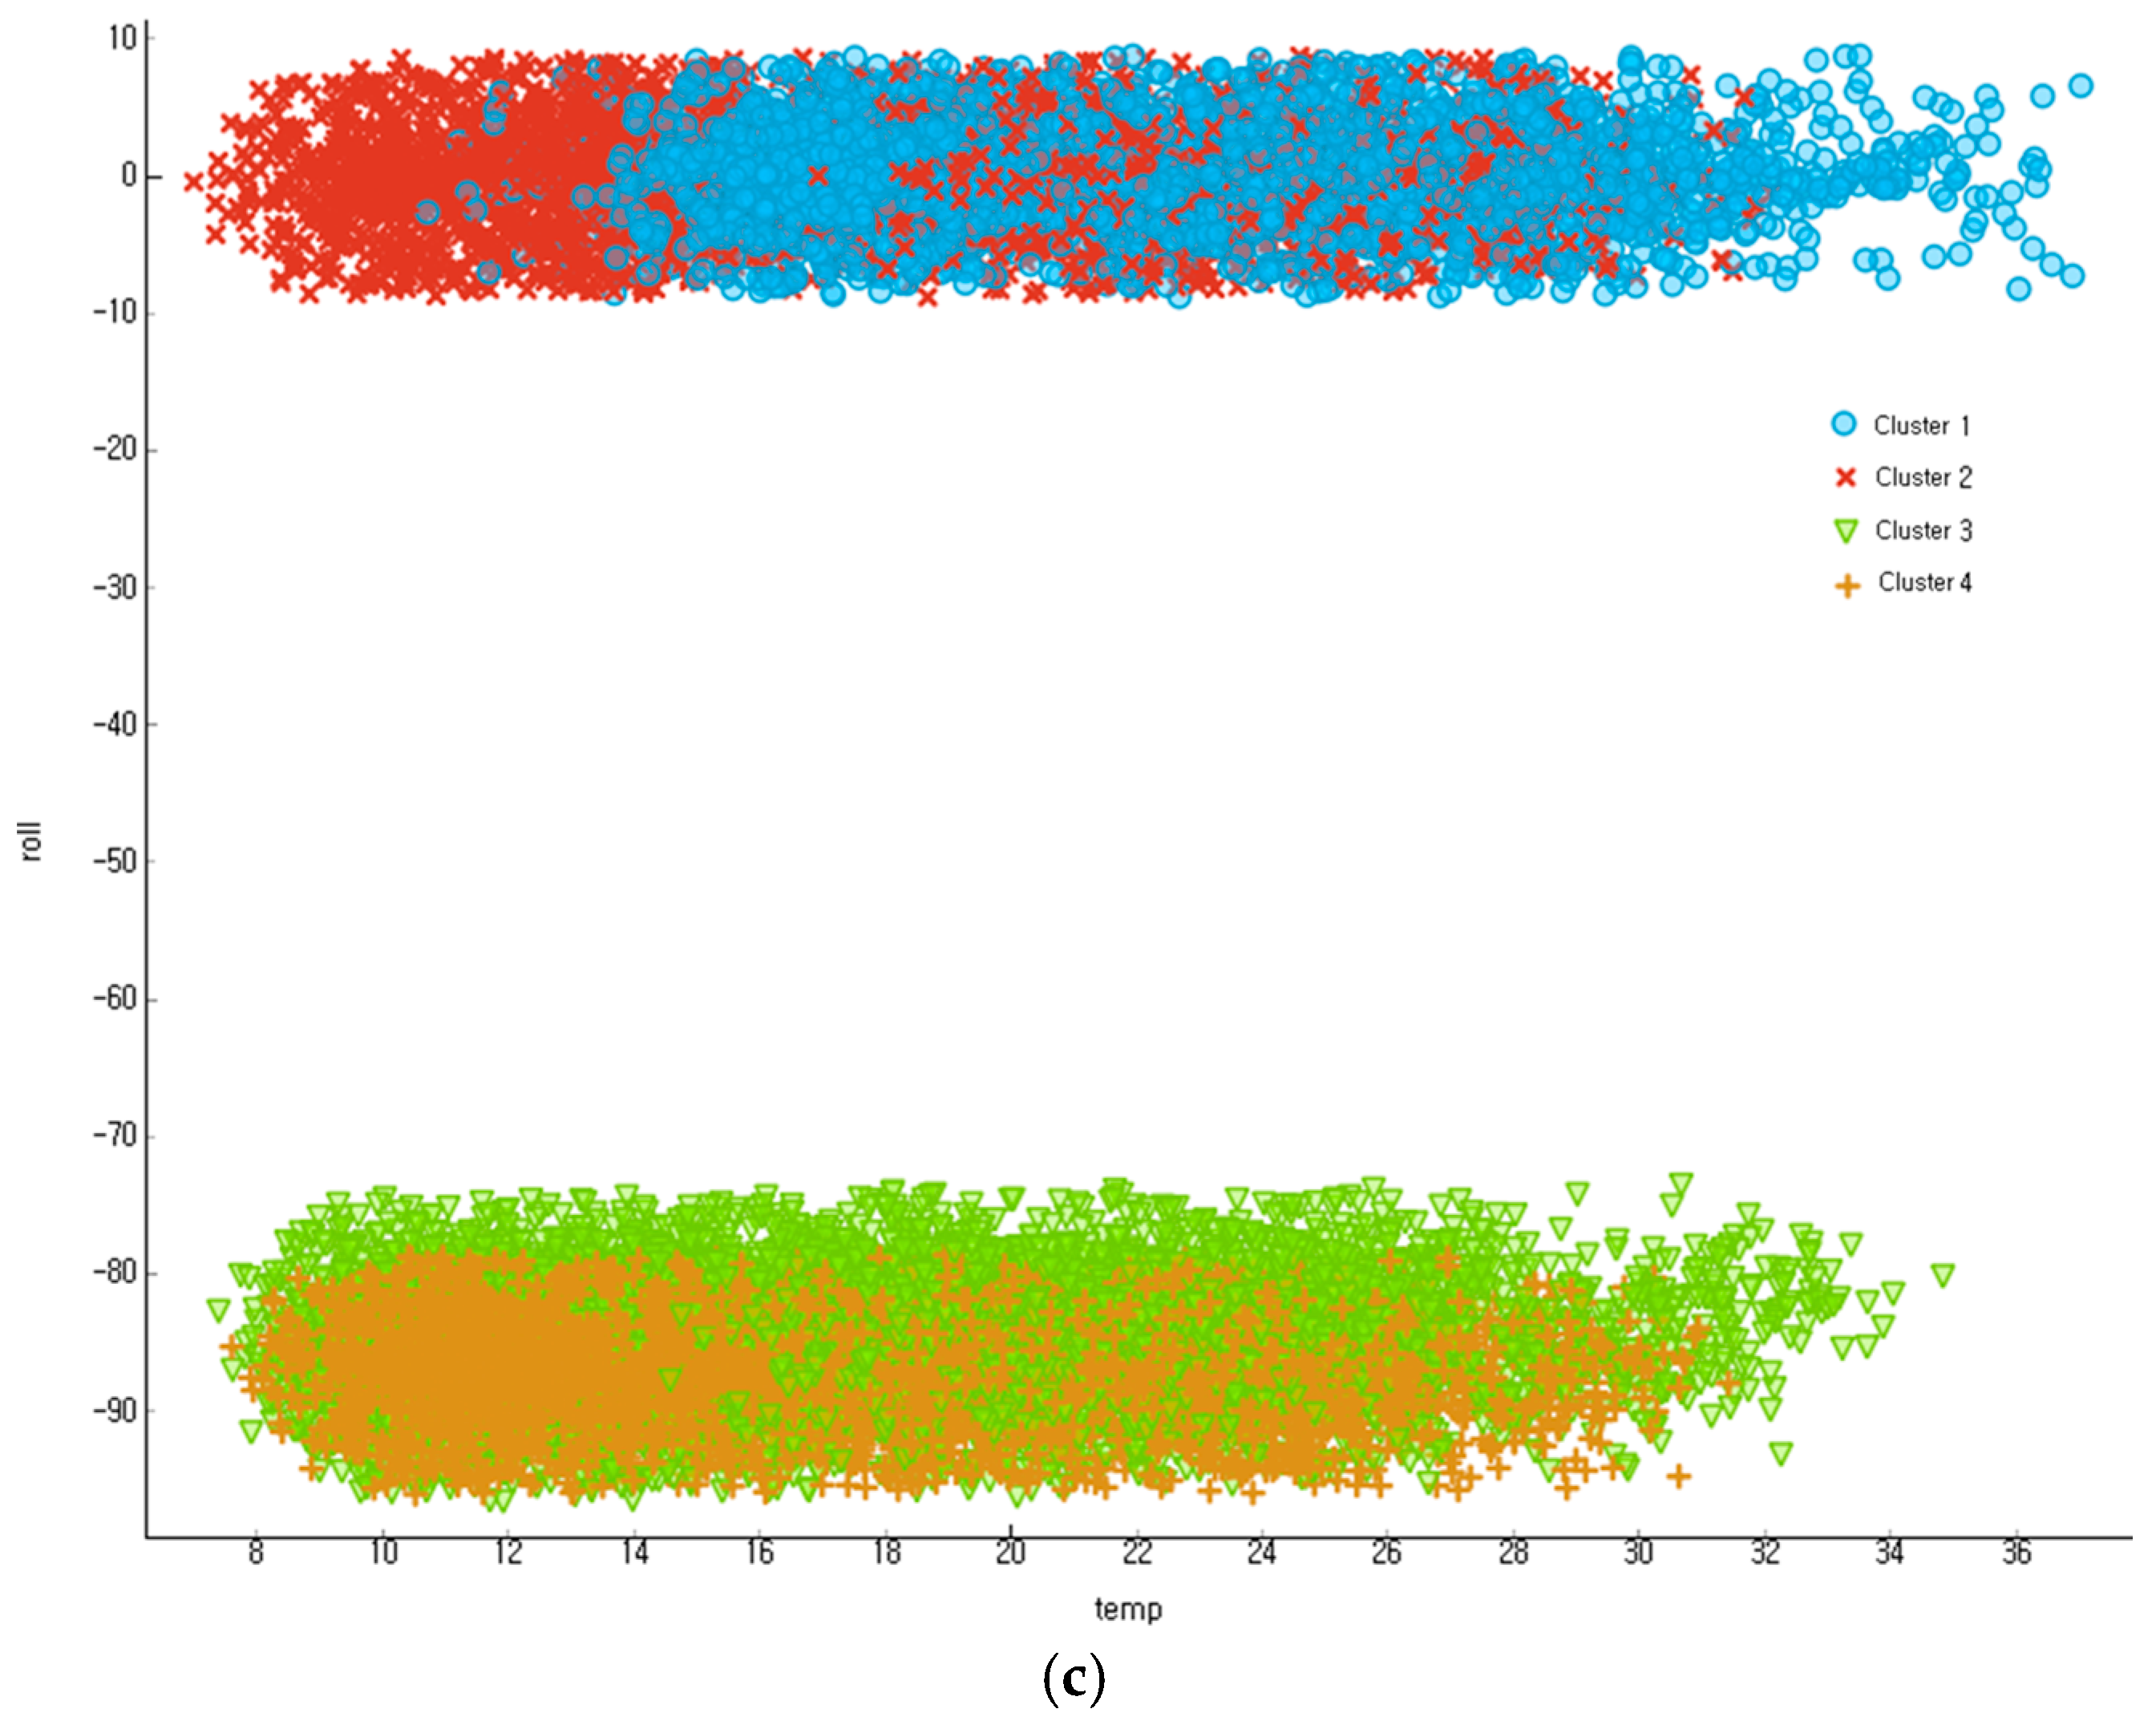
5.2. Clustering Result for the Outlier Recogniton of Transmission Line Tower Sensor Big Data
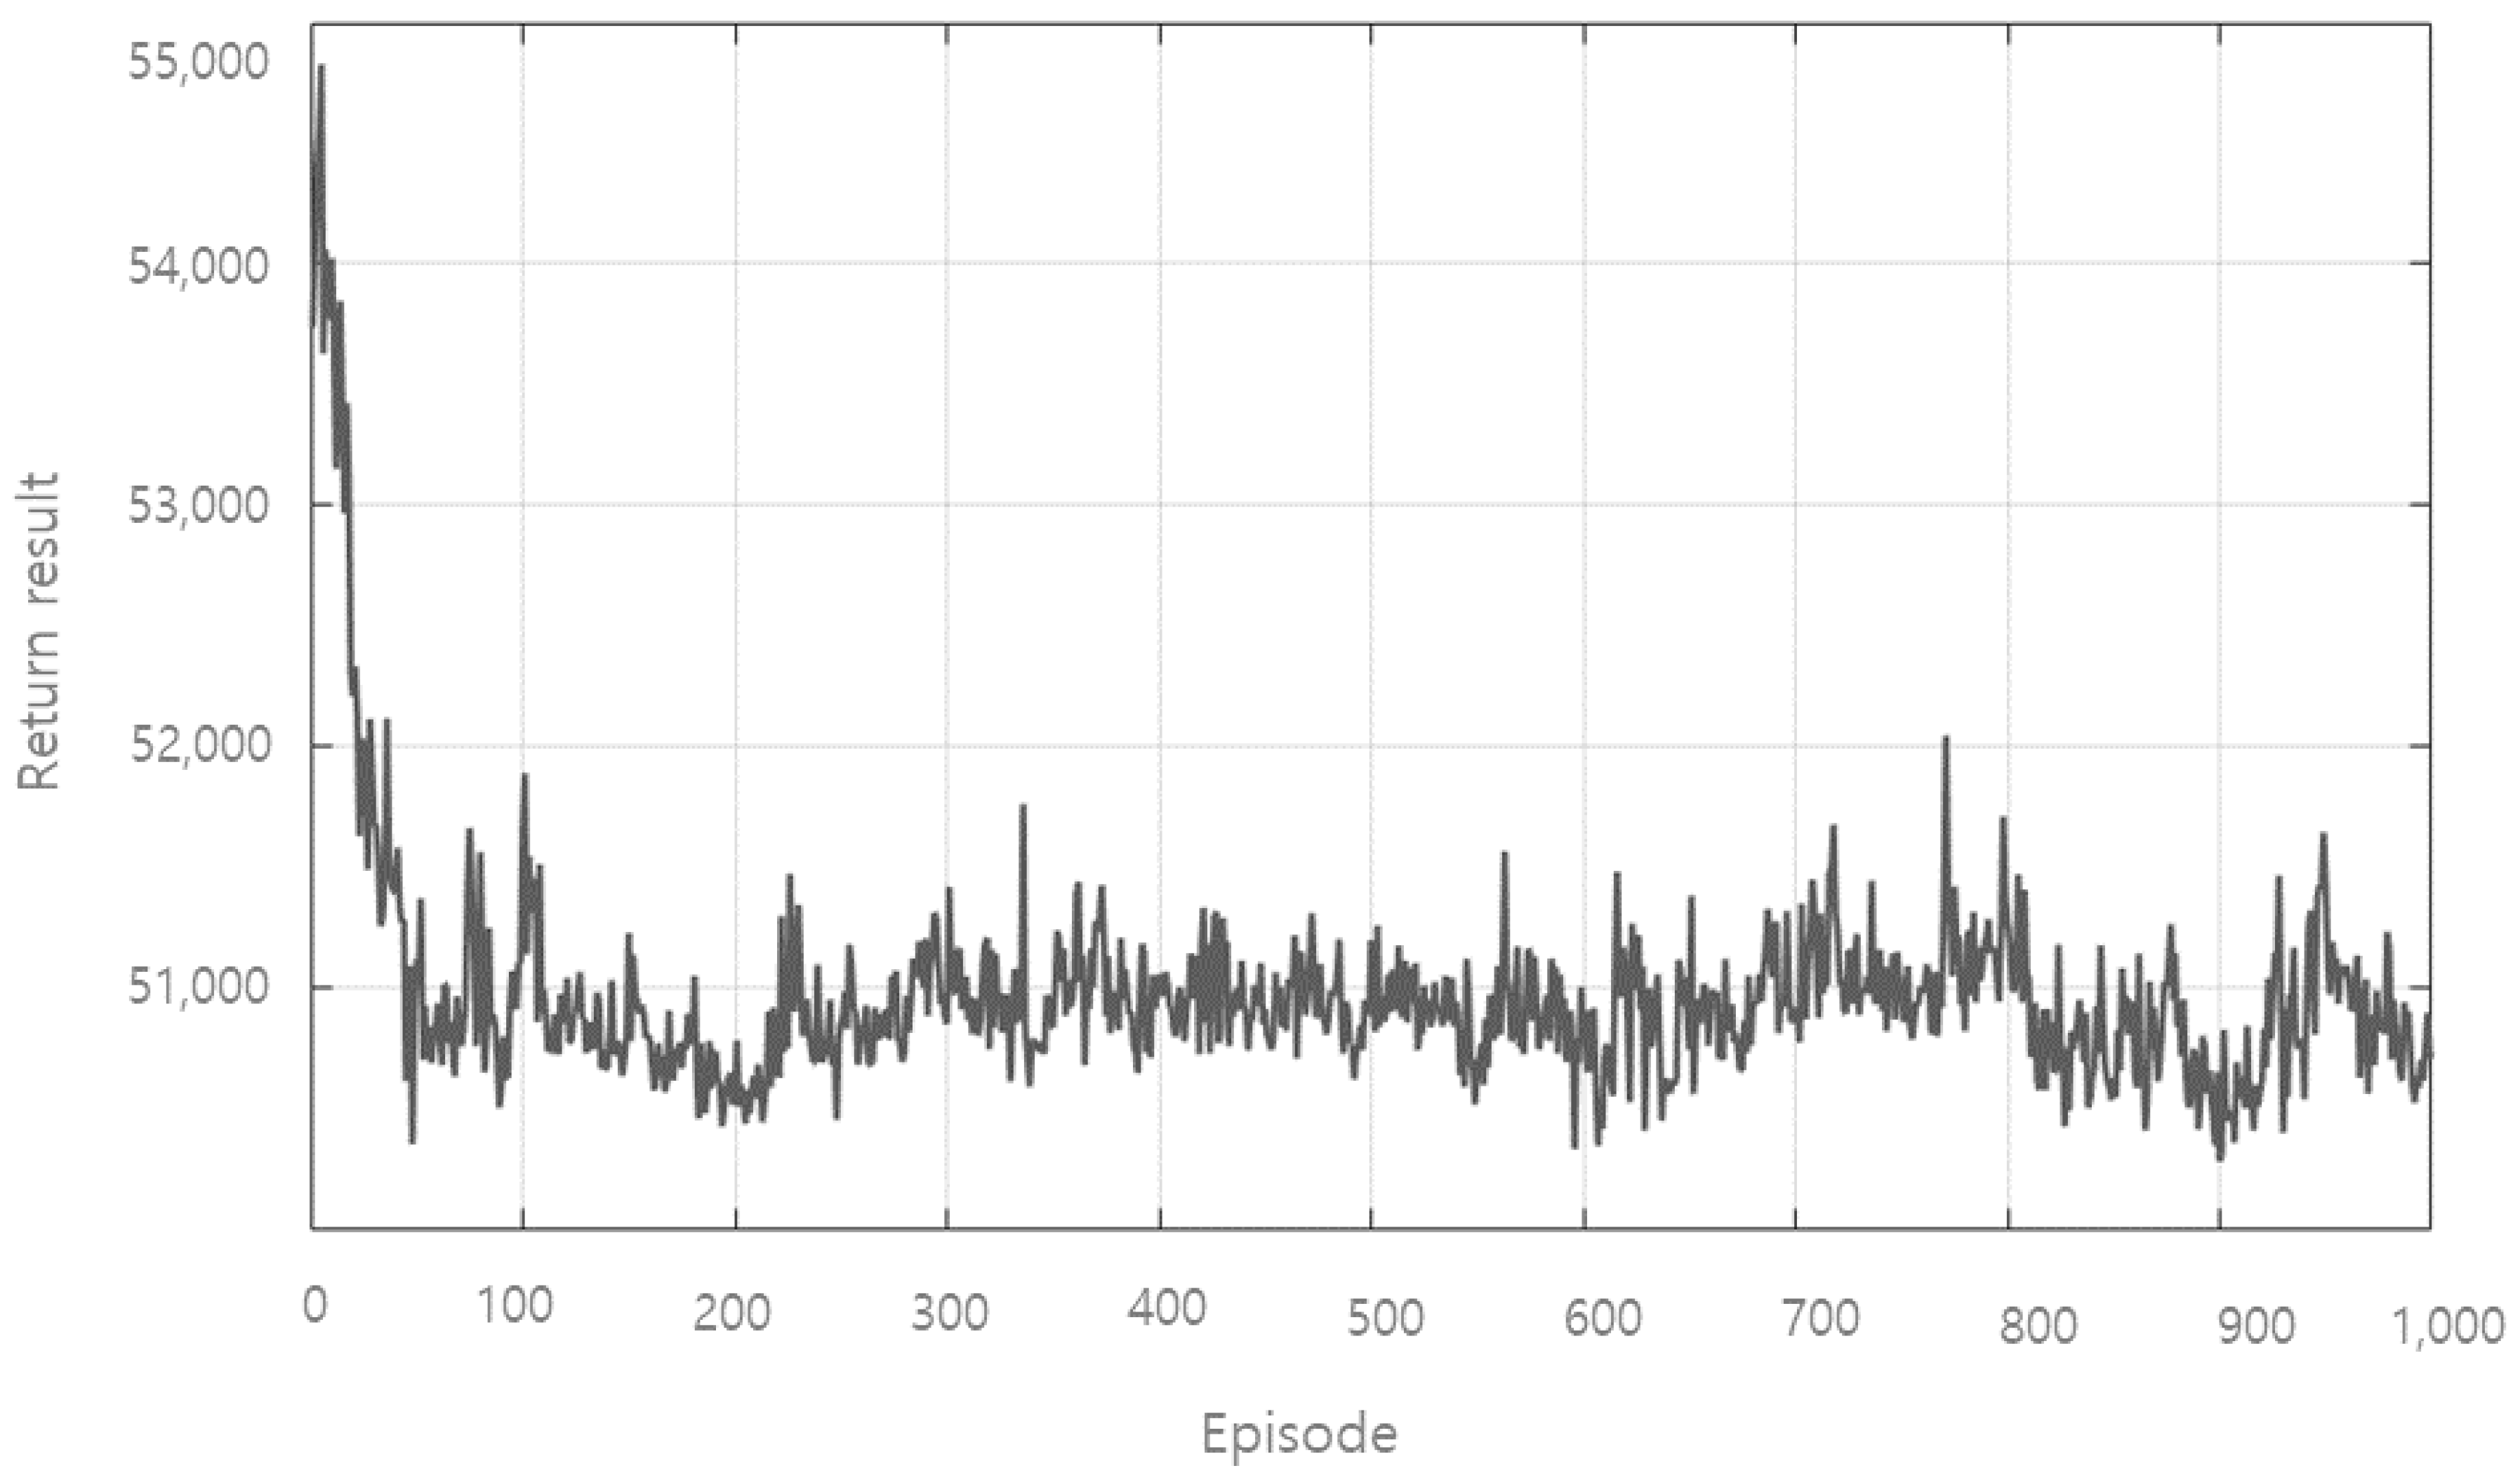
5.3. ADQL Result for Outlier Learning
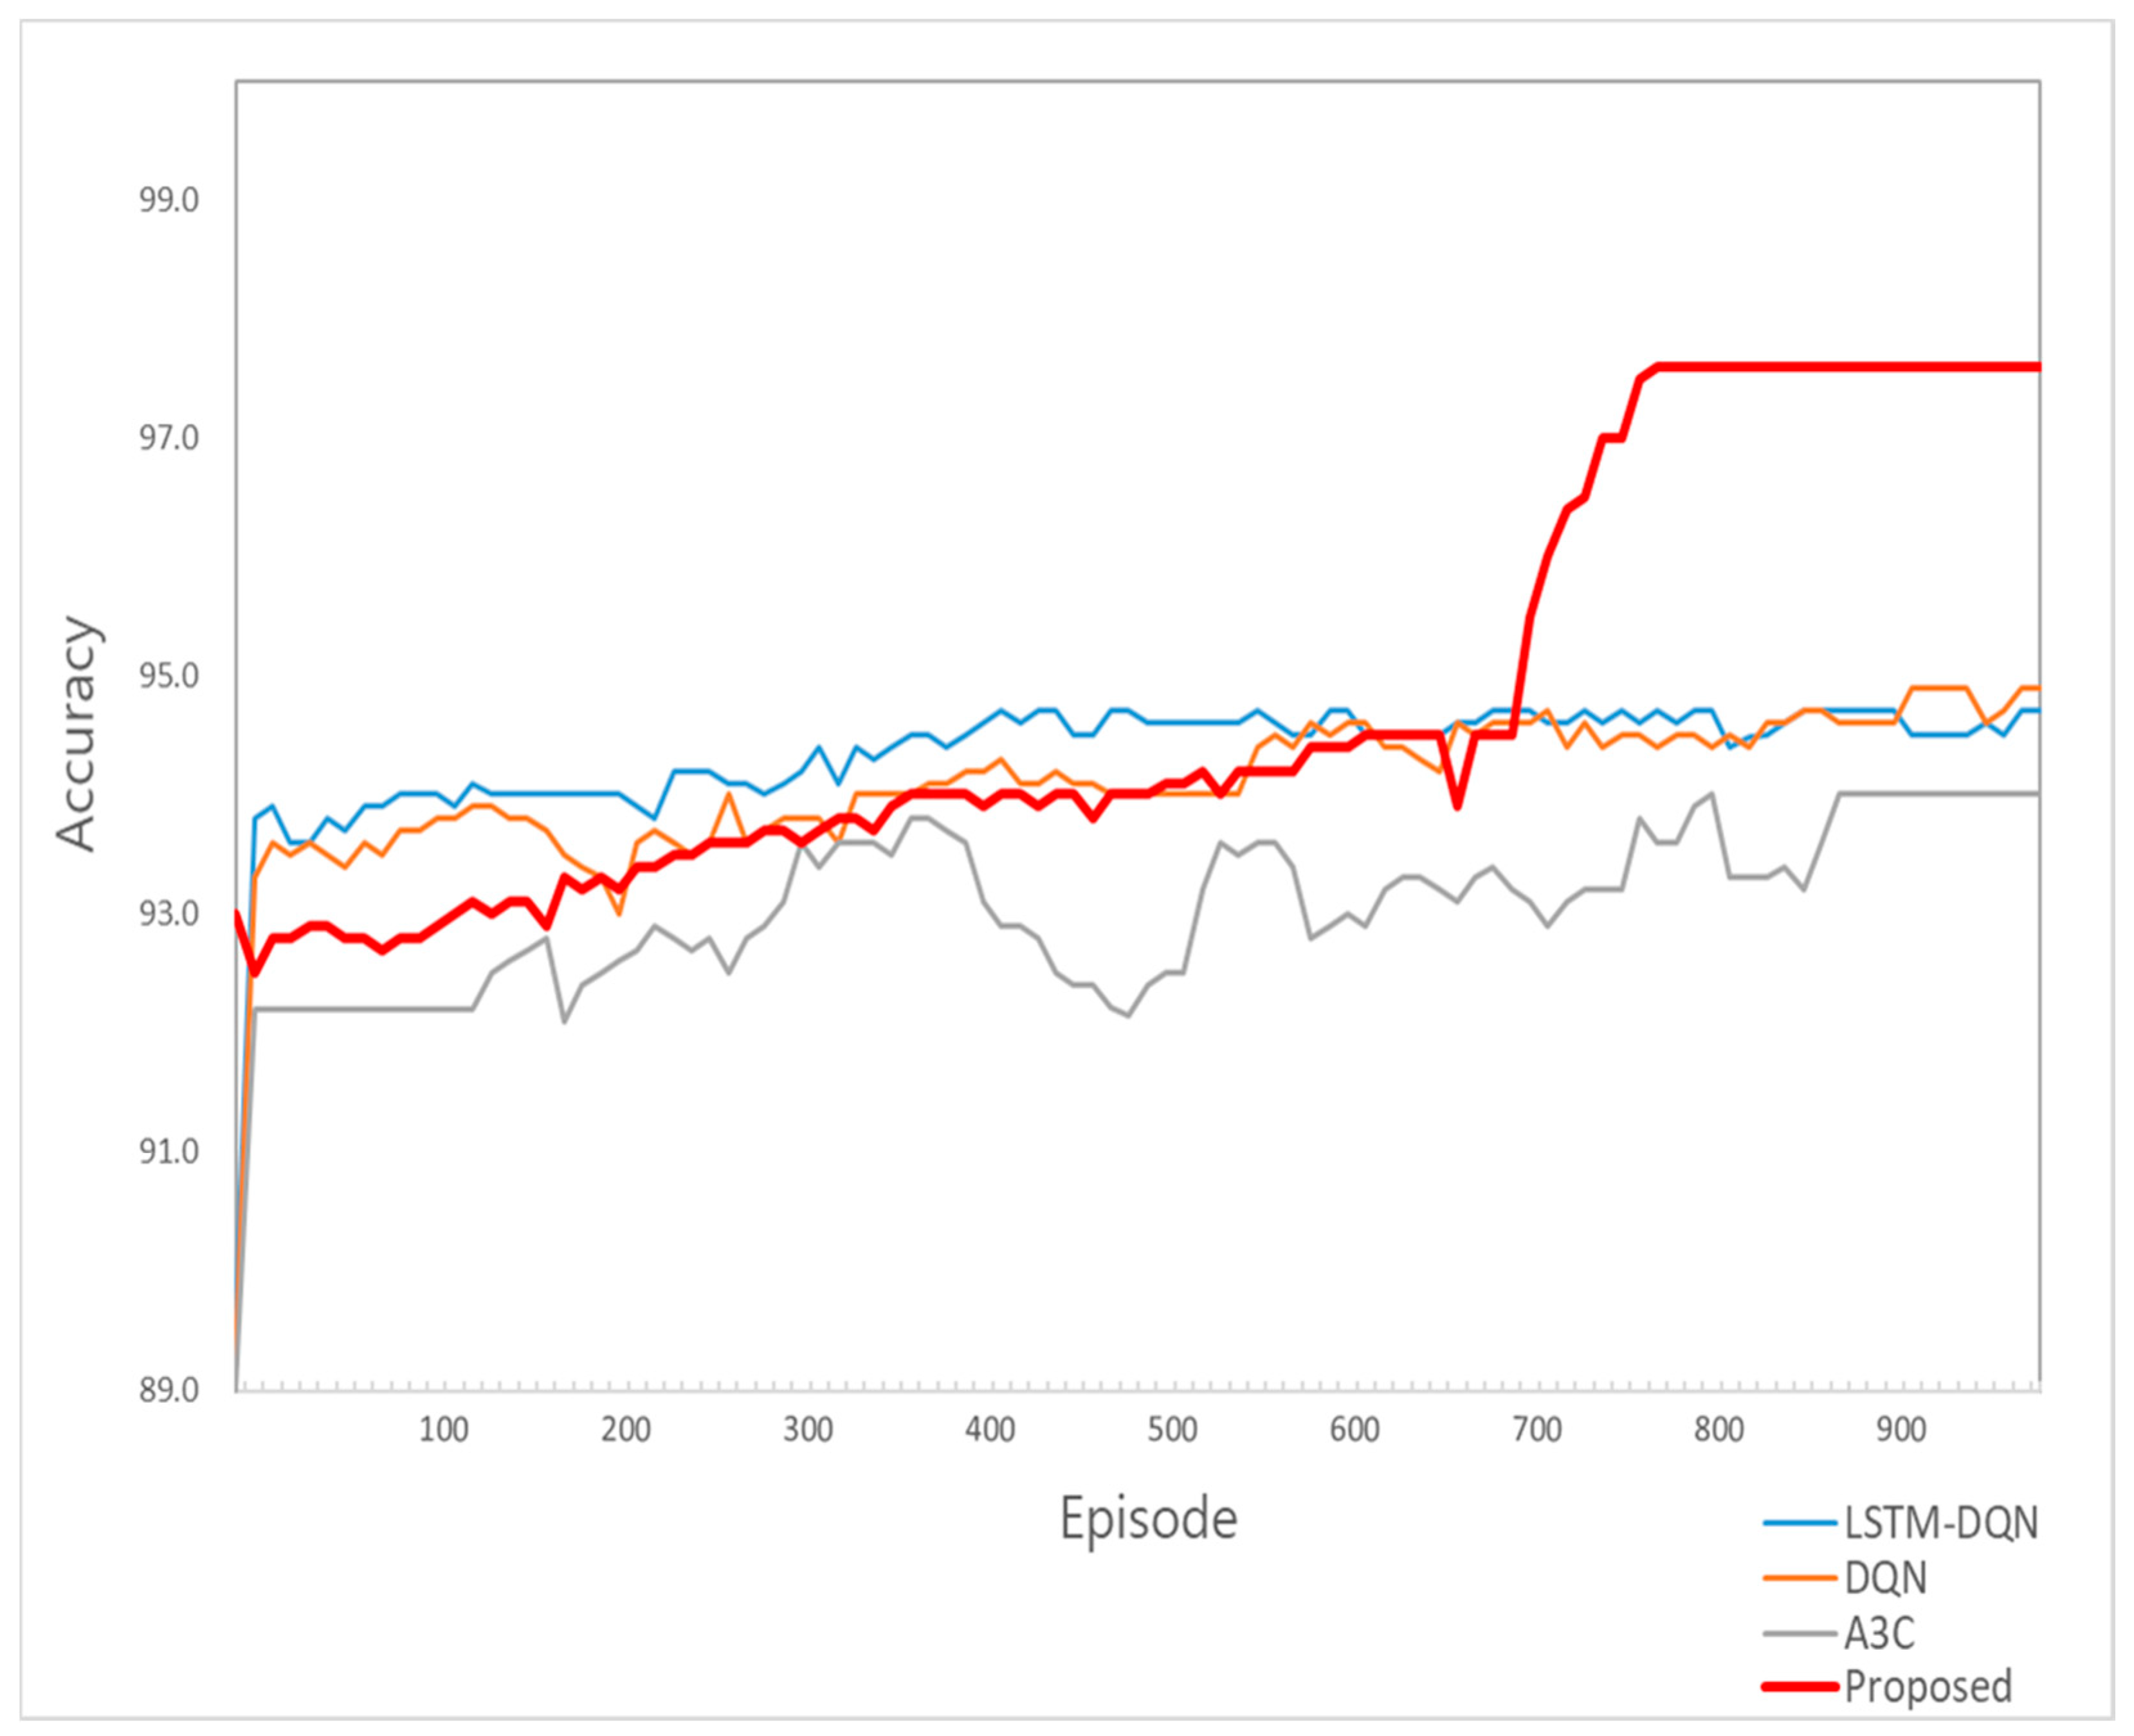
5.4. Comparison of Transmission Line Tower Big Data Prediction System
6. Conclusions
Author Contributions
Funding
Conflicts of Interest
Appendix A


References
- Trelewicz, J.Q. Big data and big money: The role of data in the financial sector. IT Prof. 2017, 19, 8–10. [Google Scholar] [CrossRef]
- Ngu, H.C.V.; Huh, J.H. B+-tree construction on massive data with Hadoop. Cluster Comput. 2017, 1–11. [Google Scholar] [CrossRef]
- Srinivasan, U.; Arunasalam, B. Leveraging big data analytics to reduce healthcare costs. IT Prof. 2013, 15, 21–28. [Google Scholar] [CrossRef]
- Islam, M.M.; Razzaque, M.A.; Hassan, M.M.; Ismail, W.N.; Song, B. Mobile cloud-based big healthcare data processing in smart cities. IEEE Access 2017, 5, 11887–11899. [Google Scholar] [CrossRef]
- Marjani, M.; Nasaruddin, F.; Gani, A.; Karim, A.; Hashem, I.A.T.; Siddiqa, A.; Yaqoob, I. Big IoT data analytics: Architecture, opportunities, and open research challenges. IEEE Access 2017, 5, 5247–5261. [Google Scholar]
- Satyanarayanan, M.; Simoens, P.; Xiao, Y.; Pillai, P.; Chen, Z.; Ha, K.; Hu, W.; Amos, B. Edge analytics in the internet of things. IEEE Pervasive Comput. 2015, 14, 24–31. [Google Scholar] [CrossRef]
- Sharma, S.K.; Wang, X. Live data analytics with collaborative edge and cloud processing in wireless iot networks. IEEE Access 2017, 5, 4621–4635. [Google Scholar] [CrossRef]
- He, X.; Ai, Q.; Qiu, R.C.; Huang, W.; Piao, L.; Liu, H. A big data architecture design for smart grids based on random matrix theory. IEEE Trans. Smart Grid 2017, 8, 674–686. [Google Scholar] [CrossRef]
- Sun, Y.; Song, H.; Jara, A.J.; Bie, R. Internet of things and big data analytics for smart and connected communities. IEEE Access 2016, 4, 766–773. [Google Scholar] [CrossRef]
- Ta-Shma, P.; Akbar, A.; Gerson-Golan, G.; Hadash, G.; Carrez, F.; Moessner, K. An ingestion and analytics architecture for iot applied to smart city use cases. IEEE Internet Things J. 2017, 5, 765–774. [Google Scholar] [CrossRef]
- Wedgwood, K.; Howard, R. Big Data and Analytics in Travel and Transportation; IBM Big Data and Analytics White Paper; IBM: Armonk, NY, USA, 2014. [Google Scholar]
- Hong, T. Data analytics: Making the smart grid smarter [guest editorial]. IEEE Power Energy Mag. 2018, 16, 12–16. [Google Scholar] [CrossRef]
- Bose, A. Smart transmission grid applications and their supporting infrastructure. IEEE Trans. Smart Grid 2010, 1, 11–19. [Google Scholar] [CrossRef]
- Meliopoulos, A.P.S.; Cokkinides, G.; Huang, R.; Farantatos, E.; Choi, S.; Lee, Y.; Yu, X. Smart grid technologies for autonomous operation and control. IEEE Trans. Smart Grid 2011, 2, 1–10. [Google Scholar] [CrossRef]
- Heydt, G.T. The next generation of power distribution systems. IEEE Trans. Smart Grid 2010, 1, 225–235. [Google Scholar] [CrossRef]
- Hou, W.; Ning, Z.; Guo, L.; Zhang, X. Temporal, functional and spatial big data computing framework for large-scale smart grid. IEEE Trans. Emerg. Top. Comput. 2018. [Google Scholar] [CrossRef]
- Zhou, K.; Fu, C.; Yang, S. Big data driven smart energy management: From big data to big insights. Renew. Sustain. Energy Rev. 2016, 56, 215–225. [Google Scholar] [CrossRef]
- Bhattarai, B.P.; Paudyal, S.; Luo, Y.; Mohanpurkar, M.; Cheung, K.; Tonkoski, R.; Manic, M. Big data analytics in smart grids: State-of-the-art, challenges, opportunities, and future directions. IET Smart Grid. 2019, 1–15. [Google Scholar] [CrossRef]
- Je, S.M.; Huh, J.H. An Optimized Algorithm and Test Bed for Improvement of Efficiency of ESS and Energy Use. Electronics 2018, 7, 388. [Google Scholar] [CrossRef]
- Je, S.M.; Huh, J.H. Estimation of Future Power Consumption Level in Smart Grid: Application of Fuzzy Logic and Genetic Algorithm on Big Data Platform; Wiley: Hoboken, NJ, USA, 2019; pp. 1–22, Accepted. [Google Scholar]
- Wu, J.; Ota, K.; Dong, M.; Li, J.; Wang, H. Big Data Analysis-Based Security Situational Awareness for Smart Grid. IEEE Trans. Big Data 2018, 4, 408–417. [Google Scholar] [CrossRef]
- Sun, L.; Zhou, K.; Zhang, X.; Yang, S. Outlier Data Treatment Methods toward Smart Grid Applications. IEEE Access 2018, 6, 39849–39859. [Google Scholar] [CrossRef]
- Jung, S.H.; Kim, J.C.; Sim, C.B. Prediction data processing scheme using an artificial neural network and data clustering for Big Data. Int. J. Electr. Comput. Eng. 2016, 6, 330–336. [Google Scholar] [CrossRef]
- Li, D.; Jayaweera, S.K. Machine-learning aided optimal customer decision for an interactive smart grid. IEEE Syst. J. 2015, 9, 1529–1540. [Google Scholar] [CrossRef]
- Ghorbani, M.J.; Choudhry, M.A.; Feliachi, A. A multiagent design for power distribution systems automation. IEEE Trans. Smart Grid 2016, 7, 329–339. [Google Scholar] [CrossRef]
- He, Y.B.; Mendis, G.J.; Wei, J. Real-time detection of false data injection attacks in smart grid: A deep learning-based intelligent mechanism. IEEE Trans. Smart Grid 2017, 8, 2505–2516. [Google Scholar] [CrossRef]
- Venayagamoorthy, G.K.; Sharma, R.K.; Gautam, P.K.; Ahmadi, A. Dynamic energy management system for a smart microgrid. IEEE Trans. Neural Netw. Learn. Syst. 2016, 27, 1643–1656. [Google Scholar] [CrossRef] [PubMed]
- Thapa, R.; Jiao, L.; Oommen, B.J.; Yazidi, A. A Learning Automaton-Based Scheme for Scheduling Domestic Shiftable Loads in Smart Grids. IEEE Access 2018, 6, 5348–5361. [Google Scholar] [CrossRef]
- Palensky, P.; Dietrich, D. Demand side management: Demand response intelligent energy systems and smart loads. IEEE Trans. Ind. Inf. 2011, 7, 381–388. [Google Scholar] [CrossRef]
- Jung, S.H.; Kim, J.C.; Sim, C.B. A Novel Data Prediction Model using Data Weights and Neural Network based on R for Meaning Analysis between Data. J. Korean Multimed. Soc. 2015, 18, 524–532. [Google Scholar] [CrossRef][Green Version]
- Martínez-Parrales, R.; Fuerte-Esquivel, C.R. A new unified approach for the state estimation and bad data analysis of electric power transmission systems with multi-terminal VSC-based HVDC networks. J. Electr. Power Syst. Res. 2018, 160, 251–260. [Google Scholar] [CrossRef]
- Cho, H.S.; Yamazaki, T.; Hahn, M.S. AERO: Extraction of user’s activities from electric power consumption data. IEEE Trans. Consum. Electron. 2010, 56, 2011–2018. [Google Scholar] [CrossRef]
- Jung, S.H.; Shin, C.S.; Cho, Y.Y.; Park, J.W.; Park, M.H.; Kim, Y.H.; Lee, S.B.; Sim, C.B. Analysis Process based on Modify K-means for Efficiency Improvement of Electric power Data Pattern Detection. J. Korean Multimed. Soc. 2017, 20, 1960–1969. [Google Scholar]
- Kroposki, B.; Johnson, B.; Zhang, Y.; Gevorgian, V.; Denholm, P.; Hodge, B.M.; Hannegan, B. Achieving a 100% Renewable Grid: Operating electric power Systems with Extremely High Levels of Variable Renewable Energy. IEEE Power Energy Mag. 2017, 15, 61–73. [Google Scholar] [CrossRef]
- Schwefel, H.-P.; Zhang, Y.J.; Wietfeld, C.; Mohsenian-Rad, H. Emerging Technologies Initiative ‘Smart Grid Communications’: Information Technology for Smart Utility Grids. In Proceedings of the 2018 IEEE International Conference on Communications, Control, and Computing Technologies for Smart Grids (SmartGridComm), Aalborg, Denmark, 29–31 October 2018. [Google Scholar]
- Wesoly, M.; Ciosek, P. Comparison of various data analysis techniques applied for the classification of pharmaceutical samples by electronic tongue. Sens. Actuators B Chem. 2018, 267, 570–580. [Google Scholar] [CrossRef]
- Liébana-Cabanillas, F.; Muñoz-Leiva, F.; Sánchez-Fernández, J. A global approach to the analysis of user behavior in mobile payment systems in the new electronic environment. Serv. Bus. 2018, 12, 25–64. [Google Scholar] [CrossRef]
- Mora-Florez, J.; Barrera-Nuez, V.; Carrillo-Caicedo, G. Fault Location in Power Distribution Systems Using a Learning Algorithm for Multivariable Data Analysis. IEEE Trans. Power Deliv. 2007, 22, 1715–1721. [Google Scholar] [CrossRef]
- Jung, S.H.; Shin, C.S.; Cho, Y.Y.; Park, J.W.; Park, M.H.; Kim, Y.H.; Lee, S.B.; Sim, C.B. A Novel of Data Clustering Architecture for Outlier Detection to Electric Power Data Analysis. Kips Trans. Softw. Data Eng. 2017, 6, 465–472. [Google Scholar]
- Park, M.H.; Kim, Y.H.; Lee, S.B. A study on the Development of Energy IoT Platform. Kips Trans. Comp. Comm. Sys. 2016, 5, 311–318. [Google Scholar] [CrossRef][Green Version]
- Park, S.; Han, S.; Son, Y. Demand power forecasting with data mining method in smart grid. In Proceedings of the 2017 IEEE Innovative Smart Grid Technologies-Asia (ISGT-Asia), Auckland, New Zealand, 4–7 December 2017; pp. 1–6. [Google Scholar]
- Luo, F.; Zhao, J.; Dong, Z.Y.; Chen, Y.; Xu, Y.; Zhang, X.; Wong, K.P. Cloud-based information infrastructure for next-generation power grid: Conception, architecture, and applications. IEEE Trans. Smart Grid 2016, 7, 1896–1912. [Google Scholar] [CrossRef]
- Hartigan, J.A.; Wong, M.A. Algorithm AS 136: A k-means clustering algorithm. J. R. Stat. Soc. Ser. C 1979, 28, 100–108. [Google Scholar] [CrossRef]
- Jung, S.H.; Kim, J.C. CkLR Algorithm for Improvement of Data Prediction and Accuracy Based on Clustering Data. Int. J. Softw. Eng. Knowl. Eng. 2019, 29, 631–652. [Google Scholar] [CrossRef]
- Zhang, G.; Zhang, C.; Zhang, H. Improved K-means algorithm based on density Canopy. Knowl.-Based Syst. 2018, 145, 289–297. [Google Scholar] [CrossRef]
- Shrivastava, P.; Sahoo, L.; Pandey, M.; Agrawal, S. AKM—Augmentation of K-Means Clustering Algorithm for Big Data. In Intelligent Engineering Informatics; Springer: Singapore, 2018; pp. 103–109. [Google Scholar]
- Jia, C.; Zuo, Y.; Zou, Q. O-GlcNAcPRED-II: An integrated classification algorithm for identifying O-GlcNAcylation sites based on fuzzy undersampling and a K-means PCA oversampling technique. Bioinformatics 2018, 34, 2029–2036. [Google Scholar] [CrossRef] [PubMed]
- Shakeel, P.M.; Baskar, S.; Dhulipala, V.S.; Jaber, M.M. Cloud based framework for diagnosis of diabetes mellitus using K-means clustering. Health Inf. Sci. Syst. 2018, 6, 16. [Google Scholar] [CrossRef] [PubMed]
- Ahlqvist, E.; Storm, P.; Käräjämäki, A.; Martinell, M.; Dorkhan, M.; Carlsson, A.; Vikman, P.; Prasad, R.B.; Aly, D.M.; Almgren, P.; et al. Novel subgroups of adult-onset diabetes and their association with outcomes: A data-driven cluster analysis of six variables. Lancet Diabetes Endocrinol. 2018, 6, 361–369. [Google Scholar] [CrossRef]
- Macqueen, J. Some methods for classification and analysis of multivariate observations. In Proceedings of the Fifth Berkeley Symposium on Mathematical Statistics and Probability; University of California Press: Berkeley, CA, USA, 1967; Volume 1, pp. 281–297. [Google Scholar]
- Zhang, K.; Bi, W.; Zhang, X.; Fu, X.; Zhou, K.; Zhu, L. A New K-means Clustering Algorithm for Point Cloud. J. Hybrid Inf. Technol. 2015, 8, 157–170. [Google Scholar] [CrossRef]
- Yuan, F.; Meng, Z.H.; Zhangz, H.X.; Dong, C.R. A New Algorithm to Get the Initial Centroids. In Proceeding of the 3rd International Conference on Machine Learning and Cybernetics, Shanghai, China, 26–29 August 2004; pp. 26–29. [Google Scholar]
- Jung, S.H.; Kim, J.C. Efficiency Improvement of Classification Model Based on Altered K-Means Using PCA and Outlier. Int. J. Softw. Eng. Knowl. Eng. 2019, 29, 693–713. [Google Scholar] [CrossRef]
- Watkins, C.J.; Dayan, P. Q-Learning. J. Mach. Learn. 1992, 8, 279–292. [Google Scholar] [CrossRef]
- Zhang, Q.; Lin, M.; Yang, L.T.; Chen, Z.; Khan, S.U.; Li, P. A double deep Q-learning model for energy-efficient edge scheduling. IEEE Trans. Serv. Comput. 2018. [Google Scholar] [CrossRef]
- Van Hasselt, H.; Guez, A.; Silver, D. Deep reinforcement learning with double q-learning. In Proceedings of the Thirtieth AAAI Conference on Artificial Intelligence, Phoenix, AZ, USA, 12–17 February 2016. [Google Scholar]
- Gu, S.; Lillicrap, T.; Sutskever, I.; Levine, S. Continuous deep q-learning with model-based acceleration. arXiv 2016, arXiv:1603.00748. [Google Scholar]
- Mnih, V.; Kavukcuoglu, K.; Silver, D.; Rusu, A.A.; Veness, J.; Bellemare, M.G.; Petersen, S. Human-level control through deep reinforcement learning. Nature 2015, 518, 529. [Google Scholar] [CrossRef]
- Mnih, V.; Kavukcuoglu, K.; Silver, D.; Graves, A. Playing atari with deep reinforcement learning. arXiv 2013, arXiv:1312.5602. [Google Scholar]
- Frank, M.J.; Moustafa, A.A.; Haughey, H.M.; Curran, T.; Hutchison, K.E. Genetic triple dissociation reveals multiple roles for dopamine in reinforcement learning. Proc. Natl. Acad. Sci. USA 2007, 104, 16311–16316. [Google Scholar] [CrossRef] [PubMed]
- Arulkumaran, K.; Deisenroth, M.P.; Brundage, M.; Bharath, A.A. A Brief Survey of Deep Reinforcement Learning. arXiv 2017, arXiv:1708.05866. [Google Scholar] [CrossRef]
- Mnih, V.; Badia, A.P.; Mirza, M.; Graves, A.; Lillicrap, T.P.; Harley, T.; Silver, D.; Kavukcuoglu, K. Asynchronous methods for deep reinforcement learning. In Proceedings of the International Conference on Machine Learning (ICML 2016), New York, NY, USA, 19–24 June 2016; pp. 1928–1937. [Google Scholar]
- Kulkarni, T.D.; Saeedi, A.; Gautam, S. Deep Successor Reinforcement Learning. arXiv 2016, arXiv:1606.02396. [Google Scholar]
- Gregor, K.; Rezende, D.J.; Wierstra, D. Variational intrinsic control. arXiv 2016, arXiv:1611.07507. [Google Scholar]
- Ostrovski, G.; Bellemare, M.G.; van de Oord, A.; Munos, R. Count-based exploration with neural density models. In Proceedings of the Machine Learning Research (PMLR 2017), Sydney, NSW, Australia, 6–11 August 2017. [Google Scholar]
- Jaderberg, M.; Mnih, V.; Czarnecki, W.M.; Schaul, T.; Leibo, J.Z.; Silver, D.; Kavukcuoglu, K. Reinforcement learning with unsupervised auxiliary tasks. arXiv 2016, arXiv:1611.05397. [Google Scholar]
- Kansky, K.; Silver, T.; Mély, D.A.; Eldawy, M.; Lázaro-Gredilla, M.; Lou, X.; Dorfman, N.; Sidor, S.; Phoenix, S.; George, D. Schema Networks: Zero-shot Transfer with a Generative Causal Model of Intuitive Physics. arXiv 2017, arXiv:1706.04317. [Google Scholar]
- Fernando, C.; Banarse, D.; Blundell, C.; Zwols, Y.; Ha, D.; Rusu, A.A.; Pritzel, A.; Wierstra, D. Pathnet: Evolution channels gradient descent in super neural networks. arXiv 2017, arXiv:1701.08734. [Google Scholar]
- Yin, L.; Yu, T.; Zhou, L.; Huang, L.; Zhang, X.; Zheng, B. Artificial emotional reinforcement learning for automatic generation control of large-scale interconnected power grids. IET Gener. Transm. Distrib. 2017, 11, 2305–2313. [Google Scholar] [CrossRef]
- Yu, T.; Zhou, B.; Chan, K.W.; Chen, L.; Yang, B. Stochastic optimal relaxed automatic generation control in non-markov environment based on multi-step Q(λ) learning. IEEE Trans. Power Syst. 2011, 26, 1272–1282. [Google Scholar] [CrossRef]
- Yan, Z.; Xu, Y. Data-Driven Load Frequency Control for Stochastic Power Systems: A Deep Reinforcement Learning Method with Continuous Action Search. IEEE Trans. Power Syst. 2019, 34, 1653–1656. [Google Scholar] [CrossRef]
- Zhang, D.; Han, X.; Deng, C. Review on the Research and Practice of Deep Learning and Reinforcement Learning in Smart Grids. J. Power Energy Syst. 2018, 4, 362–370. [Google Scholar]
- Ruelens, F.; Claessens, B.J.; Vandeal, S.; De Schutter, B.; Babuška, R.; Belmans, R. Residential demand response of thermostatically controlled loads using batch reinforcement learning. IEEE Trans. Smart Grid 2017, 8, 2149–2159. [Google Scholar] [CrossRef]
- Wen, Z.; O’ Neill, D.; Maei, H. Optimal demand response using device-based reinforcement learning. IEEE Trans. Smart Grid 2015, 6, 2312–2324. [Google Scholar] [CrossRef]
- Silver, D.; Schrittwieser, J.; Simonyan, K.; Antonoglou, I.; Huang, A.; Guez, A.; Hubert, T.; Baker, L.; Lai, M.; Bolton, A.; et al. Mastering the game of go without human knowledge. Nature 2017, 550, 354. [Google Scholar] [CrossRef]
- Lee, S.; Huh, J.H. An effective security measures for nuclear power plant using big data analysis approach. J. Supercomput. 2018, 1–28. [Google Scholar]
- Ma, G.; Jiang, L.; Xu, G.; Zheng, J. A Model of Intelligent Fault Diagnosis of Power Equipment Based on CBR. Math. Probl. Eng. 2015, 2015, 203083. [Google Scholar] [CrossRef]
- Jennings, C.; Wu, D.; Terpenny, J. Forecasting Obsolescence Risk and Product Life Cycle with Machine Learning. IEEE Trans. Compon. Packag. Manuf. Technol. 2016, 6, 1428–1439. [Google Scholar] [CrossRef]
- Verma, P.; Singh, P.; Yadava, R.D.S. Fuzzy c-means clustering based outlier detection for SAW electronic nose. In Proceedings of the 2017 2nd International Conference for Convergence in Technology (I2CT), Mumbai, India, 7–9 April 2017; pp. 513–519. [Google Scholar]
- Gupta, M.; Gao, J.; Aggarwal, C.C.; Han, J. Outlier detection for temporal data: A survey. IEEE Trans. Knowl. Data Eng. 2014, 26, 2250–2267. [Google Scholar] [CrossRef]
- Alves, W.; Martins, D.; Bezerra, U.; Klautau, A. A Hybrid Approach for Big Data Outlier Detection from Electric Power SCADA System. IEEE Lat. Am. Trans. 2017, 15, 57–64. [Google Scholar] [CrossRef]
- Xiong, J.; Ren, J.; Chen, L.; Yao, Z.; Lin, M.; Wu, D.; Niu, B. Enhancing Privacy and Availability for Data Clustering in Intelligent Electrical Service of IoT. IEEE Internet Things J. 2019, 6, 1530–1540. [Google Scholar] [CrossRef]
- Salehi, M.; Leckie, C.; Bezdek, J.C.; Vaithianathan, T.; Zhang, X. Fast Memory Efficient Local Outlier Detection in Data Streams. IEEE Trans. Knowl. Data Eng. 2016, 28, 3246–3260. [Google Scholar] [CrossRef]
- Salgado, R.M.; Machado, T.C.; Ohishi, T. Intelligent Models to Identification and Treatment of Outliers in Electrical Load Data. IEEE Lat. Am. Trans. 2016, 14, 4279–4286. [Google Scholar] [CrossRef]
- Park, D.I.; Yoon, S.H. Clustering and classification to characterize daily electricity demand. J. Korean Data Inf. Sci. Soc. 2017, 28, 395–406. [Google Scholar] [CrossRef]
- Ryu, S.H.; Kim, H.S.; Oh, D.E.; No, J.K. Customer Load Pattern Analysis using Clustering Techniques. KEPCO J. Electr. Power Energy 2016, 2, 61–69. [Google Scholar] [CrossRef]
- Shin, J.H.; Yi, B.J.; Kim, Y.I.; Lee, H.G.; Ryu, K.H. Spatiotemporal Load-Analysis Model for Electric Power Distribution Facilities Using Consumer Meter-Reading Data. IEEE Trans. Power Deliv. 2011, 26, 736–743. [Google Scholar] [CrossRef]


| Part | Cluster | lier | Data |
|---|---|---|---|
| Temp.-Pitch | 1 | Inlier | 63,414 |
| Outlier | 10 | ||
| 2 | Inlier | 65,162 | |
| Outlier | 464 | ||
| 3 | Inlier | 61,138 | |
| Outlier | 0 | ||
| 4 | Inlier | 60,063 | |
| Outlier | 0 | ||
| Pitch-Roll | 1 | Inlier | 62,987 |
| Outlier | 437 | ||
| 2 | Inlier | 65,324 | |
| Outlier | 302 | ||
| 3 | Inlier | 60,896 | |
| Outlier | 242 | ||
| 4 | Inlier | 60,063 | |
| Outlier | 0 | ||
| Roll-Temp. | 1 | Inlier | 63,390 |
| Outlier | 34 | ||
| 2 | Inlier | 62,942 | |
| Outlier | 2,684 | ||
| 3 | Inlier | 59,437 | |
| Outlier | 1,701 | ||
| 4 | Inlier | 59,997 | |
| Outlier | 66 |
| Part | Prediction System | Prediction Rate | Accuracy Rate |
|---|---|---|---|
| Study of [85] | K-means + Random Forest | 90.490% | 91.242% |
| Study of [86] | Hierarchical Clustering | 91.485% | 94.678% |
| Study of [87] | K-means+Sequence | 92.395% | 94.148% |
| Proposed Study | Altered K-means+ADQL | 94.688% | 95.544% |
© 2019 by the authors. Licensee MDPI, Basel, Switzerland. This article is an open access article distributed under the terms and conditions of the Creative Commons Attribution (CC BY) license (http://creativecommons.org/licenses/by/4.0/).
Share and Cite
Jung, S.-H.; Huh, J.-H. A Novel on Transmission Line Tower Big Data Analysis Model Using Altered K-means and ADQL. Sustainability 2019, 11, 3499. https://doi.org/10.3390/su11133499
Jung S-H, Huh J-H. A Novel on Transmission Line Tower Big Data Analysis Model Using Altered K-means and ADQL. Sustainability. 2019; 11(13):3499. https://doi.org/10.3390/su11133499
Chicago/Turabian StyleJung, Se-Hoon, and Jun-Ho Huh. 2019. "A Novel on Transmission Line Tower Big Data Analysis Model Using Altered K-means and ADQL" Sustainability 11, no. 13: 3499. https://doi.org/10.3390/su11133499
APA StyleJung, S.-H., & Huh, J.-H. (2019). A Novel on Transmission Line Tower Big Data Analysis Model Using Altered K-means and ADQL. Sustainability, 11(13), 3499. https://doi.org/10.3390/su11133499