Article

Influences of Transformational Leadership, Transactional Leadership, and Patriarchal Leadership on Job Satisfaction of Cram School Faculty Members

1
College of Mechanical and Control Engineering, Guilin University of Technology, Guilin 541004, Guangxi, China
2
Department of Information Management, Yu Da University, Miaoli County 36143, Taiwan
3
Department of Early Childhood Education, To Ko University, Chiayi County 61363, Taiwan
4
Deputy Director of Elite International Educational Group, New Taipei City 22065, Taiwan
5
College of Mechanical and Control Engineering, Guilin University of Technology, Guilin 541004, Guangxi, China
*
Authors to whom correspondence should be addressed.
Sustainability 2019, 11(12), 3465; https://doi.org/10.3390/su11123465
Submission received: 13 May 2019 / Revised: 15 June 2019 / Accepted: 19 June 2019 / Published: 24 June 2019

Abstract

:
While there is a decline in the annual population of Taiwan, the number of crams schools in the supplementary education industry is increasing. A concern is that there are not enough students to go around. Cram schools are facing a difficult situation to survive in the industry. Therefore, a great and useful leadership method is needed to help leaders lead their faculty members and organizations so that they can survive and even grow in this white-hot industry. In this study, 400 New Taipei City cram school faculties were invited to be the research objects to study the influences of transformational leadership, transactional leadership, and patriarchal leadership on job satisfaction. This study adopted the method of intentional sampling to conduct a questionnaire survey. After collecting data, SPSS 12.0 software was used to analyze the descriptive statistics, reliability analysis, description of statistics, t-test method of single factor analysis of variance, and regression. As a result of this research, the employees under transformational leadership have a larger positive result on outer job satisfaction while patriarchal leadership has positive influences on inner job satisfaction. Encouraging subordinates with positive responses, inspiring speeches, and compliments could make subordinates satisfied with the company and interaction with colleagues, while teaching subordinates behavior sets up a moral and authorized style and controlling the organization directly could let subordinates get a sense of accomplishment from work. This study is aimed to provide suggestions and references for the cram schools’ leaders to change their leadership styles and improve their employees’ job satisfaction. Cram schools that take the suggestions and references could improve their working environment and become more competitive in the education industry.

1. Introduction

This study examines the influences of three leadership styles on employees’ job satisfaction in cram schools in New Taipei City in Taiwan. Since the environment of the supplementary education industry in Taiwan has made it difficult for cram schools to survive or develop, cram schools have to consider how to stand out in a crowd. At the same time, leadership style has been considered an important part in determining the success of a company. An outstanding leader can not only influence his subordinates in an acceptable way, but also guide them to a higher work performance [1]. It is worth considering which kind of leadership style could increase the job satisfaction of employees to a better level.
With the high popularity of cram schools in Taiwan, but low annual population, the competition between cram schools is fierce since there are not enough customers to go around. As shown in Figure 1, there were 18,271 cram schools in Taiwan in 2016 [2]. The number has increased by 42% in 14 years. Figure 2 shows that the numbers of first-grade students has decreased by 50% from 2003 to 2016 [3].
Since the 1970s, many Western management scientists have tried to understand how successful leaders influence the psychographics of their employees with different leadership styles. New leadership style theories, such as transformational leadership and transactional leadership, were developed at that time in order to discuss how leadership styles could help raise subordinates’ job satisfaction [4].
However, in the last 15 years, studies about the relationship between leadership styles and job satisfaction were mostly about business companies or elementary schools. There are few studies that discuss the situation in Taiwan. Therefore, this study will focus on discussing cram schools in New Taipei City in Taiwan.

1.1. Transformational Leadership

Leadership is defined as a motivation that influences people to have the same vision to achieve, and how a leader leads and influences his subordinates to reach organizational goals [5,6]. This leadership style is defined as transformational leadership; it creates positive and valuable changes in subordinates by enhancing their motivation, morale, and performance through different methods [7]. According to Bass [8], the factors and facets of a transformational leader include:
  • Idealized influence means a leader will be respected and trusted because of his/her self-confidence, attitude of ideology or dramatic and emotional acting. The leader should have a vision and passion that can make his/her subordinates follow his/her orders sincerely.
  • Inspirational motivation means a leader can use his/her charm to convey the goal of an organization, resulting in subordinates’ optimism and hope regarding the development and future of the company; working motivation and coherence are the final purposes.
  • Intellectual stimulation means a leader should encourage his/her subordinates to enhance their knowledge, creativity, and ponder deeply about problems.
  • Individualized consideration means a leader respects and cared for his/her subordinates. Subordinates will feel like an important part of the team and subsequently will work harder.

1.2. Transactional Leadership

Transactional leadership is considered as a mix of both the leader-member exchange theory and path-goal theory [9]. According to Bass (2003), a transactional leader has two main factors. One is that a leader can provide a contingent reward to subordinates. Subordinates understand clearly that achieving goals could receive the same level of reward. The other one is management by exception. In a positive way, the leader focuses on fixing the rules and standards that are no longer on track. In a negative way, the leader might leave negative comments regarding a subordinate’s failure according to the agreement made previously.
Sadeghi and Pihie believed that transactional leadership allows followers to realize their own interests; reduce workplace anxiety, and help employees to focus on clear organizational goals, such as improving quality, customer service, reducing cost, and increasing production [10]. At the same time, Northouse believed that transactional leadership style involves the exchange between leaders and followers and uses rewards and penalties to motivate teams or employees [11].

1.3. Patriarchal Leadership

Selin [12] studied Taiwanese business in 1976. The research mainly discussed the interaction between the leader, the manager, and the employees, and found six factors within that leadership.
  • Teaching behavior means the leader teaches subordinates how to achievegoals.
  • Moral leadership refers to the leader who is considered a person who possesses strong morals and would sacrifice himself/herself in order to let others achieve a goal.
  • Centralization of authority means the management power is controlled by the leader and is not shared with any subordinates.
  • A leader keeps a distance from subordinates in order to maintain authority.
  • The intention of leading means the leader does not express his/her thoughts to subordinates in order to protect his/her own authority and control.
  • A leader controls an organization directly.

1.4. Job Satisfaction

Job satisfaction is viewed as the level at which employees achieve positive results that relate to work through a positive attitude and effective orientation. Grunberg [13] defined job satisfaction as an individual’s psychological response and attitude towards specific jobs. Spector [14] essentially considered job satisfaction as the positive or negative feelings of the level of satisfaction for the job, which could also be considered as the level that an individual likes his/her job. A more recent definition of the concept of job satisfaction considered it as how a person perceives a job, and the extent to which one likes a job [15]. Maurya and Kaushik [16] considered job satisfaction as how content an employee’s behavior is at work, while Susanty, Miradipta, and Jie [17] described it as “how happy an individual is with his job”.
In many types of research, job satisfaction is considered as a powerful and positive influence on an organization, and help employees improve their creativity, problem-solving skills, and decision-making [18]. Imran, Arif, Cheema, and Azeem [19] considered that employees with higher job satisfaction would feel a more positive attitude towards their work. In addition, one’s job performance could be strongly and positively affected by his/her satisfaction with his/her job [20].
In summary, there are two main factors that could influence one’s job satisfaction: one influences an individual’s inner feelings, and the other influences an individual’s acquisition. This study will divide job satisfaction into two dimensions: inner and outer job satisfaction.

2. Research Design

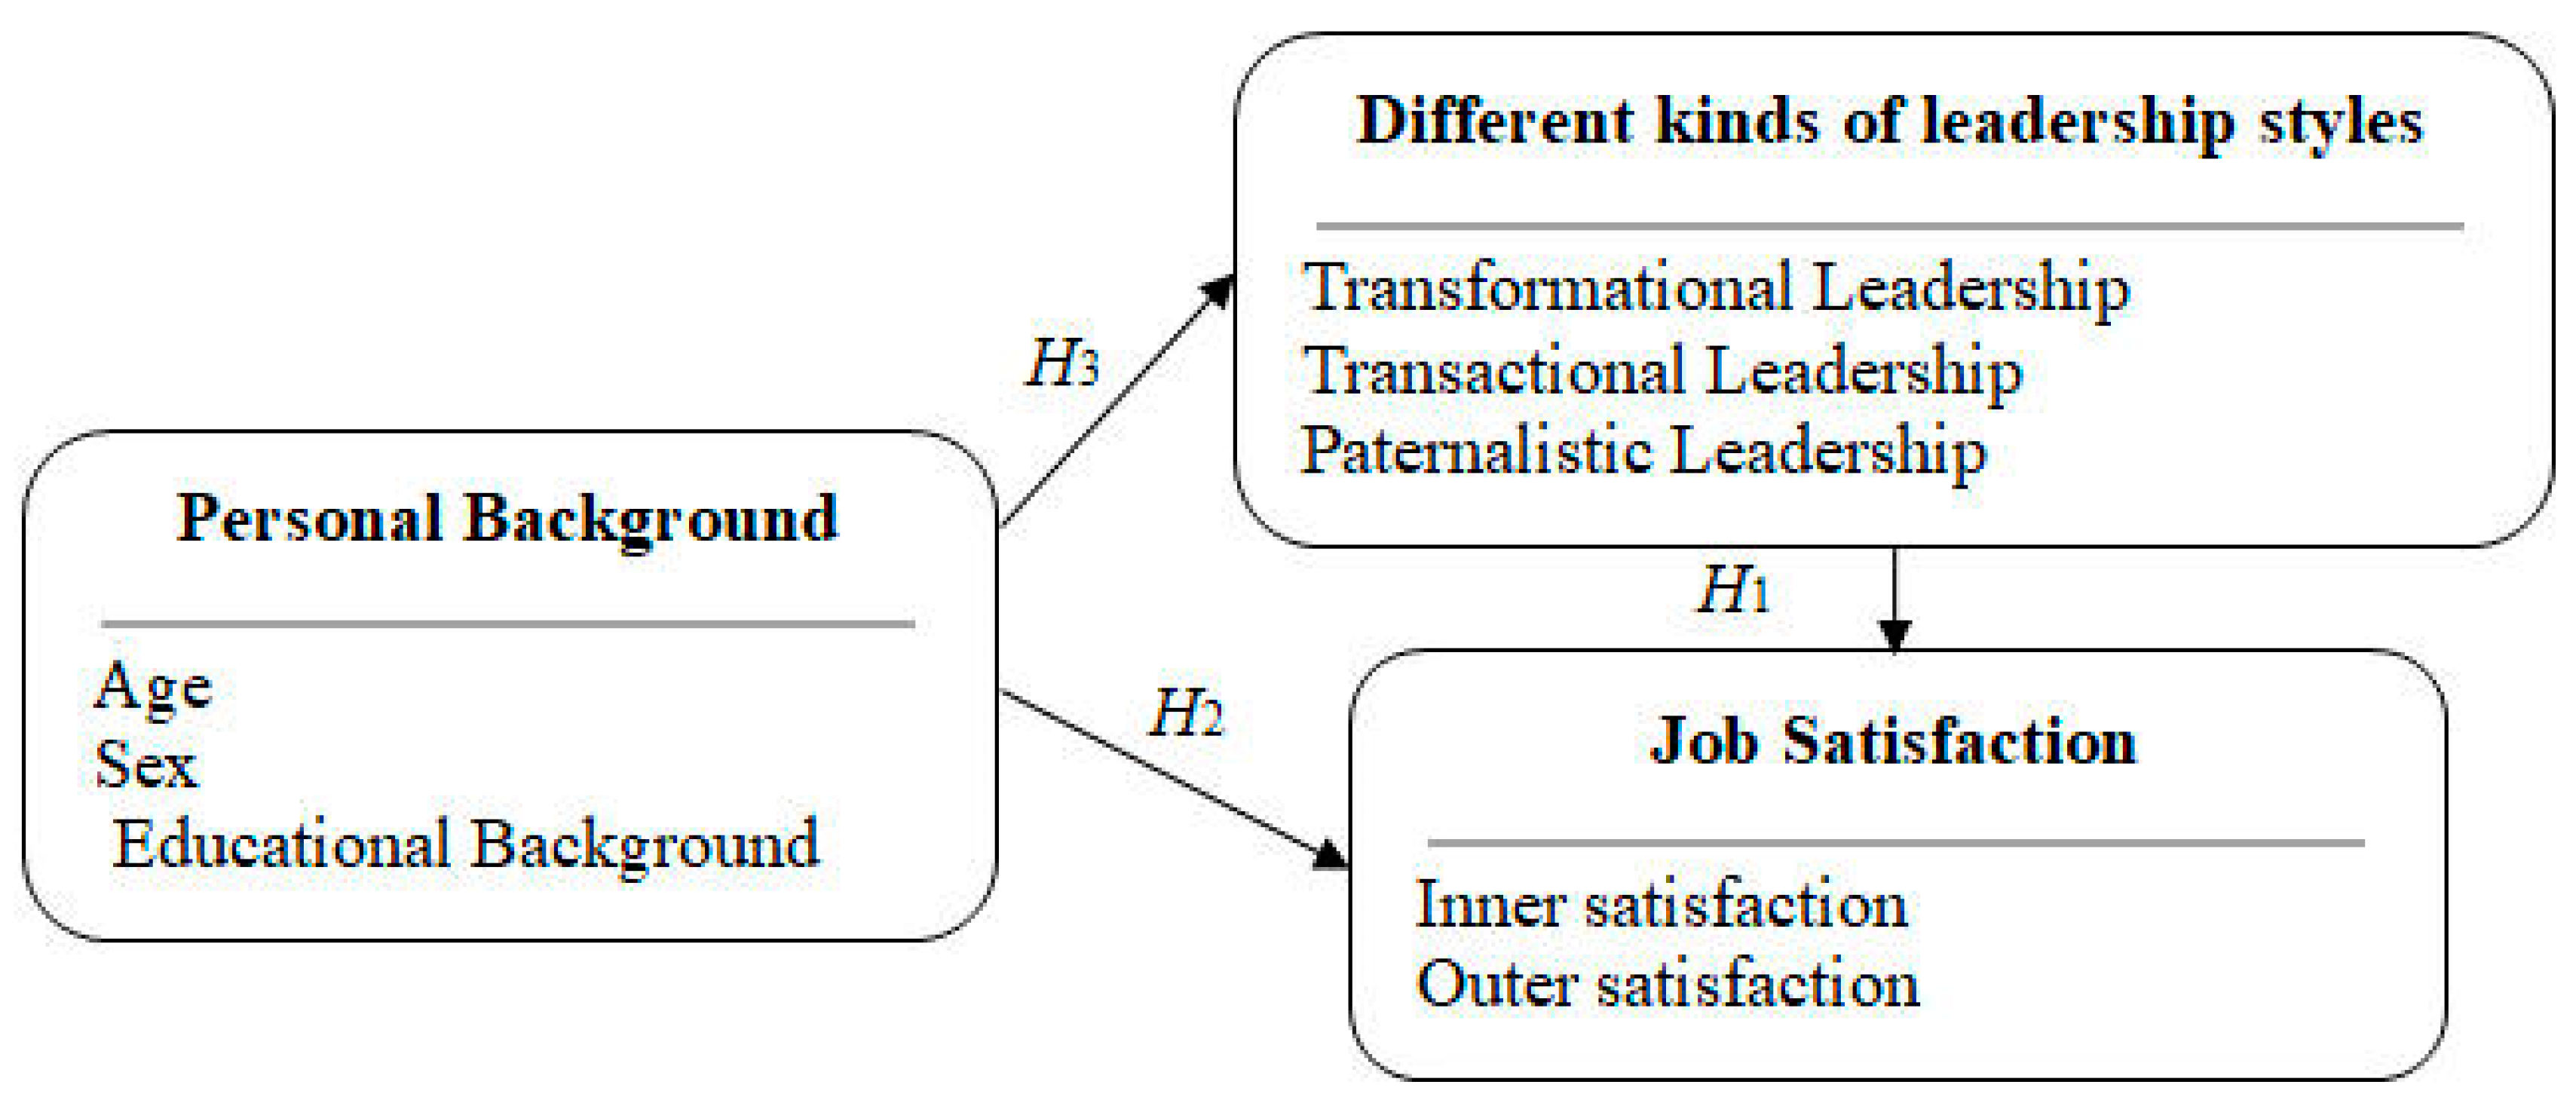
2.1. Research Assumptions

Based on the research purposes and the framework presented in Figure 3, the following hypotheses are developed:
Hypothesis 1:
Perceived different leadership behaviors have an effect on job satisfaction.
Hypothesis 2:
Personal background affects samples’ view of job satisfaction.
Hypothesis 3:
Personal background affects samples’ awareness of leadership styles.

2.2. Research Limitations

In the course of conducting this research, more difficulties were encountered than expected. These difficulties were mainly due to the difficulties in obtaining the sample and analyzing the data. The following are research limitations for this study:
  • The field location of this study is in New Taipei City, therefore different results may exist in other cities.
  • Since the identity of the researcher is an educator, this may have affected the reporter’s bias in that they tried to meet the researcher’s expectations when providing information.
  • Not enough works of literature which focus on Taiwan or cram schools were reviewed in this study.

2.3. Sample of Research

According to the Ministry of Education (2017), there are 2368 cram schools in New Taipei City. However, the data about the population of faculty members in cram schools have not been counted or recorded. Assuming that there are three full-time faculty members in each cram schools in New Taipei City, the total population of full-time faculty members in cram schools is approximately 7100. Thirty samples were collected for the pilot test. After the data analysis for the pilot test was conducted, 400 samples were sent to different cram schools in New Taipei City, and 390 of the samples were received. Out of the 390 samples, 390 valid questionnaires were retrieved.

2.4. Instrument and Procedures

This questionnaire-based research contains three parts, including background information; it was conducted in the hopes of figuring out which factors influence job satisfaction. The questionnaire is set to examine each construct in the order of leadership style and job satisfaction with a 5-point Likert scale. The instrument consists of 2 variables, 5 dimensions, and 52 questions in total. Since the research is regarding the situation in Taiwan, the questionnaire was translated into Chinese from English.
To measure leadership behaviors, the most widely acknowledged instrument to measure leadership style is the Multifactor Leadership Questionnaire (MLQ) [21]. In order to measure the paternalistic leadership style, the questionnaire was edited based on the Paternalistic Leadership Scale [22]. In this study, the type of leader and the influences he/she brings to one’s job satisfaction will be measured (Table 1). The dimensions of these leadership styles are reorganized in the Appendix A.
The Minnesota Satisfaction Questionnaire (MSQ) was adopted and edited for this study. There are two dimensions, each with six items to measure. The two dimensions are inner job satisfaction and outer job satisfaction. There are 12 items in total on this questionnaire. For reliability and validity, this article mainly focuses on examining the MSQ scale, and both dimensions have their Cronbach’s α at 0.8720 and 0.8218.

3. Results and Discussion

In order to explore whether different samples’ personal variables, such as sex, age, educational background, and job position, have a significant variation on leadership styles and job satisfaction, this study will use an independent sample t-test, ANOVA, and other methods to analyze the data.
According to the results shown in Table 2, sex differences have a p-value < 0.05 which indicates that they have a significant influence on inner job satisfaction and outer job satisfaction. Females had a mean score of 3.92, while males had a mean score of 4.13 on inner job satisfaction, which indicates that men have a stronger and more positive sentiment on inner job satisfaction than women. Conversely, females had a mean score of 3.59, while males had a mean score of 3.36 on outer job satisfaction, which indicates that females care more about outer job satisfaction than males. With a higher p-value, the other dimensions have no significant differences between females and males.
To understand whether different age groups have significant variances on the seven dimensions, ANOVA and Dunnett’s post hoc test (Dunnett T3 test) are used. As shown in Table 3 and Table 4, people in the age group 31–40 and 41–50 had higher and stronger feelings on transformational leadership than the other age groups. This might be due to the awareness of encouragement and inspiration.
While considering people in the age group 31–40 have a significantly higher awareness of transformational leadership, they also have a significantly higher awareness of transactional leadership. As shown in Table 5 and Table 6, people in the age group 31–40 have a mean score of 4.10, which is higher than all the other age groups. This could be explained by the fact that people in the 31–40 age group have their own family to afford and more imperative life goals to achieve that make them have a higher awareness on achieving goals for awards or promotions.
Synthesizing the results from Table 3, Table 4, Table 5, Table 6, Table 7 and Table 8, people in the age group 31–40 and 41–50 have a higher awareness of all three types of leadership style. This may be because these age groups have more knowledge and cognition of what leadership styles are. The younger and the older age groups may not understand much of leadership or leadership styles. With this result, this study intends to understand whether different age groups have a variation on inner job satisfaction and outer job satisfaction. The result is shown in the following.
For inner job satisfaction, age group 3 (31–40) had a significant difference from the other age groups. Similar to their awareness of leadership styles, this may be because they have a higher understanding of the current work environment. However, the result of outer job satisfaction among different age groups has a slight variation from the other results (Table 9 and Table 10). Age group 3 (31–40) had a significant difference from age group 2 (21–30), but not the other age groups. This may be due to people older than 30 having their own financial considerations, and younger people may not have the same level of consideration.
Despite understanding the differences among different age groups on leadership styles, this study also intends to understand whether our samples have significant variances on the seven dimensions with various educational backgrounds.
According to Table 11 and Table 12, people who graduated junior college have higher and stronger feelings on transactional leadership than those who graduated college and have a higher awareness than those who graduated senior high school.
As shown in Table 13, Table 14, Table 15 and Table 16, samples who graduated college had a significant difference on inner job satisfaction than the samples who graduated senior high school, vocational high school, or junior college. Having quite similar results, the samples that graduated college and junior college had a higher awareness of outer job satisfaction than the samples that graduated senior high school or vocational high school.
Personal background had insignificant differences in some dimensions, including educational background on transformation leadership and patriarchal leadership. This may be because the samples that have different educational backgrounds have the same cognition on transformation leadership and patriarchal leadership. However, there are still some significant differences among educational background and the other dimensions.
To conclude, samples who are 31 to 40 years old and graduated junior college or college, generally have a higher acknowledgment of leadership style and higher awareness on job satisfaction.
With regression analysis as the dimension, the independent variable is transformational leadership and the dependent variable is inner job satisfaction (Table 17). The coefficient is –0.157 and the p-value = 0.124. This reflects that transformational leadership may have negative effects on inner job satisfaction; however, the result is insignificant. Conversely, transactional leadership, as an independent variable, has a coefficient of 0.148 and a p-value = 0.014, which is less than 0.05. This shows that transactional leadership could influence one’s outer job satisfaction slightly, and the result is significant. With this result, another regression analysis was performed where patriarchal leadership was the independent variable and inner job satisfaction was the dependent variable. The coefficient of this analysis was 0.523 and its p-value = 0.000, which means patriarchal leadership had significantly positive influences on inner job satisfaction.
While discovering the most suitable leadership styles for inner job satisfaction, outer job satisfaction is also the main dimension of job satisfaction (Table 18). Using regression analysis, the independent variable is transformational leadership, the dependent variable is outer job satisfaction, the coefficient is –0.043 and the p-value = 0.623. This reflects that transformational leadership may have negative effects on outer job satisfaction; however, it is exceedingly insignificant. With this result, another regression analysis was also performed where transactional leadership was the independent variable and outer job satisfaction was the dependent variable. The coefficient is 0.471 and its p-value = 0.000, which is less than 0.05. This shows that transactional leadership could influence one’s outer job satisfaction greatly, and the result is significant. Patriarchal leadership also has a coefficient of 0.287 and p-value = 0.002, which means patriarchal leadership has a significant positive influence on outer job satisfaction that is slighter than transactional leadership. The result of hypotheses verification is shown in Table 19.

4. Conclusions and Discussion

Increasing job satisfaction may positively influence a company’s business, which makes it an important topic for managing a company. The way a leader leads a team could obviously affect employees’ job satisfaction. Thus, the way a leader leads, which is called leadership style, is the basis of running a successful company. The cram school industry in Taiwan is facing a huge inner competition as there are fewer and fewer babies born every year. As a result, the leadership style of the leader in each cram school could largely affect the cram school faculty members’ job satisfaction, and at last, the cram school business. According to the analyzed results, the conclusions of this research are detailed below.

4.1. Conclusions

Transformational leadership has a negative effect on both inner and outer job satisfaction, but both of them are not significant. This reflects that transformational leadership is not that important to job satisfaction in the cram school industry. In addition, employees who were led by transformation leadership may lose their job satisfaction. This may be because transformational leadership focuses on inspiration, creation, and positive thinking, which may cause extra burdens to the faculty members in cram schools.
Transactional leadership has a positive influence on outer job satisfaction. This shows that contingent rewards, leader–member exchanges or other factors may play an important role in employees’ job satisfaction.
Finally, yet importantly, patriarchal leadership has a significant positive effect on inner job satisfaction. In patriarchal leadership, a leader shows the kindness to subordinates as a father figure which is suitable to raise employees’ inner job satisfaction.

4.2. Discussions

To conclude the entire study, there are two suggestions that further studies could process in order to understand more and to confirm that a specific leadership style can truly affect one’s job satisfaction.
(1)
We suggest future research uses an experimental design study, which could observe the changes of an organization or employee under different kinds of leadership styles. Samples can be assigned to different companies that are in the same industry and the same size, but the companies have different leadership styles. The samples change to another company that has another leadership style six months later, after calculating their job satisfaction scale. Another test of the job satisfaction scale will be done after another six months.
(2)
We suggest cram schools’ leaders apply transactional leadership to their organization. Employees’ outer job satisfaction might be raised as a result. For example, cram schools could attach a strict bonus system for enrolling new students or completing special tasks, such as holding events or competitions. The system should have clear information and must be reviewed and improved regularly. For cram schools that already apply transactional leadership, patriarchal leadership is suggested to stimulate employees’ inner job satisfaction. For example, leaders could act as a father figure to subordinates, acting as a high-moral person who teaches subordinates how to achieve goals.

Author Contributions

Conceptualization, T.-S.L.; Data curation, I-H.C. and T.-C.M.; Formal analysis, I-H.C. and T.-C.M.; Investigation, L.-P.Z. and K.-C.C.; Methodology, T.-S.L., L.-P.Z. and K.-C.C.

Funding

This research received no external funding.

Conflicts of Interest

The authors declare no conflict of interest.

Appendix A

Table A1. Questions of three kinds of leadership styles.
DimensionsQuestions
Transactional Leadership
1.
As long as the organization is functioning properly, the company’s supervisors will be based on stability and will not change easily.
2.
Company managers will propose exchange conditions or substantive rewards and hope that employees will work hard to achieve the goals.
3.
As long as the company’ managers can accept the current performance of the employee, there will be no special requirements for the employee.
4.
Company managers always ask about the status of the matter in case something goes wrong.
5.
Company managers do not allow employees to perform actions that are not permitted on the program.
6.
I think that the company managers will keep an eye on the behaviors and mistakes that employees should not have.
7.
When the company managers’ job requirements or good performance are completed, the company’s supervisor will publicly praise.
8.
Company managers will take the initiative to find the source of the problem and give instructions.
9.
Company managers will give special treatment to employees who can fulfill the job requirements.
10.
Company managers will give employees time to new school skills to adapt to changes in the environment.
Paternalistic Leadership
11.
When an employee has a hard time, the company managers will take the initiative to help.
12.
I don’t think the company’ managers will take the employee’s credit.
13.
When an employee is unable to complete a task, the company managers will express a dissatisfaction message.
14.
When an employee makes a mistake, the company’ managers will give the opportunity to make corrections.
15.
I think that the company’s supervisor is a good example for teachers to behave.
16.
I feel pressure while having a meeting with the company managers
17.
Company managers always greet the staff.
18.
Company managers believe that the employees who follow the rules are the model subordinates.
19.
here is a feeling of a family while getting along with managers.
20.
Company managers do not use the position to enjoy privileges.
21.
Company managers always present a majestic image in front of their employees.
Transformational Leadership
22.
Company managers always establish a close relationship with employees.
23.
Company managers always share the view and the idea of things and encourage employees to share with each other actively.
24.
I think that the company manager has carefully thought about the problem and overcome it with action.
25.
Company managers could understand and be considerate of employees’ feelings and emotions.
26.
The behavior of managers could be identified by employees.
27.
Company managers always encourage employees to improve proficiency.
28.
Company managers are not closed minded and are able to create a better environment for employees to show one’s creativity.
29.
Company managers always give a hand to employees who need aid.
30.
Company managers always come up with ideas that can make employees work hard.
31.
Company managers would uncover a talented person.
32.
Company managers always care about the employees and their problems.
33.
Company managers are upright and are able to redress the scales or solve problems.
34.
Company managers respect employees’ professional and self-direction, authorize enough power to employees, and decentralize the responsibility.
35.
Company managers always participate in training and inspire employees to improve more.
36.
Company managers always give more care to new employees.
37.
Company managers are always responsible for the situation, not to blame others, to do things, and to admire the staff.
38.
Company managers can respect the opinions of the employees, and the important things are discussed and communicated with the teachers.
39.
Company managers will inspire employees to learn from each other and share successful experiences.
40.
Company managers assume the employee’s rights, benefits, and needs, and envisage the teacher and stand on the same line as the teacher.

References

  1. Yukl, G.A. Leadership in Organizations; Prentic-Hall: Upper Saddle River, NJ, USA, 2002. [Google Scholar]
  2. Ministry of Education. All Cities and Counties: Short-Term Tutorial Information Management System. Number of Busiban in Each City and County. 2017. Available online: http://bsb.edu.tw/ (accessed on 22 September 2018).
  3. Ministry of Education. All Cities and Counties: Short-Term Tutorial Information Management System. Summary of Elementary Schools (1991 to 2016). 2017. Available online: http://bsb.edu.tw/ (accessed on 21 December 2018).
  4. Sung, C.T. The study of Relationship between Transformational Leadership and Organizational Learning. Master’s Thesis, 2012. Unpublished Work. Available online: https://ndltd.ncl.edu.tw/ (accessed on 14 January 2019).
  5. Liu, Y.Y. A Study on the Relationships of Emotional Labor. Emotion Regulation and Engagement: Spiritual Leadership as a Moderator. Master’s Thesis, 2014. Unpublished Work. Available online: https://etds.ncl.edu.tw (accessed on 13 April 2019).
  6. Daft, R.L. The Leadership Experience, 4th ed.; Thompson South-Western: Mason, OH, USA, 2008. [Google Scholar]
  7. Downton, J.V.R. Leadership: Commitment and Charisma in the Revolutionary Process; Free Press: New York, NY, USA, 1973. [Google Scholar]
  8. Bass, B.M. Leadership and Performance Beyond Expectations; Free Press: New York, NY, USA, 1985. [Google Scholar]
  9. Silin, R.F. Leadership and Values; Harvard Gruyter: Cambridge, MA, USA, 1976. [Google Scholar]
  10. Sadeghi, A.; Pihie, Z.A.L. Transformational leadership and its predictive effects on leadership effectiveness. Int. J. Bus. Soc. Sci. 2012, 3, 186–197. [Google Scholar]
  11. Northouse, P.G. Leadership: Theory and Practice, 7th ed.; SAGE Publications, Inc.: Los Angeles, CA, USA, 2015. [Google Scholar]
  12. Smith, P.C.; Kendall, L.M.; Huh, C.L. The Measurement of Satisfaction in Work and Retirement; Rand McNally: Chicago, IL, USA, 1969. [Google Scholar]
  13. Gruneberg, M.M. Understanding Job Satisfaction; The Macmillan Press Ltd.: London, UK, 1979. [Google Scholar]
  14. Spector, P.E. Job Satisfaction: Application, Assessment, Causes, and Consequences; Sage: Thousand Oaks, CA, USA, 1997. [Google Scholar]
  15. Hulin, C.L.; Judge, T.A. Job attitudes: A theoretical and empirical review. In Handbook of Psychology; Borman, W.C., Ilgen, D.R., Klimoski, R.J., Eds.; John Wiley & Sons Inc.: Hoboken, NJ, USA, 2003; pp. 255–276. [Google Scholar]
  16. Maurya, V.N.; Kaushik, A.P. On the job training: A stop towards job satisfaction: A case study of public sector organization in Indian scenario. Int. J. Math. Modeling Appl. Comput. 2013, 1, 11–17. [Google Scholar]
  17. Sushant, A.; Maradiaga, R.; Jibe, F. Analysis of the effect of attitude toward works, organizational commitment, and job satisfaction, on employee’s job performance. Eur. J. Bus. Soc. Sci. 2013, 1, 15–24. [Google Scholar]
  18. Colquitt, J.A.; Lupines, J.A.; Wesson, M.J. Organizational Behavior: Improving Performance and Commitment in the Workplace; McGraw-Hill: New York, NY, USA, 2008. [Google Scholar]
  19. Imran, H.; Aric, I.; Cheema, D.; Azeem, M. Relationship between job satisfaction, job performance, attitude towards work, and organizational commitment. Entrep. Innov. Manag. J. 2014, 2, 135–144. [Google Scholar]
  20. Pongo, M.; Deedra, S. Job performance and job satisfaction: An integrated survey. Econ. Politic 2010, 27, 175–210. [Google Scholar]
  21. Bass, B.M.; Avolio, B.J.; Jung, D.I.; Bresson, Y. Predicting unit performance by assessing transformational and transactional leadership. J. Appl. Psychol. 2003, 88, 207–218. [Google Scholar] [CrossRef] [PubMed]
  22. Su, Y.L. A Study on the Relationship between the Leadership Styles of Principal and the Job Satisfaction of Teacher in Elementary Schools. Master’s Thesis, 2008. Unpublished Work. Available online: https://etds.ncl.edu.tw (accessed on 13 February 2019).
Figure 1. Numbers of cram schools in the past 15 years (Ministry of Education, 2017).
Sustainability 11 03465 g001
Figure 2. Number of first-grade students from 2003 to 2016 (Ministry of Education, 2017).
Sustainability 11 03465 g002
Figure 3. Research Framework.
Sustainability 11 03465 g003
Table 1. Questions regarding two factors of job satisfaction.
DimensionsQuestions
Inner Job Satisfaction41. I get a sense of accomplishment from my work.
42. My current work provides stability for my work.
43. The current work does not have me doing things that are contrary to my conscience.
44. My current work gives me the opportunity to behave alone.
45. In my current work, I have the opportunity to guide my colleagues.
46. In my current work, I am free to use my own judgment.
Outer Job Satisfaction47. I am satisfied with the way the company implements its policies.
48. I am satisfied with my interactions with my colleagues.
49. I am satisfied with the leadership style of the company’s supervisor.
50. The work environment makes me happy.
51. I am satisfied with the treatment I receive from my work (e.g., monthly salary, bonus, etc.).
52. I am satisfied with the employee benefits provided by the company (e.g., reading benefits, education, training, etc.).
Table 2. Independent sample t-test on sex and different dimensions.
DimensionSexNumber of SamplesMeanStandard Deviationt-Valuep-Value
Transformational LeadershipFemale2834.120.551.9660.050
Male1074.030.40
Transactional LeadershipFemale2833.730.551.7440.082
Male1073.620.45
Patriarchal LeadershipFemale2834.090.501.2470.213
Male1074.020.48
Inner Job SatisfactionFemale2833.920.63−3.169 **0.002
Male1074.130.51
Outer Job SatisfactionFemale2833.590.762.755 **0.006
Male1073.360.59
* p < 0.05, ** p < 0.01, *** p < 0.001.
Table 3. Description of age on transformational leadership.
Group (Age)Number of SamplesMeanStandard DeviationStandard Error95% Confidence Interval of Mean
Lower BoundUpper Bound
2 (21–30)1824.010.470.0353.944.07
3 (31–40)584.330.430.0624.204.45
4 (41–50)994.160.410.0414.084.24
5 (>50)514.030.590.0833.864.19
Table 4. One-way ANOVA and post hoc test between age and transformational leadership.
Sum of SquaresDegree of FreedomMean SquareFSignificancePost Hoc Test
Between Groups5.28441.7617.7940.0003 > 2
3 > 5
4 > 2
Within Groups87.2383860.226
Total92.523390
Table 5. Description of age on transactional leadership.
Group (Age)Number of SamplesMeanStandard DeviationStandard Error95% Confidence Interval of Mean
Lower BoundUpper Bound
2 (21–30)1823.550.430.3163.493.61
3 (31–40)584.100.540.0713.964.24
4 (41–50)993.710.520.0523.603.81
5 (>50)513.770.600.0843.603.93
Table 6. One-way ANOVA and post hoc test between age and transactional leadership.
Sum of SquaresDegree of FreedomMean SquareFSignificancePost Hoc Test
Between Groups13.60644.53518.7120.0003 > 4
4 > 2
3 > 5
Within Groups93.5593860.242
Total107.165390
Table 7. Description of age on patriarchal leadership.
Group (Age)Number of SamplesMeanStandard DeviationStandard Error95% Confidence Interval of Mean
Lower BoundUpper Bound
2 (21–30)1823.990.460.033.934.06
3 (31–40)584.300.450.064.184.42
4 (41–50)994.240.370.044.174.32
5 (>50)513.780.700.103.593.98
Table 8. One-way ANOVA and post hoc test between age and patriarchal leadership.
Sum of SquaresDegree of FreedomMean SquareFSignificancePost Hoc Test
Between Groups11.32343.77417.1280.0003 > 2
3 > 5
4 > 2
4 > 5
Within Groups85.0613860.220
Total96.384390
Table 9. Description of age on outer job satisfaction.
Group (Age)Number of SamplesMeanStandard DeviationStandard. Error95% Confidence Interval of Mean
Lower BoundUpper Bound
2 (21–30)1823.420.730.0543.313.52
3 (31–40)583.820.600.0793.663.98
4 (41–50)993.580.670.0473.443.71
5 (>50)513.480.850.1183.243.72
Table 10. One-way ANOVA and post hoc test between age and outer job satisfaction.
Sum of SquaresDegree of FreedomMean SquareFSignificancePost Hoc Test
Between Groups7.52332.5084.9310.0023 > 2
Within Groups196.2963870.509
Total203.819390
Table 11. Description of educational background on transactional leadership.
Group (Age)Number of SamplesMeanStandard DeviationStandard Error95% Confidence Interval of Mean
Lower BoundUpper Bound
1183.320.290.0693.183.46
2774.000.640.0733.844.13
32953.650.470.0273.593.70
32953.650.470.0273.593.70
Group 1: senior high school or vocational high school; Group 2: junior college; Group 3: college; Group 4: master; Group 5: doctor.
Table 12. ANOVA and post hoc test between educational background and transactional leadership.
Sum of SquaresDegree of FreedomMean SquareFSignificancePost Hoc Test
Between Groups9.85934.92919.6050.0002 > 3
3 > 1
Within Groups97.3073870.251
Total107.165390
Table 13. Description of educational background on inner job satisfaction.
Group (Age)Number of SamplesMeanStandard DeviationStandard Error95% Confidence Interval of Mean
Lower BoundUpper Bound
1183.440.510.1213.193.70
2773.770.930.1063.563.99
32954.060.470.0274.014.12
Group 1: senior high school or vocational high school; Group 2: junior college; Group 3: college; Group 4: master; Group 5: doctor
Table 14. One-way ANOVA and post hoc test between educational background on inner job satisfaction.
Sum of SquaresDegree of FreedomMean SquareFSignificancePost Hoc Test
Between Groups10.38935.19515.0320.0003 > 1
3 > 2
Within Groups133.7373870.346
Total144.126390
Table 15. Description of educational background on outer job satisfaction.
Group (Age)Number of SamplesMeanStandard DeviationStandard Error95% Confidence Interval of Mean
Lower BoundUpper Bound
1183.060.640.1512.743.37
2773.630.900.1023.433.83
32953.530.670.0393.453.60
Group 1: senior high school or vocational high school; Group 2: junior college; Group 3: college; Group 4: master; Group 5: doctor
Table 16. One-way ANOVA and post hoc test between educational background on outer job satisfaction.
Sum of SquaresDegree of FreedomMean SquareFSignificancePost Hoc Test
Between Groups4.81432.4074.6810.0102 > 1
3>
Within Groups199.0053870.514
Total203.819390
Table 17. Regression analysis of leadership styles on inner job satisfaction.
DimensionsB
Regression Coefficients
Standard ErrorβTp-ValueToleranceVIF
Variance Inflation Faction
Transformational Leadership−0.1950.127−0.157−1.5410.1240.1895.286
Transactional Leadership0.1710.0700.1482.2660.0140.5431.840
Patriarchal Leadership0.6400.1270.5235.0380.0000.1815.530
R = 0.496; R2 = 0.246; △R2 = 0.241
Table 18. Regression analysis of leadership styles on outer job satisfaction.
DimensionsBStandard ErrorβTp-ValueToleranceVIF
Transformational Leadership−0.0640.130−0.043−0.4930.6230.1895.284
Transactional Leadership0.6490.0710.4719.0850.0000.5431.840
Patriarchal Leadership0.4170.1310.2873.1910.0020.1815.530
R=0.661; R2=0.437; △R2=0.433
Table 19. The result of hypotheses verification.
HypothesisResult
H1: Perceived different leadership behaviors have an effect on job satisfaction.valid
H2: Personal background affects samples’ view of job satisfaction.valid
H3: Personal background affects samples’ awareness of leadership styles.valid

