A Study on the Relationship between Analysts’ Cash Flow Forecasts Issuance and Accounting Information: Evidence from Korea

Abstract
:1. Introduction
2. Literature Review and Hypothesis Development
2.1. The Determinants of Analysts’ Cash Flow Forecasts Issuance
2.2. The Usefulness of Analysts’ Cash Flow Forecasts Issuance
2.3. A Study on the Effect of Analysts’ Cash Flow Forecasts Issuance
2.4. Hypothesis Development
3. Research Design and Data
4. Empirical Results
4.1. Descriptive Statistics
4.2. Pearson Correlations
4.3. Multivariate Results
5. Additional Tests
5.1. Sample Selection Bias
5.2. Re-Verification after Controlling the Time Series and Cross-Sectional Dependency
6. Conclusions
Author Contributions
Funding
Conflicts of Interest
Appendix A. Variable Definitions for H1-1, H1-2, H2
Appendix A.1. Dependent Variables
| AF_ACC | financial analysts’ earnings forecast accuracy, -1*| analysts’ earnings forecast per share – actual earnings per share | / lagged stock price for firm i in year t |
| SPREAD | Iinformation asymmetry, spread according to Corwin and Schultz [35] for firm i in year t |
Appendix A.2. Explanatory Variables
| JOINT_DUM | joint issuance dummy variable, an indicator variable equal to one if the financial analyst has provided both earnings and cash flow forecasts in a given year, 0 otherwise |
| OCF_ACC | financial analysts’ cash flow forecasts accuracy, −1*| analysts’ cash flow forecasts per share – actual cash flow per share | / lagged stock price for firm i in year t |
Appendix A.3. Control Variables
| EQ | the absolute residual of the Dechow et al. [50]. discretionary accrual model, multiplied by −1; |
| FOLLOWS | the number of analysts who report earnings forecasts for the firm; |
| LEV | financial leverage, measured as long-term liabilities divided by lagged total assets; |
| ROE | return on equity, measured as net income divided by lagged total equity; |
| SIZE | firm size, the natural log of total assets; |
| AGE | the number of years from the date of initial listing to the lagged period; |
| GRW | asset growth, measured as the total assets in year t minus total assets in t−1 divided by total assets in t−1; |
| STDRET | standard deviation of daily returns |
| PRICE | the natural log of closing price at the end of March for firm i in year t+1 |
| BETA | systematic risk, estimated value using monthly stock returns for firm i over the five years period from year t to year t-4 |
| FOR | foreign ownership |
| YD | year dummy; |
| IND | industry dummy. |
Appendix A.4. Variable Definitions for Probit Model
| JOINT_DUM | joint issuance dummy variable, an indicator variable equal to one if the financial analyst has provided both earnings and cash flow forecasts in a given year, 0 otherwise |
| ACCRUAL | absolute value of total accruals, measured as absolute value of net income minus operating cash flow divided by total assets in t; |
| VOL | earnings volatility, (standard deviation of earnings from year t-4 to year t / average deviation of earnings from year t-4 to year t) / (standard deviation of operating cash flow from year t-4 to year t / average deviation of operating cash flow from year t-4 to year t); |
| CYCLE | business cycle, 365/ inventory turnover + 365/ receivable turnover . where inventory turnover is measured as cost of goods sold divided average inventory and receivable turnover is measured as sales divided average receivable; |
| CAPINT | capital intensity, (gross property , plant and equipment) / sales; |
| K1_SCORE | financial health, K1-SCORE = −17.862+1.472X1+3.041X2+14.839X3+1.516X4 where, X1: natural logarithm of total assets X2: natural logarithm of (sales / total asset) X3: retained earnings / total asset X4: equity /debt |
| SIZE | firm size, logarithm of total assets in year t-1; |
| EQ | the absolute residual of the Dechow et al. [50]. discretionary accrual model, multiplied by −1. |
Appendix B. SPREAD is Measured as Corwin and Schultz (2012)
References
- Jain, P.K.; Rezaee, Z. The Sarbanes–oxley act of 2002 and capital-market behavior: Early evidence. Contemp. Account. Res. 2006, 23, 629–654. [Google Scholar] [CrossRef]
- Schipper, K. Commentary on earnings management. Account. Horiz. 1989, 3, 91–102. [Google Scholar]
- Healy, P.; Palepu, K. Information asymmetry, corporate disclosure, and the capital markets: A review of the empirical disclosure literature. J. Account. Econ. 2001, 31, 405–440. [Google Scholar] [CrossRef]
- Dyck, A.; Morse, A.; Zingales, L. Who blows the whistle on corporate fraud? J. Financ. 2010, 65, 2213–2253. [Google Scholar] [CrossRef]
- Yu, F. Analyst coverage and earnings management. J. Financ. Econ. 2008, 88, 245–271. [Google Scholar] [CrossRef]
- Knyazeva, D. Corporate Governance, Analyst Following, and Firm Behaviour; Working Paper; New York University: New York, NY, USA, 2014 2007; Available online: http://www.efmaefm.org/0EFMAMEETINGS/EFMA%20ANNUAL%20MEETINGS/2008-Athens/papers/Diana.pdf (accessed on 18 June 2019).
- Sun, J. Governance role of analyst coverage and investor protection. Financ. Anal. J. 2009, 65, 52–64. [Google Scholar] [CrossRef]
- Sun, J.; Liu, G. The effect of analyst coverage on accounting conservatism. Manag. Financ. 2011, 37, 5–20. [Google Scholar] [CrossRef] [Green Version]
- Defond, M.L.; Hung, M. An empirical analysis of analysts’ cash flow forecasts. J. Account. Econ. 2003, 35, 73–100. [Google Scholar] [CrossRef]
- McInnis, J.; Collins, D. The effect of cash flow forecasts on accrual quality and benchmark beating. J. Account. Econ. 2011, 51, 219–239. [Google Scholar] [CrossRef]
- Call, A.C.; Chen, S.; Tong, T.H. Are analysts’ earnings forecasts more accurate when accompanied by cash flow forecasts? Rev. Account. Stud. 2009, 14, 358–391. [Google Scholar] [CrossRef]
- Call, A.C.; Chen, S.; Tong, Y.H. Are analysts’ cash flow forecasts naïve extensions of their own earnings forecasts? Contemp. Account. Res. 2013, 30, 438–465. [Google Scholar] [CrossRef]
- Brown, L.D.; Huang, K.; Pinello, A.S. To beat or not to beat? The importance of analysts’ cash flow forecasts. Rev. Quant. Financ. Account. 2013, 41, 723–752. [Google Scholar] [CrossRef]
- Givoly, D.; Hayn, C.; Lehavy, R. The quality of analysts’ cash flow forecasts. Account. Rev. 2009, 84, 1877–1911. [Google Scholar] [CrossRef]
- Bilinski, P. Do analysts disclose cash flow forecasts with earnings estimates when earnings quality is low? J. Bus. Financ. Account. 2014, 41, 401–434. [Google Scholar] [CrossRef]
- Defond, M.L.; Hung, M. Investor protection and analysts’ cash flow forecasts around the world. Rev. Account. Stud. 2007, 12, 377–419. [Google Scholar] [CrossRef]
- Ahmed, K.; Ali, M.J. Determinants and usefulness of analysts’ cash flow forecasts: Evidence from Australia. Int. J. Account. Inf. Manag. 2013, 21, 4–21. [Google Scholar] [CrossRef]
- Ertimur, Y.; Stubben, S. Analysts’ incentives to issue revenue and cash flow forecasts. Working paper. Duke University and University of North Carolina at Chapel Hill. SSRN Electron. J. 2005, 1–51. [Google Scholar] [CrossRef]
- Shin, H.; Oh, H. Earnings quality and the joint issuance of analyst earnings and cash flow forecasts. Account. Inf. Res. 2014, 32, 113–137. [Google Scholar]
- Christopher, T.; Edmonds, J.E.E.; Maher, J.J. The impact of meeting or beating analysts’ operating cash flow forecasts on a firm’s cost of debt. Adv. Account. 2011, 27, 242–255. [Google Scholar] [CrossRef]
- Pae, J.; Yoon, S. Determinants of analysts’ cash flow forecast accuracy. J. Account. Audit. Financ. 2011, 27, 123–144. [Google Scholar] [CrossRef]
- Gordon, E.A.; Petruska, K.A.; Yu, M. Do analysts‘ cash flow forecasts mitigate the accrual anomaly? International evidence. J. Int. Account. Res. 2014, 13, 61–90. [Google Scholar] [CrossRef]
- Dhole, S.; Mishra, S.; Pal, A.M. Are Analysts’ Cash Flow Forecasts Important? Another Examination; Working Paper; University of Melbourne: Melbourne, Australia, 2014; pp. 1–40. [Google Scholar]
- Shi, L.; Zhang, H.; Guo, J. Analyst cash flow forecasts and pricing of accruals. Adv. Account. Inc. Adv. Account. 2014, 30, 95–105. [Google Scholar] [CrossRef]
- Mao, M.Q.; Yu, Y. Analysts’ cash flow forecasts, audit effort, and audit opinions on internal control. J. Bus. Financ. Account. 2015, 42, 635–664. [Google Scholar] [CrossRef]
- Song, M.S. Do Analysts use the Cash Flow Forecasts for Stock Recommendation? Korean Account. Rev. 2015, 40, 83–118. [Google Scholar]
- Hyeon, J.W.; Kim, Y.J.; Lee, J.I. Analysts’ operating cash flow forecasts and accuracy of earnings forecasts: Korean evidence. Study Account. Tax. Audit. 2016, 69, 221–253. [Google Scholar]
- Call, A.C. Analysts’ cash flow forecasts and the predictive ability and pricing of operating cash flows. Working paper. University of Georgia. SSRN Electron. J. 2008, 1–50. [Google Scholar] [CrossRef]
- Hirshleifer, D.; Teoh, S.H. Limited attention, information disclosure, and financial reporting. J. Account. Econ. 2003, 36, 337–386. [Google Scholar] [CrossRef]
- Givoly, D.; Hayn, C.; Lehavy, R. Analysts’ cash flow forecasts are not sophisticated: A rebuttal of call, chen and tong. SSRN Electron. J. 2013, 1–7. [Google Scholar] [CrossRef]
- Mohanram, P.S. Analysts’ cash flow forecasts and the decline of the accruals anomaly. Contemp. Account. Res. 2014, 31, 1143–1170. [Google Scholar] [CrossRef]
- Radhakrishnan, S.; Wu, S.L. Analysts’ cash flow forecasts and accrual mispricing. Contemp. Account. Res. 2014, 31, 1191–1219. [Google Scholar] [CrossRef]
- Jeong, S.W. Factors associated with analyst following and forecast characteristics. Korean Account. Rev. 2003, 28, 61–84. [Google Scholar]
- Bae, K.S.; Park, M.H. The effect of asset impairments on effective Analyst’s earnings forecast error and accuracy. Korean Account. J. 2011, 20, 1–27. [Google Scholar]
- Corwin, S.A.; Schultz, P. A simple way to estimate bid-ask spreads from daily high and low prices. J. Financ. 2012, 67, 719–760. [Google Scholar] [CrossRef]
- Shin, S.N. The Effect of K-IFRS Adoption on Information Asymmetry and Stock Price Synchronicity. Ph.D. Thesis, Sungkyunkwan University, Seoul, Korea, 2013. Available online: http://www.riss.kr/search/detail/DetailView.do?p_mat_type=be54d9b8bc7cdb09&control_no=2e5452a78a173652ffe0bdc3ef48d419 (accessed on 18 June 2019).
- Park, J.H.; Cho, J.S. The Effects of corporate governance characteristics on information asymmetry and stock price synchronicity. Korean Account. Rev. 2015, 40, 285–325. [Google Scholar]
- Oh, H.M.; Shin, H.Y. Voluntary disclosure, information asymmetry and corporate governance after the adoption of IFRS. Account. Inf. Res. 2016, 34, 159–188. [Google Scholar]
- Cho, J.S.; Jo, M.H. The Effect of accrual volatility on the firms’ information asymmetry, forecast error, and cost of capital. Korean Account. J. 2010, 19, 175–199. [Google Scholar]
- Francis, J.; LaFond, R.; Olsson, P.; Schipper, K. The market pricing of accruals quality. J. Account. Econ. 2005, 39, 295–327. [Google Scholar] [CrossRef]
- Botosan, C.A. Disclosure level and the cost of equity capital. Account. Rev. 1997, 72, 323–349. [Google Scholar]
- Ahn, Y.Y.; Shin, H.H.; Chang, J.H. The relationship between the foreign investor and information asymmetry. Korean Account. Rev. 2005, 30, 109–131. [Google Scholar]
- Glosten, L.R.; Harris, L.E. Estimating the components of the bid–ask spread. J. Financ. Econ. 1988, 21, 123–142. [Google Scholar] [CrossRef]
- Chang, H.S.; Ok, J.H. A study on the spread in the Korean stock market: An empirical analysis on the determinants and the behavior in the day. Asian Rev. Financ. Res. 1996, 11, 21–63. [Google Scholar]
- Jang, S.O. Information asymmetry and earnings management. Account. Inf. Res. 2007, 25, 221–245. [Google Scholar]
- Heckman, J.J. Sample selection bias as a specification error. Econometrica 1979, 47, 153–161. [Google Scholar] [CrossRef]
- Gow, I.D.; Ormazabal, G.; Taylor, D.J. Correcting for cross–sectional and time–series dependence in accounting research. Account. Rev. 2010, 85, 483–512. [Google Scholar] [CrossRef]
- Choi, S.U.; Lee, W.J. Analyst coverage and corporate investment efficiency. J. Ind. Econ. Bus. 2015, 28, 317–336. [Google Scholar]
- Yoo, C.Y.; Pae, J. Estimation and prediction tests of cash flow forecast accuracy. J. Forecast. 2011, 32, 215–225. [Google Scholar] [CrossRef]
- Dechow, P.M.; Sloan, R.G.; Sweeney, A.P. Detecting Earnings Management. Account. Rev. 1995, 70, 193–225. [Google Scholar]
- Cheong, E.H.; Woo, Y.S. The effect of K-IFRS adoption on bid–ask spread: The discriminatory effect by firm’s characteristics. Account. Inf. Res. 2015, 33, 211–236. [Google Scholar]


| Criteria | Firm-Year Observations |
|---|---|
| Quoted firms for fiscal years 2011–2015 | 3508 |
| (less) non-December 31 firms and financial firms for fiscal years | (308) |
| (less) Firms for which financial and stock data cannot be collected from FN-Guide and TS-2000 | (626) |
| (less) Firms for which analysts’ forecast data cannot be collected from FN-Guide | (1594) |
| Final sample | 980 |
| Panel A: Distribution Across Fiscal Years | ||||||
| Year | N | Firms with Analysts’ Cash Flow Forecasts Data | Percent (%) | Firms without Analysts’ Cash Flow Forecasts Data | Percent (%) | |
| 2011 | 109 | 67 | 61.47 | 42 | 38.53 | |
| 2012 | 142 | 131 | 92.25 | 11 | 7.75 | |
| 2013 | 215 | 175 | 81.40 | 40 | 18.60 | |
| 2014 | 240 | 200 | 83.33 | 40 | 16.67 | |
| 2015 | 274 | 263 | 95.99 | 11 | 4.01 | |
| Total | 980 | 836 | 85.31 | 144 | 14.69 | |
| Panel B: Industry Distribution | ||||||
| Industry | N | Firms with Analysts’ Cash Flow Forecasts Data | Percent (%) | Firms without Analysts’ Cash Flow Forecasts Data | Percent (%) | |
| Food, Beverage | 61 | 56 | 91.80 | 5 | 8.20 | |
| Fiber, Clothes, Leathers | 35 | 31 | 88.57 | 4 | 11.43 | |
| Timber, Pulp, Furniture | 11 | 8 | 72.73 | 3 | 27.27 | |
| Cokes, Chemical | 119 | 102 | 85.71 | 17 | 14.29 | |
| Medical Manufacturing | 36 | 31 | 86.11 | 5 | 13.89 | |
| Rubber & Plastic | 27 | 23 | 85.19 | 4 | 14.81 | |
| Non-Metallic | 14 | 9 | 64.29 | 5 | 35.71 | |
| Metallic | 52 | 42 | 80.77 | 10 | 19.23 | |
| Pc, Medical | 63 | 57 | 90.48 | 6 | 9.52 | |
| Machine & Electronic | 58 | 47 | 81.03 | 11 | 18.97 | |
| Other Transportation | 83 | 71 | 85.54 | 12 | 14.46 | |
| Construction | 52 | 44 | 84.62 | 8 | 15.38 | |
| Retail & Whole Sales | 95 | 84 | 88.42 | 11 | 11.58 | |
| Transportation Service | 35 | 30 | 85.71 | 5 | 14.29 | |
| Publishing, Broadcasting | 40 | 34 | 85.00 | 6 | 15.00 | |
| Professional Services | 104 | 88 | 84.62 | 16 | 15.38 | |
| Other | 95 | 79 | 83.16 | 16 | 16.84 | |
| Total | 980 | 836 | 85.31 | 144 | 14.69 | |
| PANEL A (N = 980) Full Sample for H 1-1 | |||||||
| Variable | Mean | Std. Dev. | Min | 25th Percentile | Median | 75th Percentile | Max |
| AF_ACC | −0.151 | 0.286 | −0.941 | −0.092 | −0.033 | −0.011 | 0.000 |
| JOINT_DUM | 0.853 | 0.354 | 0.000 | 1.000 | 1.000 | 1.000 | 1.000 |
| FOLLOW | 7.879 | 7.767 | 1.000 | 1.000 | 4.000 | 13.000 | 27.000 |
| LEV | 0.499 | 0.188 | 0.121 | 0.345 | 0.520 | 0.633 | 0.906 |
| ROE | 0.065 | 0.221 | −0.582 | 0.028 | 0.074 | 0.124 | 0.329 |
| SIZE | 28.484 | 1.593 | 25.507 | 27.214 | 28.324 | 29.619 | 32.623 |
| LOSSDUM | 0.149 | 0.356 | 0.000 | 0.000 | 0.000 | 0.000 | 1.000 |
| AGE | 2.697 | 0.895 | 0.000 | 2.079 | 2.890 | 3.367 | 4.094 |
| GRW | 0.185 | 0.707 | −0.717 | −0.060 | 0.045 | 0.157 | 1.944 |
| PANEL B (N = 836) Firm Samples with Analysts’ Cash Flow Forecasts Data | |||||||
| Variable | Mean | Std. Dev. | Min | 25th Percentile | Median | 75th Percentile | Max |
| AF_ACC | −0.092 | 0.194 | −0.941 | −0.069 | −0.026 | −0.009 | 0.000 |
| OCF_ACC | −0.186 | 0.235 | −1.417 | −0.213 | −0.115 | −0.060 | −0.006 |
| FOLLOW | 9.016 | 7.872 | 1.000 | 2.000 | 6.000 | 15.000 | 27.000 |
| LEV | 0.501 | 0.190 | 0.121 | 0.344 | 0.521 | 0.637 | 0.906 |
| ROE | 0.062 | 0.234 | −0.582 | 0.028 | 0.074 | 0.124 | 0.329 |
| SIZE | 28.647 | 1.572 | 25.507 | 27.388 | 28.582 | 29.782 | 32.623 |
| LOSSDUM | 0.152 | 0.359 | 0.000 | 0.000 | 0.000 | 0.000 | 1.000 |
| AGE | 2.713 | 0.879 | 0.000 | 2.079 | 2.890 | 3.401 | 4.094 |
| GRW | 0.180 | 0.653 | −0.717 | −0.036 | 0.049 | 0.148 | 1.944 |
| PANEL C (N = 144) Firm Samples with only Earnings Forecasts | |||||||
| Variable | Mean | Std. Dev. | Min | 25th Percentile | Median | 75th Percentile | Max |
| AF_ACC | −0.496 | 0.444 | −0.941 | −0.941 | −0.586 | −0.041 | −0.002 |
| FOLLOW | 1.324 | 0.735 | 1.000 | 1.000 | 1.000 | 1.000 | 7.000 |
| LEV | 0.487 | 0.178 | 0.121 | 0.361 | 0.495 | 0.616 | 0.850 |
| ROE | 0.067 | 0.127 | −0.716 | 0.028 | 0.074 | 0.132 | 0.312 |
| SIZE | 27.538 | 1.369 | 25.507 | 26.601 | 27.368 | 28.143 | 32.327 |
| LOSSDUM | 0.131 | 0.339 | 0.000 | 0.000 | 0.000 | 0.000 | 1.000 |
| AGE | 2.605 | 0.976 | 0.000 | 2.079 | 2.833 | 3.258 | 4.025 |
| GRW | 0.217 | 0.967 | −0.717 | −0.717 | −0.007 | 0.547 | 1.944 |
| PANEL D (N = 975) Sample for H 2 | |||||||
| Variable | Mean | Std. Dev. | Min | 25th Percentile | Median | 75th Percentile | Max |
| SPREAD | 0.806 | 0.515 | 0.000 | 0.407 | 0.650 | 1.186 | 1.830 |
| JOINT_DUM | 0.852 | 0.355 | 0.000 | 1.000 | 1.000 | 1.000 | 1.000 |
| STERET | 2.404 | 0.548 | 1.675 | 1.940 | 2.337 | 2.785 | 3.375 |
| PRICE | 10.582 | 1.441 | 6.397 | 9.445 | 10.556 | 11.495 | 14.639 |
| SIZE | 27.832 | 1.538 | 24.399 | 26.612 | 27.829 | 28.909 | 33.044 |
| BETA | 0.847 | 0.647 | −0.185 | 0.364 | 0.801 | 1.310 | 2.059 |
| FOR | 0.179 | 0.152 | 0.000 | 0.061 | 0.144 | 0.256 | 0.897 |
| LEV | 0.497 | 0.179 | 0.186 | 0.344 | 0.517 | 0.633 | 0.788 |
| Panel A | |||||
|---|---|---|---|---|---|
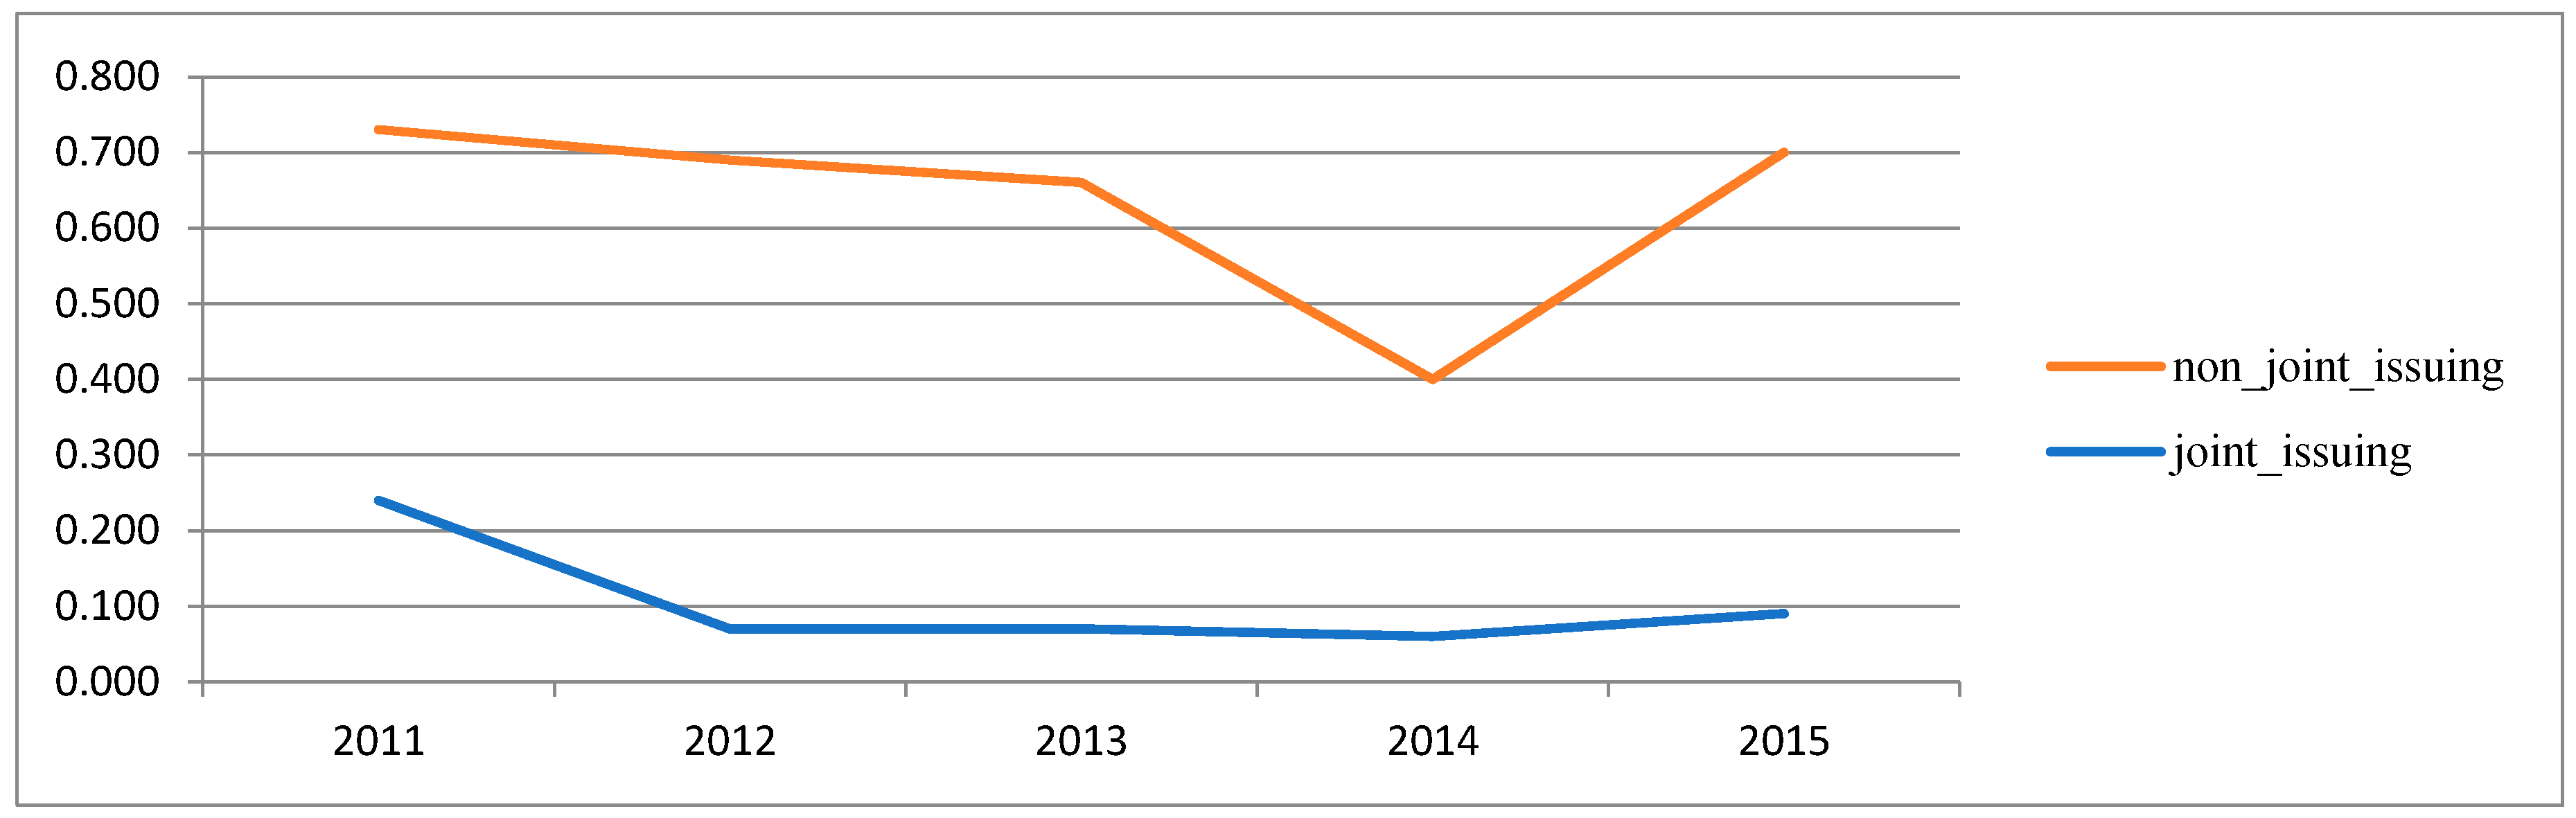
| Analysts’ Earnings Forecasts Error by Year (N = 980) for H 1-1 | |||||
| Variable | 2011 | 2012 | 2013 | 2014 | 2015 |
| joint_issuing | 0.240 | 0.070 | 0.070 | 0.060 | 0.090 |
| not_joint_issuing | 0.049 | 0.062 | 0.590 | 0.340 | 0.610 |
| Panel A | |||||
|---|---|---|---|---|---|
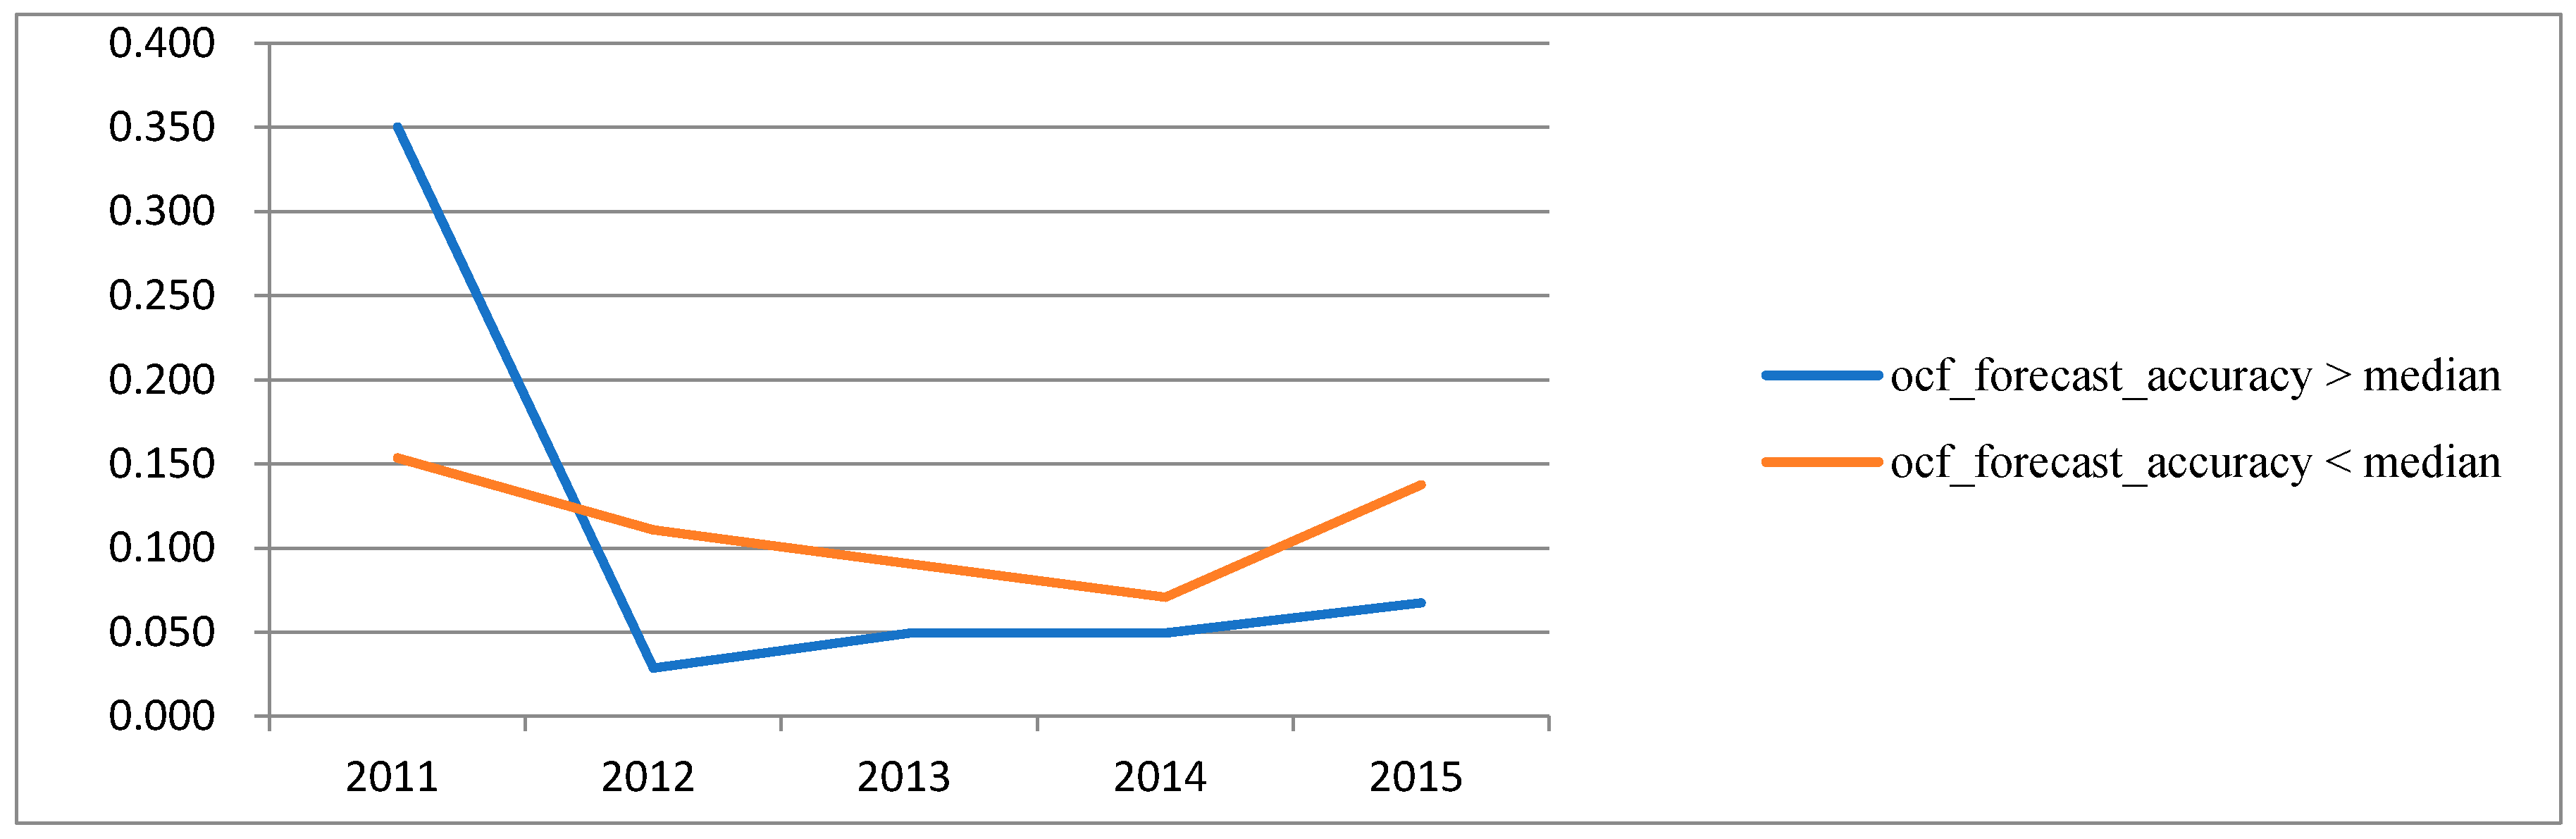
| Analysts’ Earnings Forecasts Error by Year (N = 836) for H 1-2 | |||||
| Variable | 2011 | 2012 | 2013 | 2014 | 2015 |
| ocf_forecast_accuracy > median | 0.350 | 0.029 | 0.049 | 0.050 | 0.067 |
| ocf_forecast_accuracy < median | 0.154 | 0.111 | 0.091 | 0.071 | 0.138 |
| Panel A | ||||||||
| JOINT_DUM | FOLLOW | LEV | ROE | SIZE | LOSSDUM | AGE | GRW | |
| AF_ACC | 0.505 *** | 0.269 *** | −0.135 *** | 0.244 *** | 0.165 *** | −0.217 *** | 0.020 | −0.067 |
| JOINT_DUM | 0.355 *** | 0.027 | 0.005 | 0.246 *** | 0.020 | 0.044 | −0.065 ** | |
| FOLLOW | 0.119 *** | 0.021 | 0.668 *** | 0.027 | 0.009 | −0.039 | ||
| LEV | −0.373 *** | 0.371 *** | 0.356 *** | 0.022 | 0.098 *** | |||
| ROE | −0.120 *** | −0.068 *** | −0.065 ** | 0.059 * | ||||
| SIZE | 0.152 *** | 0.201 *** | 0.266 *** | |||||
| LOSSDUM | 0.038 | 0.006 | ||||||
| AGE | −0.053 * | |||||||
| Panel B | ||||||||
| OCF_ACC | FOLLOW | LEV | ROE | SIZE | LOSSDUM | AGE | GRW | |
| AF_ACC | 0.135 *** | 0.144 *** | −0.217 *** | 0.407 *** | −0.015 | −0.366 *** | −0.073 ** | −0.088 ** |
| OCF_ACC | 0.004 | −0.101 *** | 0.197 *** | 0.008 | −0.117 *** | 0.058 * | −0.004 | |
| FOLLOW | 0.124 *** | 0.020 | 0.676 *** | 0.023 | −0.009 | −0.025 | ||
| LEV | −0.387 *** | 0.374 *** | 0.369 *** | 0.001 | 0.059 *** | |||
| ROE | −0.131 *** | −0.674 *** | −0.090 *** | 0.075 ** | ||||
| SIZE | 0.164 *** | 0.198 *** | 0.227 *** | |||||
| LOSSDUM | 0.053 | 0.001 * | ||||||
| AGE | −0.063 * | |||||||
| Panel C | ||||||||
| JOINT_DUM | STDRET | PRICE | SIZE | BETA | FOR | LEV | ||
| SPREAD | −0.111 *** | −0.094 *** | −0.082 *** | −0.358 | −0.289 *** | −0.125 *** | −0.240 *** | |
| JOINT_DUM | -0.085 *** | 0.191 *** | 0.287 *** | 0.039 | 0.198 *** | 0.023 | ||
| STDRET | −0.227 *** | −0.205 *** | 0.072 ** | −0.229 *** | 0.165 *** | |||
| PRICE | 0.660 *** | −0.081 *** | 0.407 *** | −0.176 *** | ||||
| SIZE | 0.058* | 0.576 *** | 0.023 | |||||
| BETA | −0.040 | 0.272 *** | ||||||
| FOR | −0.152 *** | |||||||
| Equation (1) | |||||
|---|---|---|---|---|---|
| Variables | Predicted Sign | Model-1 | Model-2 | Model-3 | Model-4 |
| INTERCEPT | −1.445 *** (−5.330) | −1.363 *** (−4.880) | −1.457 *** (−5.030) | −0.816 *** (−3.940) | |
| JOINT_DUM | (+) | 0.321 *** (12.000) | 0.262 *** (10.010) | 0.212 *** (6.760) | 0.142 *** (4.680) |
| FOLLOW | (+) | −0.001 (−0.390) | −0.004 * (−1.830) | −0.006 ** (−2.500) | -0.002 (−1.300) |
| LEV | (−) | −0.150 ** (−2.440) | −0.143 ** (−2.270) | −0.147 ** (−2.240) | −0.116 ** (−2.440) |
| ROE | (+/−) | 0.004 *** (3.420) | 0.004 *** (3.750) | 0.005 *** (4.150) | 0.002 *** (2.970) |
| SIZE | (+) | 0.041 *** (3.900) | 0.041 *** (3.770) | 0.046 *** (4.140) | 0.024 *** (3.040) |
| LOSSDUM | (−) | −0.035 (−0.990) | −0.023 (−0.630) | −0.012 (−0.320) | −0.069 (−2.630) |
| AGE | (+/−) | −0.009 (−0.770) | −0.004 (−0.380) | −0.001 (−0.080) | −0.009 (−0.970) |
| GRW | (+) | 0.001 (0.000) | 0.001 (0.160) | 0.001 (0.090) | 0.001 (−0.710) |
| YD | Included | Included | Included | Included | |
| ID | Included | Included | Included | Included | |
| No. | 980 | 980 | 980 | 722 | |
| F-VALUE | 15.15 *** | 12.95 *** | 14.08 *** | 6.92 *** | |
| ADJ R-SQ | 34.38% | 30.68% | 37.78% | 22.47% | |
| Equation (2) | |||||
|---|---|---|---|---|---|
| Variables | Predicted Sign | Model-1 | Model-2 | Model-3 | Model-4 |
| INTERCEPT | −0.760 *** (−3.600) | −0.577 *** (−3.290) | −0.435 *** (−3.210) | −0.576 *** (−3.170) | |
| OCF_ACC | (+) | 0.059 *** (4.230) | 0.059 *** (5.500) | 0.061 *** (8.400) | 0.094 *** (2.840) |
| FOLLOW | (+) | 0.001 (0.180) | −0.001 (−1.290) | −0.002 ** (−2.380) | −0.001 (−1.190) |
| LEV | (−) | −0.035 (−0.730) | −0.033 (−0.800) | −0.004 (−0.130) | −0.015 (−0.360) |
| ROE | (+/−) | 0.004 *** (4.310) | 0.002 *** (3.050) | 0.001 *** (3.020) | 0.003 *** (3.770) |
| SIZE | (+) | 0.026 ***(3.230) | 0.020 ***(2.990) | 0.014 ***(2.760) | 0.020 ***(2.830) |
| LOSSDUM | (−) | −0.054 ** (−1.980) | −0.071 *** (−3.240) | −0.101 *** (−6.030) | −0.063 *** (−2.810) |
| AGE | (+/−) | −0.024 *** (−2.680) | −0.014 * (−1.880) | −0.005 (−0.910) | −0.013 (−1.640) |
| GRW | (+) | 0.001 (0.540) | −0.002 (−1.500) | −0.001 (−0.690) | −0.002 (−1.590) |
| YD | Included | Included | Included | Included | |
| ID | Included | Included | Included | Included | |
| No. | 836 | 836 | 836 | 687 | |
| F-VALUE | 15.15 *** | 7.10 *** | 11.17*** | 5.96 *** | |
| ADJ R-SQ | 34.38% | 24.39% | 40.08% | 20.62% | |
| Equation (3) | |||||
|---|---|---|---|---|---|
| Variables | Predicted Sign | Model-1 | Model-2 | Model-3 | Model-4 |
| INTERCEPT | 2.055 *** (6.460) | 1.893 *** (5.930) | 1.772 *** (5.500) | 2.319 *** (6.900) | |
| JOINT_DUM, | (−) | −0.165 ** (−2.290) | −0.232 *** (−3.630) | −0.256 *** (−4.170) | −0.210 * (−1.660) |
| STDRET | (+) | −0.027 (−0.450) | −0.031 (−0.510) | −0.030 (−0.490) | −0.142 ** (−2.430) |
| PRICE | (+) | −0.042 * (−1.750) | −0.027 (−1.100) | −0.021 (−0.850) | −0.034 (−1.580) |
| SIZE | (−) | −0.001 *** (−2.760) | −0.001 *** (−2.820) | −0.001 *** (−2.650) | −0.001 *** (−3.980) |
| BETA | (+) | −0.229 *** (−4.460) | −0.225 *** (−4.420) | −0.218 *** (−4.290) | −0.346 *** (−8.320) |
| FOR | (−) | −0.446 ** (−2.250) | −0.375 * (−1.890) | −0.308 (−1.540) | −0.386 ** (−2.020) |
| LEV | (+/−) | −0.960 *** (−5.770) | −0.902 *** (−5.410) | −0.852 *** (−5.080) | −0.874 *** (−5.520) |
| YD | Included | Included | Included | Included | |
| ID | Included | Included | Included | Included | |
| No. | 975 | 975 | 975 | 718 | |
| F-VALUE | 8.85 *** | 9.30 *** | 9.53 *** | 16.93 *** | |
| ADJ R-SQ | 22.05% | 22.95% | 23.42% | 19.73% | |
| Equation (1) | ||||
|---|---|---|---|---|
| Variables | Predicted Sign | Coefficient | t-Value | p-Value |
| INTERCEPT | −0.889 ** | −2.250 | 0.025 | |
| JOINT_DUM | (+) | 0.363 *** | 12.780 | 0.001 |
| FOLLOW | (+) | −0.001 | −0.390 | 0.698 |
| LEV | (−) | −0.089 | −1.520 | 0.128 |
| ROE | (+/−) | 0.003 *** | 2.690 | 0.008 |
| SIZE | (+) | 0.021 * | 1.670 | 0.095 |
| LOSSDUM | (−) | −0.049 | −1.470 | 0.143 |
| AGE | (+/−) | 0.002 | 0.200 | 0.843 |
| GRW | (+) | 0.001 | 0.230 | 0.821 |
| IMR | (+/−) | −0.209 | −0.960 | 0.335 |
| YD | Included | |||
| ID | Included | |||
| No. | 980 | |||
| F-VALUE | 14.08 ** | |||
| ADJ R-SQ | 37.78% | |||
| Equation (3) | ||||
|---|---|---|---|---|
| Variables | Predicted Sign | Coefficient | t-Value | p-Value |
| INTERCEPT | 1.106 *** | 2.950 | 0.003 | |
| JOINT_DUM | (−) | −0.138 * | −1.645 | 0.100 |
| STDRET | (+) | −0.170 *** | −3.170 | 0.002 |
| PRICE | (+) | 0.006 | 0.270 | 0.788 |
| SIZE | (−) | −0.001 *** | −4.300 | 0.001 |
| BETA | (+) | −0.251 *** | −6.500 | 0.001 |
| FOR | (−) | −0.322 | −1.790 | 0.075 |
| LEV | (+/−) | −0.649 *** | −4.370 | 0.001 |
| IMR | (+/−) | 2.179 *** | 4.310 | 0.001 |
| YD | Included | |||
| ID | Included | |||
| No. | 975 | |||
| F-VALUE | 18.27 *** | |||
| ADJ R-SQ | 19.03% | |||
| Equation (1) | ||||
|---|---|---|---|---|
| Variables | Predicted Sign | Coefficient | t-Value | p-Value |
| INTERCEPT | −0.986 *** | −5.059 | 0.007 | |
| JOINT_DUM | (+) | 0.368 *** | 7.059 | 0.002 |
| FOLLOW | (+) | 0.001 | 0.506 | 0.639 |
| LEV | (−) | −0.144 ** | −3.544 | 0.024 |
| ROE | (+/−) | 0.003 ** | 3.071 | 0.037 |
| SIZE | (+) | 0.021 ** | 2.903 | 0.044 |
| LOSSDUM | (−) | −0.086 | −2.026 | 0.113 |
| AGE | (+/−) | −0.003 | −0.311 | 0.771 |
| GRW | (+) | −0.003 ** | −4.394 | 0.012 |
| Included | ||||
| ID | Included | |||
| No. | 980 | |||
| F-VALUE | 32.32 *** | |||
| ADJ R-SQ | 33.50% | |||
| Equation (2) | ||||
|---|---|---|---|---|
| Variables | Predicted Sign | Coefficient | t-Value | p-Value |
| INTERCEPT | −0.215 | −1.659 | 0.172 | |
| OCF_ACC | (+) | 0.046 ** | 3.642 | 0.022 |
| FOLLOW | (+) | 0.003 | 1.148 | 0.315 |
| LEV | (−) | −0.055 | −1.513 | 0.205 |
| ROE | (+/−) | 0.004 * | 2.541 | 0.064 |
| SIZE | (+) | 0.006 | 0.978 | 0.384 |
| LOSSDUM | (−) | −0.090 * | −2.735 | 0.052 |
| AGE | (+/−) | −0.012 * | −2.242 | 0.088 |
| GRW | (+) | −0.004 *** | −5.737 | 0.005 |
| YD | Included | |||
| ID | Included | |||
| No. | 836 | |||
| F-VALUE | 23.54 *** | |||
| ADJ R-SQ | 23.06% | |||
| Equation (3) | ||||
|---|---|---|---|---|
| Variables | Predicted Sign | Coefficient | t-Value | p-Value |
| INTERCEPT | 2.207 *** | 6.157 | 0.004 | |
| JOINT_DUM | (−) | −0.142 | −1.473 | 0.215 |
| STDRET | (+) | −0.147* | −2.602 | 0.060 |
| PRICE | (+) | −0.035 | −1.024 | 0.364 |
| SIZE | (−) | −0.001 | −1.800 | 0.147 |
| BETA | (+) | −0.269 *** | −4.538 | 0.011 |
| FOR | (−) | −0.502 | −1.776 | 0.150 |
| LEV | (+/−) | −0.870 ** | −3.276 | 0.031 |
| YD | Included | |||
| ID | Included | |||
| No. | 975 | |||
| F-VALUE | 31.71 *** | |||
| ADJ R-SQ | 17.92% | |||
© 2019 by the author. Licensee MDPI, Basel, Switzerland. This article is an open access article distributed under the terms and conditions of the Creative Commons Attribution (CC BY) license (http://creativecommons.org/licenses/by/4.0/).
Share and Cite
Oh, H.M.; Shin, H.y. A Study on the Relationship between Analysts’ Cash Flow Forecasts Issuance and Accounting Information: Evidence from Korea. Sustainability 2019, 11, 3399. https://doi.org/10.3390/su11123399
Oh HM, Shin Hy. A Study on the Relationship between Analysts’ Cash Flow Forecasts Issuance and Accounting Information: Evidence from Korea. Sustainability. 2019; 11(12):3399. https://doi.org/10.3390/su11123399
Chicago/Turabian StyleOh, Hyun Min, and Ho young Shin. 2019. "A Study on the Relationship between Analysts’ Cash Flow Forecasts Issuance and Accounting Information: Evidence from Korea" Sustainability 11, no. 12: 3399. https://doi.org/10.3390/su11123399
APA StyleOh, H. M., & Shin, H. y. (2019). A Study on the Relationship between Analysts’ Cash Flow Forecasts Issuance and Accounting Information: Evidence from Korea. Sustainability, 11(12), 3399. https://doi.org/10.3390/su11123399