Article

Soil Reclamation of Abandoned Mine Lands by Revegetation in Northwestern Part of Transylvania: A 40-Year Retrospective Study

1
Department of Soil Sciences, University of Agricultural Sciences and Veterinary Medicine Cluj-Napoca, Calea Mănăștur 3-5, 400372 Cluj-Napoca, Romania
2
Department of Geology, “Babeș-Bolyai” University, Mihail Kogălniceanu 1, 400084 Cluj-Napoca, Romania
3
Department of Horticulture, University of Agricultural Sciences and Veterinary Medicine Cluj-Napoca, Calea Mănăștur 3-5, 400372 Cluj-Napoca, Romania
4
Department of Land Measurements, Management, Mechanization, University of Craiova, Libertăţii 19, 200421 Craiova, Romania
*
Author to whom correspondence should be addressed.
Sustainability 2019, 11(12), 3393; https://doi.org/10.3390/su11123393
Submission received: 23 April 2019 / Revised: 18 May 2019 / Accepted: 15 June 2019 / Published: 19 June 2019

Abstract

:
Mining activities for mineral resources over the years have resulted in major soil damage. Due the removal process of desired mineral materials, soil textures have been destroyed, various nutrient cycles have been disturbed, and microbial communities have been altered, affecting vegetation and leading to the destruction of wide areas of land in many countries. Therefore, soil restoration of abandoned mining lands became a very important part of sustainable development strategies and also prescribed by law in several countries. The main aims of this study were to develop an ecological land restoration strategy to the degraded lands due former kaolin, quartz sand, and iron mining located in Aghireșu and Căpușu Mare in Cluj County, in the Northwestern part of Transylvania from Romania and monitor soil quality changes over 40 years. To assess the effectiveness of soil reclamation of mine lands, 30 soil profiles were examined and 450 soil samples were collected from three depths (0–20 cm, 20–50 cm, and 50–80 cm) and subjected to physical and chemical analyses, and compared for their sustainable and beneficial use. All the proposed plant covers (natural grassland, pasture cover, black locust, Norway spruce, and scots pine) significantly improved the overall soil quality with the increasing years of reclamation following various patterns. Pasture cover most significantly enhanced the soil’s microbial activity, organic carbon, nitrogen, phosphorus, and potassium content followed by natural grassland. The results of this study show that considerable changes in soil quality was reached by revegetation of these abandoned mine lands restoring their ecological integrity and self-sustainability.

1. Introduction

Surface mining for coal and other valuable geological materials have been causing severe ecological disturbances worldwide since pre-historic times. The rate of consumption of mineral resources is still increasing due to the acceleration of urbanization, population growth, and the advancement in technology and science which has been exceptionally fast in the 20th and 21st century. In this context, our society requires more and more mineral resources every day to provide and maintain comfort. In more than 100 countries, the world’s mining activities are practiced at different scales to satisfy the continuously increasing demand of several sectors such as industry, technology, and agriculture [1]. The most important countries with high economic influence are: Australia, Botswana, Canada, Guinea, Kazakhstan, Papua New Guinea, Peru, South Africa, United States, China, India, Brazil, Mexico, Ghana, Chile, etc. [2,3,4]. Mining countries also include some European countries with significant mining activities in the past and now such as Germany, Great Britain, Check Republic, Poland, Bulgaria, Hungary, and Romania [2,5,6,7]. From an environmental perspective, surface mining activities substantially degrade lands disrupting both the aesthetics of the landscape and soil horizons and structure, its microflora and nutrient cycles which are crucial for maintaining a healthy and productive ecosystem [8]. Thus, even more and more arable lands are expendable, since the demand for resources is increasing. In Great Britain, in the period between 1959 and 1965, the average annual arable land loss due coal mining was ca. 1800 hectares while in Czech Republic 20,000 hectares were destroyed by coal extraction [9]. In Bulgaria, the major lignite reserves are lying beneath the most productive agricultural lands out of which 14,000 hectares have been exploited and destroyed. Romania is ranked the 10th in the world in terms of the diversity of minerals including coal, lignite, iron ore, copper, salt, gold, silver, chromium, gallium, titanium, antimony, mercury, vanadium, barite, borate, arsenic, celestine (strontium), emery, feldspar, limestone, magnesite, marble, perlite, pumice, pyrites (sulfur), and clay. Roșia Montană area is considered the largest gold deposit in continental Europe, estimated at over 300 tons of gold and 1600 tons of silver. The mining activities along the years resulted in a decrease of agricultural area per capita from 0.63 ha in 1938 to 0.44 ha in 1984 [10]. Today, ca. 18,000 hectares are subjected to mining activities in Romania destroying natural habitats and ecosystems thus becoming a limiting factor for agricultural lands [7]. The aforementioned reports indicate the imperative need of mining land restoration to be able to ensure food security, environmental sustainability and economic opportunity for humankind in the future. Ecological restoration and abandoned mine land reclamation have already become a very important part of sustainable developmental strategies in many countries. In Romania, post mining land use activities are still neglected, being practiced only on a very small scale. Therefore, the main aim of this study was to restore the ecological integrity of the two abandoned and disturbed mine lands (Căpușu Mare and Aghireșu) by revegetation, where former iron ore, kaolin and quartz sand exploitations were carried out since 1960. To be able to assess the effectiveness of soil restoration, the deterioration of physical, chemical and biological properties of the soil were also examined. The results revealed that restoration of the vegetation cover on tailing dumps contribute to soil quality improvement through stabilization, pollution control, aesthetic improvement, and soil fertility. Mine land reclamation strategies must concern soil structure, fertility, microflora, and nutrient cycling in order to recover the land as much as possible and to act as a self-sustaining ecosystem.

2. Materials and Methods

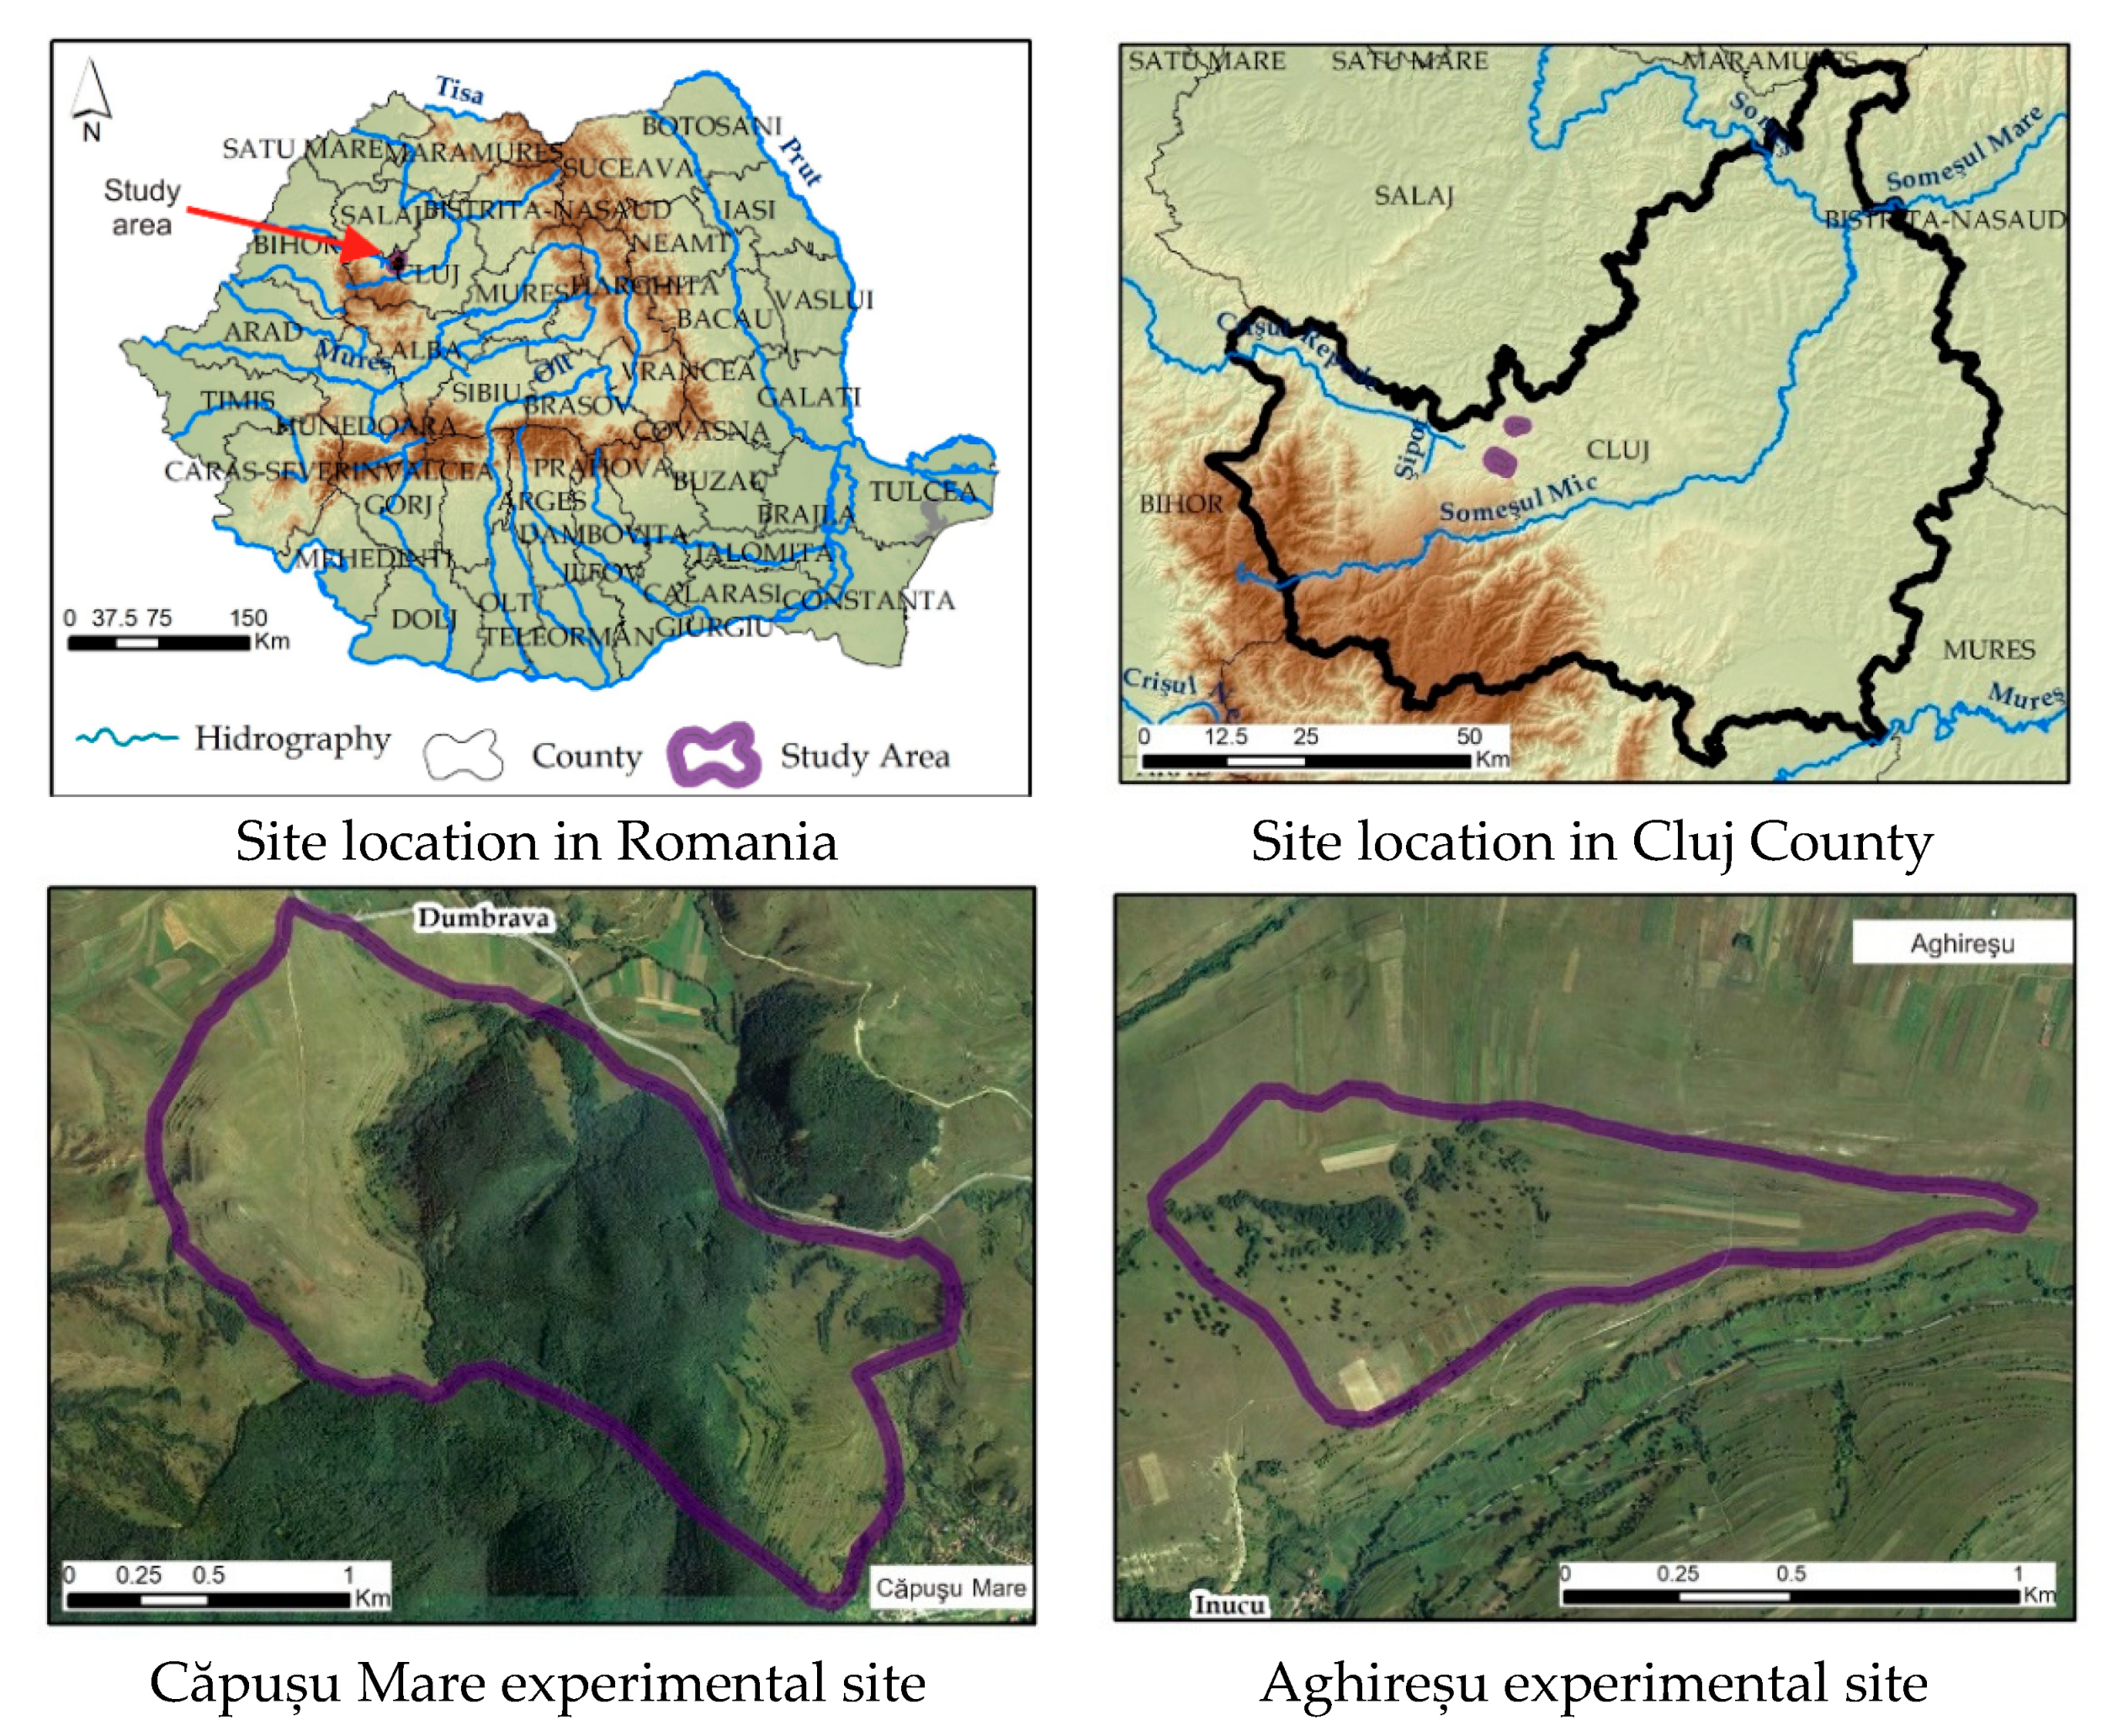
2.1. Site Location and Study Area
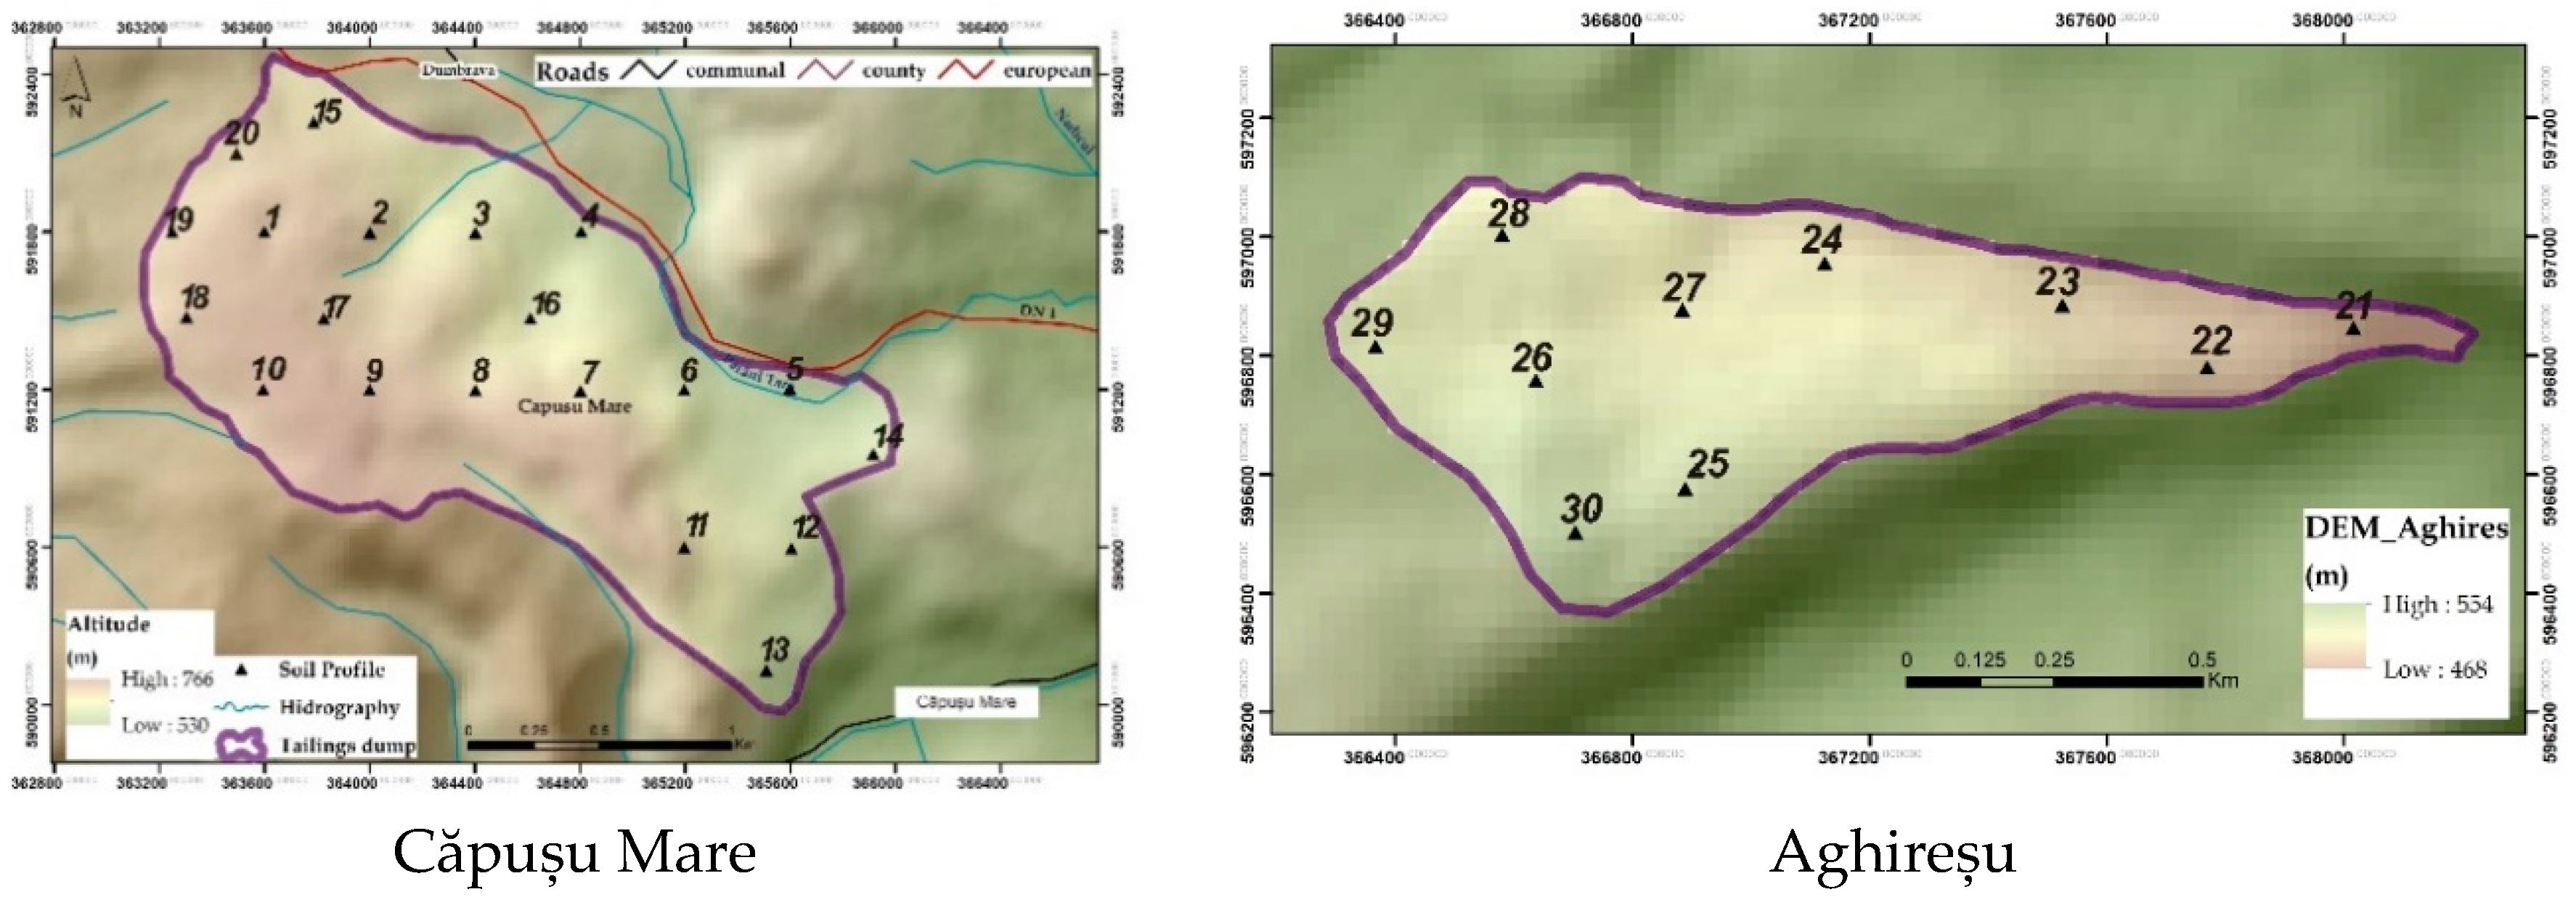
This research has been carried out investigating two different abandoned mine lands from the northwestern part of Transylvania, namely Căpușu Mare and Aghireșu across Extensive surface mining has been conducted in these areas since the 1928s causing drastic disturbance in soil properties and composition due to the non-selective deposition of the excavated soil. Most of the non-mined areas were forested with mixed hardwoods especially in Căpușu Mare. The areas under study also have some other landscape forms and elements such as roads and urban areas. There are some agricultural lands as well, but more than two-thirds of the total area is used primarily for grazing livestock.

2.1.1. Căpușu Mare

Căpușu Mare is a commune situated to the west at 25 km from Cluj-Napoca (Coordinates: 46°47′20″ N 23°17′30″ E) covering 13,456 hectares (Figure 1). The evolution and development of this commune was due to the iron-rich character of the land from this area, which was first discovered by Stoicovici and Mureșan in 1963 in oolitic limonite form. From both geographic and geological point of view, the territory of this commune could be divided in two units: mountains in south (schist composed) and the northern sedimentary plateau with three watercourses, namely Căpuș, Agârbiciu, and Râșca. The soil types from this area were identified according to the Romanian Soil Taxonomy System [11] and correlated with the World Reference Base for soil resources [12]. Thus, the most characteristic soil types identified in this area were as follow: Rustic Podzols (PZ rs), Haplic Podzols (PZ ha), Chromic Luvisols (LC vr), SkeletikPodzols (PZ sk), Stagnic-gleyc Phaeozems (PH gl-st), Luvi Phaeozems (PH lv), Rendzic Leptosols (LP rz).
Regarding vegetation, the dominant herbaceous vegetation (plants with the highest cover values) in this area was consisted of Melilotus officinalis, Agropyron cristatum, Trifolium repens, Ranunculus acer, Centaurea cyanus, Genista tinctoria, Trisetum flavescens, Agrostis tenuis, Rumex communis, Festuca valesiaca, Lolium perenne, Agropyron repens, Achillea millefolium, Bromus cristatum, and Dactylis glomerata. The shrub layer was mostly dominated by Prunus spinosa, Rosa canina, and Crataegus monogyna.

2.1.2. Aghireșu

Aghireșu is another commune located in the northwestern part of Cluj County on the Someșan plateau (Coordonate: 46°52′21″ N 23°14′30″ E, Figure 1) covering 105.79 km2 with four watercourses [13]. This area became of a great economic importance since 1936 due to the kaolin quartz sand deposits which have been subjected to mining activities since 1928. The most characteristic soil types identified in this area were: Rustic Podzols (PZ rs), Chromic Luvisols (LC vr), Stagnic-gleyc-vertic Phaeozems (PH lv-gl-st), Molic Gleysols (GLmo), Gleic Fluvisols (FL gl), Endoleptic Phaeozems (PH le), and Haplic Phaeozems (PH ha).
The dominant herbaceous layer vegetation identified during this research was consisted of the following species: Sinapis arvensis, Andropogon ischaemum, Artemisia vulgaris, Festuca rubra, Dactylis glomerata, Carum carvi, Festuca pratensis, Bromus comutatus, Carex vulpina, Plantago media, Agrostis stolonifera, Calamagrostis epigeos, Ranunculus repens, Infitum oficinale, Trifolium fragiferum, Centaurea cyanus, Poa nemoralis, Agropyron repens, Setoria glauca, and Chenopodium album. The shrub layers were mostly dominated by Corylus avellana, Hippophae rhamnoides, Prunus spinosa, Rosa canina, Crataegus monogyna, and Cornus mas.
For the rehabilitation approach, three native plant species, such as Robinia pseudacacia, Picea abies, and Pinus sylvestris were chosen to restore the original site functionalities according to the results of the land suitability analyses and the freeholders’ requests. Before planting, in spring, the mined lands were leveled with a bulldozer and the following planting schemes were established and applied: (a) Robinia pseudacacia—2 × 2 m; (b) Picea abies—2 × 3 m and (c) Pinus sylvestris—3 × 4 m. No fertilization or special maintenance were applied during the growing period.

2.2. Soil Sampling

The first mining waste samples from 30 profiles were collected randomly in 1979 from three different soil depths (0–20, 20–50, and 50–80 cm). The locations of the sampling points are shown in Figure 2. The soil samples were then taken to the laboratory and subjected to further analyses to determine their chemical, physical and biological properties. During this research, other four sets of soil samples were collected from the same sites to analyze the same chemical, physical, and biological soil parameters after 10, 20, 30, and 40 years of vegetation growth to check the effectiveness of the soil reclamation strategy (Figure 2).

2.3. Soil Chemical, Physical, and Biological Analyses

The soil samples were analyzed for soil pH, organic matter, total nitrogen, available phosphorus available potassium, total organic carbon content, enzymatic activity (dehydrogenase, catalase, and sucrose) and some biological properties such as soil respiration, bacteria and fungi. The samples were air-dried and crushed finely prior to analyses. Soil acidity was determined according to potentiometric method with a combined glass and calomel electrode in aqueous suspension using 1:2.5 soil/water ratio. The organic matter of the soil samples has been determined according to Schollengerger’s method (1927) [14]. Total nitrogen content of the soil was measured according to Kjeldahl method based on disaggregation with H2SO4 at 350 °C, using 96% K2SO4 and 3% CuSO4 as catalysts [15]. Available phosphorus and potassium contents were measured according to Egner-Riehm-Domingo method as described by Oreshkin (1980) [16]. Total organic carbon content was determined by wet oxidation according to the modified Walkely-Black method (1934) [17]. Catalase activity and enzymatic cleavage of H2O2 in the soil samples were determined by the Kappen method [18]; the results were expressed in mg H2O2/g soil dry soil. Dehydrogenase activity was measured according to Casida method [19] and the results were expressed in mg formazan/g soil dry soil. Saccharase activity was determined by salicylic acid colorimetry with sucrose as substrate and the results were expressed as mg glucose g−1 dry sample. The results were expressed as reducing sugar percentage. Soil respiration was measured in situ by alkali absorption followed by conductimetric analysis [20]. Total soil microorganisms were counted using a soil dilution technique carried out in Petri dishes, using agar as growing medium for both bacteria and fungi. The inoculated agar plates with bacteria were incubated at 28 °C for 3 days while plates with fungi colonies were counted after 5 days [21].

2.4. Land Suitability Analysis

Land suitability analyses were carried out according to the methodology established by the Institute of Soil Sciences and Agrochemistry 1987 [22]. The analyses were carried out in the first year of research (1979) to check what kind of plant species would be suitable to be grown on these degraded sites. Land evaluation were based on the topography, soil, and climate conditions of the studied areas. In total, 30 land suitability analyses were carried out investigating all the soil types identified and land configurations of the experimental sites (data not shown). The results of the land suitability analyses revealed that no agricultural crops could be grown on these fields due to low soil quality and environmental conditions.

2.5. GIS Techniques

The data needed for this technique were derived from existing topographic maps, aerial photographs of the studied areas and obtained data as a result of field surveys and laboratory analyses. ArcMap 10.1 software was used to manipulate the data sets and create maps with specific soil parameters such as soil pH, organic matter, total nitrogen, available phosphorus, available potassium, total organic carbon content, enzymatic activity, soil respiration, bacteria, and fungi. The advantages of using GIS techniques are the possibilities to extrapolate the data for the whole area under study based on prior, local determinations and to analyze their variation at different time intervals in order to check the suitability and restrictions of the land for soil reclamation strategies [23,24,25,26]. Thus, eight maps have been created for each experimental site at two time intervals to check the evolution of the most important soil parameters (soil pH, organic matter, total nitrogen, available phosphorus, available potassium, total organic carbon content, soil respiration, bacteria, and fungi) during 40 years of investigation: Time 0 (T0)—the moment of first data record and Time 40 (T40)—the moment of last measurements taken.

2.6. Statistical Analysis

All the data were analyzed using IBM SPSS Statistics 19. One-way ANOVA was assessed at 95% confidence level to determine whether there are statistically significant differences between the annual means. When the ANOVA null hypothesis was rejected, post hoc comparisons were performed applying Tukey’s honestly significant test at p < 0.05 to determine significant differences between the means.

3. Results and Discussion

3.1. Soil Chemical, Physical, and Biological Status

3.1.1. Land Suitability

Based on the mean of the land evaluation marks, five different vegetation covers were proposed for revegetation of the degraded lands as follow: natural grassland consisted mostly of Agropyron repens, Equisetum arvense, Arenaria serpyllifolia, Tussilago farfara, Lolium perenne, Trifolium medium, Onobrychis viciifolia, and Melilotus officinalis (soil profiles 1, 5, 6, 11, 12, 13, 14, 15, 18, 19, 21, 22, 23, 25, 28, 29, 30), pasture vegetation dominated by Festuca rubra and Agrostis tenuis; Festuca pratensis, Cynosurus cristatus, Poa pratensis, Dactylis glomerata, Trifolium pratense, Trifolium montanum and Lotus corniculatus (soil profiles 20, 24, 27), Robinia pseudacacia (soil profiles 2, 10, 17), Picea abies (soil profiles 3, 9), and Pinus sylvestris (soil profiles 4, 7, 8, 16, 26).

3.1.2. Soil PH

Soil pH is the most important indicator measured for estimating soil health especially in mine soils, since it has a great influence on key soil processes [8,27]. The variation of pH values of the revegetated mine lands under different plant covers during the years is shown in Table 1. The results show that soil pH is influenced not only by the vegetation layer of a given area, but also by other factors such as climate, mineral content of the soil, and soil texture [28,29,30]. Thus, no significant differences between the soil pH values were observed underneath pasture and Robinia pseudacacia plantation, while under natural grassland and conifer vegetation layers the soil pH was slightly significant as compared to its initial value, from Time 0, varying from 6.65 to 6.97 under natural grassland, from 7.23 to 7.72 under Picea abies and from 6.69 to 7.03 under Pinus sylvestris layer. It is worth mentioning that Picea abies acidified more of the soil over the years than the other plants. Previous studies show that a mine soil pH usually ranges from 6.0 to 7.5, which is suitable for the growth of forages and other agronomic or horticultural uses [31,32].

3.1.3. Organic Matter

Maintaining and improving soil quality is crucial, since agricultural productivity and environmental quality has to be sustained for future generations as well [33]. In this context, the soil organic matter is the most important characteristic that has to be taken into consideration. Mining activities, remove the top soil layer transforming these lands less fertile and more susceptible for soil hazards. Growing cover crops is one of the best practices to improve the organic matter content of the soil and hence soil health and quality. Vegetation layers—besides adding plant material to the soil contributing to its organic matter replenishment—can also fix N in the soil, moderate soil temperature protecting hence soil organisms and can provide habitat for beneficial insects and other organisms. The variation of organic matter content under the five proposed vegetation covers are summarized in Table 1. The result show that with the increase of reclamation years, the organic matter content of the soil increased significantly under natural grassland, pasture vegetation, and Robinia pseudacacia plantation, but no significant differences were detected under coniferous plant covers. The highest increase (30%) in organic matter content during the 40 years of research was reached underneath pasture cover followed by 14.81% increase under natural grassland cover. Visual comparisons of soil organic matter content accumulation in the experimental sites are presented in Figure 3. Previous reports show that this percentage can be achieved more rapidly, within five years, with agricultural crop rotation and high fertilization doses depending on the location and characteristics of the studied area [34].

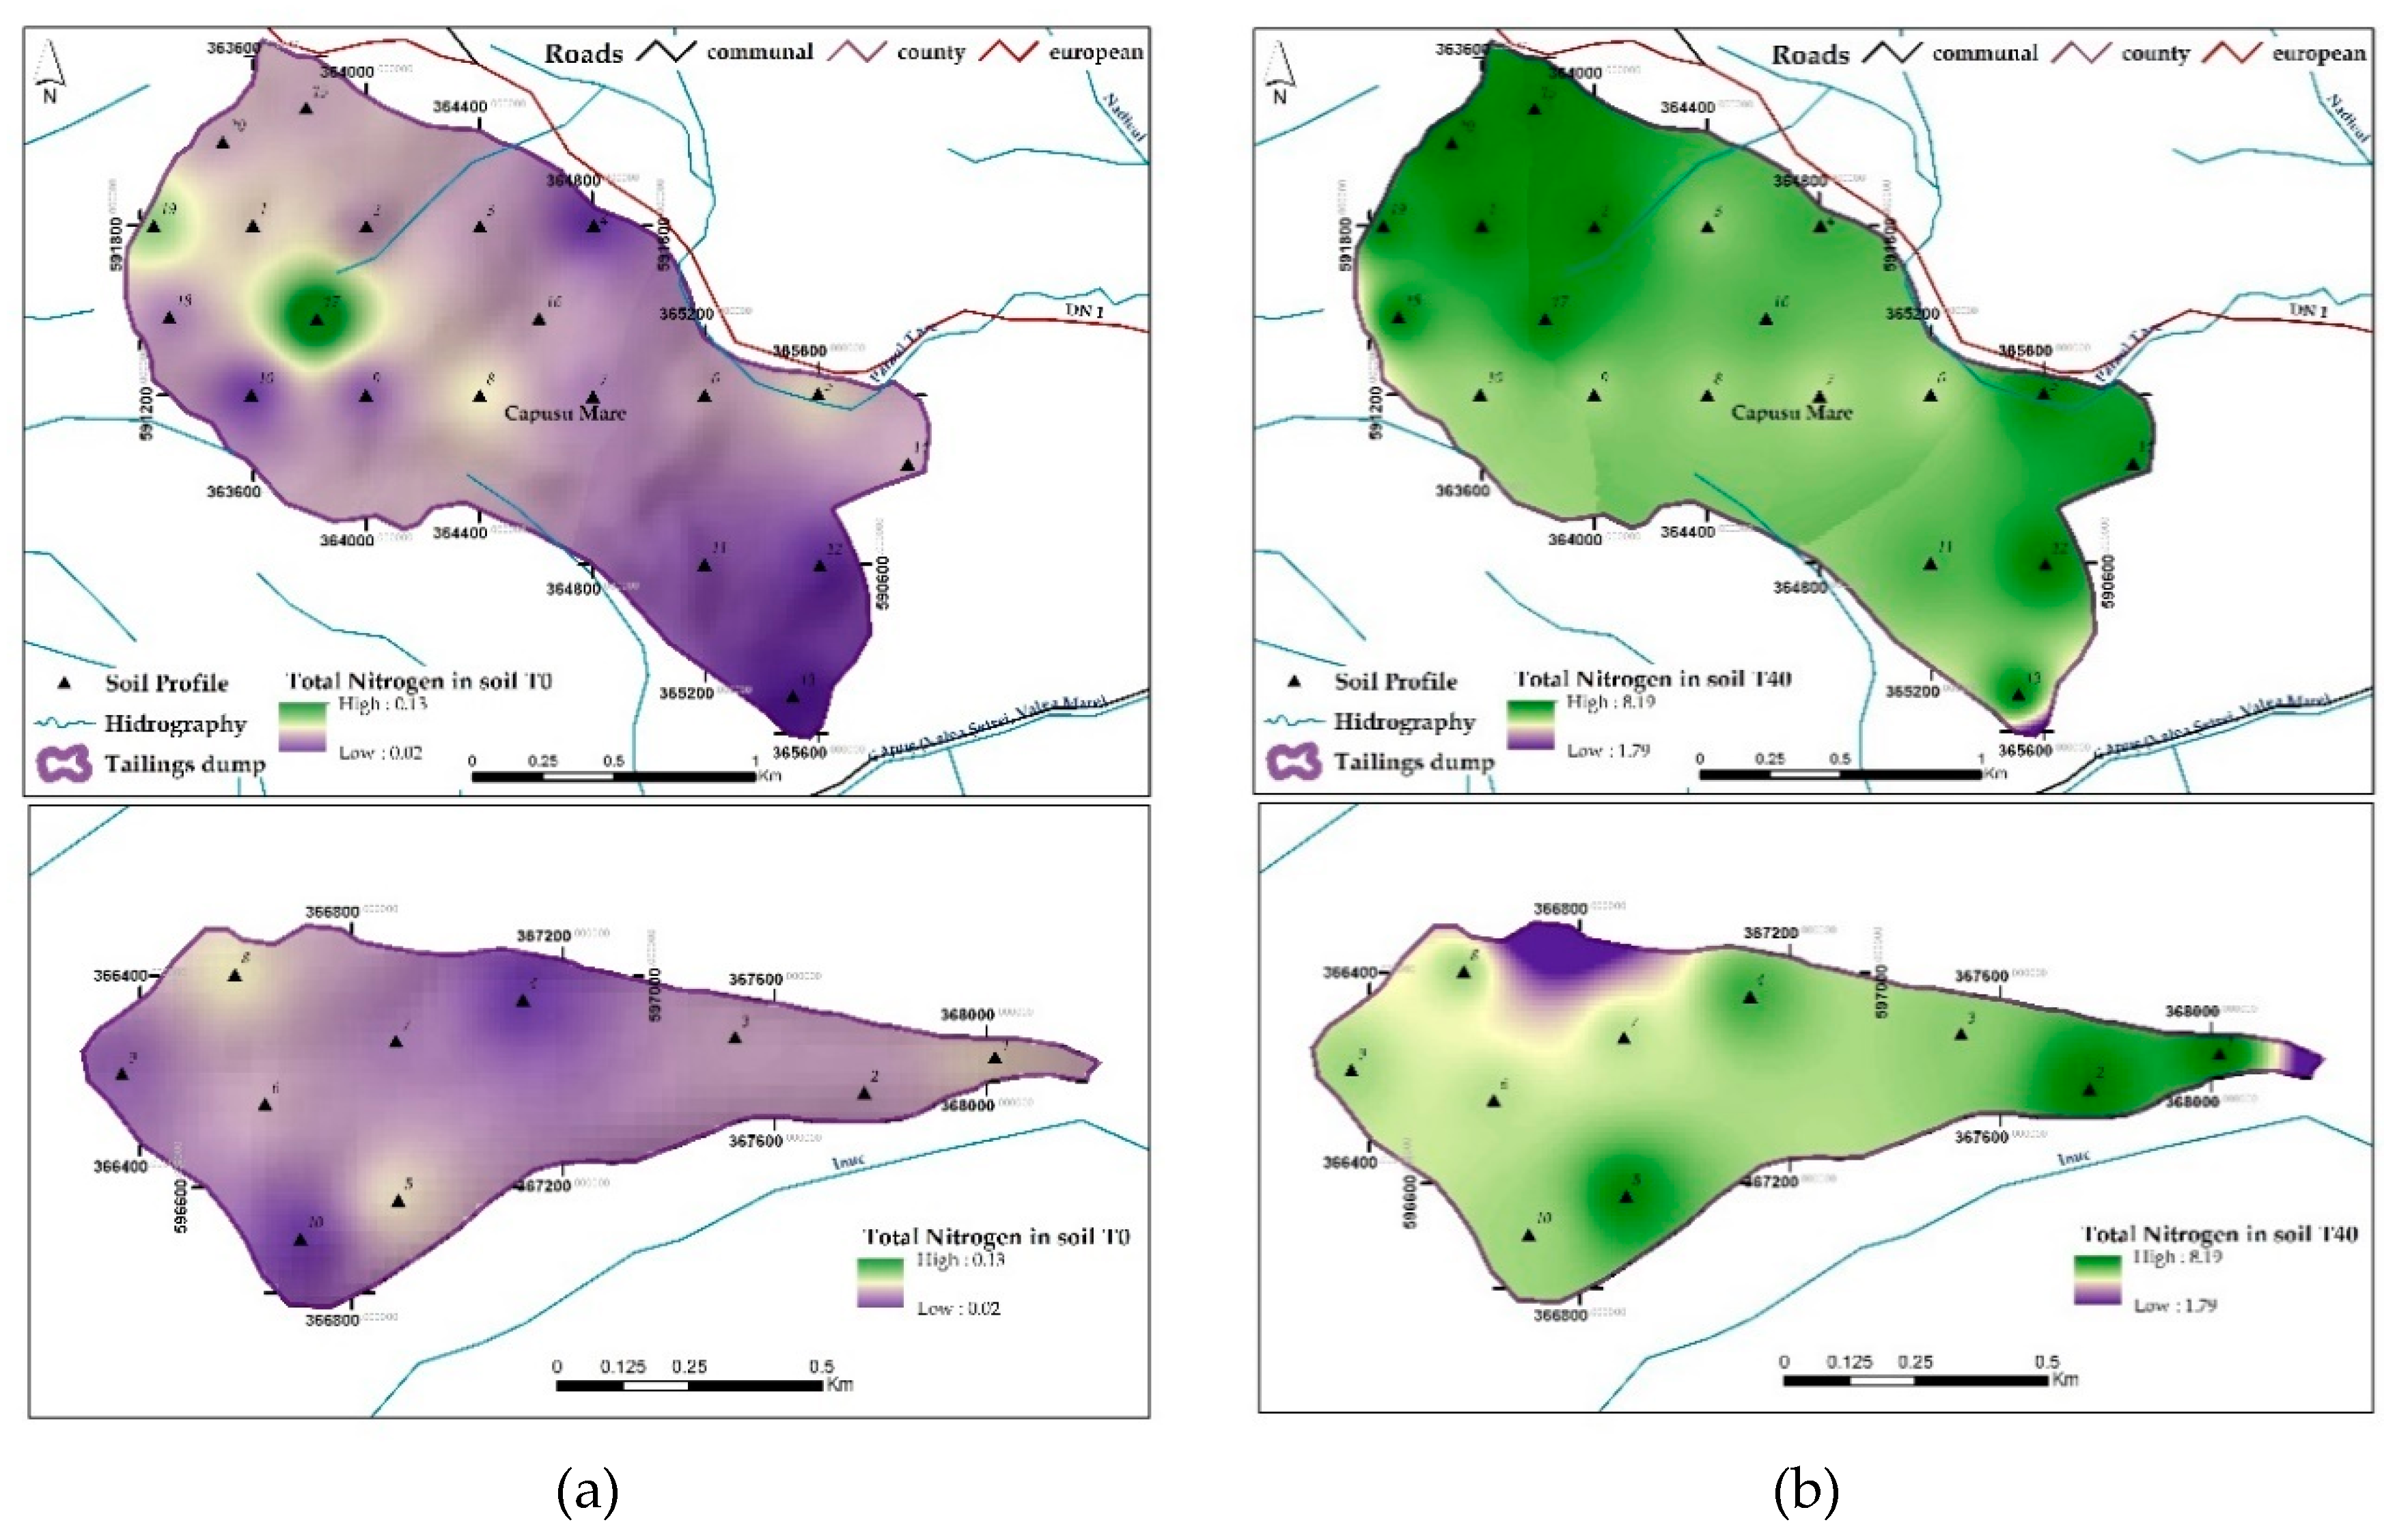
3.1.4. Total Nitrogen

Soil organic matter content has a very important impact on soil physical, chemical and biological properties, but as a source of plant nutrients exerts a great influence especially on nitrogen. Different cover crops have different contributions to nitrogen; therefore, mixes are recommended in use to improve a wider range of soil functions. For example, legumes are prior contributors for nitrogen [35,36], while shallow rooted grasses can improve soil aggregation and mitigate soil surface hardiness. Other crops with deep rooting systems such as Festuca sp., Lolium sp., Trifolium sp., Equisetum sp. etc. alleviate soil compaction [37,38]. Thus, a combination of all these could help to considerably improve soil quality. The result of the reclamation strategy proposed in this work regarding total nitrogen content of the two experimental sites are shown in Table 1. The soil total nitrogen content in the surface layers (0–20 cm) was significantly higher than in the subsurface soils. N content was higher with 22% and 38% under pasture and Robinia pseudacacia plant covers as compared to the others. The lowest total nitrogen content after 40 years was recorded under the Picea abies plant cover followed by natural grassland soils. A number of authors have reported similar results regarding the higher accumulation of total nitrogen in the topsoil layers and also the positive effect of time on its accumulation [8,39,40]. Visual comparisons of total nitrogen accumulation in the studied areas are provided in Figure 4.

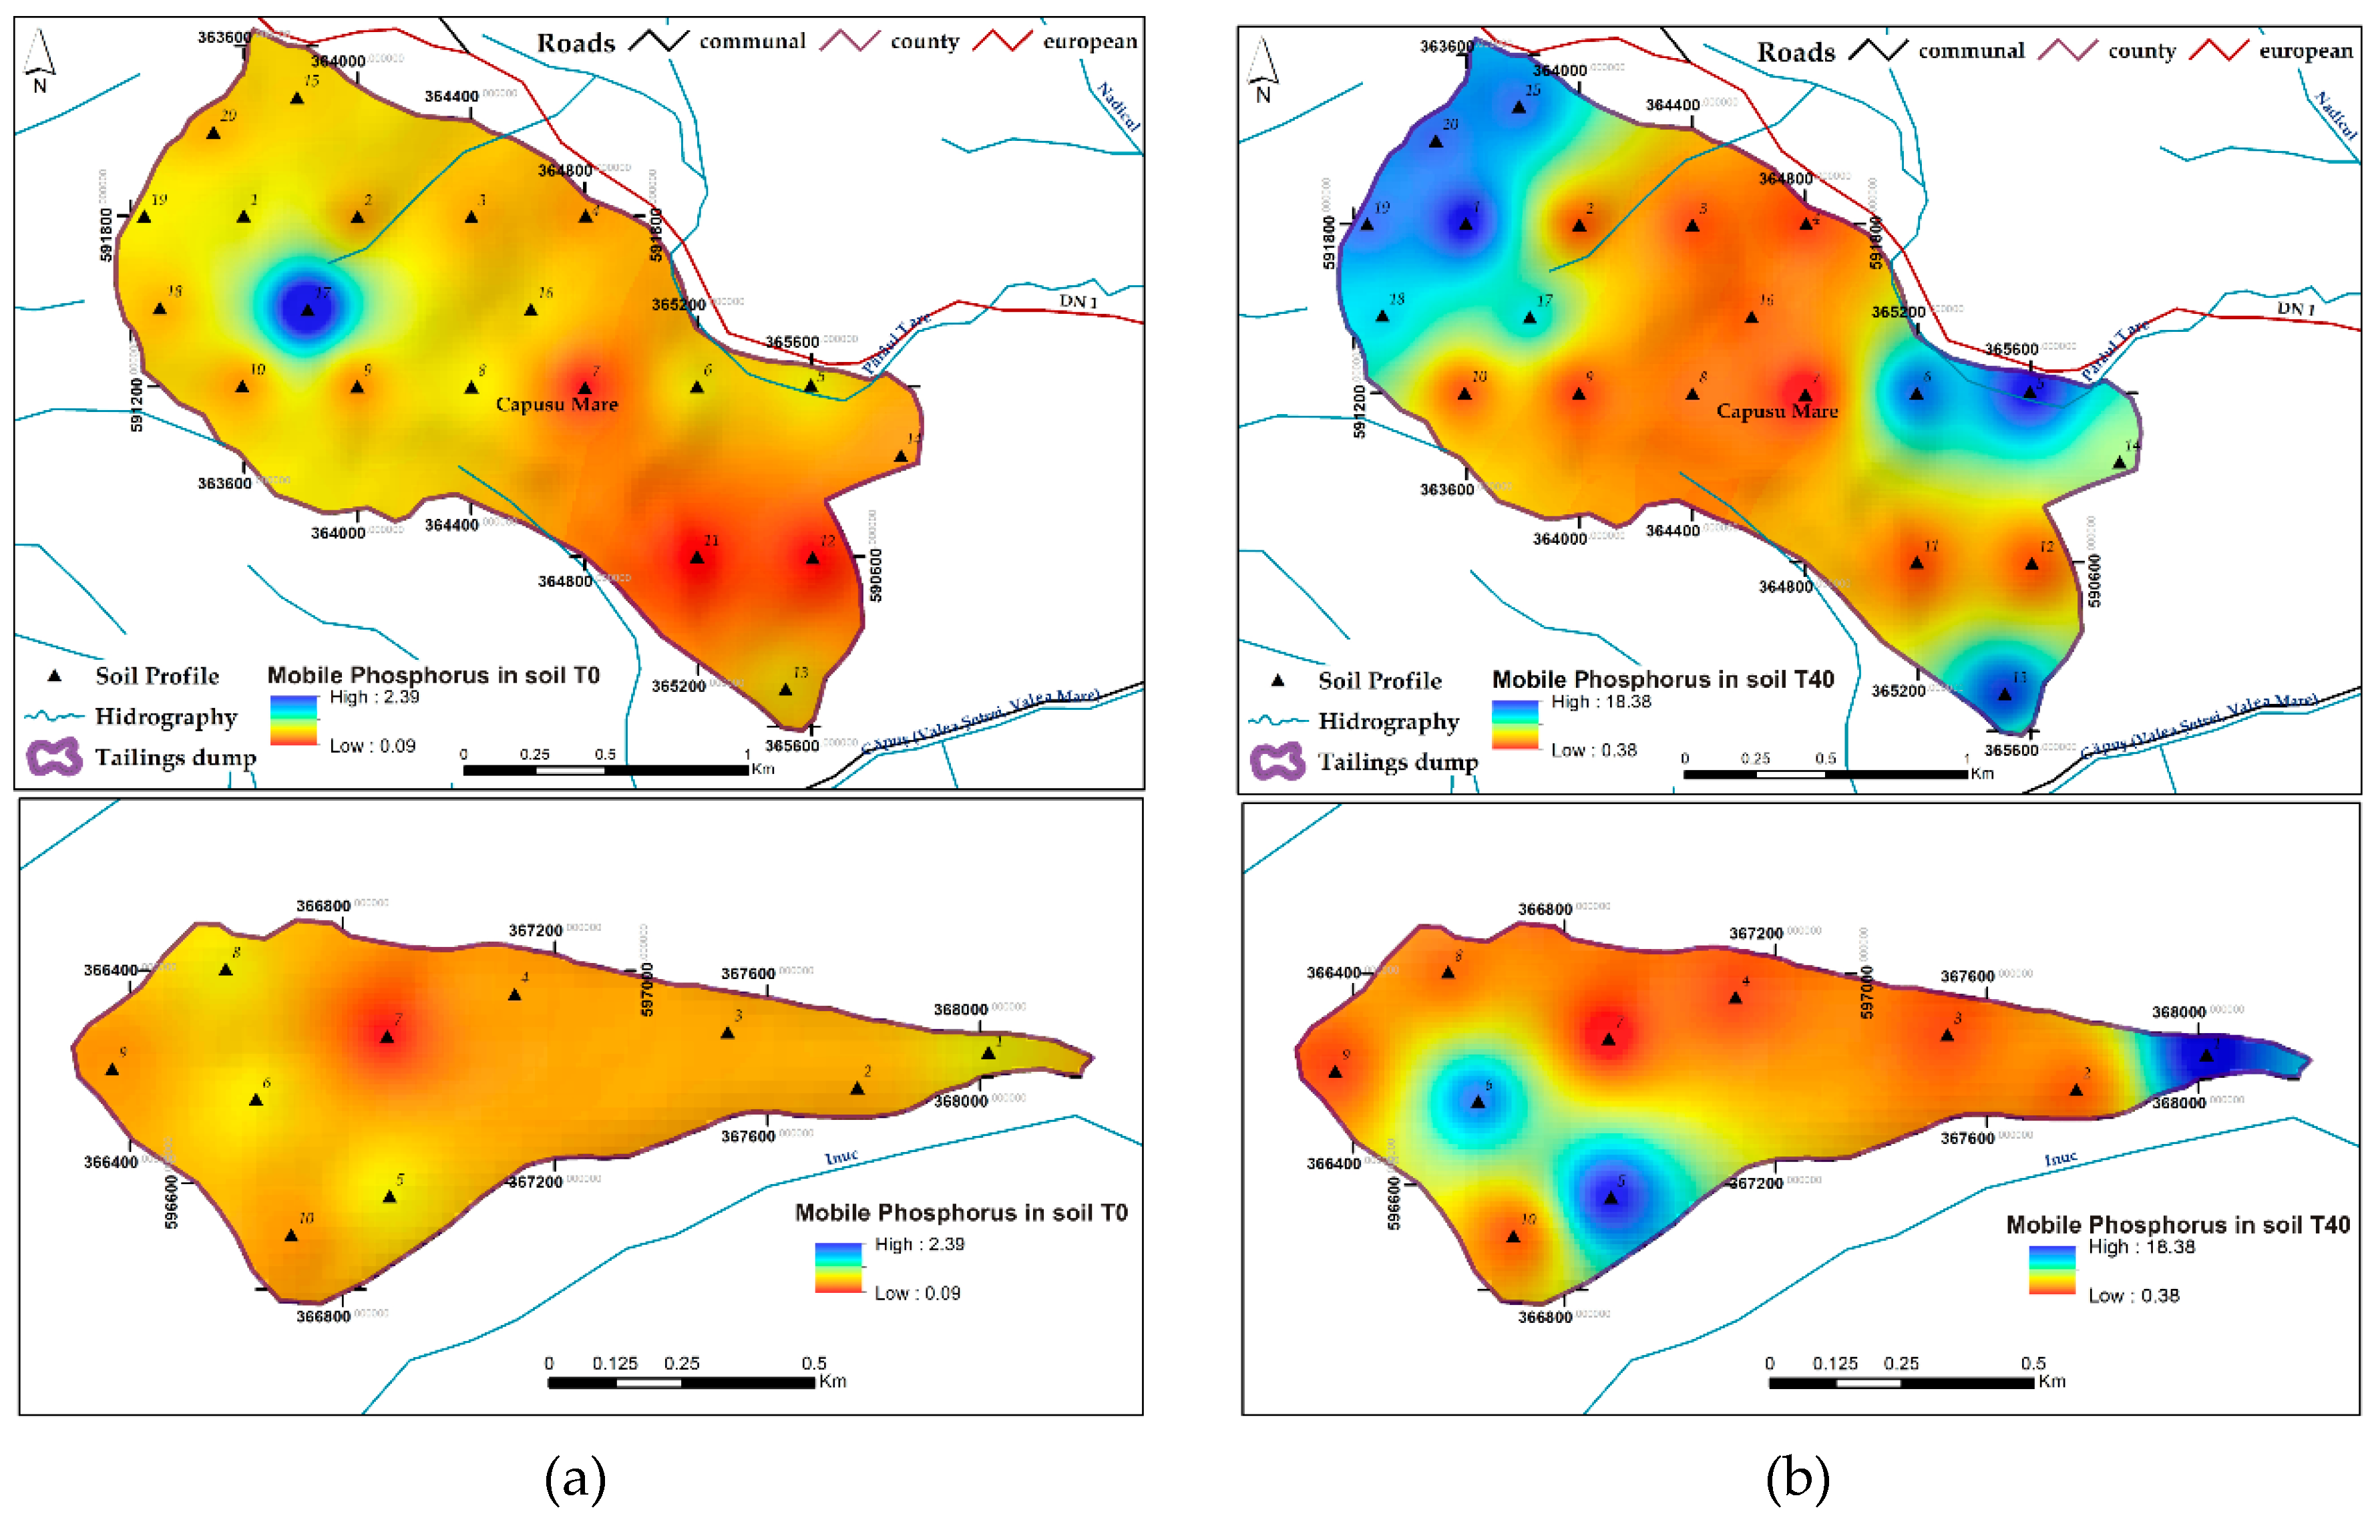
3.1.5. Available Phosphorus

After nitrogen, phosphorus is considered the second major plant growth-limiting nutrient despite the fact that, it occurs abundantly in soil in both organic and inorganic forms [41]. Especially in degraded or stockpiled soils, phosphorus content was found to be deficient and hard to recover [42]. The phosphorus fixation tendency of mine soils can increase slowly over time, but repeated fertilizer applications of phosphorus might be needed to provide a sufficient amount of available phosphorus to maintain plant growth and development [8]. The soil available phosphorus content variations of the two experimental sites are presented in Table 1. The results show that, with the increase of the reclamation years, the available phosphorus content of the soil increased. The highest amounts of available phosphorus have been accumulated in the topsoil layers regardless the plant cover. The highest amount of available phosphorus content was recorded under pasture layer followed by natural grasslands. The lower phosphorus contents were detected under forest layers, showing an increase of 70% as compared to the initial phosphorus content of the mine soils. Visual comparisons of available phosphorus accumulation during the reclamation years in the studied areas are presented in Figure 5.

3.1.6. Available Potassium

Potassium is the third most important macro-element indispensable for plant growth which plays an important role in several processes such as photosynthesis, respiration, water uptake, and loss and enzyme activation but it can easily be leached especially from sandy soils. Mine soils are usually poor in potassium content due to their structure and composition [8]. Potassium content variations during the soil reclamation process are presented in Table 1. Similar to phosphorus accumulation, available potassium has been accumulated in a higher amount in the upper layers than in deep soil layers. The effect of the reclamation process was favorable for all sites as long as the potassium content increased in all layers analyzed with the increase of the reclamation years. The accumulation of available potassium was more enhanced underneath the pasture vegetation cover (55.94%) followed by natural grassland (52.48%). The lowest increase in potassium availability during the reclamation process was observed under conifer forest stands: 38.14% increase in pine forests and 47.83% under Picea abies forest layers. Potassium availability can be altered by soil acidification and is weakly held even by increased organic matter [43,44]. Therefore, it is necessary to apply extra potassium doses after a specific crop being grown and harvested on such soils.

3.1.7. Total Organic Carbon

Soil carbon is considered as an important indicator of soil quality being correlated with major soil functions [45]. Soils are large carbon sinks being highly influenced by land use and management [46]. Degraded or disturbed lands usually have a very low content of carbon due to the decomposition of soil organic carbon, erosion, leaching, or mining activities [47]. The restoration of surface mine lands through revegetation to stimulate carbon sequestration in soil, requires careful soil management and species selection. The results of the reclamation process regarding organic carbon accumulation are presented in Table 1. The results show that after the establishment of different plant covers, the soil organic content started to increase after the first 5–10 years of reclamation. Reclamation time had a great influence on carbon sequestration. The average organic carbon content of the pasture and grassland sites increased by 86.82% and 89.08% in 40 years. The corresponding increase for forest sites varied from 94.42% to 96.62% under Picea abies and Pinus sylvestris forests. Under the Robinia pseudacacia layer the lowest carbon sequestration was observed (70.46% increase at the end of the reclamation as compared to initial values of total organic carbon content). Visual comparisons of soil organic carbon content during the reclamation years are presented in Figure 6. Variations in organic carbon content of the studied sites might be attributed to site-specific differences (heterogeneity) of the stockpiled soils.

3.1.8. Soil Enzymatic Activity

Soil enzymatic activities are considered sensitive indicators of soil fertility since they catalyze all biochemical reactions and are involved in nutrient cycles. Contrary to other parameters, enzymes have the ability to respond to soil managements changes long before other soil quality indicators do [45,48]. The major representatives of enzymes analyzed in this study were:
  • Catalase activity—referring to the descomposition of hydrogen peroxide with the production of molecular oxygen and water and is strongly correlated with dehydrogenases [48]. A general increase in soil catalase activity was observed during the reclamation process. The highest improvements in catalase activity after 40 years of soil reclamation was reached under Pinus sylvestris (1.47 mg H2O2/g soil), Picea abies (0.98 mg H2O2/g soil) tree plantations and under natural grassland cover (1.56 mg H2O2/g soil) followed by pasture sites (1.81 mg H2O2/g soil). In Robinia pseudacacia layers, the reclamation process seemed to be less effective, showing an improvement in catalase activity of only 0.29% at the end of the reclamation years examined.
  • Dehydrogenase activity—reflects the total range of oxidative activity of soil microorganisms being considered a valuable indicator of oxidative metabolisms and microbiological activity [48]. Dehydrogenase activity exhibited an increasing tendency during the reclamation process underneath the herbaceous covers and Robinia pseudacacia plantations, but decreased under the coniferous ground covers as compared to initial values. It was also observed that dehydrogenase activity was higher in the topsoil layers than in lower depths. The results showed a low to moderate (0.41–1.03 μg formazan/g soil) dehydrogenase activity correlated with catalase activity in all sited under study. Similar results have also been reported by Brzezińska et al. (2001) [49] and Frîncu et al. (2015) [48].
  • Saccharase activity—saccharase activity together with urease are strongly related to carbon and nitrogen cycles, carbohydrate supplies in soil and organic matter which make saccharase to be considered a reliable indicator of soil fertility or contamination [45,50]. The results show that soil saccharase activity was the highest under Robinia pseudacacia stands with a linear increase of the plantation age. Similar findings have been reported by Wang et al. (2012) [51] who investigated the effect of black locust on soil chemical and microbiological properties in an eroded hilly area from China. Their results are in agreement with our findings confirming the fact that Robinia pseudacacia greatly improves soil properties when grown in degraded soils. Likewise, natural grassland and pasture vegetation also improved saccharase activity of the soil. Saccharase activity decreased slightly under the coniferous covers being related to the lower soil pH and soil fertility.

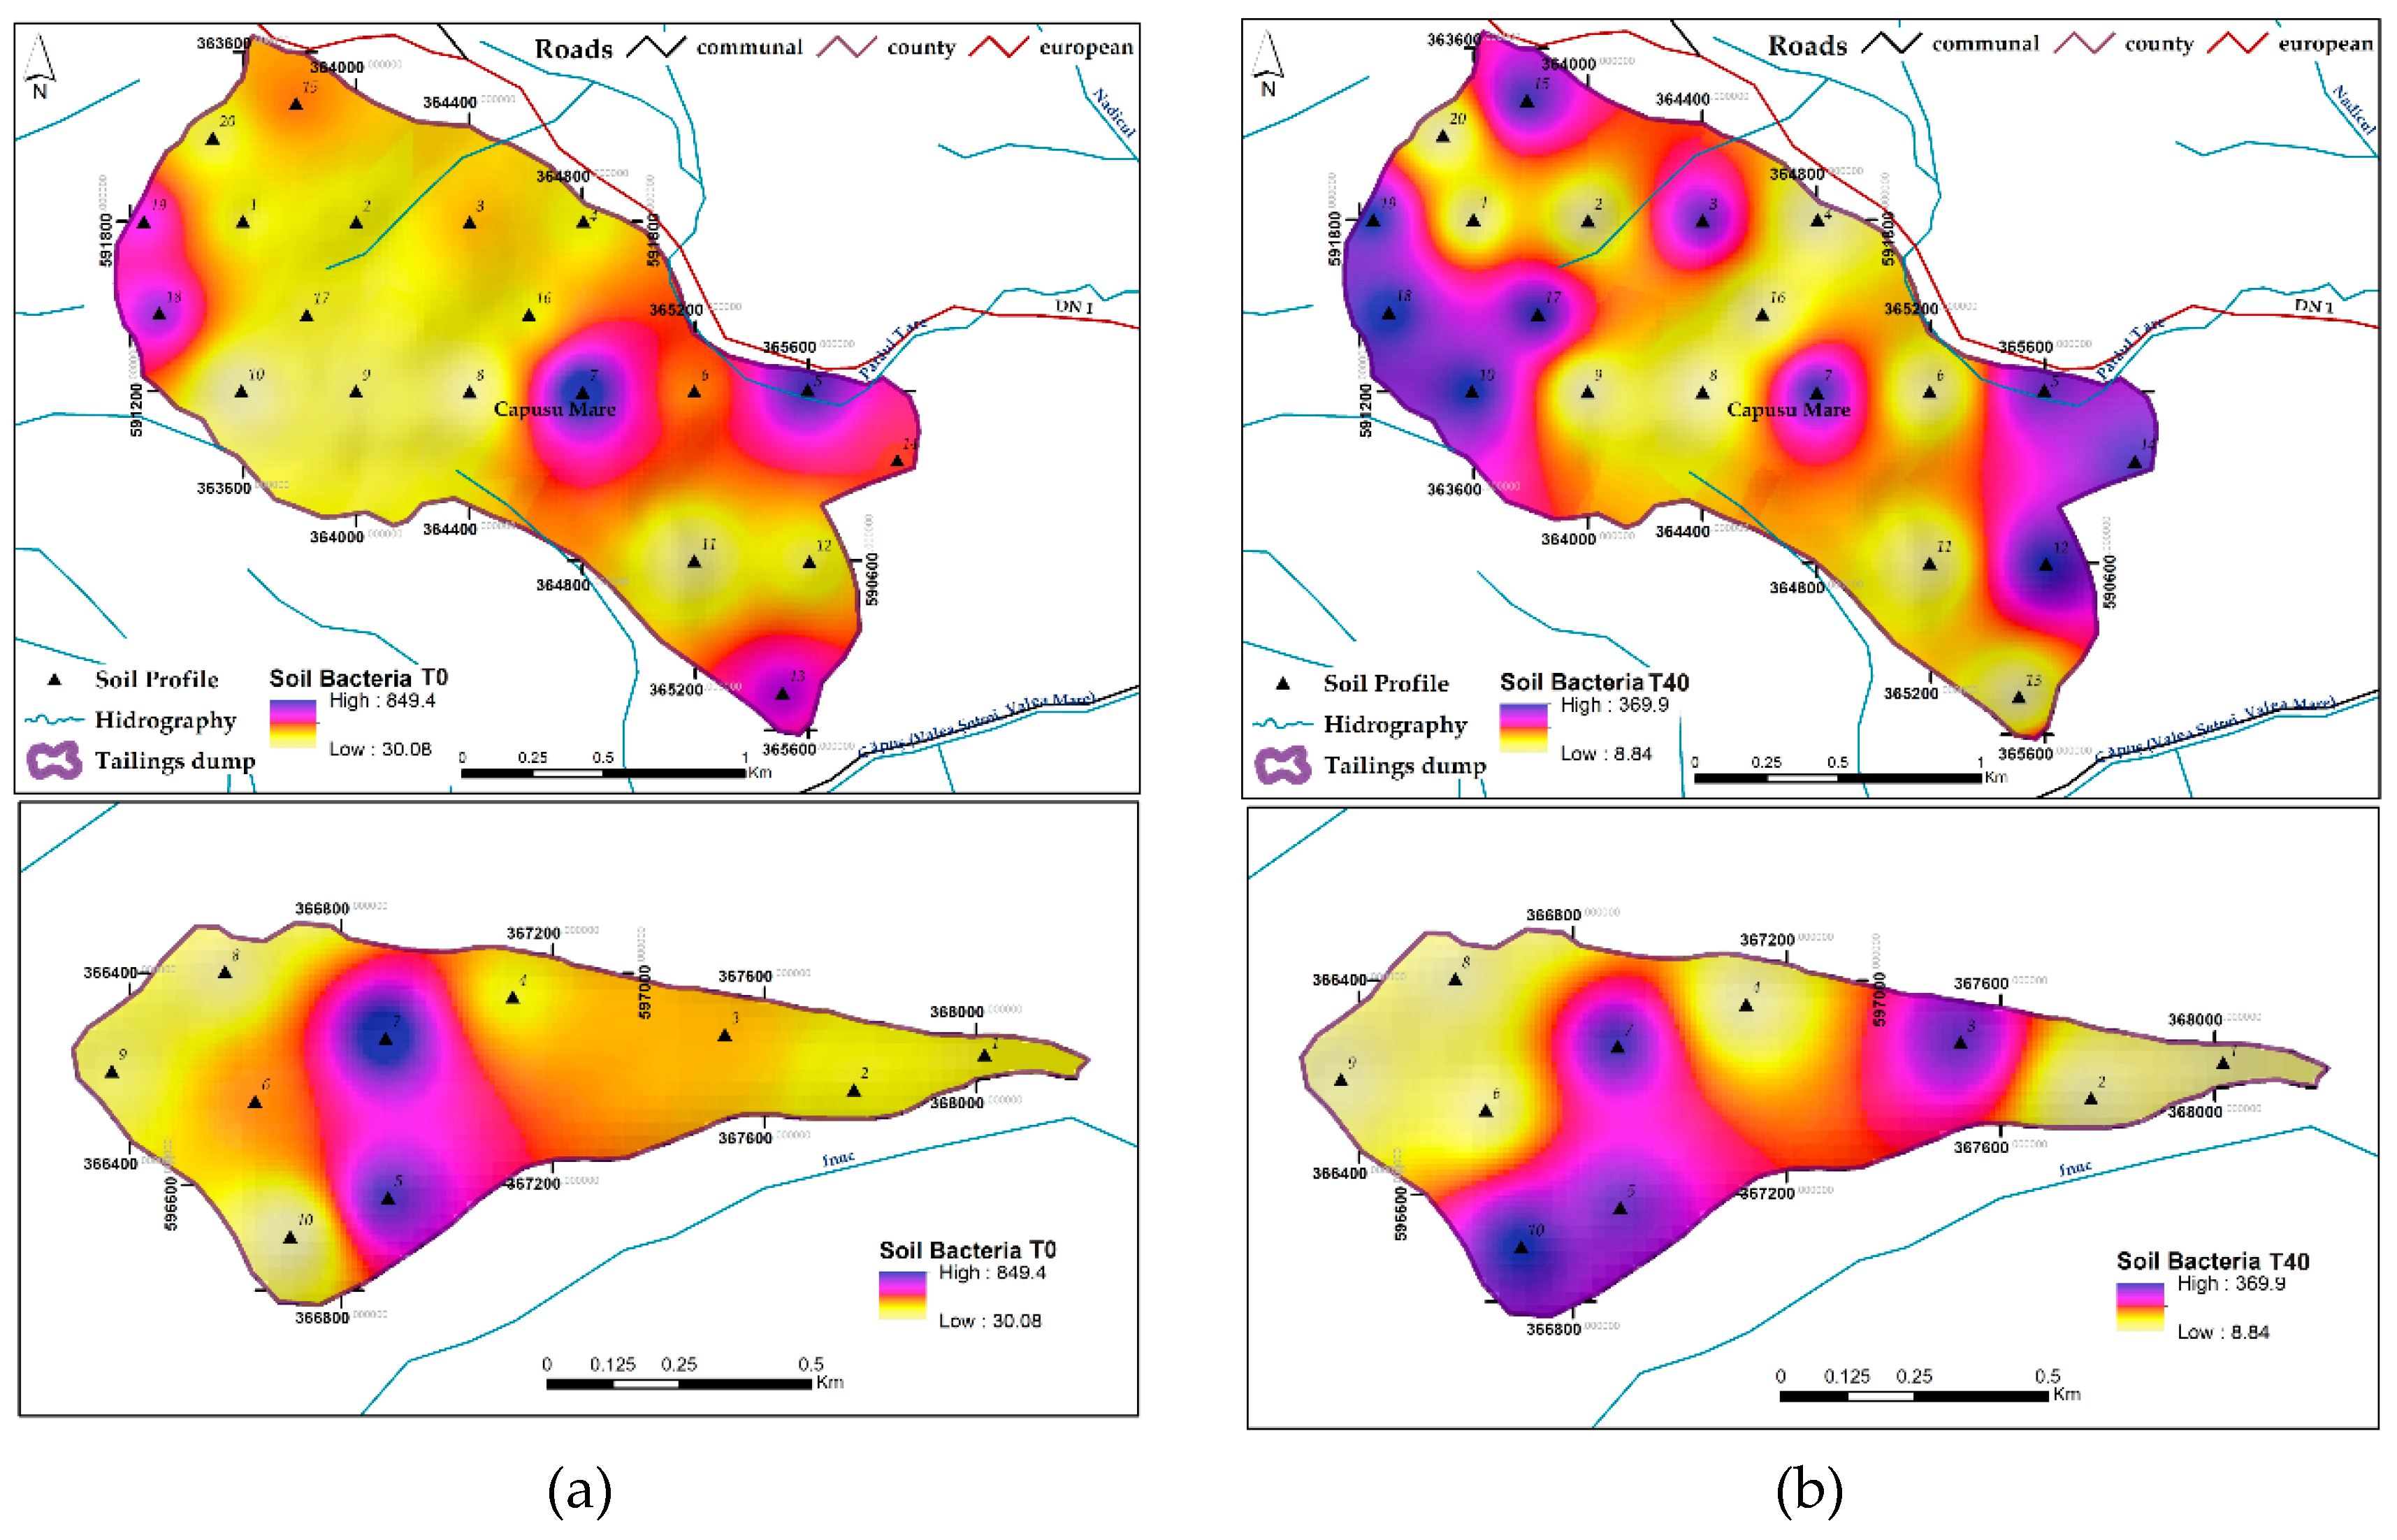
3.1.9. Soil Bacteria
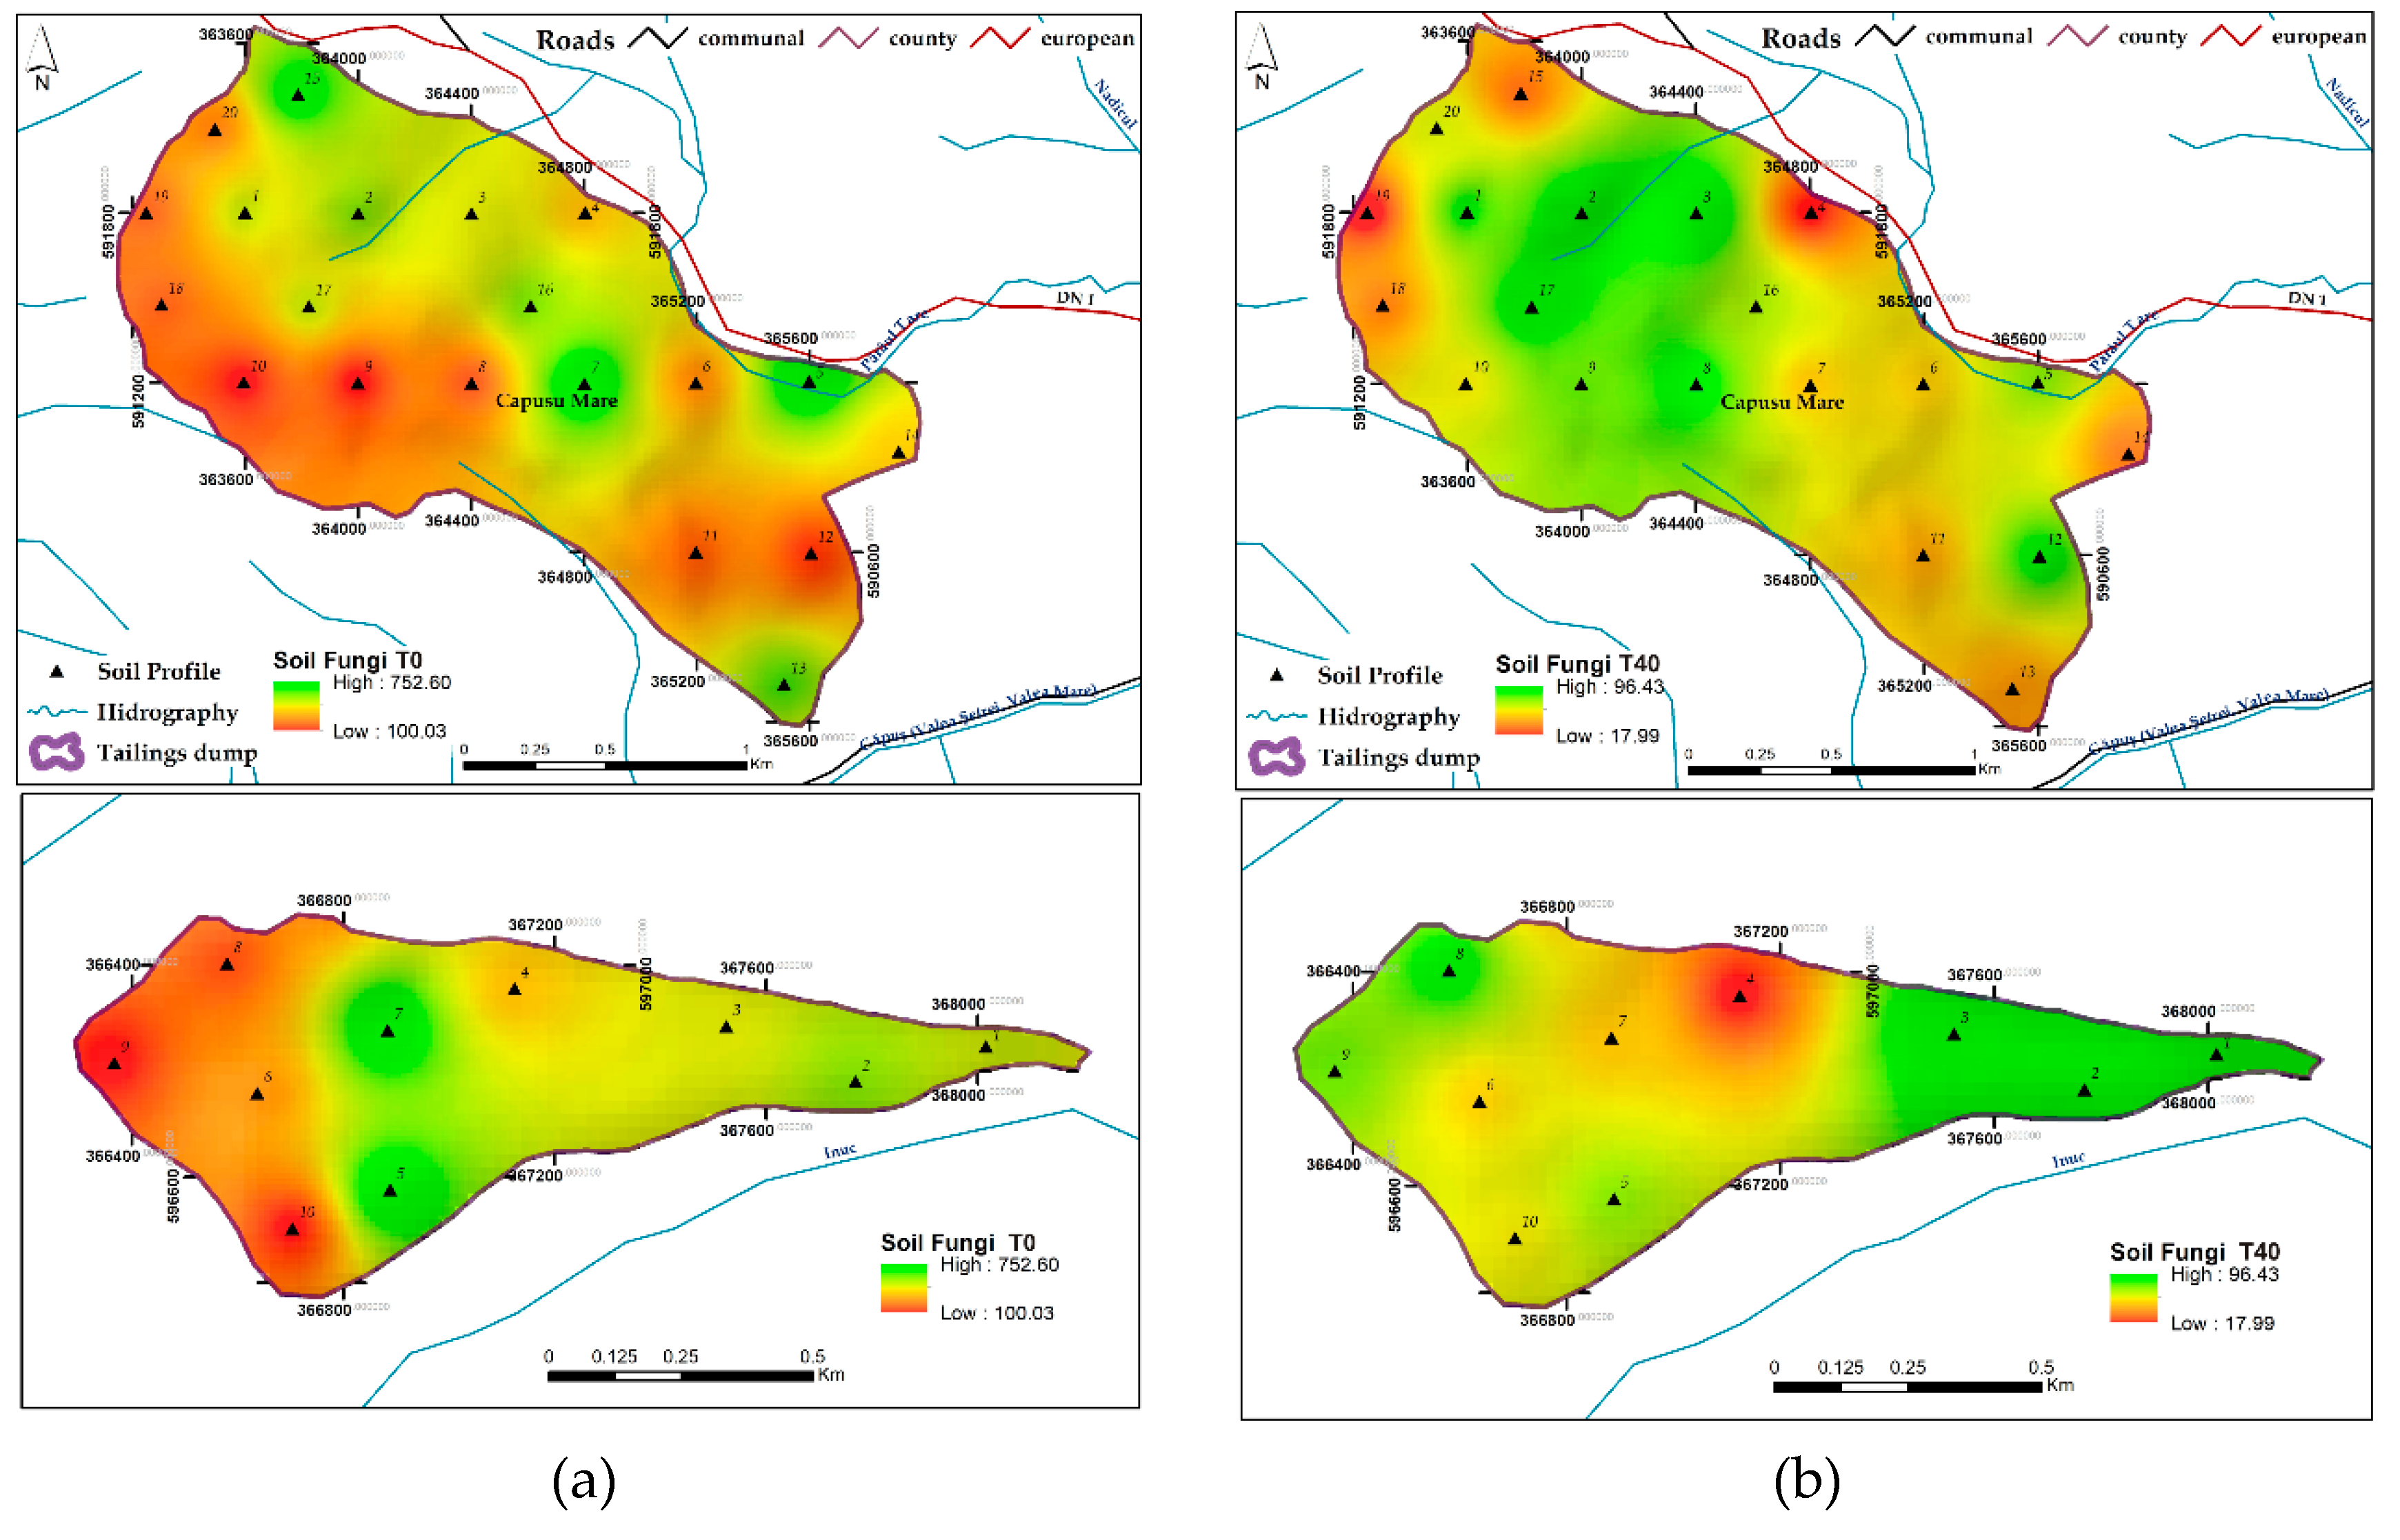
Soil bacteria play a major role in the decomposition of organic materials, being very active in the first stages of decompositions due to the high moisture level of the soil converting the nitrogen into a form to be usable for plants. As long as the moisture level of the soil is dropping, the activity of bacteria is suppressed and fungi tend to dominate [8,41]. Due to mining activities, when soil layers are removed, mixed, and stockpiled, the bacteria which populate the surface soil layers find its new home in the bottom of the pile under well-compacted soils. In this case, with the help of water and the continuously moving air into and out of the soil, bacteria are capable of moving through the pores and starting their activity to inhabit the upper layer of the soil. In the first years of storage, no significant changes occur in the number of bacteria in the upper layer, while at the depth below 50 cm less than one half of the initial bacterial population can persist [52]. The variation of bacterial number in the two experimental sites at different time intervals are presented in Table 1. The results show that the different plant covers had a beneficial effect on bacteria population especially in the surface layers of the soil. Significant increases in bacterial number have been recorded under all cover plants as compared to the initial population, but the highest increase of bacterial number was registered underneath Picea abies forest (71.37%) followed by Pinus sylvestris forests with an increase of 67.5%. Forest ecosystems are rich habitats for bacteria including various components such as plant tissue, streams, and rocks where bacteria occur abundantly on the forest floor in soil and litter [53]. The smallest bacterial population developed was observed underneath the Robinia psudacacia cover followed by natural grasslands. Visual comparisons regarding the number of bacteria occurred during the experimental years are shown in Figure 7.

3.1.10. Soil Fungi

Fungi communities are the key component of a sustainable plant-soil ecosystem which occur naturally in almost all habitats and all types of soils. Fungi tend to dominate over bacteria due to their wider range of tolerance against soil pH. The vast majority of the known bacterial species live at pH values ranging from 4 to 9 while fungi can survive even at pH between 4 and 6 [27,54,55]. Topsoil removal due construction or mining activities is devastating to fungi since the established hypha network breaks when the soil is moved or stockpiled [32]. Mycorrhizal associations are indispensable for plant survival and their growth. They play a key role in decomposing woody organic matter, nutrient uptake by plants (especially phosphorus and nitrogen), improving plant resilience, and they are also directly involved in soil structure improvement [8,54,56]. It is well documented that the viability of fungi decreases significantly in stored soils, due to the disruption of the extraradical hypha network [57,58,59,60]. Mycorrhizal densities of the two experimental sites are presented in Table 1. The results show that after reclamation mycorrhizal densities started to reestablish themselves. Soil microbes can persist in stored soils and can be stimulated through diverse reclamation strategies by recharging the system with an organic carbon source or by adding a suitable plant cover. The results show that mycorrhizal densities varied depending on plant community. Under the forest layers, the mycorrhizal densities were much higher (416.33 ± 31.78 under Picea abies and 407.60 ± 78.71 under Pinus sylvestris) than those under the herbaceous layers (356.43 ± 11.44 under natural grassland and 242.44 ± 4.61 under pasture vegetation). These differences could be explained by the lack of human intervention reducing soil compaction and erosion but also soil humidity is crucial for the development of mycorrhizal communities [61,62]. Visual comparisons of mycorrhizal densities established in the two experimental sites are presented in Figure 8.

3.1.11. Soil Respiration

Soil respiration is a very complex process and an important indicator of soil health, indicating the amount of CO2 released from the soil due to decomposition of soil organic matter by soil microbes. Although soil respiration is an important measure of carbon cycle, there are different factors that influence soil respiration processes such as temperature, humidity, and soil pH (Mignon, 2010; Orchard et al., 1983). The CO2 flux after revegetation of the studied sites are shown in Figure 9 Inhabitation of the land with forest vegetation (Picea abies and Pinus sylvestris) enhanced the most soil respiration among all the vegetation layers established by 23.77% and 23.65%, respectively. Pasture and natural grassland vegetation also had an ameliorative effect on soil respiration along the 40 years of study showing an increase of 16.04% and 12.47%. Previous findings also show a higher increase in soil respiration under forest layers than herbaceous layers such as croplands or sown meadow as reported by Larionova et al. (1998) [63]. The variation in soil respiration along the years could be explained by the heterogeneous structure of the land, altitude, soil pH, and climatic conditions (especially annual temperatures and precipitations) which differed considerably along the study years [64]. Temperature influences the respiration process since numerous enzymes are involved in this process. Depending on soil temperature, microorganisms are more or less metabolically active thus contributing differently to the soil CO2 efflux [27]. Soil humidity is another factor which influences soil respiration processes dramatically. Several studies show that both in drought and high humidity conditions soil respiration is reduced. In drought conditions, soil microorganisms reduce their activity, thus reducing soil respiration rates as well (Mignon, 2010). Previous reports show that, the O2 and CO2 diffusion in water is 10,000 times more reduced than in the air which reduces the gas diffusion when the soil pores are filled up with water [65]. Soil pH is another abiotic factor that considerably influences soil respiration by stimulating or reducing the proliferation of bacteria and fungi [55].

4. Conclusions

Soil reclamation is a very important process of reclaiming the soil’s quality—such as soil fertility, minerals, nutrients, moisture, etc.—to make it reusable again, to restore its ecological integrity. Among the reclamation methods, revegetation constitutes the most effective, useful, and widely accepted way of reclamation of surface mine lands to reduce erosion and protect the soils against degradation. Prior to revegetation, plant selection is very important for an effective reclamation strategy. Plants need to be selected based on their ability to survive and regenerate in the local, specific environment, and to stabilize the soil structure. Inhabitation of the land with different plant species enables the association of nitrogen fixing bacteria and fungi, which are fundamental to maintain soil quality through the decomposition of organic matter and nutrient cycle.
This study reveals that the soil chemical, physical, and biological properties varied from one plant cover to another, exhibiting all a significant improvement in soil quality and health with the increase of the reclamation years. The results show that after 40 years of vegetation growth, pasture cover increased the most soil quality, followed by natural grassland and coniferous stands (Figure 9). Robinia pseudacacia stands also had a positive effect upon soil properties, but significant improvements have been observed when black locust reached its maturity.
Our findings confirm that revegetation with indigenous species (natural recovery) is a successful technique in soil reclamation processes with the best results. Nevertheless, further research should be carried out to optimize soil reclamation strategies, especially when invasive species are dominating the area.

Author Contributions

Conceptualization, M.B. and G.B.; Data curation, M.B. and F.G.; Formal analysis, S.R. and O.B.; Investigation, P.E.S. and C.N.; Methodology, L.P. and I.P.; Resources, L.P.; Supervision, I.P.; Writing—original draft, O.B. and C.N.; Writing—review & editing, M.B. and C.N.

Funding

This research received no external funding.

Conflicts of Interest

The authors declare no conflict of interest.

References

  1. Worldbank and International Finance Corporation. Available online: http://siteresources.worldbank.org/INTOGMC/Resources/treasureortrouble.pdf (accessed on 15 March 2019).
  2. Schandl, H.; Poldy, F.; Turner, G.M.; Measham, T.G.; Walker, D.H.; Eisenmenger, N. Australia’s resource use trajectories. J. Ind. Ecol. 2008, 12, 669–685. [Google Scholar] [CrossRef]
  3. Keeling, A.; Sandlos, J. Environmental justice goes underground? Historical notes from Canada’s northern mining frontier. Environ. Justice 2009, 2, 117–125. [Google Scholar] [CrossRef]
  4. Sahu, H.B.; Dash, S. Land degradation due to mining in India and its mitigation measures. In Proceedings of the Second International Conference on Environmental Science and Technology, Singapore, 26–28 February 2011. [Google Scholar]
  5. Majer, M. The practice of mining companies in building relationships with local communities in the context of CSR formula. J. Sustain. Min. 2013, 12, 38–47. [Google Scholar] [CrossRef]
  6. Hilson, G. Small-scale mining and its socio-economic impact in developing countries. Nat. Resour. Forum 2002, 26, 3–13. [Google Scholar] [CrossRef]
  7. Martin, J.H. Surface mining and the environment in Europe. Int. J. Surf. Min. Reclam. Environ. 1993, 7, 91–104. [Google Scholar]
  8. Sheoran, V.; Sheoran, A.S.; Poonia, P. Soil reclamation of abandoned mine land by revegetation: A review. J. Soil Sediment. 2010, 3, 13. [Google Scholar]
  9. Šourková, M.; Frouz, J.; Šantrùčková, H. Accumulation of carbon, nitrogen and phosphorus during soil formation on alder spoil heaps after brown-coal mining, near Sokolov (Czech Republic). Geoderma 2005, 124, 203–214. [Google Scholar] [CrossRef]
  10. Blaga, G.; Dumitru, M.; Bunescu, V.; Lechinţan, T.; Păcurar, I. Bonitarea terenurilor degradate de exploatarea minieră de suprafaţă Mirşid (jud. Sălaj), şi a haldelor nivelate (protosoluri antropice). Agronomie 1992, 35, 54–58. [Google Scholar]
  11. Florea, N.; Munteanu, I. Solonchaks. (Soolonceacuri). In Romanian Soil Taxonomy System (SRTS); Sitech: Craiova, Romania, 2012; pp. 132–140. [Google Scholar]
  12. IUSS Working Group WRB. (2015). World Reference Base for Soil Resources 2014. Update2015, International Soil Classification System for Naming Soils and Creating Legends for Soilmaps; World Soil Resources Reports No. 106; FAO: Rome, Italy, 2015; Available online: http://www.fao.org/3/i3794en/I3794en.pdf (accessed on 19 April 2019).
  13. Simon, A.; Gáll, E.; Tonk, S.; Tamás, L.; Maxim, A.; Janicsik, P.; Coroiu, T. Atlas; Suncart: Cluj-Napoca, Romania, 2003; pp. 80–95. [Google Scholar]
  14. Schollenberger, C.J. A rapid approximate method for determining soil organic matter. Soil Sci. 1927, 24, 65–68. [Google Scholar] [CrossRef]
  15. Schuman, G.E.; Stanley, M.A.; Knudsen, D. Automated total nitrogen analysis of soil and plant samples 1. Soil Sci. Soc. Am. J. 1973, 37, 480–481. [Google Scholar] [CrossRef]
  16. Oreshkin, N.G. Extraction of available phosphorus by the Egner-Riehm-Domingo method. Agrokhimiya 1980, 8, 135–138. [Google Scholar]
  17. Walkley, A.; Black, I.A. An examination of the Degtjareff method for determining soil organic matter, and a proposed modification of the chromic acid titration method. Soil Sci. 1934, 37, 29–38. [Google Scholar] [CrossRef]
  18. Carter, M.R.; Gregorich, E.G. Soil Sampling and Methods of Analysis; Lewis: London, UK, 1993. [Google Scholar]
  19. Casida, L.E.; Klein, D.A.; Santoro, T. Soil dehydrogenase activity. Soil Sci. 1964, 98, 371–376. [Google Scholar] [CrossRef]
  20. Zibilske, L.M. Part 2-Microbiological and biochemical properties. In Methods of Soil Analysis, 2nd ed.; Weaver, R.W., Angle, J.S., Bottomley, P.S., Eds.; SSSA Book Series 5.2; ACSESS Digital Library: Madison, WI, USA, 1994; pp. 835–863. [Google Scholar]
  21. Florea, N.; Bălăceanu, V.; Rauţă, C.; Canarache, A. Methodology of Pedological Studies, 3rd ed.; Pedological and Agrochemical Institute Bucharest, Redacţia de propagandă tehnico-agricolă: Bucharest, Romania, 1978. [Google Scholar]
  22. Martinez-Toledo, M.V.; Salmeron, V.; Gonzalez-Lopez, J. Effect of an organophosphorus insecticide, profenofos, on agricultural soil microflora. Chemosphere 1992, 24, 71–80. [Google Scholar] [CrossRef]
  23. Roșca, S. Application of Soil Loss Scenarios Using the ROMSEM Model Depending on Maximum Land Use Pretability Classes. A Case Study. Studia UBB Geographia 2014, 59, 101–116. [Google Scholar]
  24. Bilașco, S.; Roșca, S.; Fodorean, I.; Vescan, I.; Filip, S.; Petrea, D. Quantitative evaluation of the risk induced by dominant geomorphological processes on different land uses, based on GIS spatial analysis models. Front. Earth. Sci. 2017, 12, 1–14. [Google Scholar] [CrossRef]
  25. Boț, A.I.; Păcurar, I.; Szajdak, L.; Roșca, S.; Păcurar, H.M.; Pleșa, V.C. Determining the Amount of Total Nitrogen, Total Organic Carbon and C:N Ratio for Eight Blueberry Plantations from Northwest Region of Development. Proenvironment/Promediu 2017, 10, 86–94. [Google Scholar]
  26. Mîndru, M.; Păcurar, I.; Roșca, S.; Bilașco, S.; Păcurar, H.M. Research Regarding the Soil Characteristics and their Influence on Forest Productivity in the Mociar Forest, Mureş County. Bull. Uasvm Hortic. 2017, 74, 155–163. [Google Scholar] [CrossRef]
  27. Sandor, M. Soil respiration: Concept and measurement methods. ProEnvironment 2010, 3, 54–57. [Google Scholar]
  28. Rhoades, C.; Binkley, D. Factors influencing decline in soil pH in Hawaiian Eucalyptus and Albizia plantations. For. Ecol. Manag. 1996, 80, 47–56. [Google Scholar] [CrossRef]
  29. Hendershot, W.H.; Lalande, H. Soil Reaction and Exchangeable Acidity. In Soil Sampling and Methods of Analysis, 2nd ed.; Carter, M.R., Gregorich, E.G., Eds.; CRC Press: Boca Raton, FL, USA, 2007; pp. 173–179. [Google Scholar]
  30. Cheng, Y.; Wang, J.; Mary, B.; Zhang, J.B.; Cai, Z.C.; Chang, S.X. Soil pH has contrasting effects on gross and net nitrogen mineralizations in adjacent forest and grassland soils in central Alberta, Canada. Soil. Biol. Biochem. 2013, 57, 848–857. [Google Scholar] [CrossRef]
  31. Gitt, M.J.; Dollhopf, D.J. Coal waste reclamation using automated weathering to predict lime requirement. J. Environ. Qual. 1991, 20, 285–288. [Google Scholar] [CrossRef]
  32. Gould, A.B.; Hendrix, J.W.; Ferriss, R.S. Relationship of mycorrhizal activity to time following reclamation of surface mine land in western Kentucky. I. Propagule and spore population densities. Can. J. Bot. 1996, 74, 247–261. [Google Scholar] [CrossRef]
  33. Reeves, D.W. The role of soil organic matter in maintaining soil quality in continuous cropping systems. Soil Till. Res. 1997, 43, 131–167. [Google Scholar] [CrossRef]
  34. Hu, Z.; Duo, L.; Shao, F. Optimal Thickness of Soil Cover for Reclaiming Subsided Land with Yellow River Sediments. Sustainability 2018, 10, 3853. [Google Scholar] [CrossRef]
  35. Drinkwater, L.E.; Wagoner, P.; Sarrantonio, M. Legume-based cropping systems have reduced carbon and nitrogen losses. Nature 1998, 396, 262–265. [Google Scholar] [CrossRef]
  36. McVay, K.A.; Radcliffe, D.E.; Hargrove, W.L. Winter legume effects on soil properties and nitrogen fertilizer requirements. Soil Sci. Soc. Am. J. 1989, 53, 1856–1862. [Google Scholar] [CrossRef]
  37. Unger, P.W.; Kaspar, T.C. Soil compaction and root growth. A review. Agron. J. 1994, 86, 759–766. [Google Scholar] [CrossRef]
  38. Williams, S.M.; Weil, R.R. Crop cover root channels may alleviate soil compaction effects on soybean crop. Soil Sci Soc. Am. J. 2004, 68, 1403–1409. [Google Scholar] [CrossRef]
  39. Elkins, N.Z.; Lawrence, W.P.; Aldon, E.; Whitford, W.G. Responses of Soil Biota to Organic Amendments in Stripmine Spoils in Northwestern New Mexico. J. Environ. Qual. 1984, 13, 215–219. [Google Scholar] [CrossRef]
  40. Burke, I.C.; Lauenroth, W.K.; Coffin, D.P. Soil organic matter recovery in semiarid grasslands: Implications for the conservation reserve program. Ecol. Appl. 1995, 5, 793–801. [Google Scholar] [CrossRef]
  41. Gyaneshwar, P.; Kumar, G.N.; Parekh, L.J.; Poole, P.S. Role of soil microorganisms in improving P nutrition of plants. Plant. Soil. 2002, 245, 83–93. [Google Scholar]
  42. Coppin, N.J.; Bradshaw, A.D. The Establishment of Vegetation in Quarries and Open-Pit Non-Metal Mines; Mining Journal Books: London, England, 1982; p. 112. [Google Scholar]
  43. Heiberg, S.O.; White, D.P. Potassium deficiency of reforested Pine and spruce stands in northern New York. In Proceedings of the 7th International Botanical Congress, Stockholm, Sweden, 128 July 1950. [Google Scholar]
  44. Brennan, R.F.; Bolland, M.D.A.; Bowden, J.W. Potassium deficiency, and molybdenum deficiency and aluminium toxicity due to soil acidification, have become problems for cropping sandy soils in south-western Australia. Aust. J. Exp. Agric. 2004, 44, 1031–1039. [Google Scholar] [CrossRef]
  45. Zhang, L.; Chen, W.; Burger, M.; Yang, L.; Gong, P.; Wu, Z. Changes in soil carbon and enzyme activity as a result of different long-term fertilization regimes in a greenhouse field. PLoS ONE 2015, 10, e0118371. [Google Scholar] [CrossRef] [PubMed]
  46. Akala, V.A.; Lal, R. Potential of mine land reclamation for soil organic carbon sequestration in Ohio. Land Degrad. Dev. 2000, 11, 289–297. [Google Scholar] [CrossRef]
  47. Indorante, S.J.; Jansen, I.J.; Boast, C.W. Surface mining and reclamation: Initial changes in soil character. J. Soil Water Conserv. 1981, 36, 347–350. [Google Scholar]
  48. Frîncu, M.; Dumitrache, C.; Dumitru, A.C.; Cimpeanu, P.C.; Mihai, L.P. Soil Fertility Assessment through Enzyme Activity. J. Young Sci. 2015, 3, 1283–1291. [Google Scholar]
  49. Brzezińska, M.; Stępniewska, Z.; Stępniewski, W. Dehydrogenase and catalase activity of soil irrigated with municipal wastewater. Pol. J. Environ. Stud. 2001, 10, 307–311. [Google Scholar]
  50. Levytska, O.; Davydova, I. Analysis of the Soil Enzymatic Activity for Lands Reclaimed From Brown-Coal Strip Mines in Stryzhivka. Logistyka 2013, 4, 302–309. [Google Scholar]
  51. Wang, B.; Liu, G.; Xue, S. Effect of black locust (Robinia pseudoacacia) on soil chemical and microbiological properties in the eroded hilly area of China’s Loess Plateau. Environ. Earth Sci. 2012, 65, 597–607. [Google Scholar] [CrossRef]
  52. Johnson, D.B.; Williamson, J.C.; Bailey, A.J. Microbiology of soils at opencast coal sites. I. Short-and long-term transformations in stockpiled soils. J. Soil Sci. 1991, 42, 1–8. [Google Scholar] [CrossRef]
  53. Hardoim, P.R.; Van Overbeek, L.S.; Berg, G.; Pirttila, A.M.; Compant, S.; Campisano, A.; Doring, M.; Sessitsch, A. The hidden world within plants: Ecological and evolutionary considerations for defining functioning of microbial endophytes. Microbiol. Mol. Biol Rev. 2015, 79, 293–320. [Google Scholar] [CrossRef] [PubMed]
  54. Jenkins, A. Soil fungi. In Soil Biology Basics, Information Series; NSW Department of Primary Industries: Forests, NSW, Australia, 2005. [Google Scholar]
  55. Rousk, J.; Brookes, P.C.; Baath, E. Contrasting soil pH effects on fungal and bacterial growth suggest functional redundancy in carbon mineralization. Appl. Environ. Microbiol. 2009, 75, 1589–1596. [Google Scholar] [CrossRef] [PubMed]
  56. Ritz, K.; Young, I.M. Interactions between soil structure and fungi. Mycologis 2004, 18, 52–59. [Google Scholar] [CrossRef]
  57. Rives, C.S.; Bajwa, M.I.; Liberta, A.E.; Miller, R.M. Effects of topsoil storage during surface mining on the viability of VA mycorrhiza. Soil Sci. 1980, 129, 253–257. [Google Scholar] [CrossRef]
  58. O’Halloran, I.P.; Miller, M.H.; Arnold, G. Absorption of P by corn (Zea mays L.) as influenced by soil disturbance. Can. J. Soil Sci 1986, 66, 287–302. [Google Scholar]
  59. Jasper, D.A.; Abbott, L.K.; Robson, A.D. Soil disturbance reduces the infectivity of external hyphae of VA mycorrhizal fungi. New Phytol. 1989, 112, 93–99. [Google Scholar] [CrossRef]
  60. Jasper, D.A.; Abbott, L.K.; Robson, A.D. Hyphae of a vesicular arbuscular mycorrhizal fungus maintain infectivity in dry soil, except when the soil is disturbed. New Phytol. 1989, 112, 101–107. [Google Scholar] [CrossRef]
  61. Miller, R.M.; Jastrow, J.D.; Reinhardt, D.R. External hyphal production of vesicular-arbuscular mycorrhizal fungi in pasture and tallgrass prairie communities. Oecologia 1995, 103, 17–23. [Google Scholar] [CrossRef]
  62. Lladó, S.; López-Mondéjar, R.; Baldrian, P. Forest soil bacteria: Diversity, involvement in ecosystem processes, and response to global change. Microbiol. Mol. Biol. Rev. 2017, 81, e00063-16. [Google Scholar] [CrossRef]
  63. Larionova, A.A.; Yermolayev, A.M.; Blagodatsky, S.A.; Rozanova, L.N.; Yevdokimov, I.V.; Orlinsky, D.B. Soil respiration and carbon balance of gray forest soils as affected by land use. Biol. Fert. Soil. 1998, 27, 251–257. [Google Scholar] [CrossRef]
  64. Yiqi, L.; Zhou, X. Soil Respiration and the Environment; Elsevier: Burlington, MA, USA, 2006. [Google Scholar]
  65. Cho, S.J.; Kim, M.H.; Lee, Y.O. Effect of pH on soil bacterial diversity. J. Ecol. Nat. Environ. 2016, 40, 10. [Google Scholar] [CrossRef] [Green Version]
Figure 1. Geographic location of experimental sites (Source: Google Earth Image 2019).
Sustainability 11 03393 g001
Figure 2. Altitude maps and soil sampling locations from the studied areas.
Sustainability 11 03393 g002
Figure 3. Visual comparisons of soil organic matter content variation at 40 years distance of the two experimental sites: (a) soil organic content of the two experimental sites (Căpușu Mare—top, and Aghireșu—bottom) determined in the first year of research (T 0); (b) soil organic matter content variation of the two experimental sites (Căpușu Mare—top; and Aghireșu—bottom) measured in the last year of research (T 40).
Sustainability 11 03393 g003
Figure 4. Visual comparisons of soil total nitrogen content variation at 40 years distance of the two experimental sites: (a) total nitrogen content of the two experimental sites (Căpușu Mare—top; and Aghireșu—bottom) determined in the first year of research (T 0); (b) total nitrogen content variation of the two experimental sites (Căpușu Mare—top; and Aghireșu—bottom) measured in the last year of research (T 40).
Sustainability 11 03393 g004
Figure 5. Visual comparisons of available phosphorus content at 40 years distance of the two experimental sites: (a) variation of available phosphorus content of the two experimental sites (Căpușu Mare—top; and Aghireșu—bottom) determined in the first year of research (T 0); (b) variation of available phosphorus content of the two experimental sites (Căpușu Mare—top; and Aghireșu—bottom) measured in the last year of research (T 40).
Sustainability 11 03393 g005
Figure 6. Visual comparisons of organic carbon content at 40 years distance of the two experimental sites: (a) variation of organic carbon content of the two experimental sites (Căpușu Mare—top; and Aghireșu—bottom) determined in the first year of research (T 0); (b) variation of organic carbon content of the two experimental sites (Căpușu Mare—top; and Aghireșu—bottom) measured in the last year of research (T 40).
Sustainability 11 03393 g006
Figure 7. Visual comparisons of the number of bacteria at 40 years distance of the two experimental sites: (a) variation of bacteria number of the two experimental sites (Căpușu Mare—top; and Aghireșu—bottom) determined in the first year of research (T 0); (b) variation of bacteria number of the two experimental sites (Căpușu Mare—top; and Aghireșu—bottom) measured in the last year of research (T 40).
Sustainability 11 03393 g007
Figure 8. Visual comparisons of mycorrhizal densities at 40 years distance of the two experimental sites: (a) variation of mycorrhizal communities of the two experimental sites (Căpușu Mare—top; and Aghireșu—bottom) determined in the first year of research (T 0); (b) variation of mycorrhizal communities of the two experimental sites (Căpușu Mare—top; and Aghireșu—bottom) measured in the last year of research (T 40).
Sustainability 11 03393 g008
Figure 9. Overview of the effectiveness and efficiency of the applied reclamation strategy. The values shown are average values of the 40 years of reclamation for each soil parameter.
Sustainability 11 03393 g009
Table 1. Soil chemical and biological status during the 40 years of research.
Soil pHOrganic Matter (%)
Plant CoverNatural grasslandPasture vegetationRobinia pseudacaciaPicea abiesPinus sylvestrisNatural grasslandPasture vegetationRobinia pseudacaciaPicea abiesPinus sylvestris
Time
T 06.65 ± 1.46 a6.10 ± 1.95 a7.85 ± 0.30 a7.72 ± 0.24 c7.03 ± 1.63 b0.69 ± 0.50 a0.50 ± 0.29 a0.89 ± 0.62 a0.86 ± 0.39 a1.06 ± 0.58 a
T 106.75 ± 1.35 a6.14 ± 1.93 a7.84 ± 0.35 a7.56 ± 0.11 b6.92 ± 1.57 ab0.72 ± 0.48 b0.56 ± 0.26 b0.90 ± 0.60 a0.86 ±0.39 a1.05 ± 0.57 a
T 206.84 ± 1.27 ab6.17 ± 1.91 a7.81 ± 0.38 a7.43 ± 0.01 ab6.84 ± 1.53 ab0.75 ± 0.47 c0.64 ± 0.21 c0.91 ± 0.58 ab0.86 ± 0.40 a1.03 ± 0.55 a
T 306.92 ± 1.18 b6.21 ± 1.90 a7.80 ± 0.42 a7.31 ± 0.09 a6.76 ± 1.49 a0.78 ± 0.47 d0.67 ± 0.19 d0.92 ± 0.56 b0.86 ± 0.40 a1.02 ± 0.54 a
T 406.97 ± 1.13 b6.23 ± 1.89 a7.78 ± 0.44 a7.23 ± 0.15 a6.69 ± 1.45 a0.81 ± 0.46 e0.72 ± 0.18 e0.92±0.54b0.86 ± 0.40 a1.00 ± 0.52 a
Total Nitrogen (%)Phosphorus (mg/100 g soil)
T 00.04 ± 0.02 a0.04 ± 0.03 a0.06 ± 0.02 a0.04 ± 0.01 a0.04 ± 0.02 a0.91 ± 0.42 a1.29 ± 0.61 a0.70 ± 0.28 a0.47 ± 0.10 a0.60 ± 0.25 a
T 100.18 ± 0.09 b0.21 ± 0.13 b0.27 ± 0.09 a0.17 ± 0.04 a0.20 ± 0.10 b5.35 ± 2.39 b8.04 ± 2.16 b1.41 ± 0.56 a0.81 ± 0.17 a1.03 ± 0.43 a
T 200.32 ± 0.16 c0.38 ± 0.23 c0.48 ± 0.17 b0.30 ± 0.07 ab0.36 ± 0.19 c9.78 ± 4.38 c14.80 ± 3.74 c2.11 ± 0.84 b1.16 ± 0.25 ab1.45 ± 0.60 b
T 300.46 ± 0.23 d0.54 ± 0.33 d0.69 ± 0.24 b0.43 ± 0.10 b0.52 ± 0.27 d14.22 ± 6.37 d21.55 ± 5.32 d2.82 ± 1.12 b1.50 ± 0.32 b1.87 ± 0.78 b
T 400.61 ± 0.29 e0.71 ± 0.43 e0.90 ± 0.32 c0.56 ± 0.13 c0.68 ± 0.35 e18.66 ± 8.36 e28.30 ± 6.90 e3.53 ± 1.40 c1.85 ± 0.39 b2.30 ± 0.95 c
Potassium (mg/100 g soil)Total organic carbon (%)
T 013.41 ± 4.09 a10.49 ± 3.98 a14.91 ± 1.74 a17.99 ± 3.77 a13.23 ± 2.54 a0.69 ± 0.49 a1.00 ± 0.58 a1.33 ± 0.01 a0.32 ± 0.04 a0.31 ± 0.03 a
T 1017.11 ± 5.23 a13.82 ± 5.24 b18.04 ± 2.10 b22.11 ± 4.63 b15.27 ± 2.93 a2.09 ± 0.46 b2.65 ± 0.45 b2.13 ± 0.83 b1.67 ± 1.86 a2.53 ± 0.27 b
T 2020.81 ± 6.36 ab17.15 ± 6.50 c21.18 ± 2.47 c26.24 ± 5.49 c17.31 ± 3.32 ab3.50 ± 0.61 c4.29 ± 0.32 c2.94 ± 1.67 b3.03 ± 3.68 b4.74 ± 0.51 c
T 3024.52 ± 7.49 b20.48 ± 7.76 d24.31 ± 2.83 d30.37 ± 6.36 d19.35 ± 3.71 b4.91 ± 0.83 d5.94 ± 0.20 d3.75 ± 2.50 c4.38 ± 5.50 b6.96 ± 0.76 d
T 4028.22 ± 8.62 c23.81 ± 9.02 e27.44 ± 3.20 e34.49 ± 7.22 e21.39 ± 4.11 c6.32 ± 1.09 e7.59 ± 0.12 e4.55 ± 3.34 d5.74 ± 7.32 c9.18 ± 1.00 e
Bacteria (thousands per gram dry weight)Fungi (thousands per grams dry weight)
T 0122.80 ± 5.89 a124.93 ± 23.28 a87.81 ± 8.04 a120.03 ± 7.30 a113.42 ± 9.81 a56.87 ± 9.04 a52.66 ± 7.94 a60.82 ± 6.01 a55.85 ± 4.51 a52.55 ± 13.47 a
T 10170.14 ± 9.30 b175.42 ± 27.91 b129.25 ± 7.72 b194.82 ± 8.80 b172.33 ± 11.84 b131.76 ± 5.53 b100.11 ± 5.43 b135.00 ± 7.81 b145.97 ± 0.79 b141.31 ± 3.22 b
T 20217.48 ± 12.30 c225.91 ± 38.38 c170.68 ± 34.36 c269.60 ± 27.07 c231.24 ± 8.78 c206.76 ± 13.11 c146.57 ± 8.59 c210.94 ± 5.22 c239.98 ± 21.85 c229.08 ± 55.57 c
T 30264.82 ± 1.23 d276.40 ± 7.62 d212.12 ± 16.48 d344.38 ± 25.33 d290.16 ± 34.18 d281.75 ± 3.08 d193.04 ± 3.41 d286.89 ± 0.44 d333.99 ± 7.47 d316.85 ± 4.38 d
T 40312.16 ± 15.05 e326.89 ± 33.44 e253.56 ± 21.43 e419.17 ± 40.52 e349.07 ± 19.90 e356.43 ± 11.44 e242.44 ± 4.61 e357.56 ± 8.02 e416.33 ± 31.78 e407.60 ± 78.71 e
The values shown are averaged values for the entire soil profiles (all soil layers included) from five soil samples. Different lowercase letters near the means indicate significant differences between the means obtained from different time intervals underneath the same plant cover according to Tukey’s HSD test at p < 0.05 significance level.

