Fire Spread of Thermal Insulation Materials in the Ceiling of Piloti-Type Structure: Comparison of Numerical Simulation and Experimental Fire Tests Using Small- and Real-Scale Models


Abstract
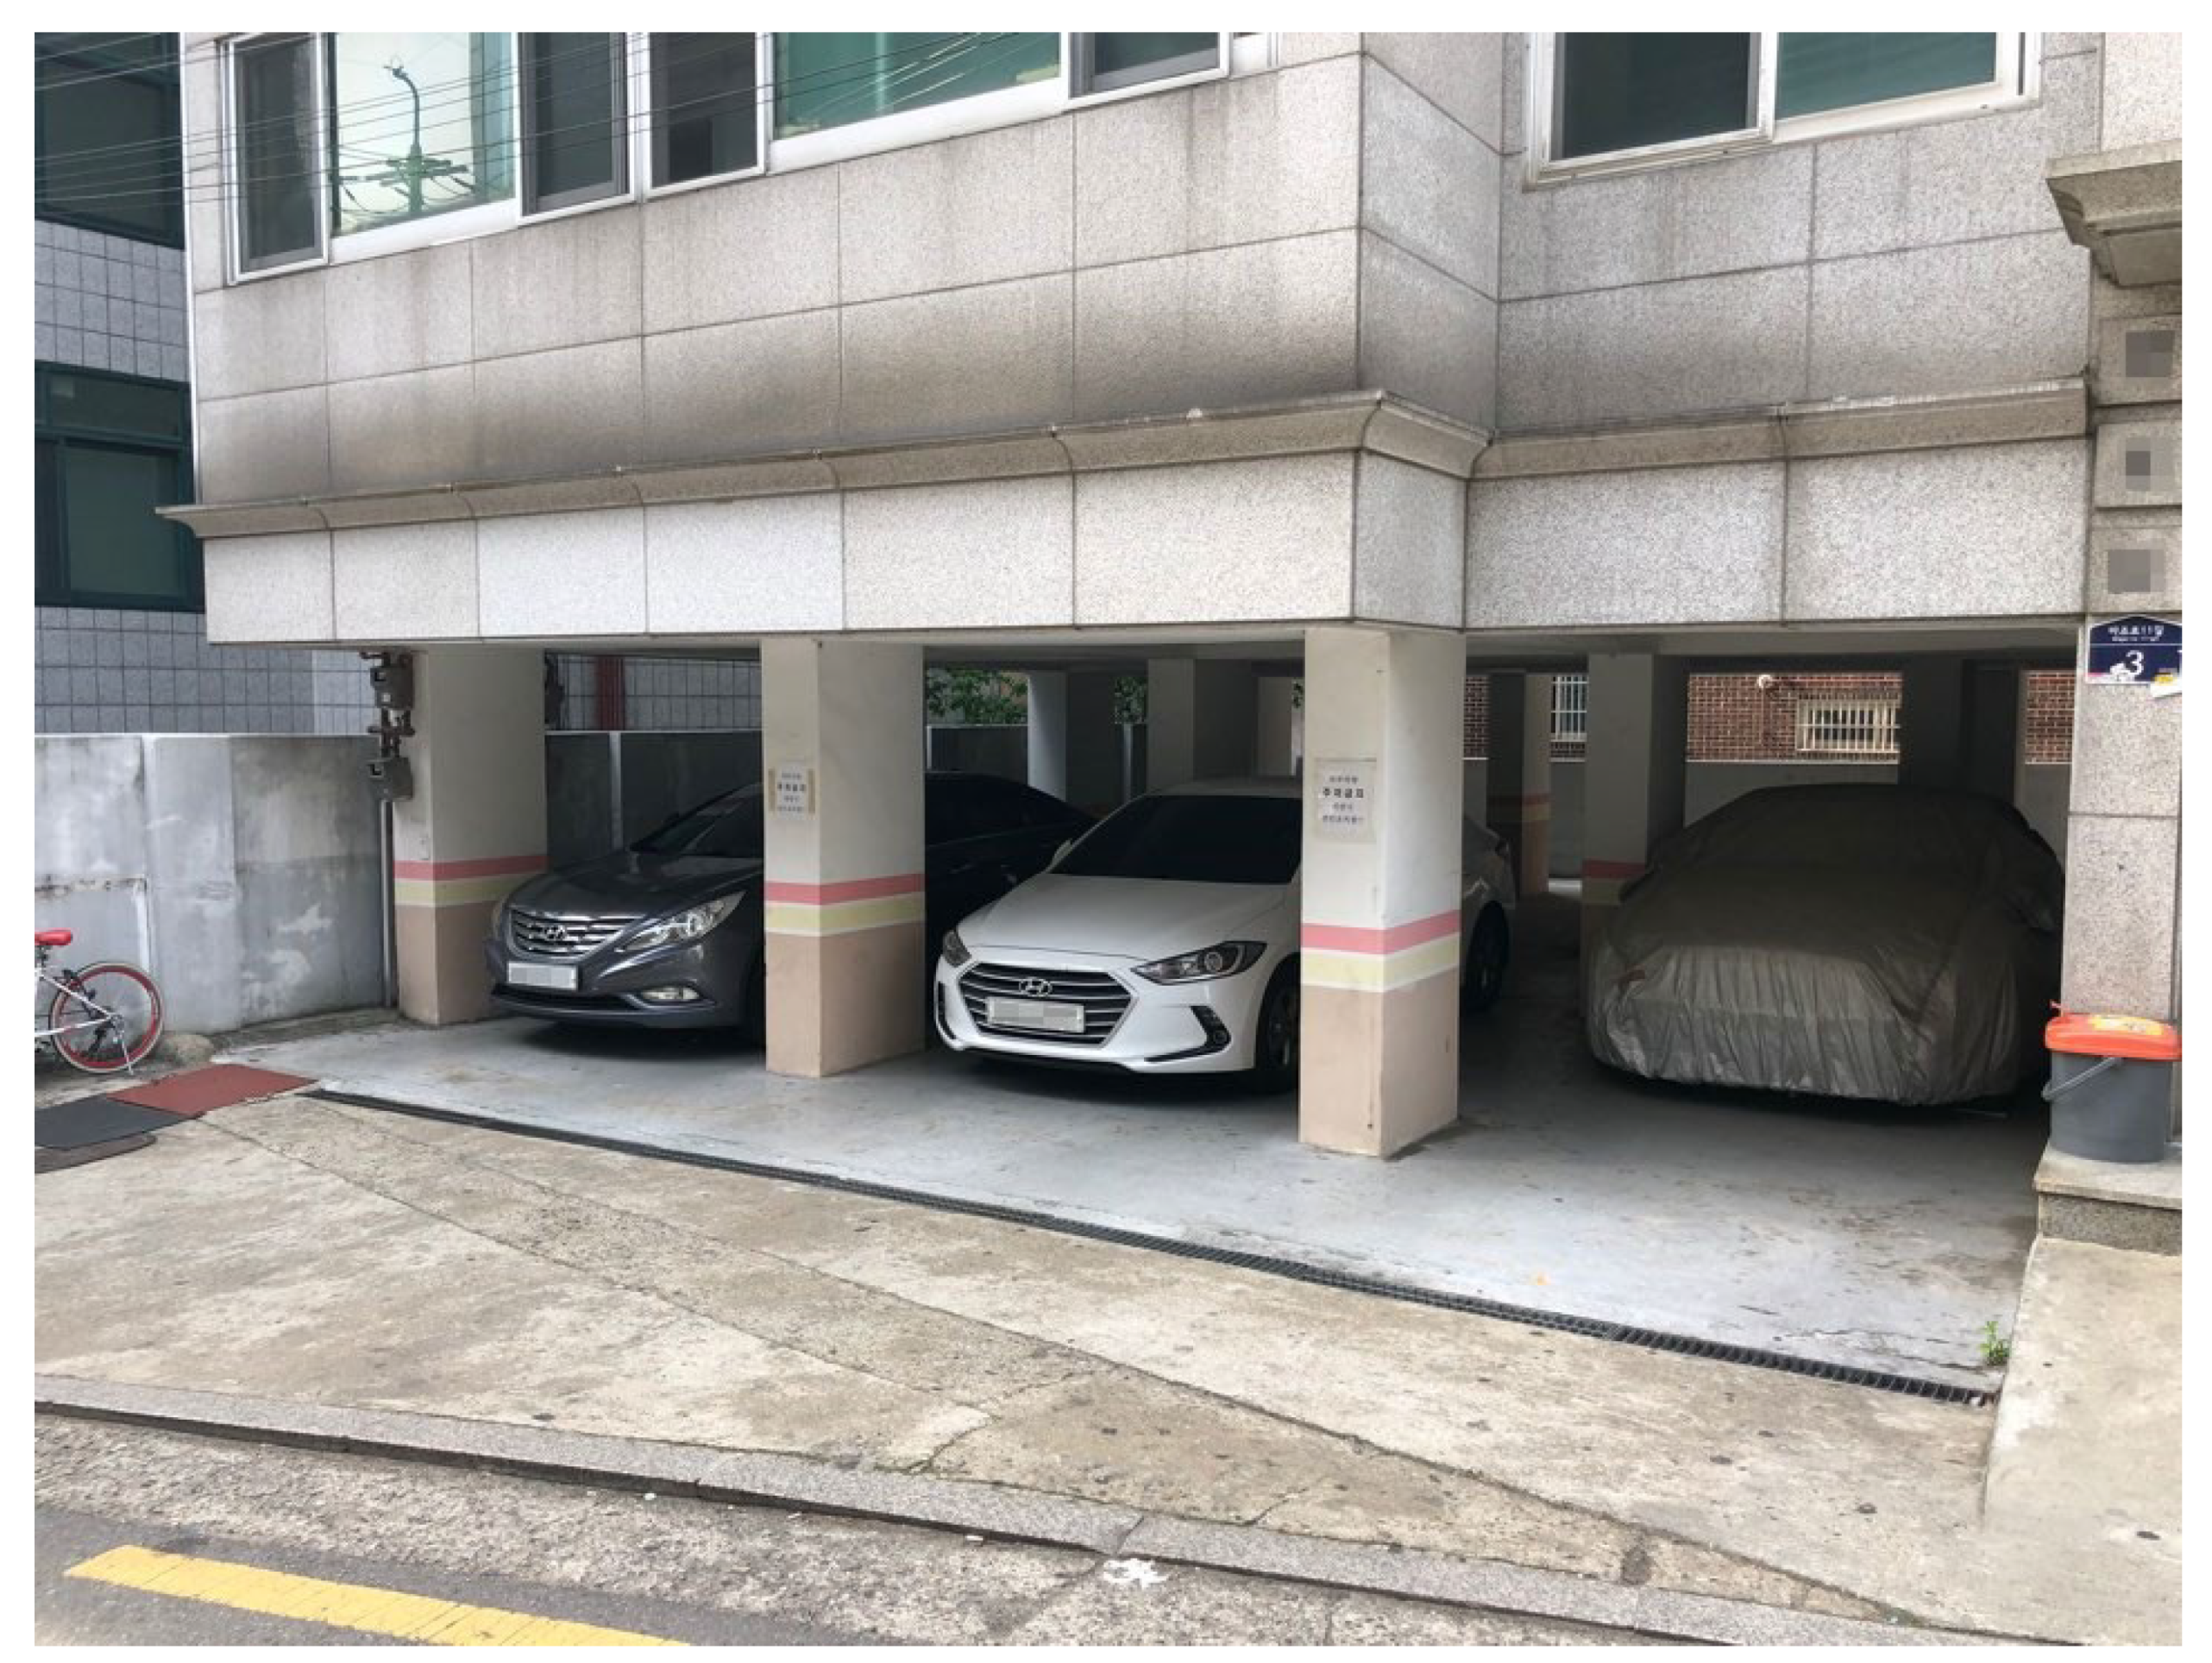
1. Introduction
2. Materials and Methods
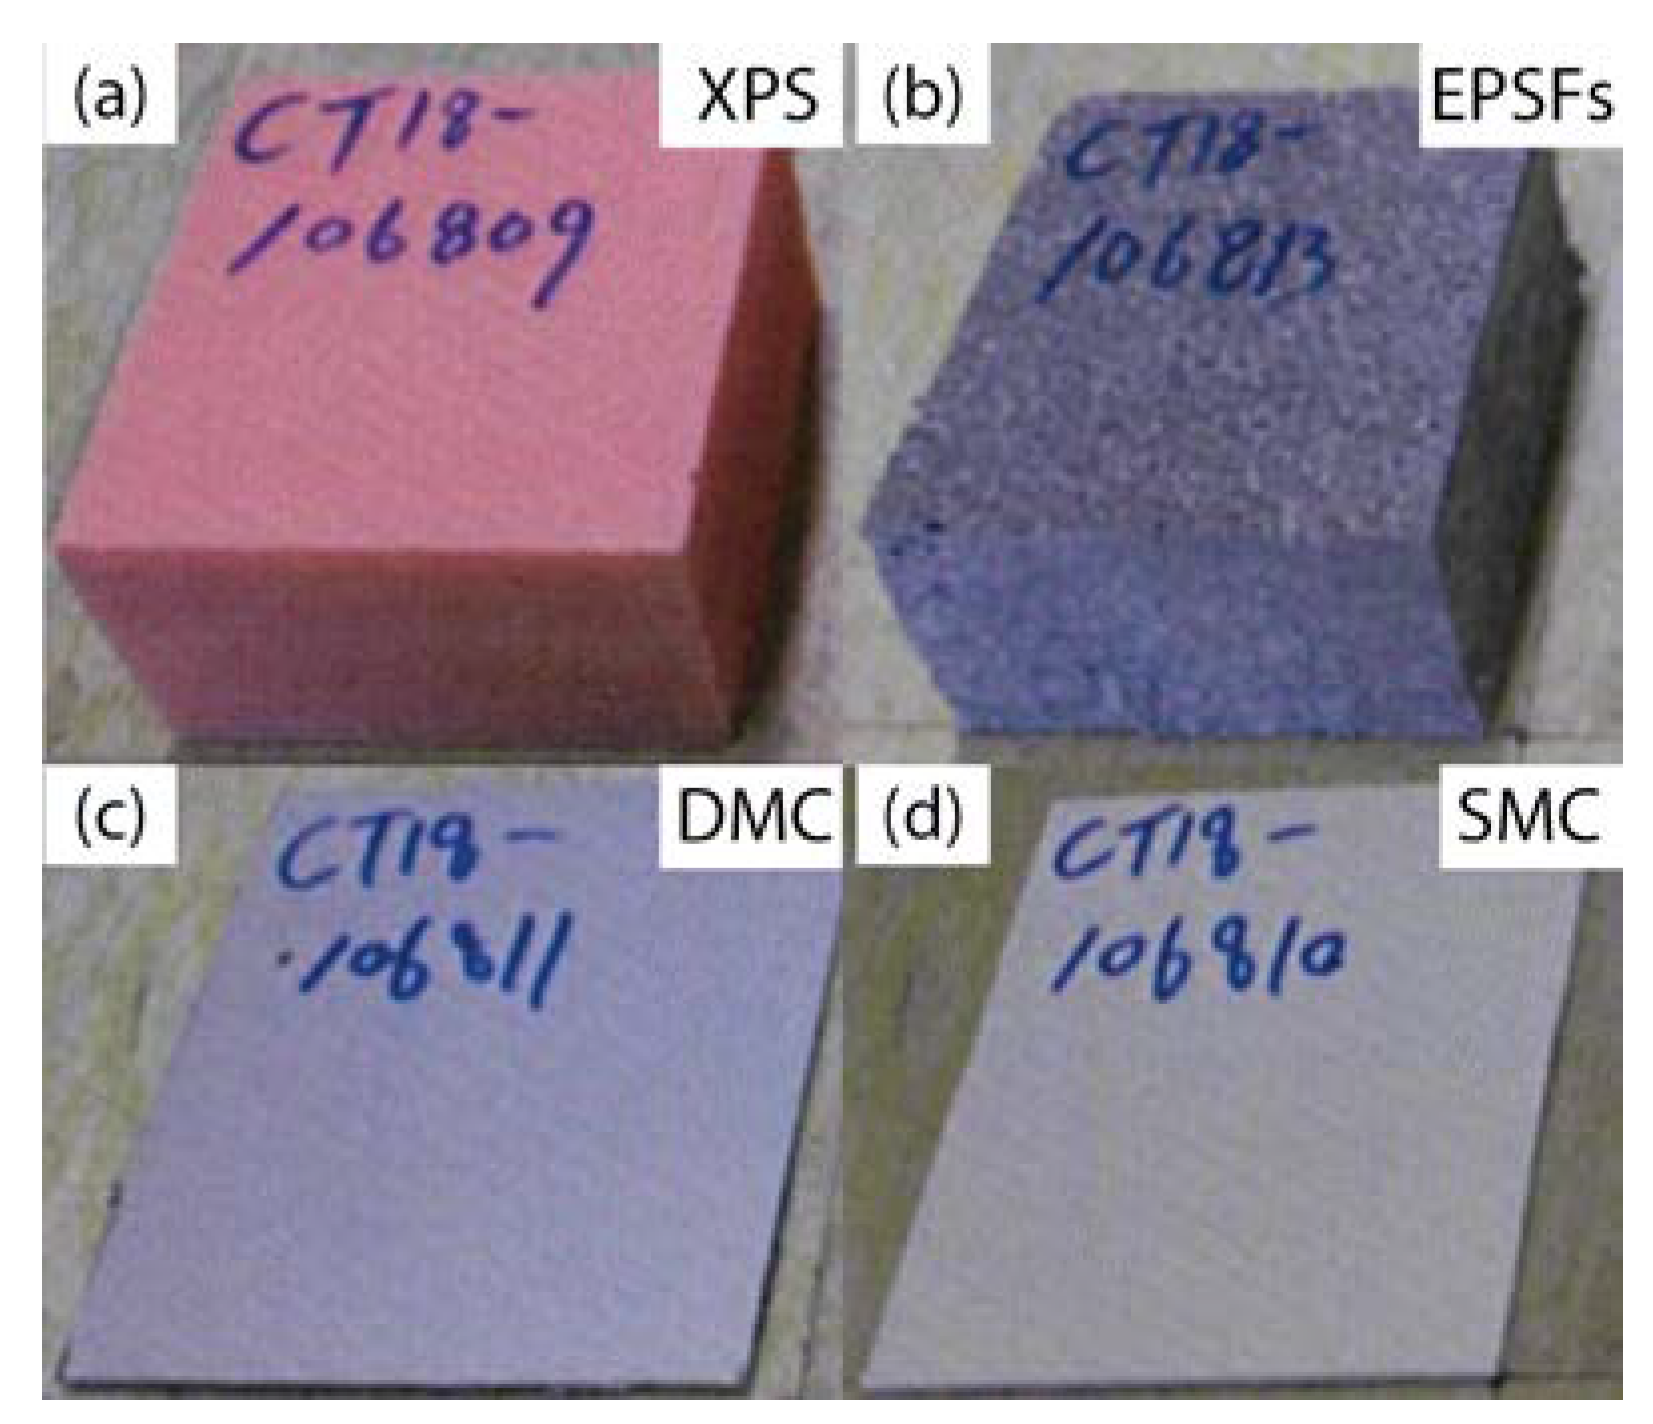
2.1. Test Materials
2.2. Cone Calorimetry Test
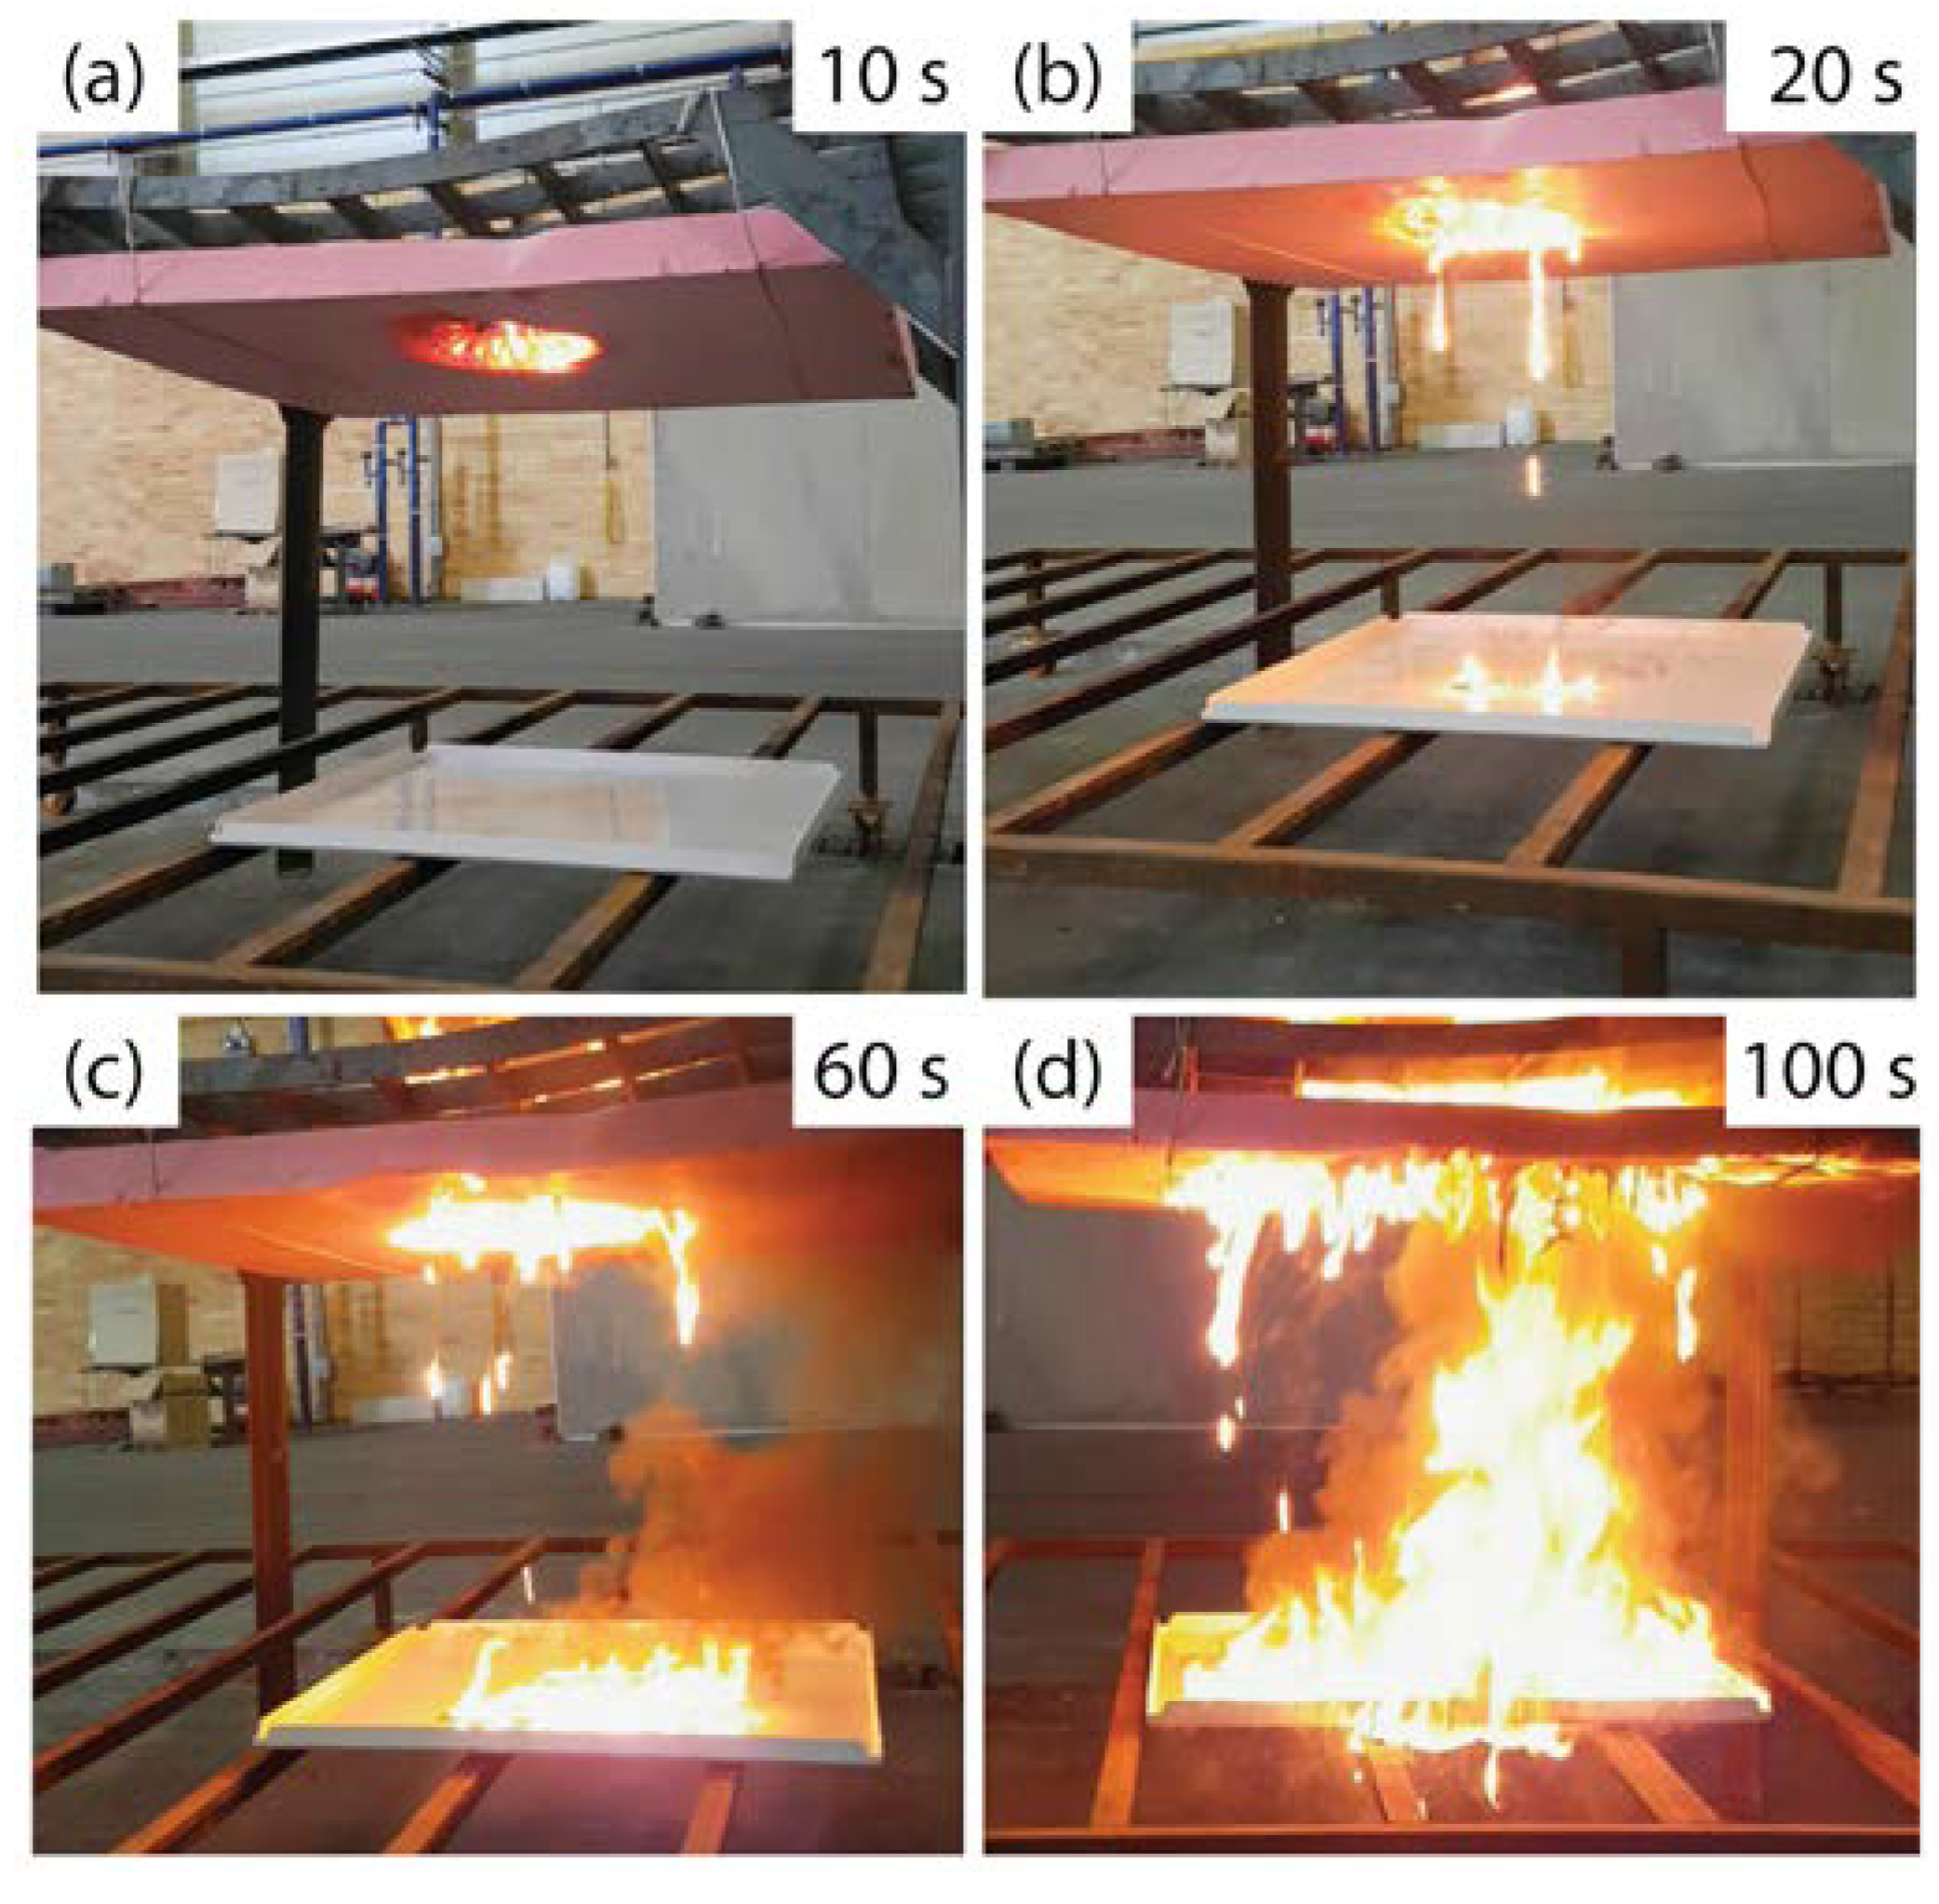
2.3. Preliminary Ignition Test
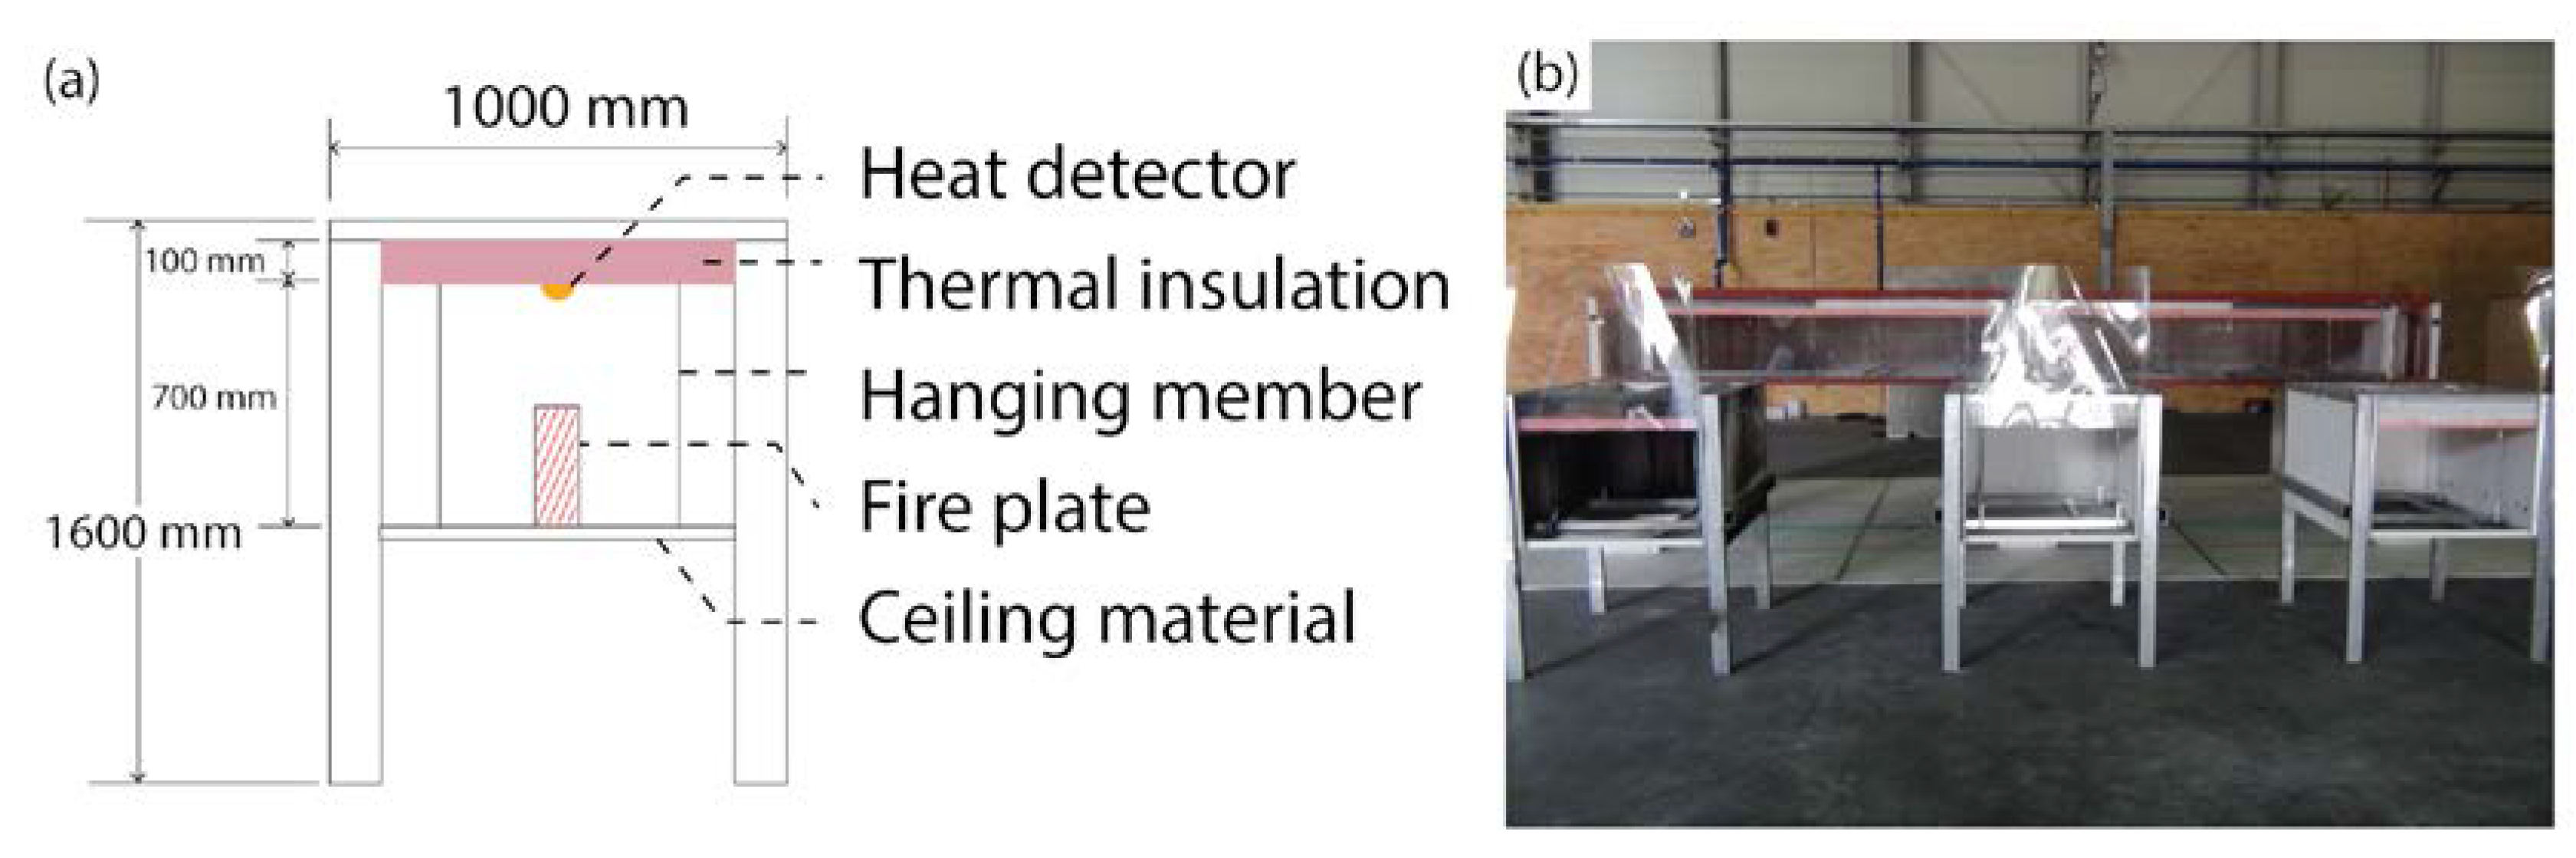
2.4. Small-Scale Model Test
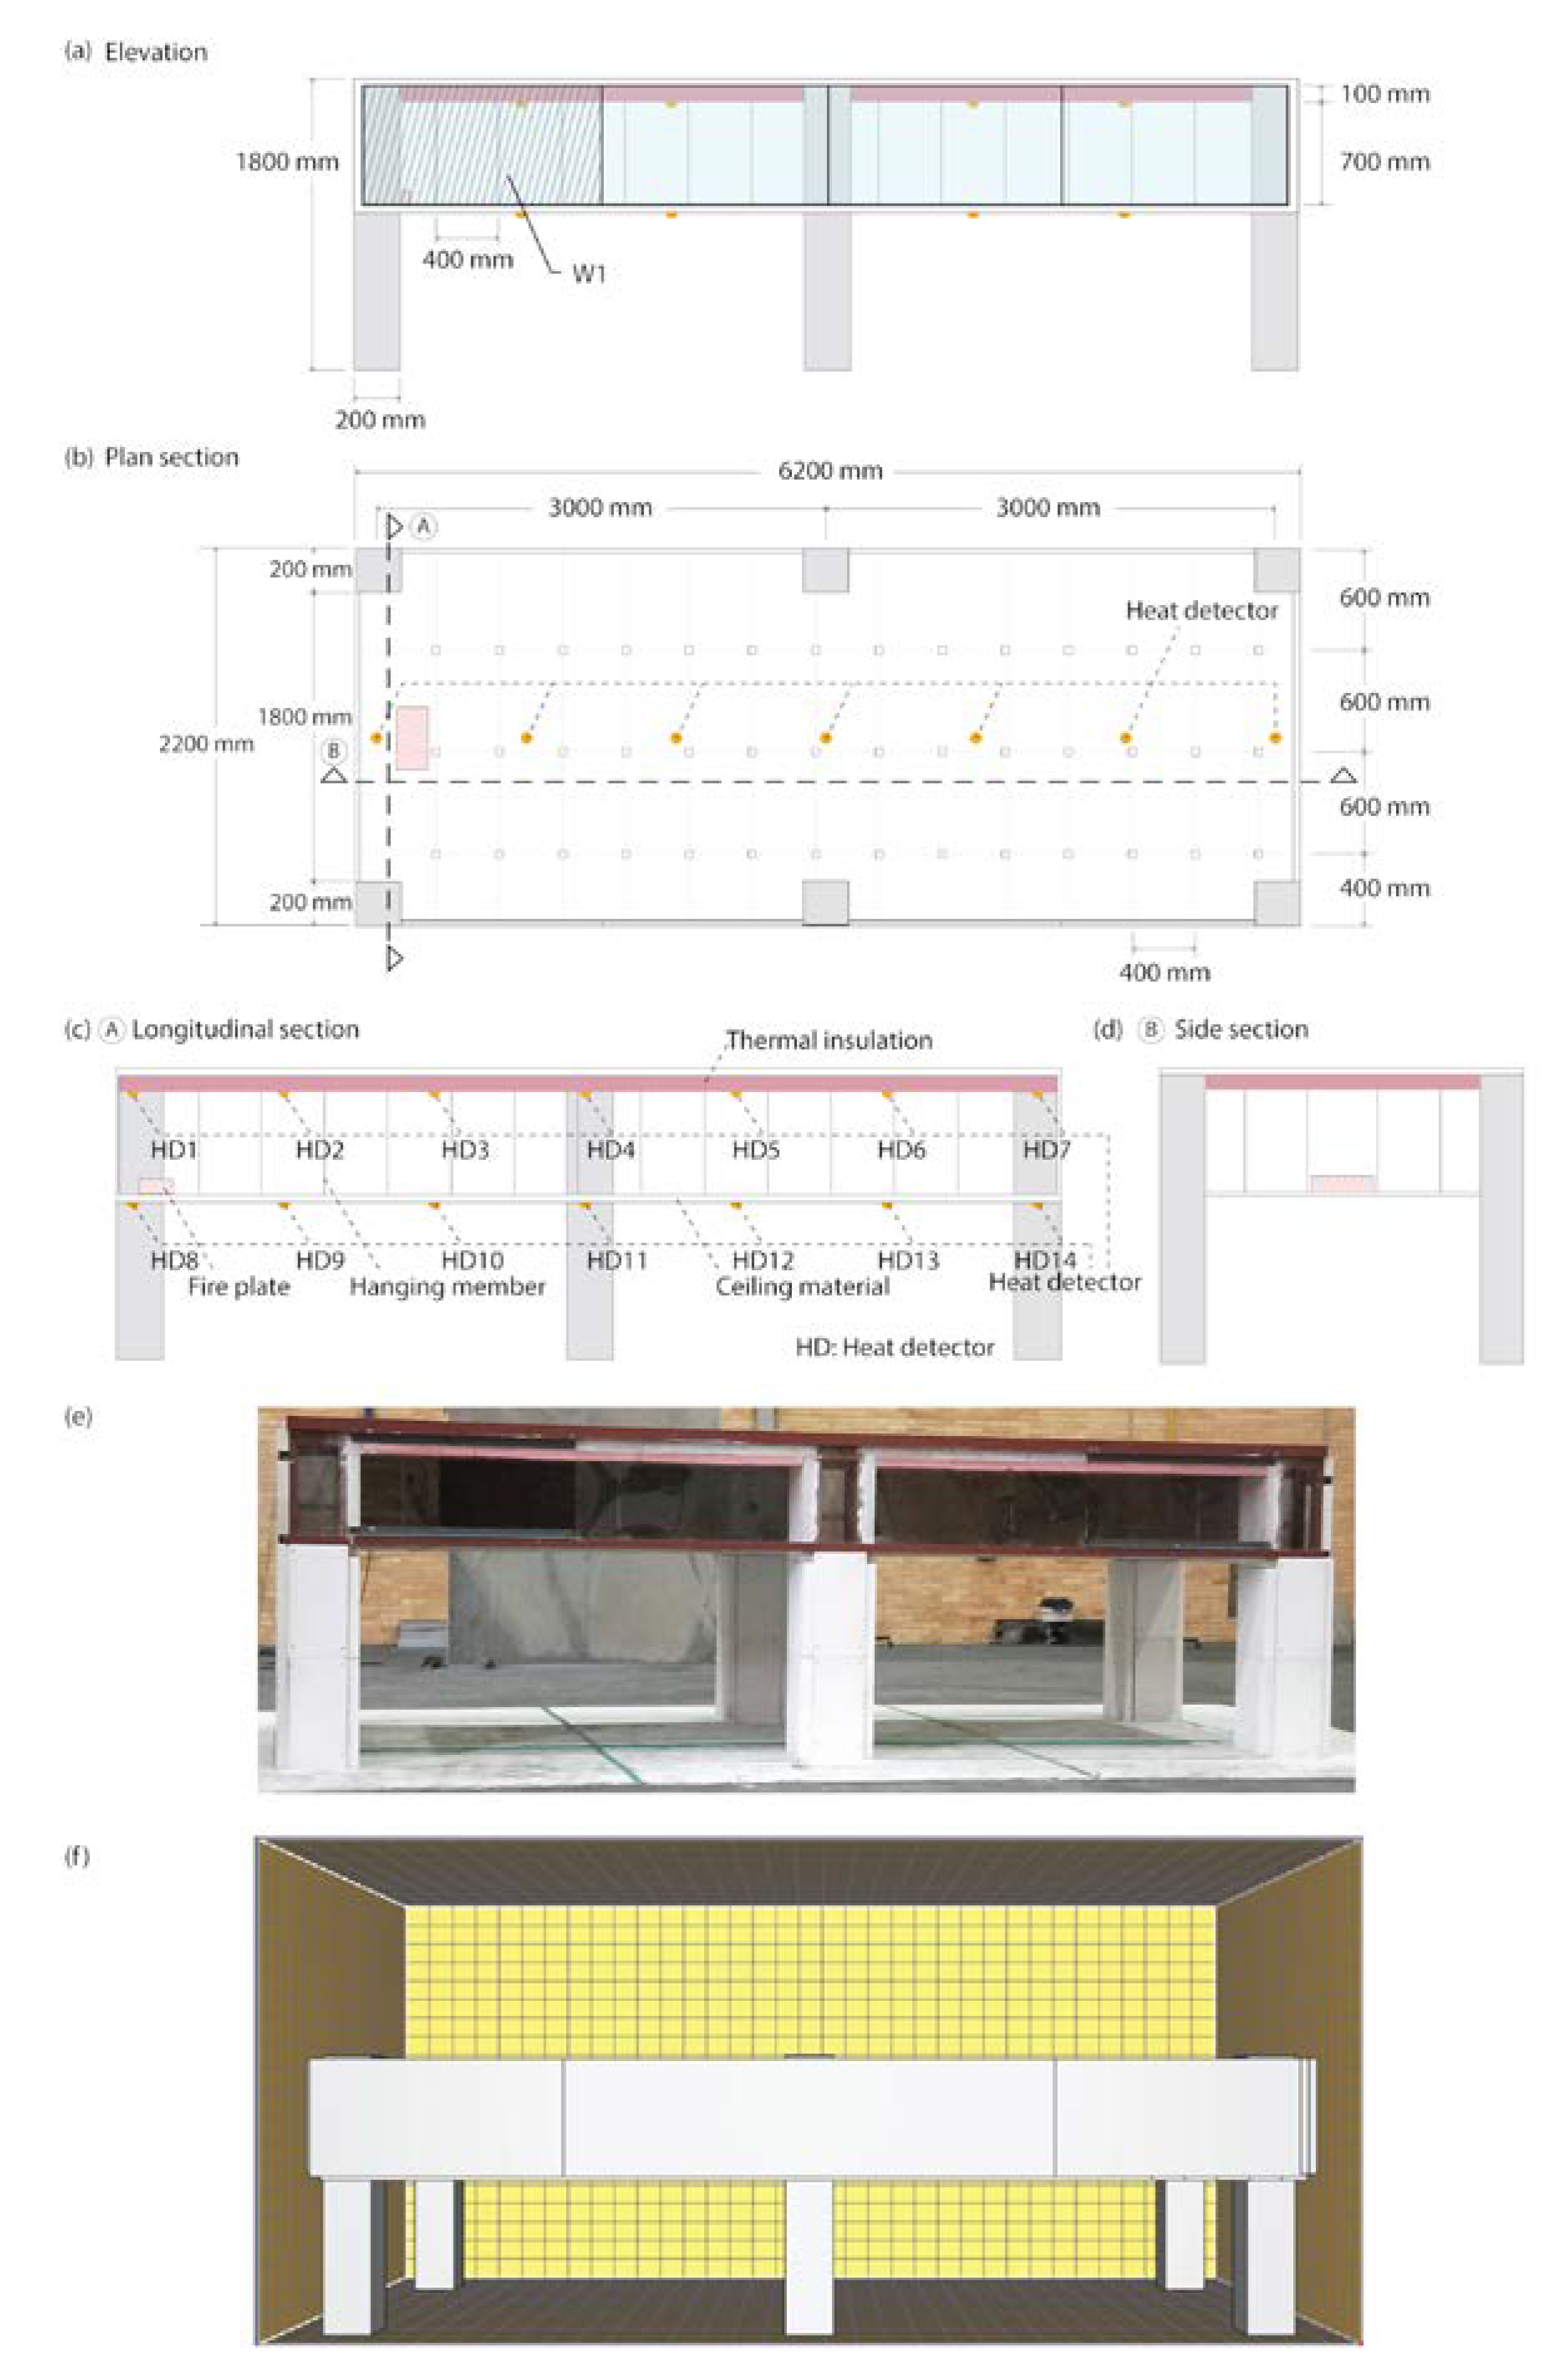
2.5. Real-Scale Fire Test
2.6. Fire Dynamics Simulation (FDS)
3. Results and Discussion
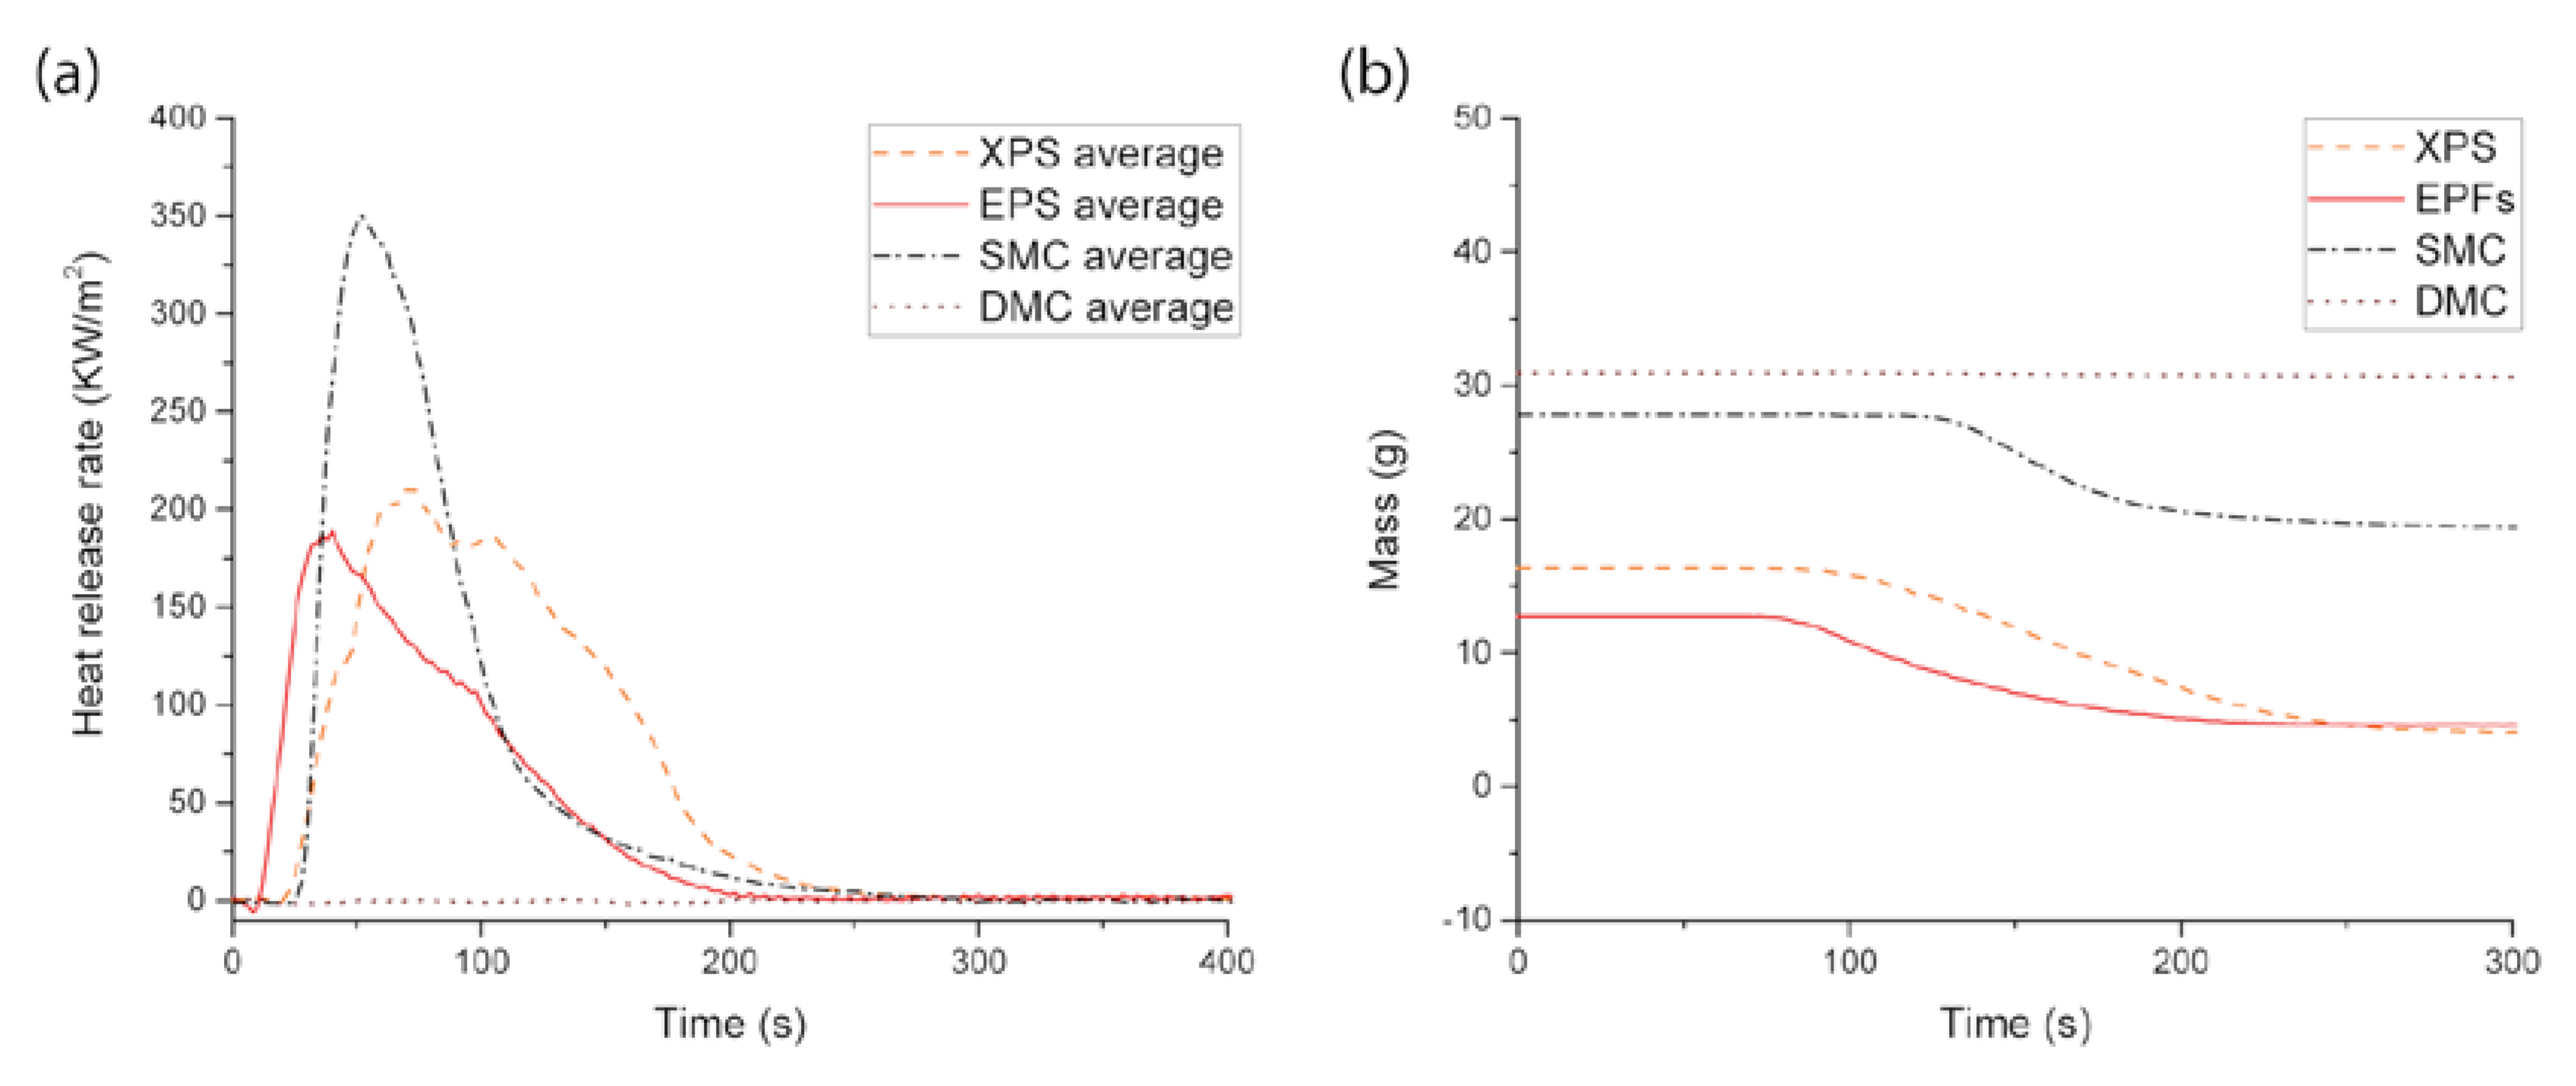
3.1. Cone Calorimetry Test
3.2. Preliminary Ignition Test
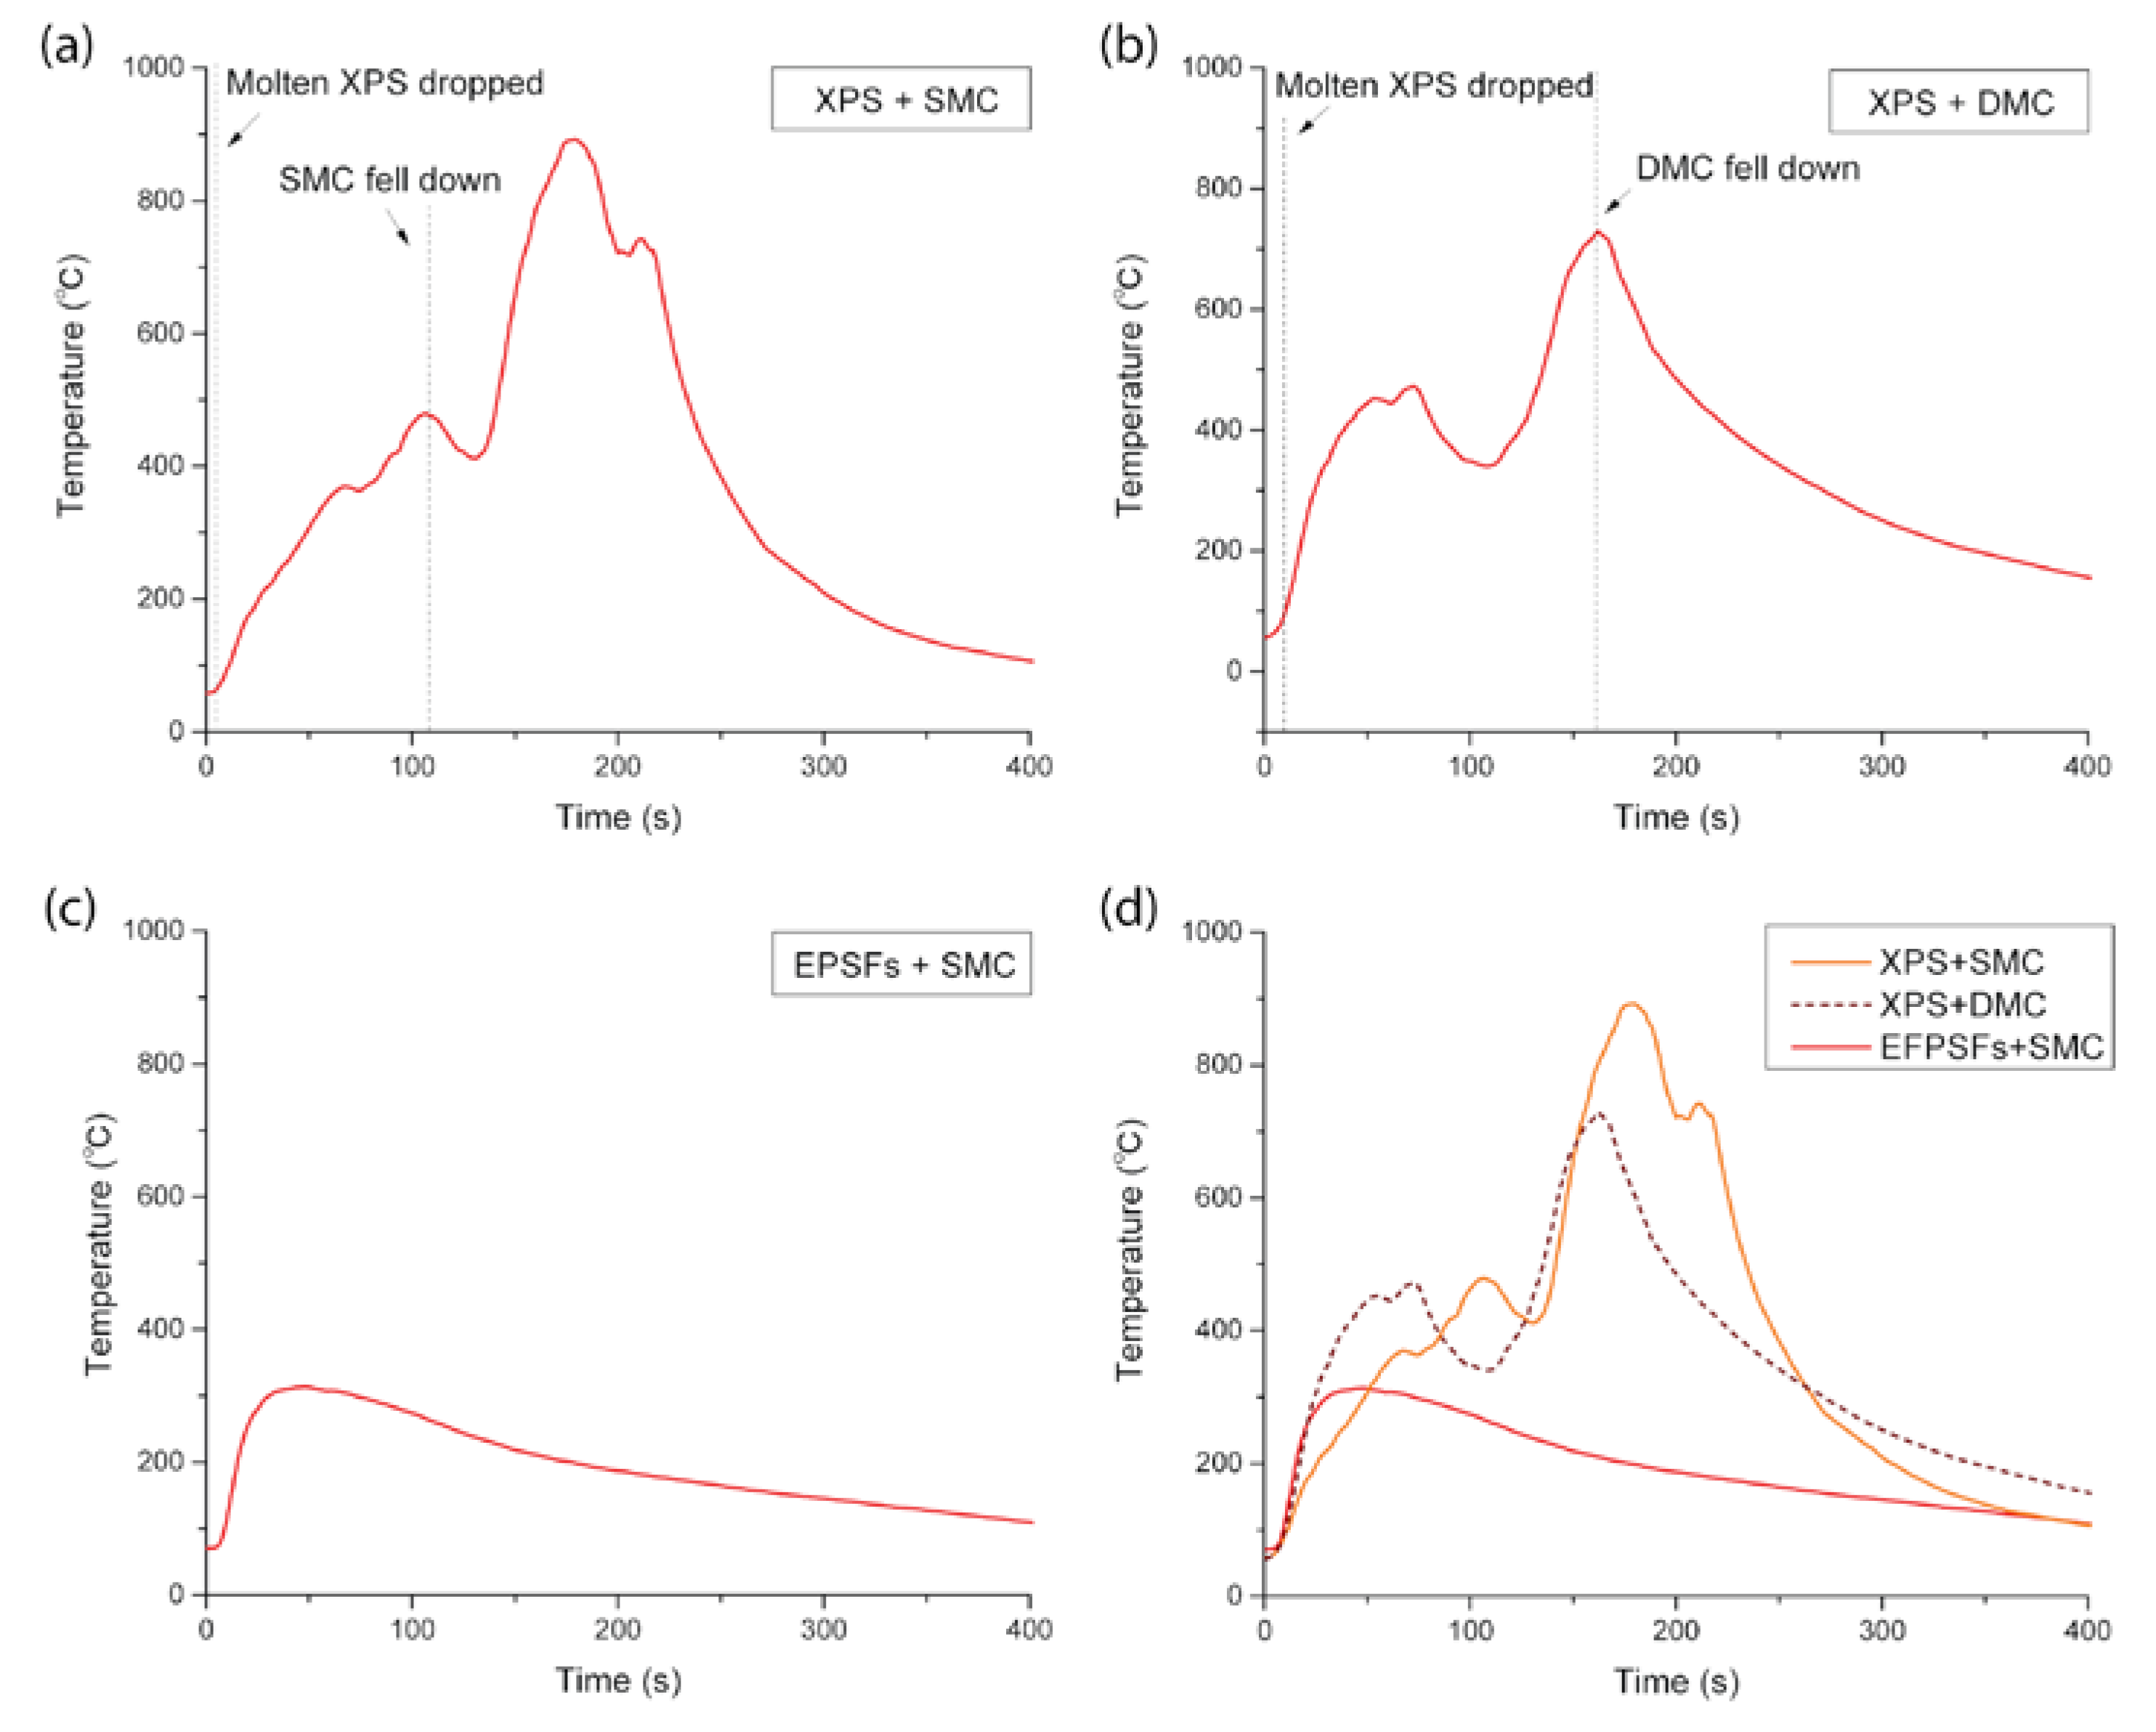
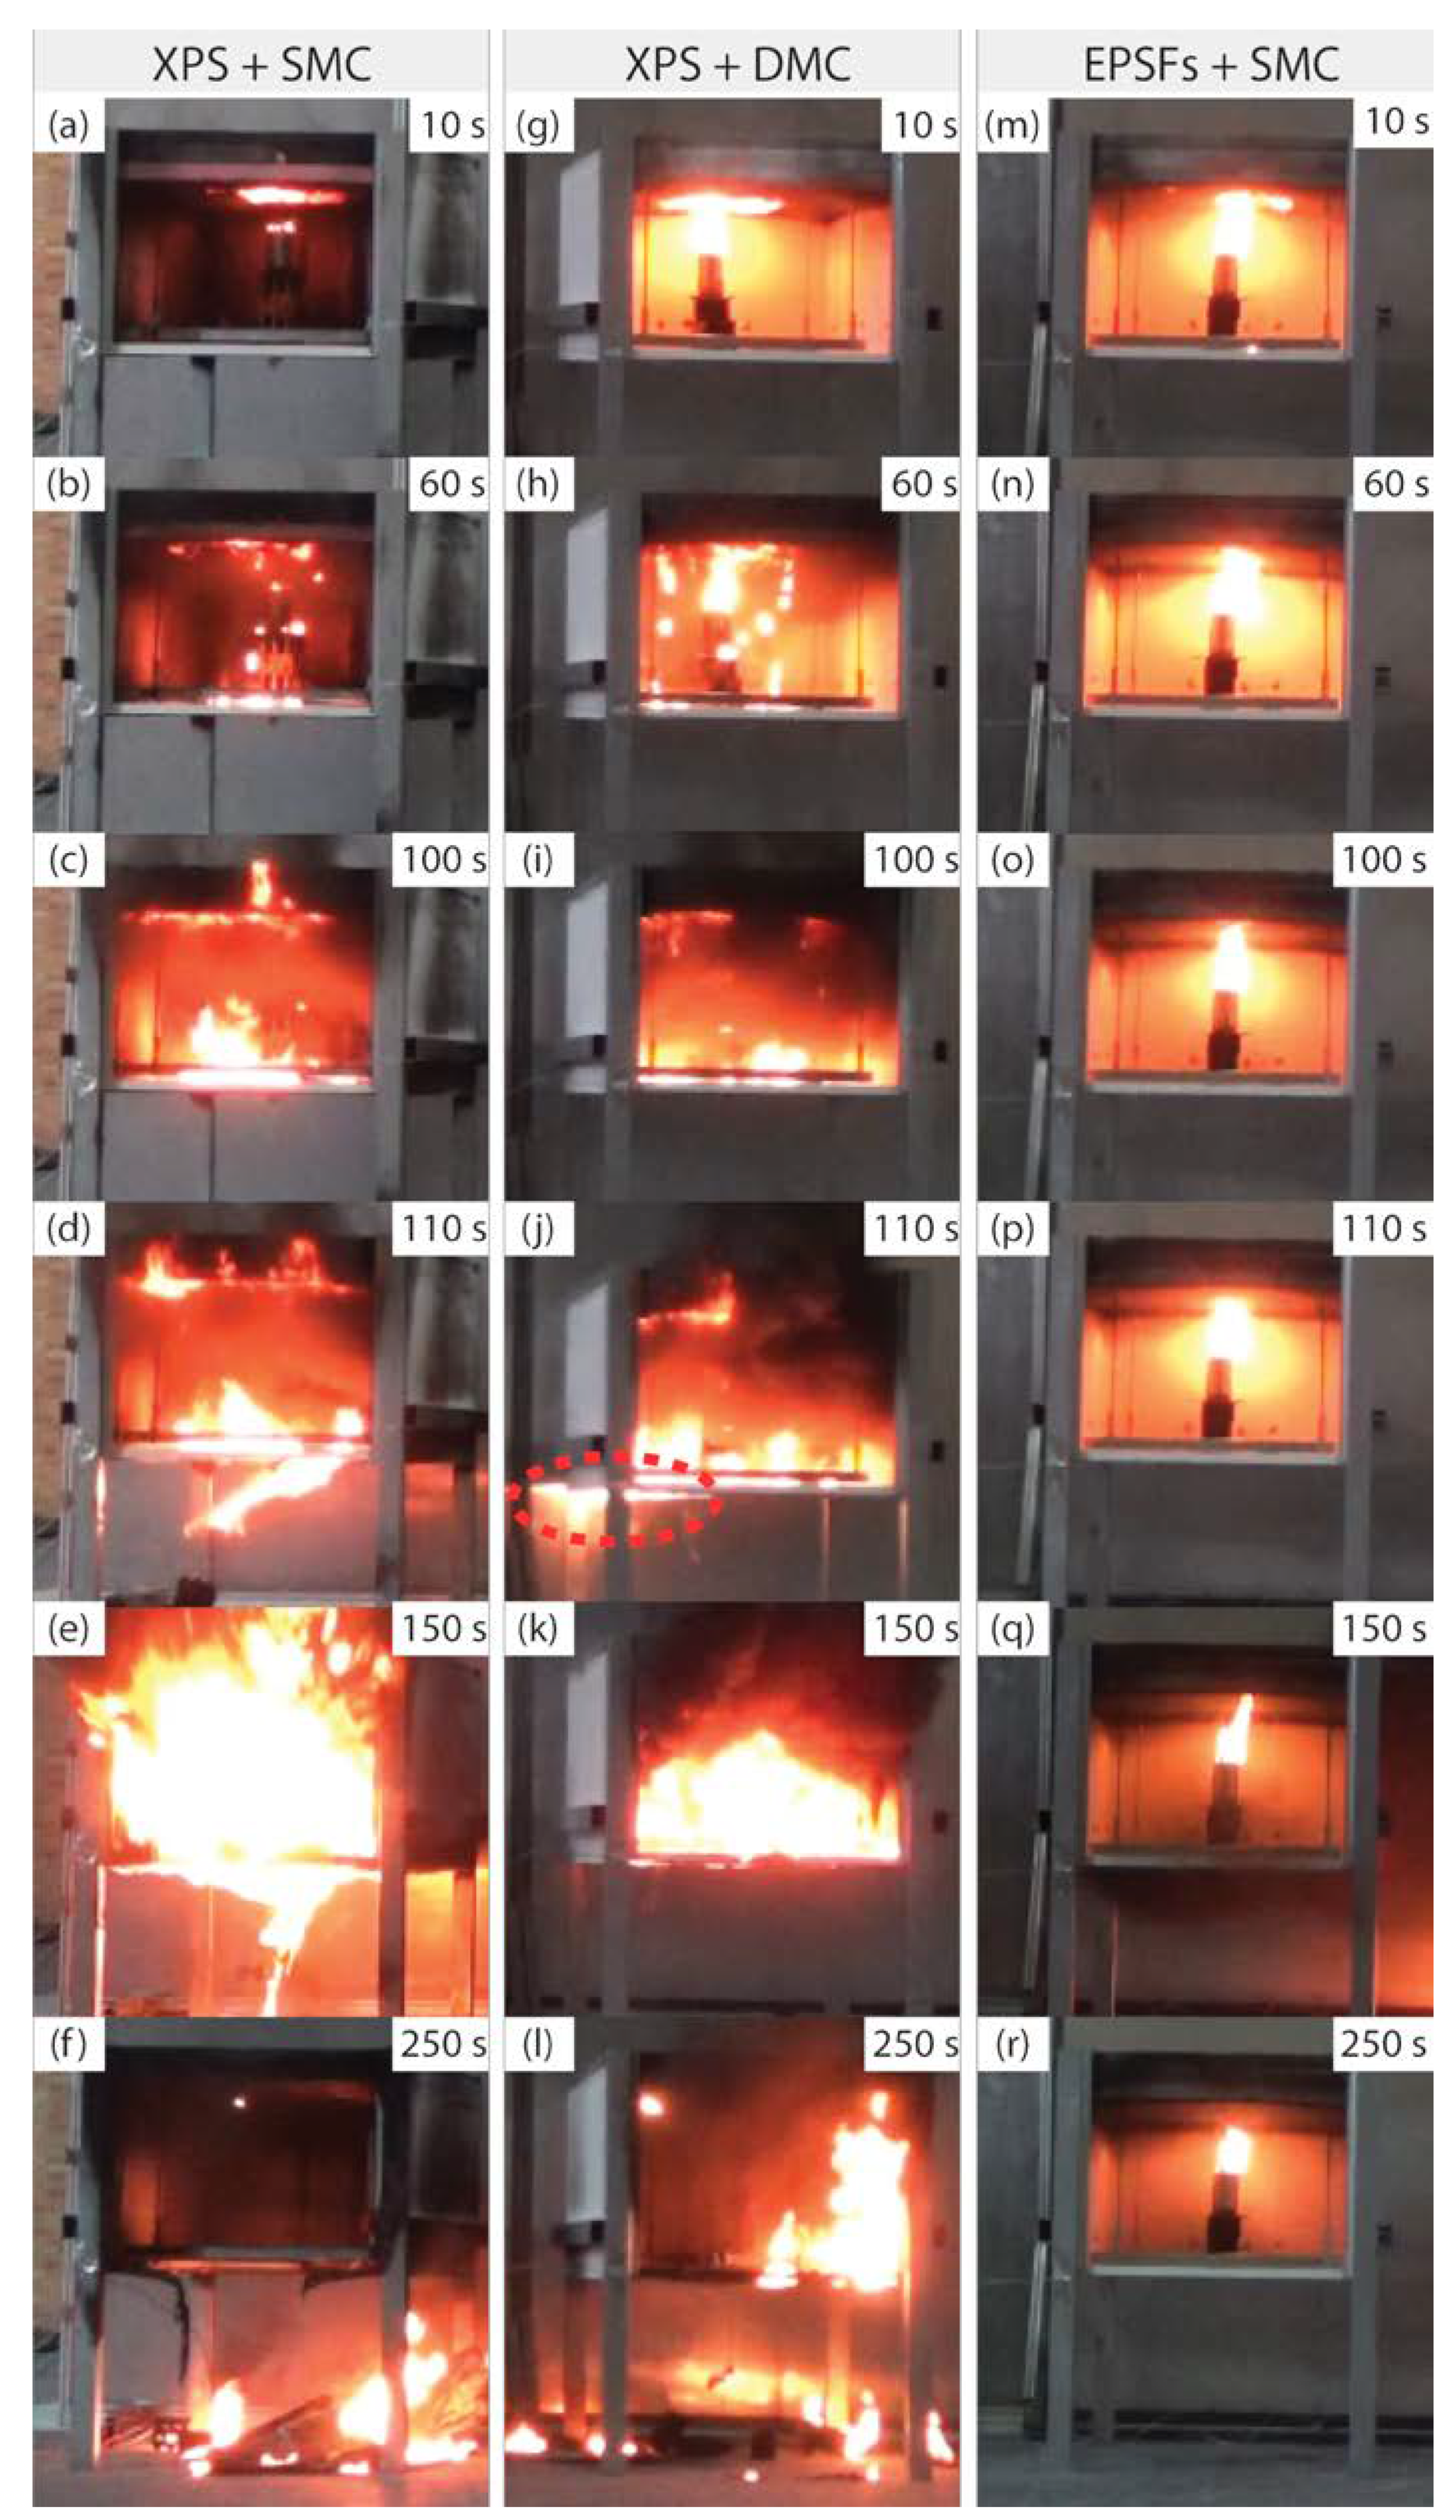
3.3. Small-Scale Model Fire Test
3.3.1. XPS + SMC
3.3.2. XPS + DMC
3.3.3. EPSFs + SMC
3.4. Real-Scale Fire Test
3.4.1. XPS + SMC
3.4.2. EPSFs + DMC
3.5. Analysis of Fire Dynamic Simulation (FDS)
4. Conclusions
- A preliminary test was conducted using the XPS + SMC structure simulating the worst fire situation before the small-scale test. In this test, the fire started when the thermal insulation materials were exposed to an ignition source. As the molten XPS dropped onto the SMC ceiling materials, new ignition sources were formed, which led to fire spread by the surrounding combustible gases and oxygen. The deposition of molten XPS onto the ceiling materials when it was exposed to fire, increased the ignition sources. This phenomenon occurred in both the small-scale and real-scale fire tests where XPS was used as the thermal insulation material.
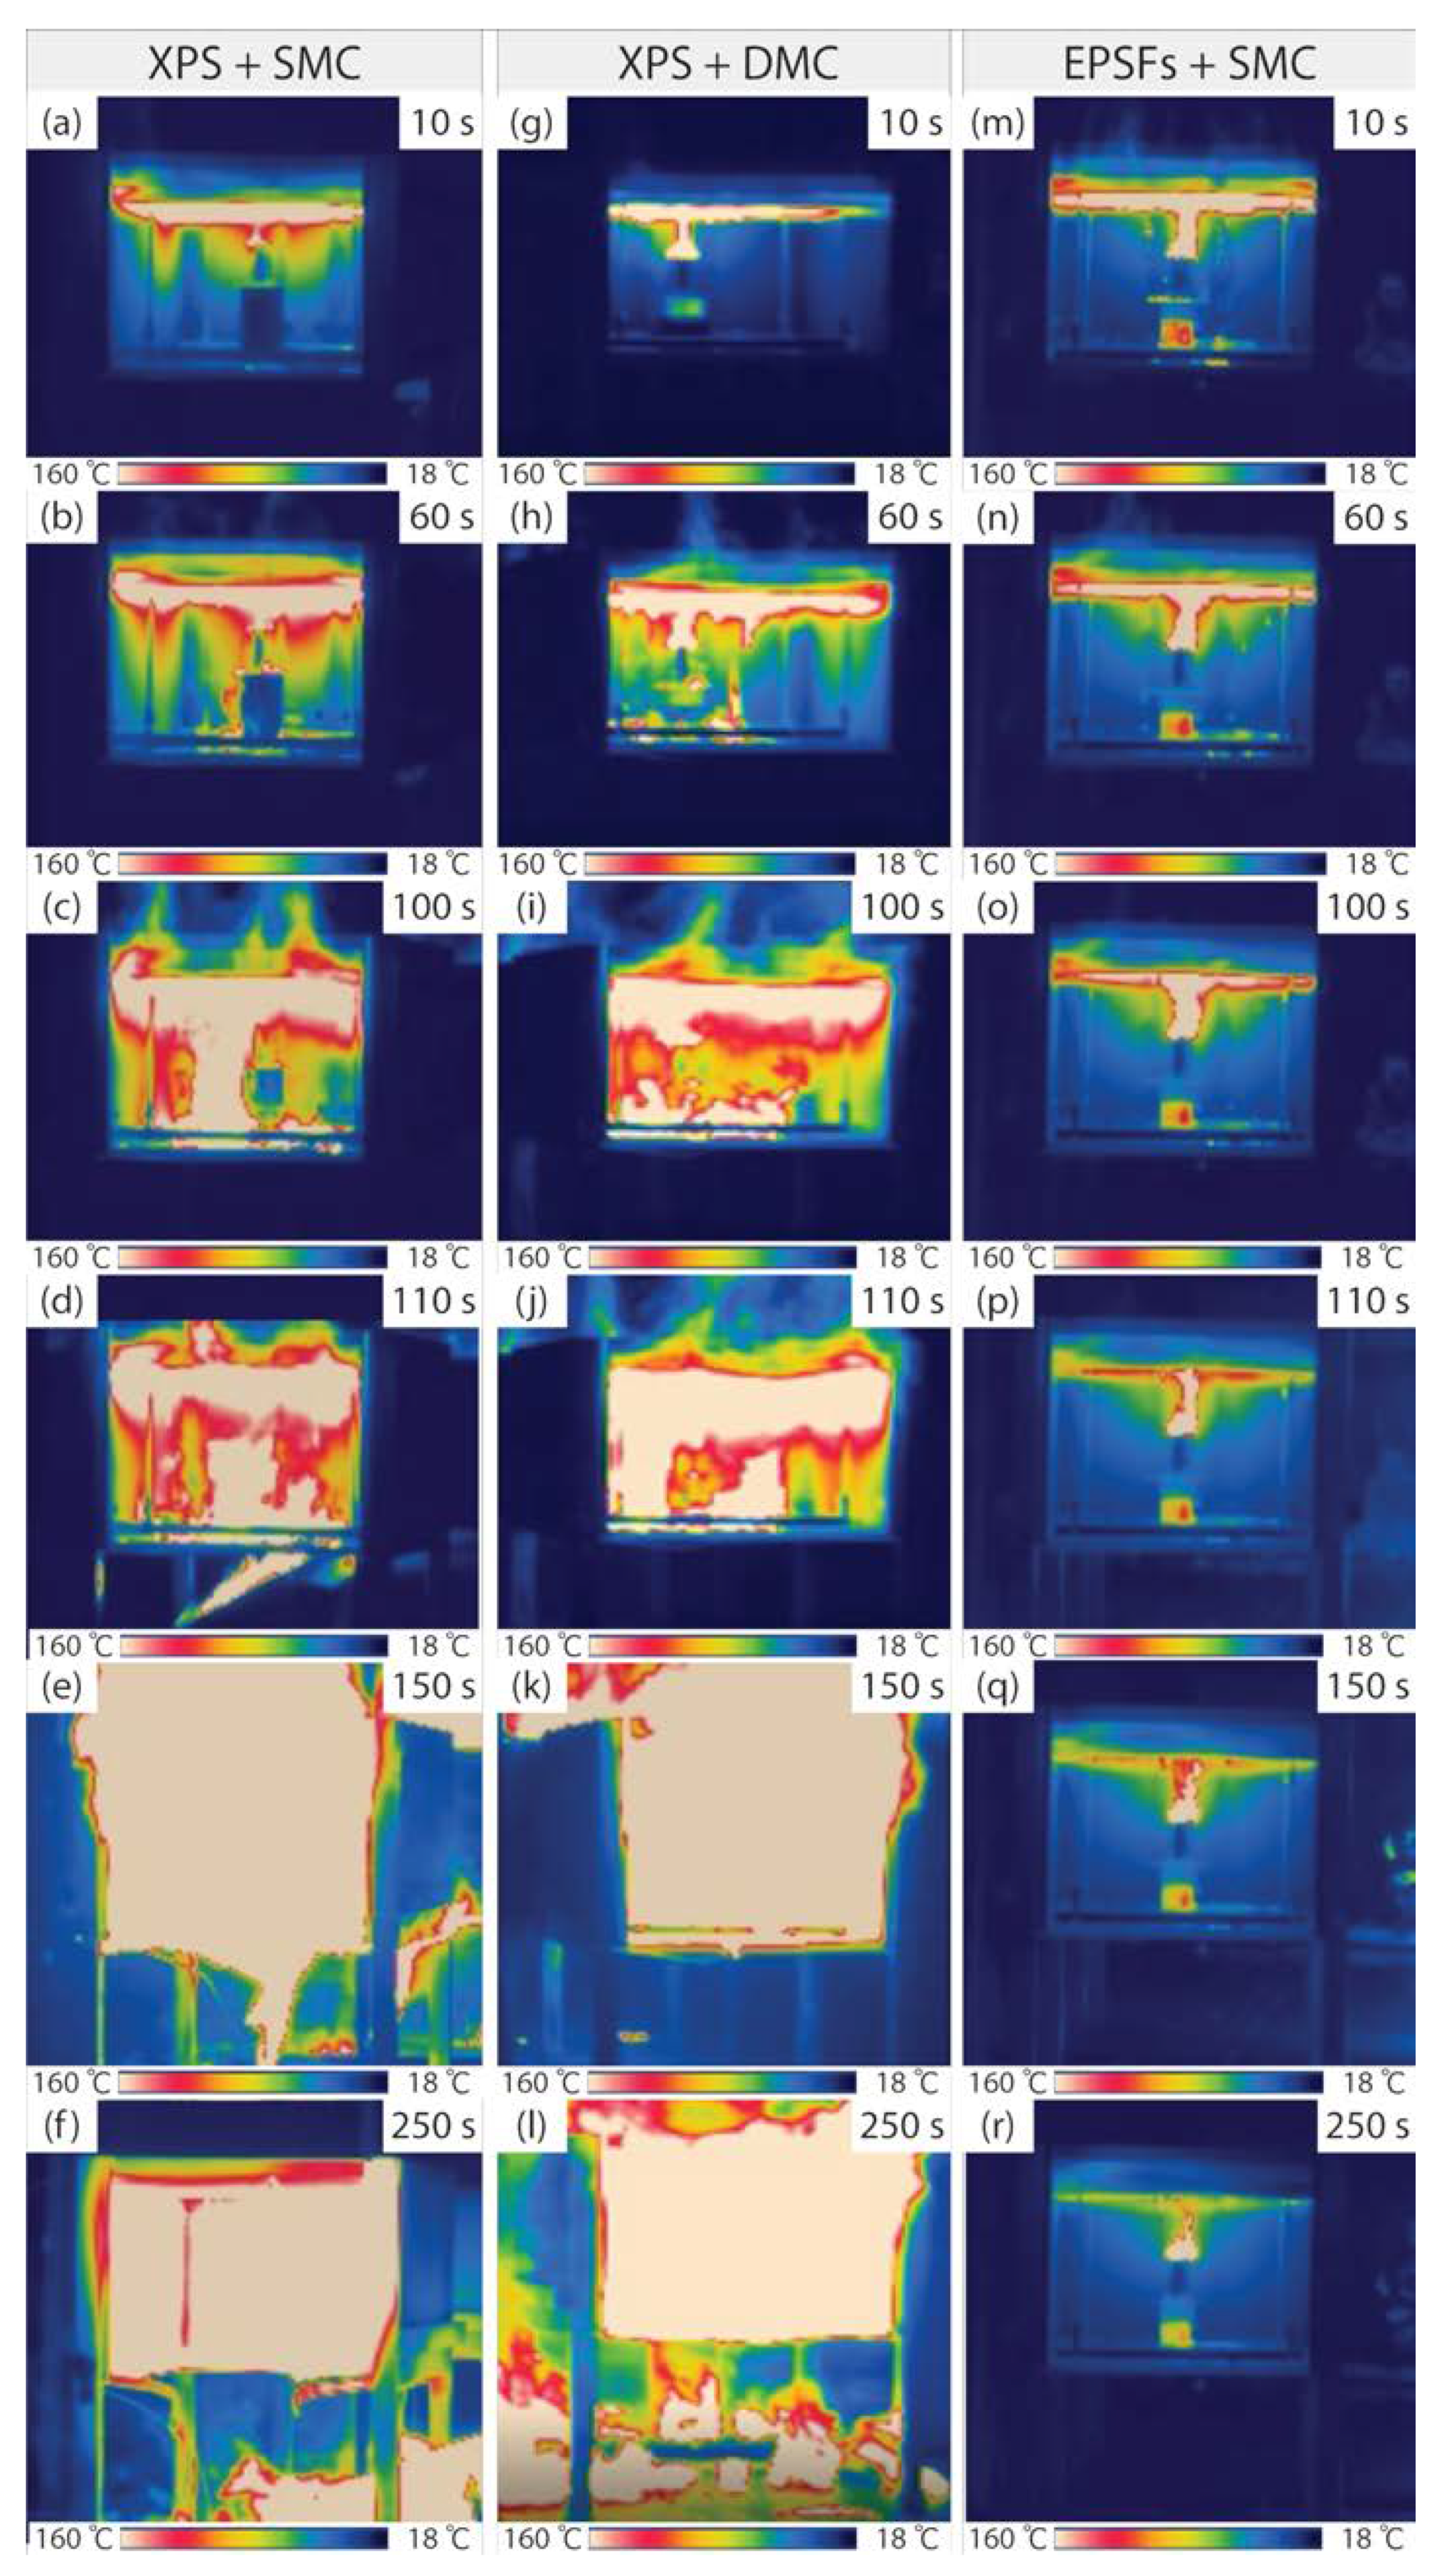
- When the structure in which the XPS was used as the thermal insulation material was exposed to an ignition source in the small-scale test, the molten XPS accumulated from 15 s after the test start, and the ignition sources increased, thus increasing the fire intensity. After that, the fire intensity increased further as the ceiling materials (SMC, DMC) were deformed and outside air flowed in. As a result, the ceiling materials collapsed. However, when EPSFs were used as thermal insulation materials, the fire temperature increased to 300 °C, and then the fire was weakened and extinguished due to lack of oxygen.
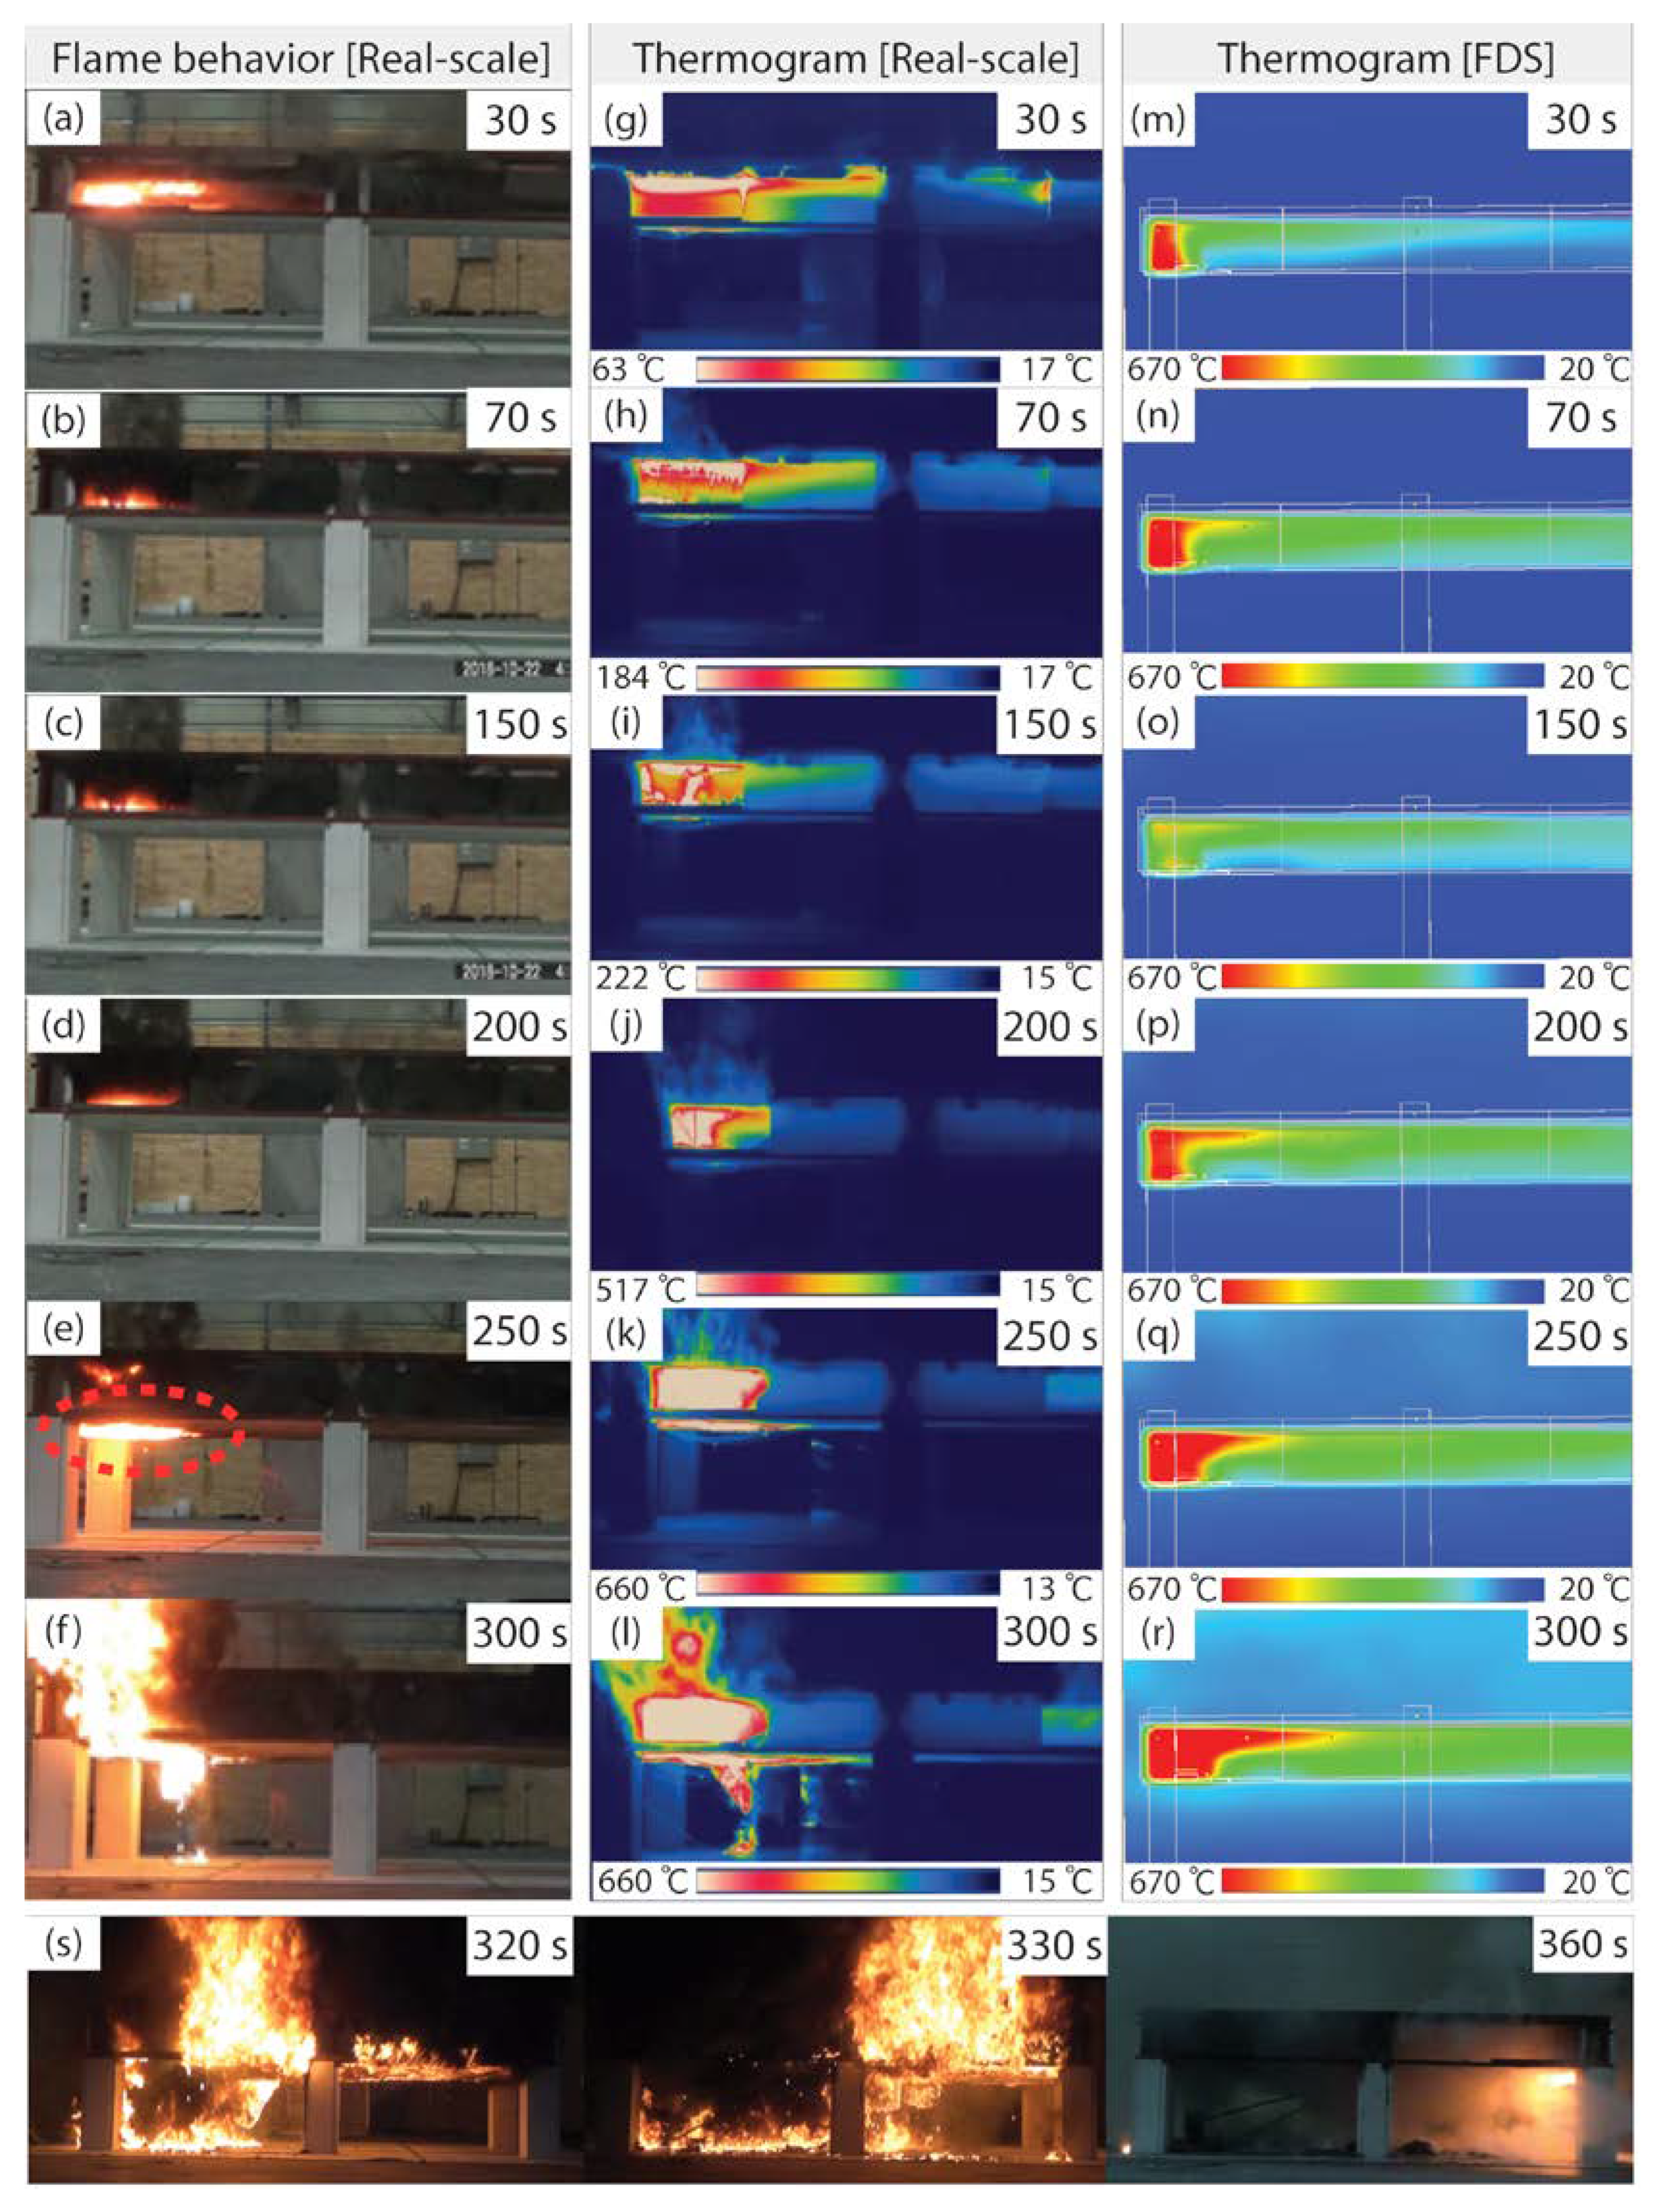
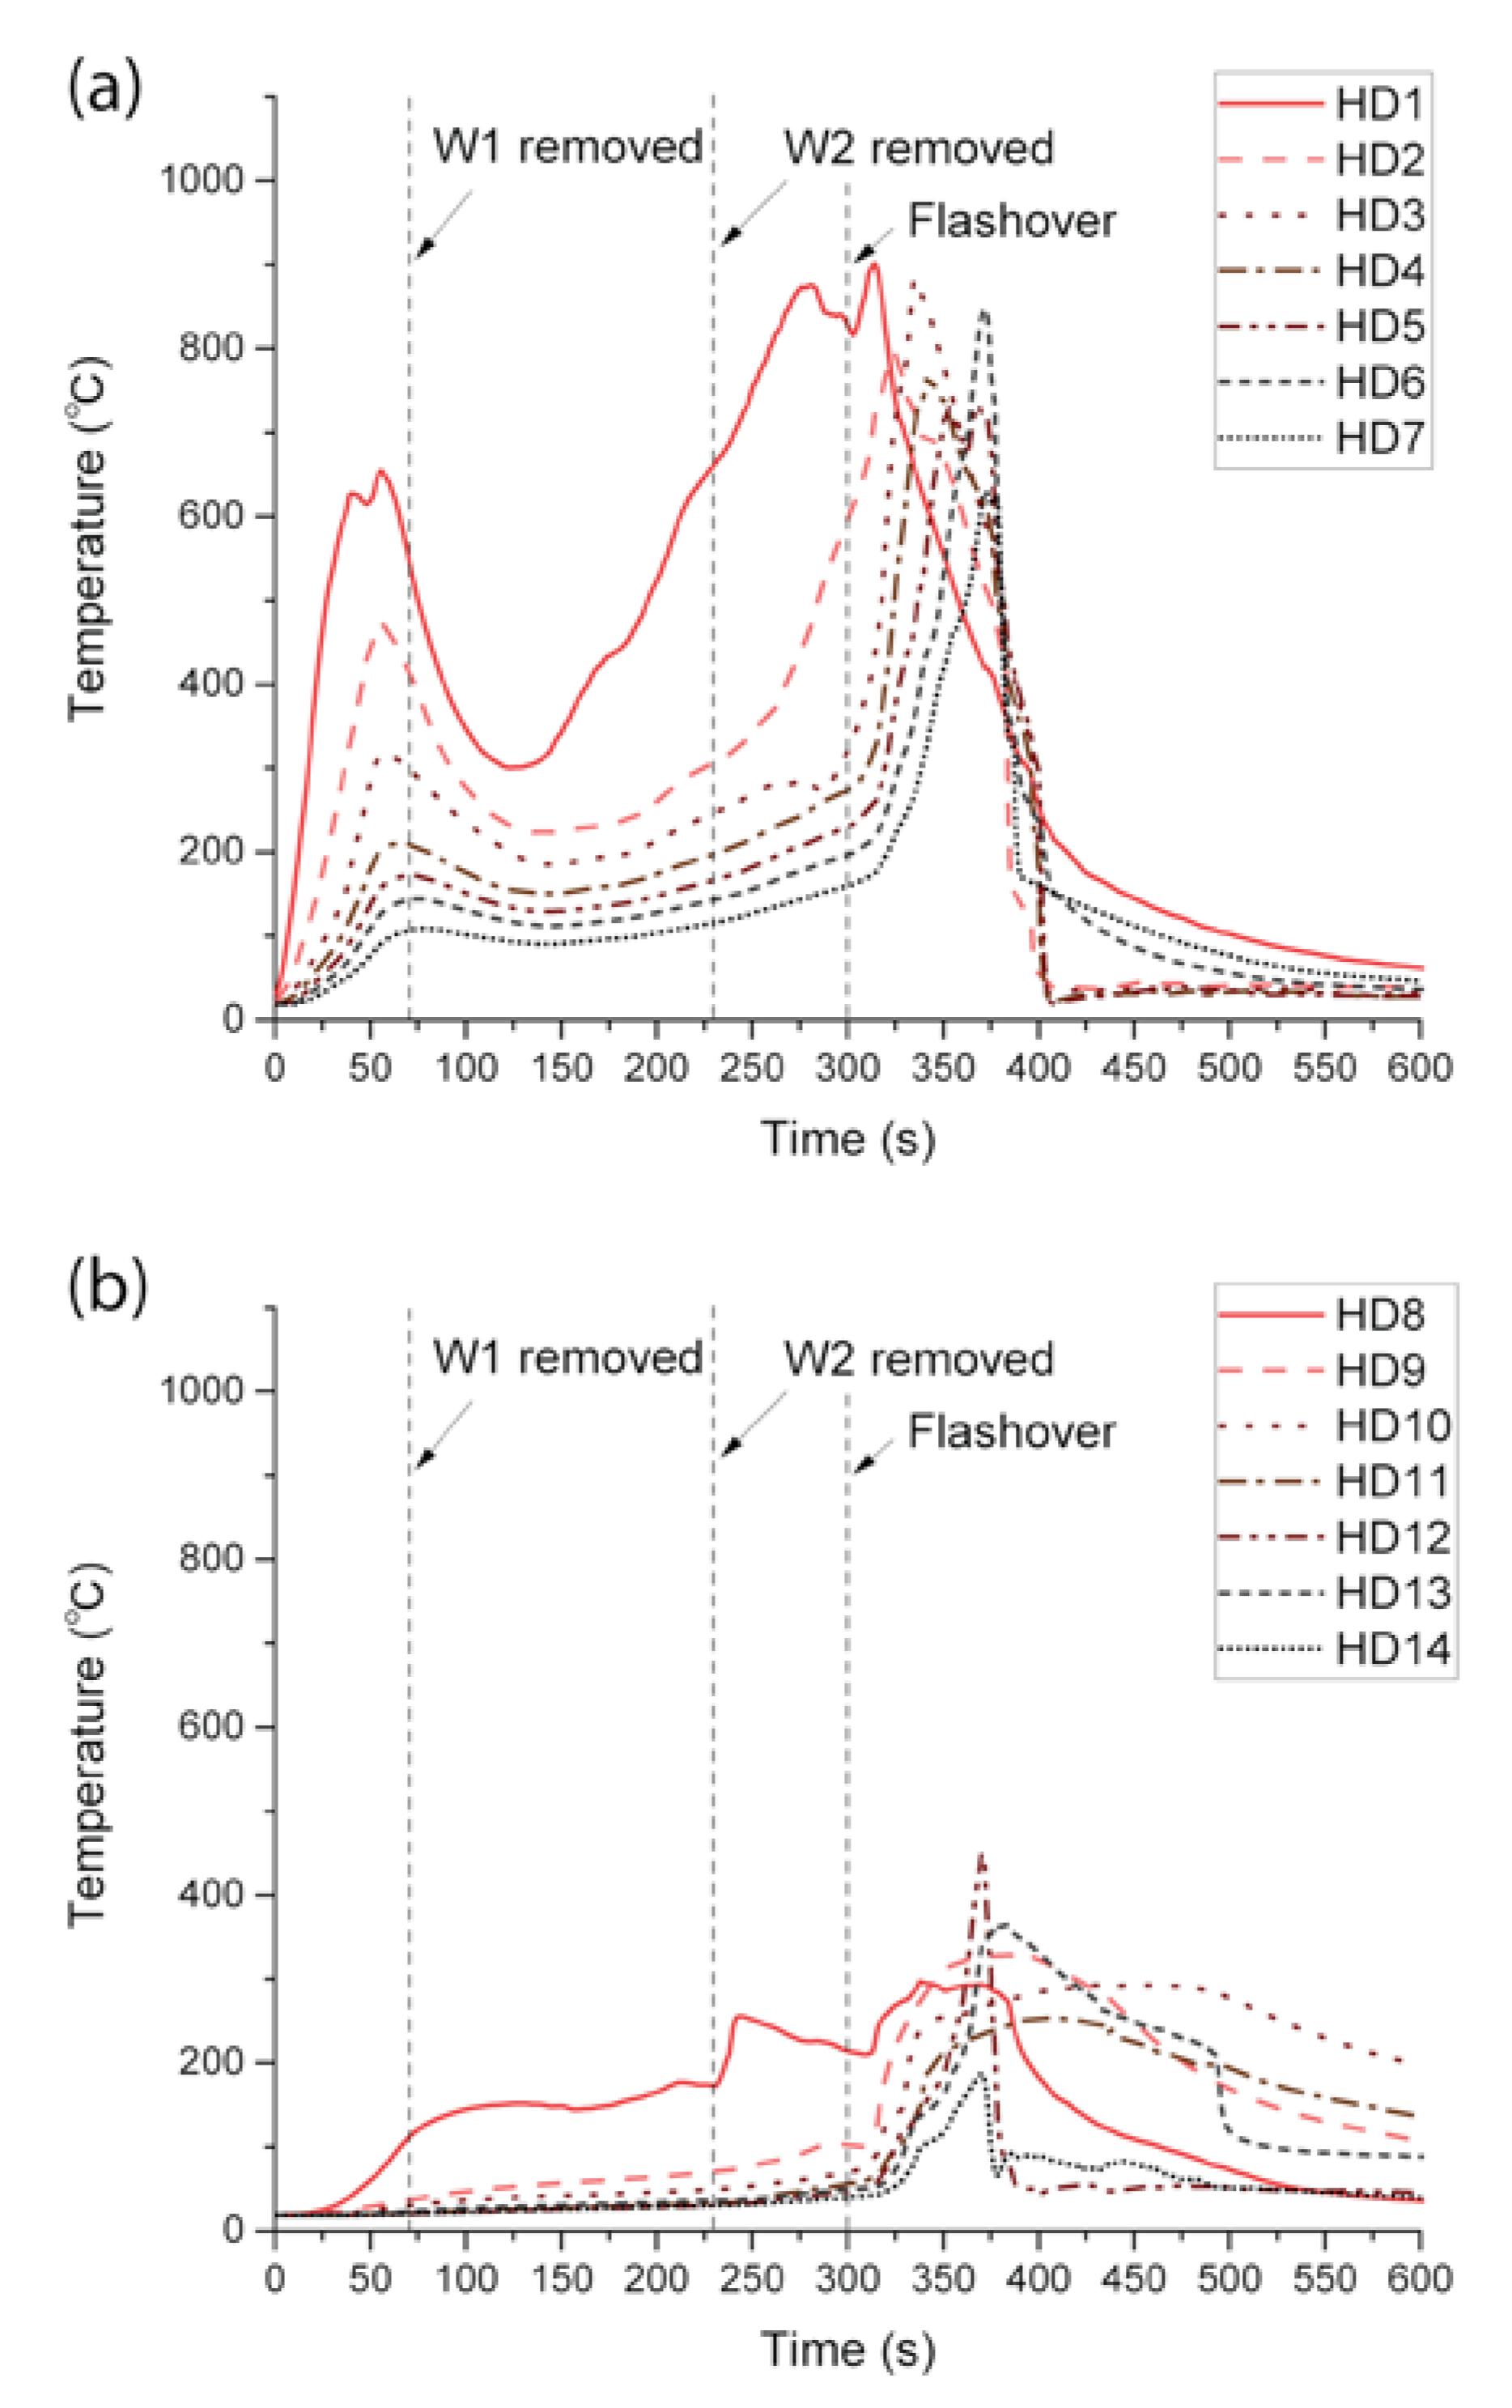
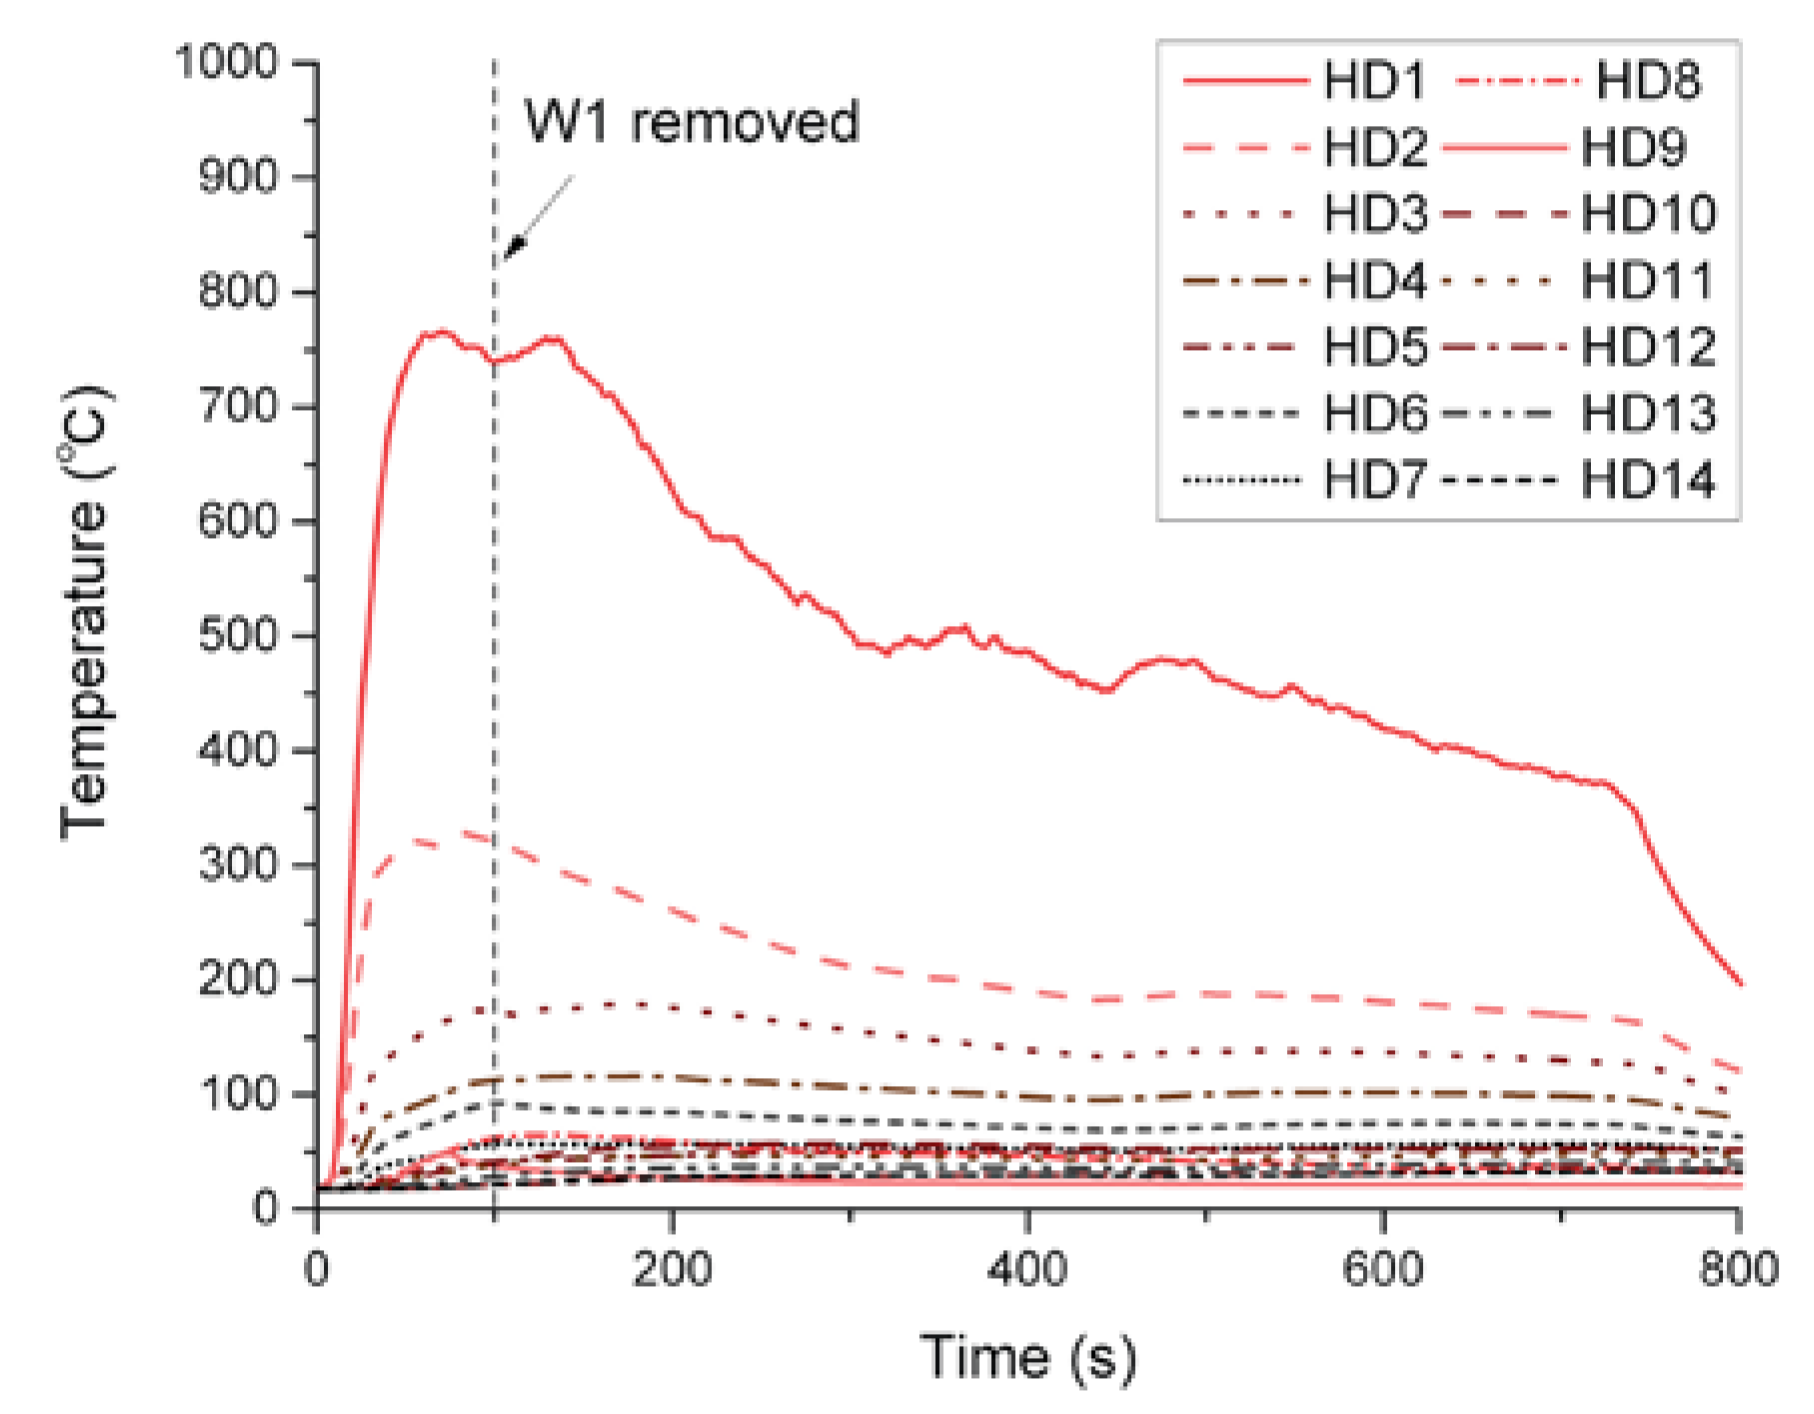
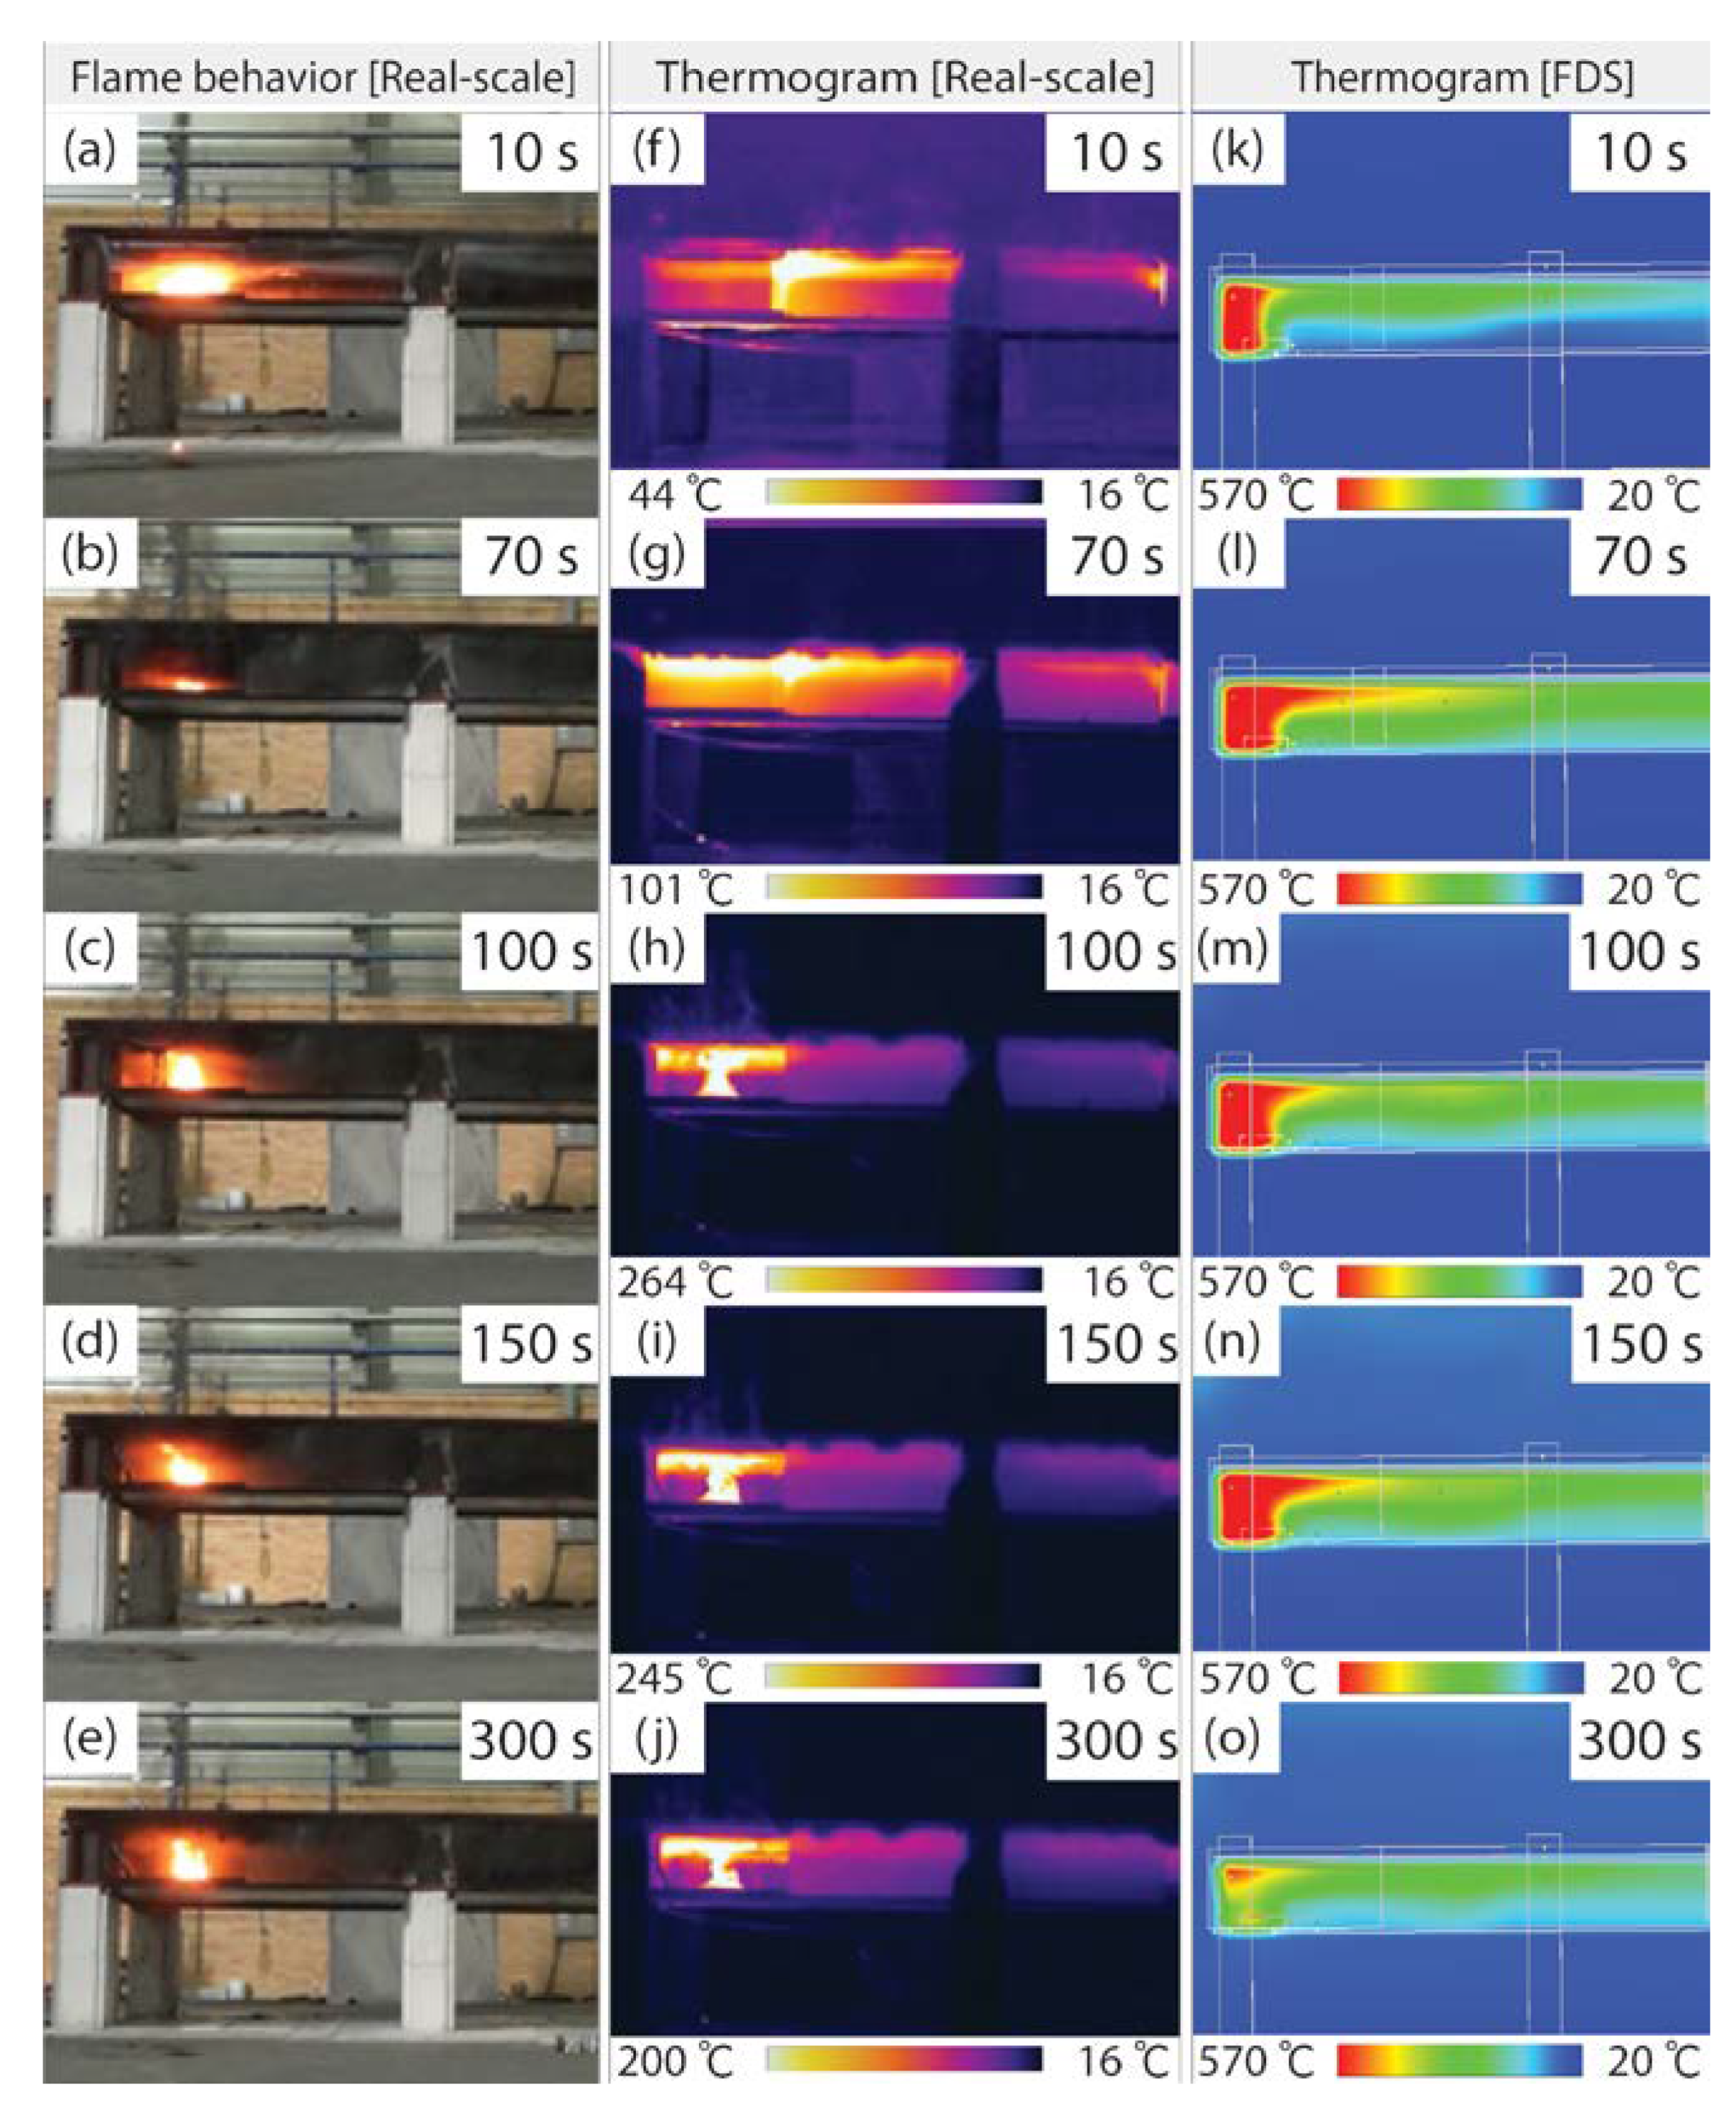
- In the real-scale fire test, the XPS + SMC structure showed a rise in temperature as the ignition sources increased due to the deposition of molten XPS. After the SMC was deformed, the combustible gases moved to the ceiling materials and caused fire spread. As a result, the ceiling materials collapsed and large volumes of outside air (oxygen) flowed in, resulting in a flashover phenomenon, in which the fire intensity and the degree of fire spread increased rapidly. However, in the EPSFs + DMC structure, the phenomenon of increasing ignition sources due to the deposition of melts did not occur. Therefore, the deformation of DMC did not occur, and the temperature decreased as the oxygen and fuel inside the specimen decreased.
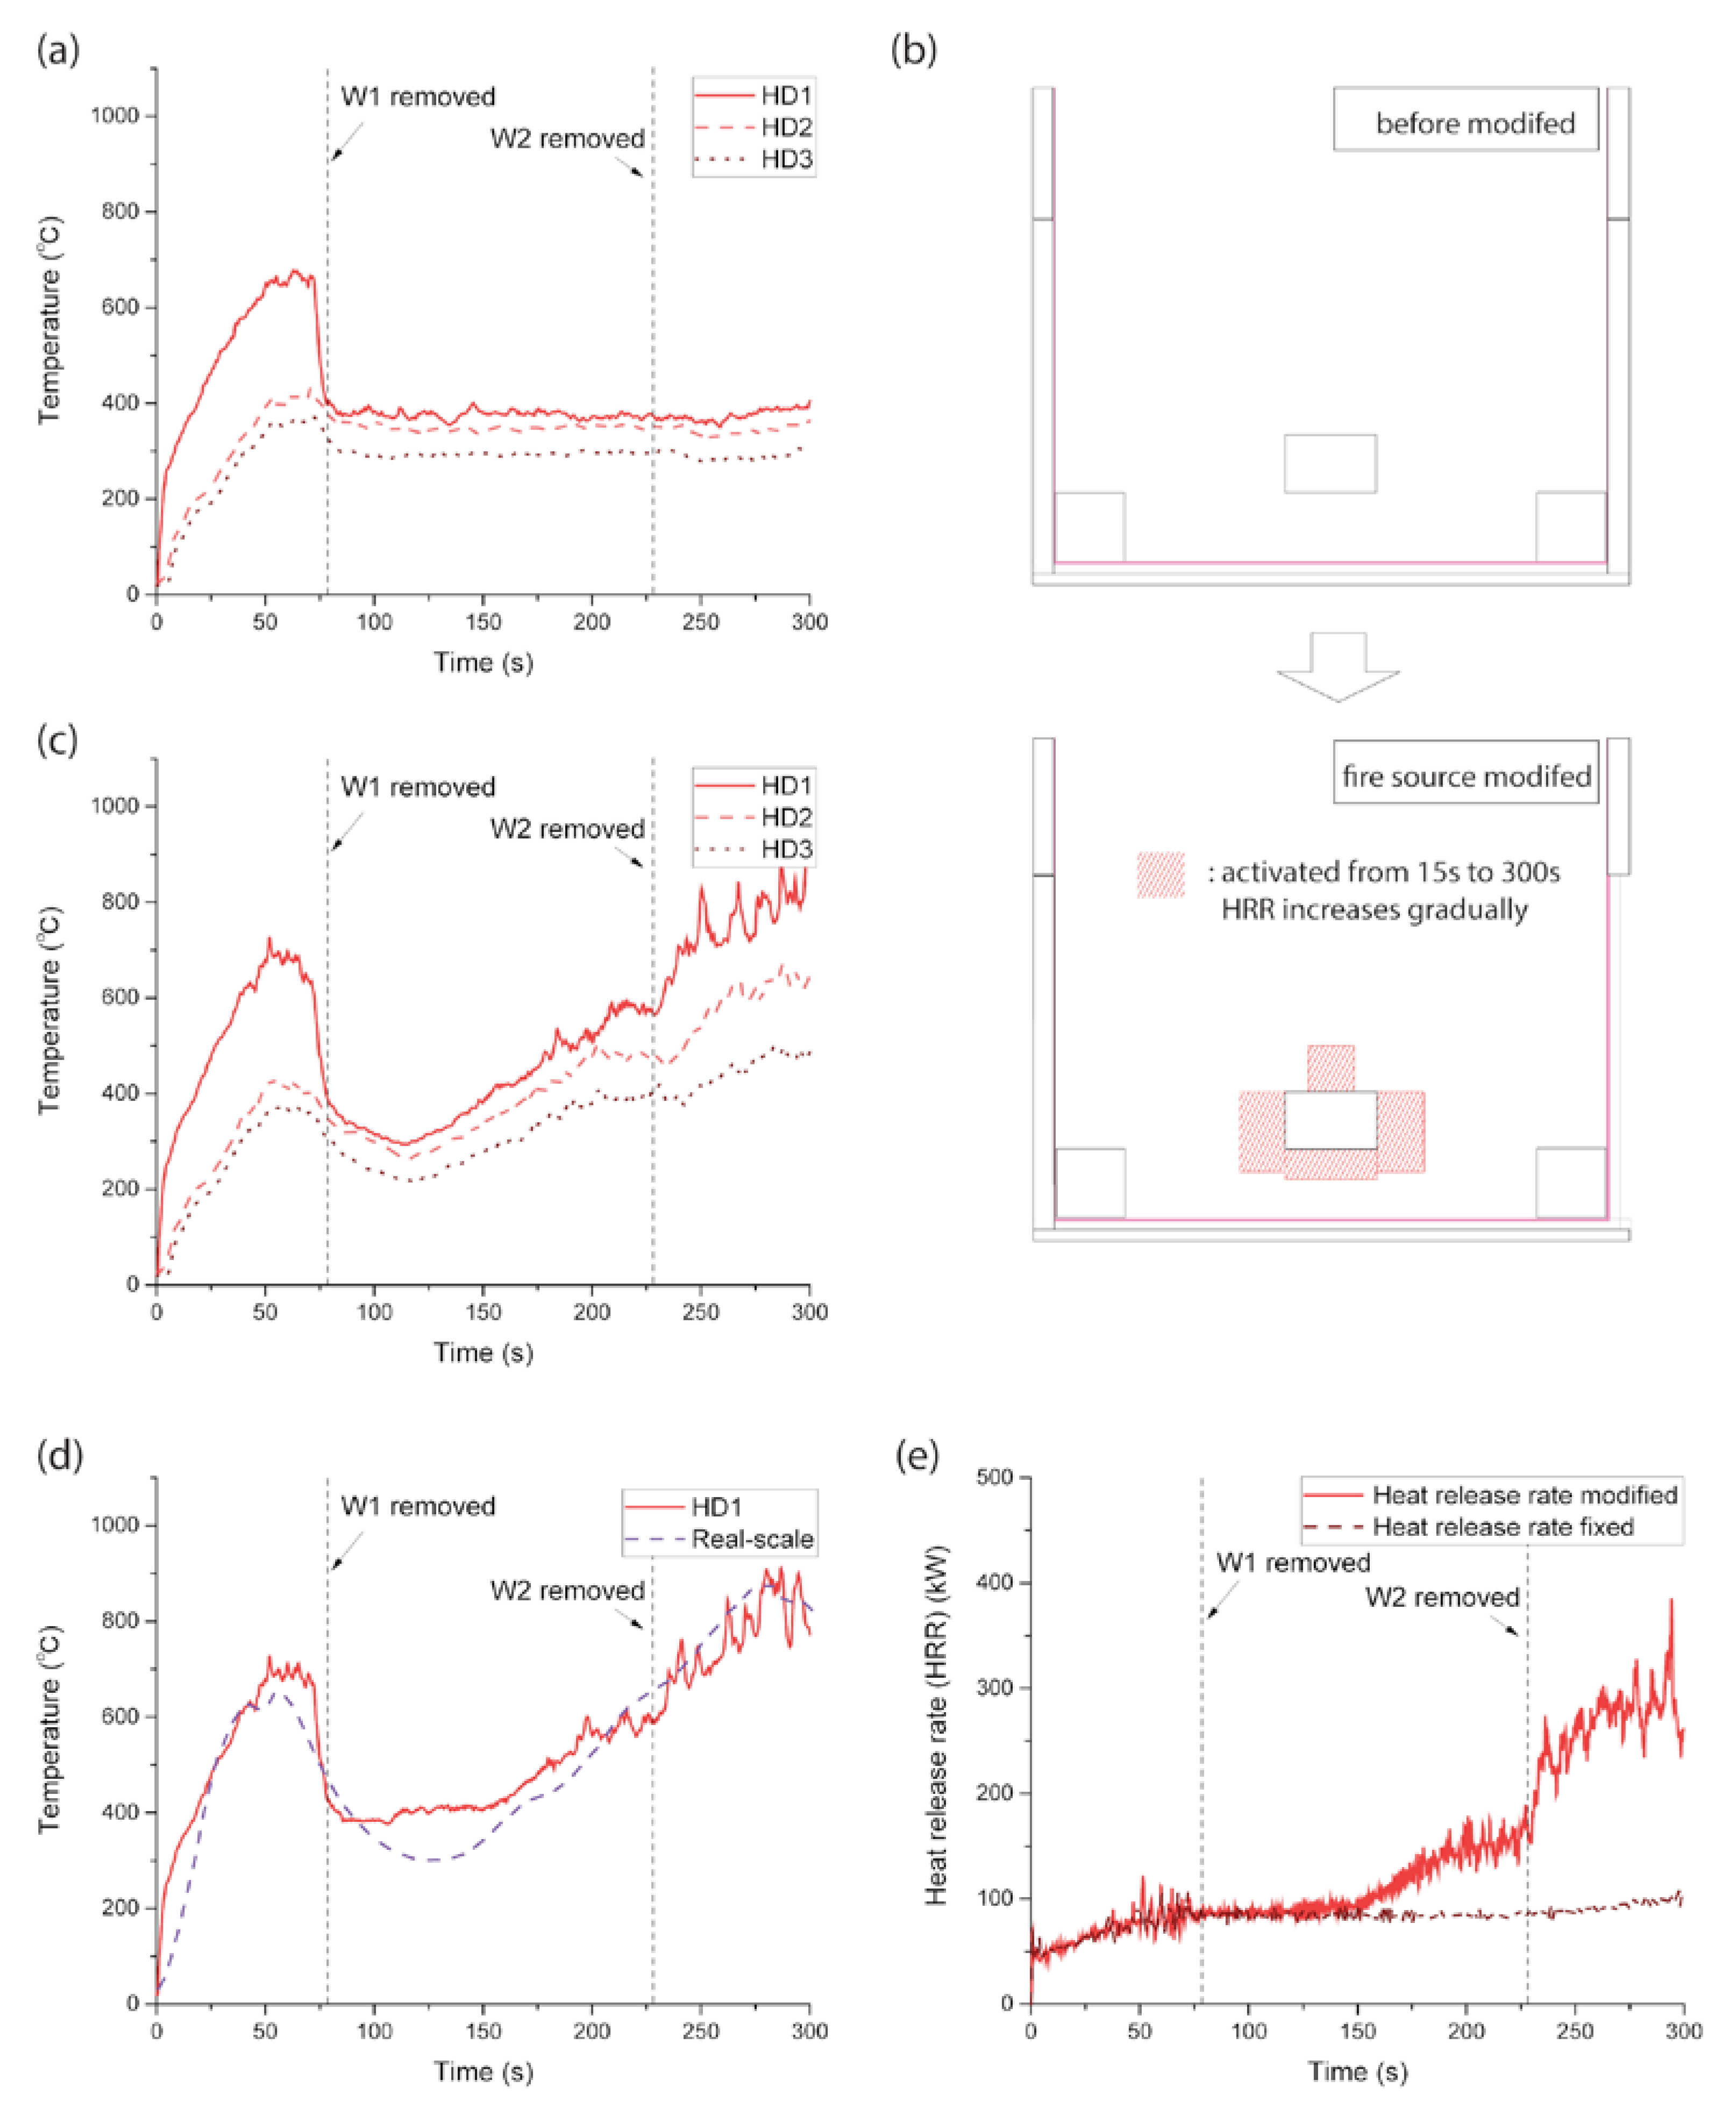
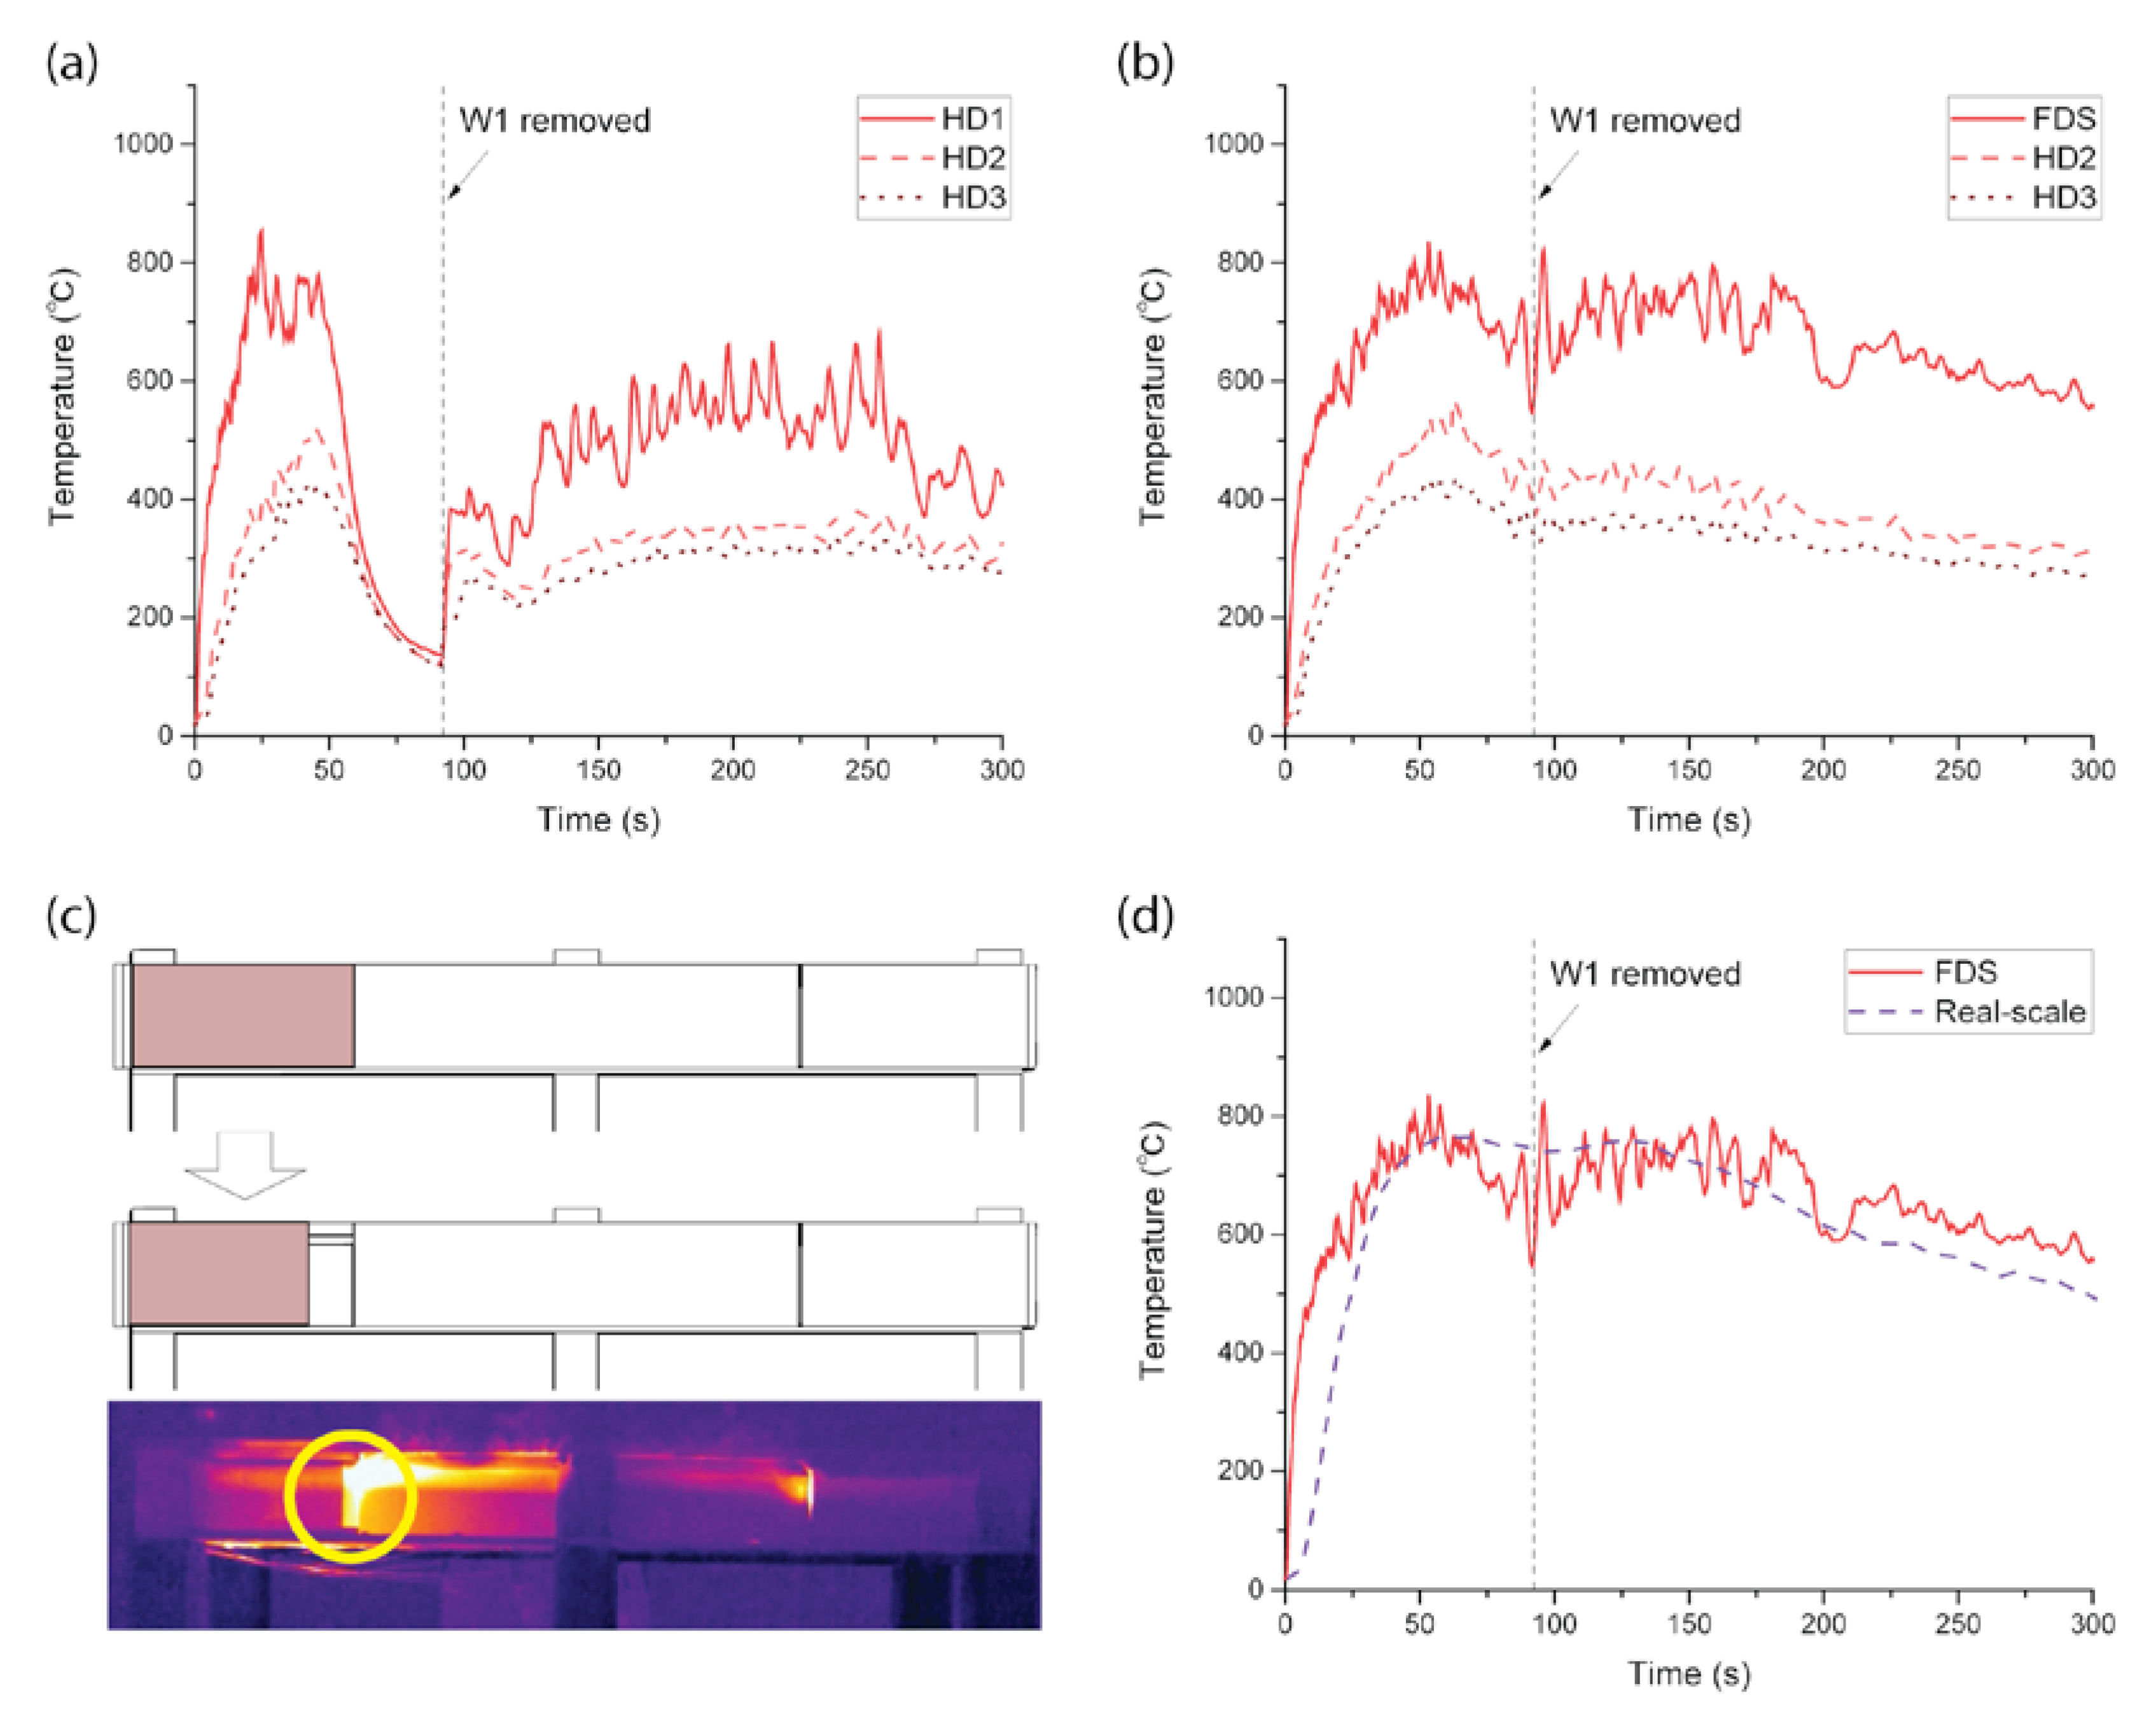
- When the FDS analysis was performed only with the data obtained using cone calorimetry and the information of the ignition source, it showed many differences with the results of the real-scale fire test. Change in temperature detected by the heat detector similar to that of the real-scale fire test could be obtained only when the expansion of ignition sources due to the deposition of molten XPS was artificially set and the phenomenon in which the fire strength was increased by outside air inflow due to deformation of the ceiling materials was additionally set.
- The limitation of the FDS tool is that it is difficult to accurately reproduce fire situations using it, even though it is the most widely used analysis tool for numerical simulations. It was found that a real-scale fire test is essential, not only for fires in ceilings but also for other fire situations, and additional parameters of the actual fire are needed to improve the accuracy of the FDS. Furthermore, to avoid fire damage in ceilings, which is the subject of this study, further research is necessary on the sprinkler type (vaporization type) in the ceiling and on the melting characteristics and properties of the thermal insulation materials.
Author Contributions
Funding
Acknowledgments
Conflicts of Interest
References
- Zhou, Y.; Bu, R.W.; Gong, J.H.; Yan, W.G.; Fan, C.G. Experimental investigation on downward flame spread over rigid polyurethane and extruded polystyrene foams. Exp. Therm. Fluid Sci. 2018, 92, 346–352. [Google Scholar] [CrossRef]
- An, W.G.; Sun, J.H.; Liew, K.M.; Zhu, G.Q. Effects of building concave structure on flame spread over extruded polystyrene thermal insulation material. Appl. Eng. 2017, 121, 802–809. [Google Scholar] [CrossRef]
- Xu, Q.; Jin, C.; Jiang, Y. Compare the flammability of two extruded polystyrene foams with micro-scale combustion calorimeter and cone calorimeter tests. J. Therm. Anal. Calorim. 2017, 127, 2359–2366. [Google Scholar] [CrossRef]
- An, W.G.; Yin, X.W.; Chen, S.; Zhang, G.W. Study on downward flame spread over extruded polystyrene foam in a vertical channel: Influence of opening area. Fire Mater. 2019, 43. [Google Scholar] [CrossRef]
- Choi, S.B.C. Don Mook A Study on Fire Risk of Apartment House with Pilotis Structure - Focused on the Fire case of Uijeongbu-si Urban Livig Homes. Korean Inst. Fire Sci. Eng. 2016, 30, 48–54. [Google Scholar] [CrossRef]
- Park, J.S. A Study on the Survey in Terms of Fire Safety of Urbanistic Housing. J. Korean Soc. Hazard Mitig. 2016, 16, 143–148. [Google Scholar] [CrossRef]
- Lee, J.I.; Ha, K.C. A Study for the Fire Analysis and Igniting Cause of Freezing Protection Heating Cables. J. Korean Soc. Saf. 2018, 33, 15–20. [Google Scholar]
- Park, J.G. An Experimental Study on Heat Accumulation Limit of Heating Lamp andIdentification Error of a Source of Ignition. J. Fire Investig. Soc. Korea 2018, 9, 81–97. [Google Scholar]
- Kim, H.J.; Park, J.Y.; Suh, H.W.; Cho, B.Y.; Park, W.J.; Bae, S.C. Mechanical Degradation and Thermal Decomposition of Ethylene-Vinyl Acetate (EVA) Polymer-Modified Cement Mortar (PCM) Exposed to High-Temperature. Sustainability 2019, 11, 500. [Google Scholar] [CrossRef]
- Guillaume, E.; Didieux, F.; Thiry, A.; Bellivier, A. Real-scale fire tests of one bedroom apartments with regard to tenability assessment. Fire Saf. J. 2014, 70, 81–97. [Google Scholar] [CrossRef]
- Fei, Y.; Zhou, J.J.; Zou, Y.H.; Li, P.D.; Lin, J.Z.; Chow, T.T. Preliminary real-scale experimental studies on cable fires in plenum. J. Fire Sci. 2003, 21, 465–484. [Google Scholar] [CrossRef]
- Capote, J.A.; Alvear, D.; Lazaro, M.; Espina, P. Heat release rate and computer fire modelling vs real-scale fire tests in passenger trains. Fire Mater. 2008, 32, 213–229. [Google Scholar] [CrossRef]
- Zhang, C.; Choe, L.; Gross, J.; Ramesh, S.; Bundy, M. Engineering Approach for Designing a Thermal Test of Real-Scale Steel Beam Exposed to Localized Fire. Fire Technol. 2017, 53, 1535–1554. [Google Scholar] [CrossRef]
- Melcher, T.; Zinke, R.; Trott, M.; Krause, U. Experimental investigations on the repeatability of real scale fire tests. Fire Saf. J. 2016, 82, 101–114. [Google Scholar] [CrossRef]
- Srivastava, G.; Ghoroi, C.; Gandhi, P.; Jagdish, V.; Karthikeyan, G.; Chakravarthy, A.; Nakrani, D. Development of a unique full-scale real-fire facade testing facility at IIT Gandhinagar. Curr. Sci. India 2018, 115, 1782–1787. [Google Scholar] [CrossRef]
- Tao, H.W.; Zhang, X.C.; Guo, Z.M.; Zeng, W.Y.; Huang, X.J.; Zheng, Z.H.; Xu, W.B. Combustion characteristics and heat release rate of vertical cable fire for sustainable energy system in an analogue underground compartment. Sustain. Cities Soc. 2019, 45, 406–412. [Google Scholar] [CrossRef]
- Xu, Q.F.; Wang, Y.; Chen, L.Z.; Gao, R.D.; Li, X.M. Comparative experimental study of fire-resistance ratings of timber assemblies with different fire protection measures. Adv. Struct. Eng. 2016, 19, 500–512. [Google Scholar] [CrossRef]
- Lacanette, D.; Mindeguia, J.C.; Brodard, A.; Ferrier, C.; Guibert, P.; Leblanc, J.C.; Malaurent, P.; Sirieix, C. Simulation of an experimental fire in an underground limestone quarry for the study of Paleolithic fires. Int. J. Therm. Sci. 2017, 120, 1–18. [Google Scholar] [CrossRef]
- Drean, V.; Schillinger, R.; Leborgne, H.; Auguin, G.; Guillaume, E. Numerical Simulation of Fire Exposed Fa double dagger ades Using LEPIR II Testing Facility. Fire Technol. 2018, 54, 943–966. [Google Scholar] [CrossRef]
- Sellami, I.; Manescau, B.; Chetehouna, K.; de Izarra, C.; Nait-Said, R.; Zidani, F. BLEVE fireball modeling using Fire Dynamics Simulator (FDS) in an Algerian gas industry. J. Loss Prev. Process Ind. 2018, 54, 69–84. [Google Scholar] [CrossRef]
- Yu, L.X.; Beji, T.; Maragkos, G.; Merci, B.; Liu, F.; Weng, M.C. Assessment of Numerical Simulation Capabilities of the Fire Dynamics Simulator (FDS 6) for Planar Air Curtain Flows. Fire Technol. 2018, 54, 583–612. [Google Scholar] [CrossRef]
- Kolaitis, D.I.; Founti, M.A. Development of a solid reaction kinetics gypsum dehydration model appropriate for CFD simulation of gypsum plasterboard wall assemblies exposed to fire. Fire Saf. J. 2013, 58, 151–159. [Google Scholar] [CrossRef]
- Qi, D.H.; Wang, L.Z.; Zmeureanu, R. An analytical model of heat and mass transfer through non-adiabatic high-rise shafts during fires. Int. J. Heat Mass Transf. 2014, 72, 585–594. [Google Scholar] [CrossRef]
- Thanasoulas, I.D.; Vardakoulias, I.K.; Gantes, C.J.; Kolaitis, D.I.; Founti, M.A. Thermal and Mechanical Computational Study of Load-Bearing Cold-Formed Steel Drywall Systems Exposed to Fire. Fire Technol. 2016, 52, 2071–2092. [Google Scholar] [CrossRef]
- Nilsson, M.; Husted, B.; Mossberg, A.; Anderson, J.; McNamee, R.J. A numerical comparison of protective measures against external fire spread. Fire Mater. 2018, 42, 493–507. [Google Scholar] [CrossRef]
- Hopkin, C.; Spearpoint, M.; Bittern, A. Using experimental sprinkler actuation times to assess the performance of Fire Dynamics Simulator. J. Fire Sci. 2018, 36, 342–361. [Google Scholar] [CrossRef]
- Aschaber, M.; Feist, C.; Hofstetter, G. Numerical simulation of the response of fire exposed concrete structure. Beton Stahlbetonbau 2007, 102, 578–587. [Google Scholar] [CrossRef]
- Feist, C.; Aschaber, M.; Hofstetter, G. Numerical simulation of the load-carrying behavior of RC tunnel structures exposed to fire. Finite Elem. Anal. Des. 2009, 45, 958–965. [Google Scholar] [CrossRef]
- Zhu, Z.M.; Xu, Y.J.; Liao, W.; Xu, S.M.; Wang, Y.Z. Highly Flame Retardant Expanded Polystyrene Foams from Phosphorus-Nitrogen-Silicon Synergistic Adhesives. Ind. Eng. Chem. Res. 2017, 56, 4649–4658. [Google Scholar] [CrossRef]
- Sayadi, A.A.; Tapia, J.V.; Neitzert, T.R.; Clifton, G.C. Effects of expanded polystyrene (EPS) particles on fire resistance, thermal conductivity and compressive strength of foamed concrete. Constr. Build. Mater. 2016, 112, 716–724. [Google Scholar] [CrossRef]
- Zhang, Y.; Sun, J.H.; Huang, X.J.; Chen, X.F. Heat transfer mechanisms in horizontal flame spread over wood and extruded polystyrene surfaces. Int. J. Heat Mass Transf. 2013, 61, 28–34. [Google Scholar] [CrossRef]
- An, W.G.; Xiao, H.H.; Liew, K.M.; Jiang, L.; Yan, W.G.; Zhou, Y.; Huang, X.J.; Sun, J.H.; Gao, L.J. Downward flame spread over extruded polystyrene. J. Therm. Anal. Calorim. 2015, 119, 1091–1103. [Google Scholar] [CrossRef]
- Jiang, L.; Xiao, H.H.; Zhou, Y.; An, W.G.; Yan, W.G.; He, J.J.; Sun, J.H. Theoretical and experimental study of width effects on horizontal flame spread over extruded and expanded polystyrene foam surfaces. J. Fire Sci. 2014, 32, 193–209. [Google Scholar] [CrossRef]
- Hapuarachchi, T.D.; Ren, G.; Fan, M.; Hogg, P.J.; Peijs, T. Fire retardancy of natural fibre reinforced sheet moulding compound. Appl. Compos. Mater. 2007, 14, 251–264. [Google Scholar] [CrossRef]
- Pourali, A.; Dhakal, R.P.; MacRae, G.; Tasligedik, A.S. Fully Floating Suspended Ceiling System: Experimental Evaluation of Structural Feasibility and Challenges. Earthq. Spectra 2017, 33, 1627–1654. [Google Scholar] [CrossRef]
- Long, X.F.; Zhang, X.Q.; Lou, B. Numerical simulation of dormitory building fire and personnel escape based on Pyrosim and Pathfinder. J. Chin. Inst. Eng. 2017, 40, 257–266. [Google Scholar] [CrossRef]
- Tingyong, F.; Jun, X.; Jufen, Y.; Bangben, W. Study of Building Fire Evacuation Based on Continuous Model of FDS & EVAC. In Proceedings of the 2011 International Conference on Computer Distributed Control and Intelligent Environmental Monitoring, Changsha, China, 19–20 February 2011; pp. 1331–1334. [Google Scholar]
- Glasa, J.; Valasek, L.; Weisenpacher, P.; Halada, L. Cinema Fire Modelling by FDS. J. Phys. Conf. Ser. 2013, 410, 012013. [Google Scholar] [CrossRef]
- Hongguo, X.; Na, L.; Hongfei, L.; Yihua, Z. Automotive Fire Simulation Based on Pyrosim. Green Intell. Transp. Syst. 2018, 419, 197–210. [Google Scholar]


| Mesh Boundary | Cell Number | Cell Size Ratio | Cell Size (m) | |
|---|---|---|---|---|
| X | −0.3–2.8 m | 21 | 1.02 | 0.1527 |
| Y | −0.2–6.3 m | 35 | 1.25 | 0.1875 |
| Z | 0.0–3.0 m | 20 | 1.00 | 0.1500 |
| XPS | EPSFs | SMC | DMC | |
|---|---|---|---|---|
| Total heat release (MJ/m2) | 24.07 | 16.60 | 22.57 | 0.40 |
| Peak heat release rate, (kW/m2) | 210.50 | 188.55 | 350.11 | 1.72 |
| Total oxygen consumed (g) | 15.40 | 10.53 | 14.80 | 0.17 |
| Density (kg/m3) | 24.9 | 17.7 | 1904.6 | 7708.2 |
| Mass loss (g/m2) | 12.40 | 8.13 | 1074.63 | 66.40 |
| Total smoke production (m2) | 6.07 | 7.80 | 7.17 | 0.20 |
© 2019 by the authors. Licensee MDPI, Basel, Switzerland. This article is an open access article distributed under the terms and conditions of the Creative Commons Attribution (CC BY) license (http://creativecommons.org/licenses/by/4.0/).
Share and Cite
Suh, H.-W.; Im, S.-M.; Park, T.-H.; Kim, H.-J.; Kim, H.-S.; Choi, H.-K.; Chung, J.-H.; Bae, S.-C. Fire Spread of Thermal Insulation Materials in the Ceiling of Piloti-Type Structure: Comparison of Numerical Simulation and Experimental Fire Tests Using Small- and Real-Scale Models. Sustainability 2019, 11, 3389. https://doi.org/10.3390/su11123389
Suh H-W, Im S-M, Park T-H, Kim H-J, Kim H-S, Choi H-K, Chung J-H, Bae S-C. Fire Spread of Thermal Insulation Materials in the Ceiling of Piloti-Type Structure: Comparison of Numerical Simulation and Experimental Fire Tests Using Small- and Real-Scale Models. Sustainability. 2019; 11(12):3389. https://doi.org/10.3390/su11123389
Chicago/Turabian StyleSuh, Heong-Won, Su-Min Im, Tae-Hoon Park, Hyung-Jun Kim, Hong-Sik Kim, Hyun-Ki Choi, Joo-Hong Chung, and Sung-Chul Bae. 2019. "Fire Spread of Thermal Insulation Materials in the Ceiling of Piloti-Type Structure: Comparison of Numerical Simulation and Experimental Fire Tests Using Small- and Real-Scale Models" Sustainability 11, no. 12: 3389. https://doi.org/10.3390/su11123389
APA StyleSuh, H.-W., Im, S.-M., Park, T.-H., Kim, H.-J., Kim, H.-S., Choi, H.-K., Chung, J.-H., & Bae, S.-C. (2019). Fire Spread of Thermal Insulation Materials in the Ceiling of Piloti-Type Structure: Comparison of Numerical Simulation and Experimental Fire Tests Using Small- and Real-Scale Models. Sustainability, 11(12), 3389. https://doi.org/10.3390/su11123389