Article

Degradation Characteristics of Soil-Quality-Related Physical and Chemical Properties Affected by Collapsing Gully: The Case of Subtropical Hilly Region, China

Key Laboratory of Arable Land Conservation (Middle and Lower Reaches of Yangtze River), Ministry of Agriculture and Rural Affairs, College of Resources and Environment, Huazhong Agricultural University, Wuhan 430070, China
*
Author to whom correspondence should be addressed.
Sustainability 2019, 11(12), 3369; https://doi.org/10.3390/su11123369
Submission received: 19 April 2019 / Revised: 6 June 2019 / Accepted: 14 June 2019 / Published: 18 June 2019
(This article belongs to the Special Issue Soil Erosion and the Sustainable Management of the Landscape)

Abstract

:
In the subtropical hilly areas of China, a collapsing gully, a particular type of permanent gully, poses a great threat to the productivity and sustainability of the local ecological and agricultural systems. However, few studies have been performed regarding the effects of collapsing gully erosion on soil degradation. The aim of this study was to evaluate the effects of collapsing gully erosion on soil-quality-related physical and chemical properties. The collapsing gullies that were severely affected by erosion processes were considered at three stages (initial, active and stable stages) and corresponding soil samples were collected to analyze the spatial variation of the soil physical and chemical quality at each stage. The changes in the properties were assumed to be considerable in the regions affected by the erosion process compared with those unaffected by this process. Soil physical properties were more susceptible than soil nutrients to collapsing gully erosion in different spatial locations. The soil quality index (SQI) system consists of total nitrogen (TN), total phosphorus (TP), pH, capillary porosity (CP), sand content (SA), soil cohesion (SC) and root density (RD). Collapsing gully erosion was found to affect the soil physical and chemical properties by progressively reducing the SQI. The mean SQI value was the lowest in the active stage of the collapsing gully, with a higher soil degradation. For the different spatial positions in the collapsing gullies, the scour channel showed the lowest SQI value. The limiting indicators varied in the different stages or spatial sites in the collapsing gullies.

1. Introduction

Soil erosion is considered as a main contributor to land degradation around the world due to its impact on the ability of soils to perform a range of functions [1]. The erosion processes can be categorized as interrill erosion (or sheet flow erosion), rill erosion, and gully erosion [2]. As a widespread phenomenon, gully erosion has become a serious land management issue in many regions of the world [3,4,5]. Because of the warm and humid climatic conditions in southern China, these regions are usually rainy and hot, which is beneficial to promote the weathering of bedrock and soil erosion. Collapsing gullies, a particular type of permanent gullies is widely distributed in the subtropical hilly areas of China. The main factors affecting the development of the collapsing gully include the joint structure of granite, abundant rainfall, low hilly terrain, deforestation and steeping slope planting (generally more than 26.8%) [6,7]. These gullies usually consist of an upper catchment, collapsing wall, colluvial deposit, scour channel and alluvial fan, with the characteristics of rapid development and an annual average erosion of more than 50 kt km−2 yr−1, which is beyond 50 times the erosion on slopes covered with high vegetation [6,8,9,10,11]. From 1950 to 2005, collapsing gully erosion affected 1220 km2 of land in southeast China, leading to the loss of more than 60 Mt of soil; this, in turn, caused the loss of 360,000 ha of farmland, 521,000 houses, 36,000 km of road, 10,000 bridges, 9000 reservoirs, and 73,000 ponds, as well as 3.28 billion USD in economic losses that affected 9.17 million residents [12]. The erosion from collapsing gullies accelerates land degradation and environment deterioration in the corresponding regions [13,14].
In recent years, several studies have investigated the collapsing gully erosion in terms of dominant factors, formation mechanism, erosion processes and governance of collapsing gullies [9,13,15,16]. Some researchers compared the effects of rainfall intensity and slope on colluvial deposition erosion under different experimental conditions, and discussed dominant factors and the processes of collapsing gully erosion [9,15]. Due to low cohesion, weak structure and high erodibility, the characteristics of colluvial deposits obviously vary from undisturbed soils in the collapsing walls. A number of researchers have examined the size selectivity of eroded sediment and the erosion processes by analyzing colluvial deposits at different slope gradients and rainfall intensities [9,10,11,17]. The findings of these studies can be used to illustrate the erosion processes and mechanisms of the transportation of disturbed soils with a high coarse particle content. For a better understanding of the high-steep slope of a collapsing wall and the mechanism of collapsing erosion, the engineering characteristics and preferential flows have also been investigated for the profile of the collapsing wall. Some researchers analyzed the spatial variations of shear strength and hydraulic properties in collapsing gullies and evaluated their effects on the collapsing erosion mechanism [14,18,19,20]. Additionally, researchers have also investigated the variations of chemical composition and physical properties with soil depth in the collapsing gullies and found that the contents of gravel and sand increase while the amount of sesquioxides decreases with an increase of soil depth [21,22]. Furthermore, Deng et al. [23] studied the bulk density, soil porosity, soil particles, water-holding capacity and erodibility of the collapsing alluvial fan as well as their relationships.
For the soil degradation by gully erosion, most previous studies were focused on the degradation characteristics by ephemeral gully erosion in terms of its in-situ effects on soil physical and chemical properties, key soil quality factors and soil quality degradation process [24,25,26,27]. Ephemeral gully erosion has been reported to interfere with agricultural operations by reducing soil productivity [4]. In Sicily of Italy, some researchers investigated the effects of the ephemeral gully erosion and the subsequent removal process on the degradation of soil quality by infilling the ephemeral gullies [26,28]. Qin et al. [29] have indicated that ephemeral gully erosion could affect over 70% of the inter gully areas, leading to 35–85% of total soil loss in the Loess Plateau of northwestern China. In the black soil region of northeast China, research also showed that infilling activities cause the decrease of soil depth in areas adjacent to ephemeral gullies, with the decrease of every 1 cm resulting in a 2% decrease in crop yield [25,30].
While some studies have shown that soil quality degradation in agricultural environments can be mainly assessed through soil physical and chemical properties [31,32,33], it is also maintained that soil quality cannot be evaluated just by individual soil indicators [34]. For a better estimation of soil quality, a soil quality index (SQI) was developed and has been used extensively by combining soil physical and chemical properties into an overall index [35]. SQI can be used as a flexible model to assess soil quality and explains the status of soil degradation in a specific area [36,37]. Studies on SQI reported that it can be as a tool to evaluate crop productivity and used to quantify the effect of land use conversion on soil quality and degradation in native rangelands of upland arid and semiarid regions [38,39]. At present, many soil physical indicators, including bulk density, porosity and texture, and chemical indicators, including pH, cation exchange capacity, total nitrogen, available nitrogen, total phosphorus, available phosphorus, available potassium and soil organic matter, have been used to assess soil quality and observe the soil degradation process in ephemeral gully erosion regions [25,26,27].
Recent literature about other region soil quality provided references for developing a standard technique for soil quality assessment [40,41]. However, there have been rare reports about the impacts of collapsing gully erosion on the soil quality index and its spatial variation in the subtropical hilly region of China. This study could facilitate the understanding of the impacts of collapsing gully erosion on soil degradation and provide new insights on restoration management programs in this area. The objectives of this study were to (i) examine the in-situ effect of collapsing gully erosion on soil physical and chemical properties, (ii) develop a soil quality index based on a minimum data set (MDS) for estimating the impact of collapsing gully erosion on soil quality, and (iii) identify the key indicators influencing the soil quality in different collapsing gullies.

2. Materials and Methods

2.1. Study Area and Description of Collapsing Gullies

The investigation site is located in the Jingouxing watershed (from 26°10′31″ N to 26°12′33″ N and 115°9′3″ E to 115°11′ 39″ E) in the north of Gan County, Jiangxi Province, China (Figure 1), with a warm subtropical humid climate, an annual average rainfall of 1394 mm and an annual average temperature of 19.3 °C. This watershed has an area of 10.38 km2 and belongs to hilly region in Southern China. Soil parent material is derived from granite, which is easy to be weathered and the weathered layer is thick (15–20 m). In this area, there are 4138 collapsing gullies, mostly hilly with round tops, poor vegetation and serious soil erosion [18]. The ecological forest and vegetation species are dominated by single species of Pinus massoniana and Dicranopteris linearis in the absence of understory vegetation. The area of soil erosion in the county is 98,000 hm2, accounting for 33% of the county’s land area. It is a typical area that suffers from severe erosion of collapsing gullies and numerous studies have been done on this area [14,18,21], thus it was selected as the study site.
According to field investigation, three typical collapsing gullies were selected depending on the degree of erosion. In-situ slopes without erosion were used for comparison of soil properties among the collapsing gullies. The basic characteristics of the in-situ slopes without erosion and collapsing gullies are shown in Table 1.

2.2. Soil Sampling and Laboratory Measurement

In every collapsing gully, five spatial locations were divided from top to bottom: upper catchment, upper slope, middle slope, lower slope, and scour channel (Figure 2). Soil samples were collected along the slope or scour channel in the winter of 2017, and the topography of the studied permanent gullies was measured using Unistrong G970 GNSS RTK (with planimetric and altimetric precisions of 2.5 and 20 mm, respectively) at the same time, when the collapsing gullies were clearly observable and measurable after the rainfall events of summer and autumn. For soil property measurement, 8 to 10 soil samples were collected from each spatial location and a total of 150 soil samples were obtained (i.e., five spatial locations × four collapsing gullies and non-erosion slopes). Approximately 1–2 kg of soil was collected from each soil sampling site. In addition, three steel rings with a volume of 100 cm3 (5.02 cm diameter and 5.05 cm height) were used to measure the soil bulk density (BD), capillary porosity (CP) and total porosity (OP) and six steel rings with a volume of 60 cm3 (6.18 cm diameter and 2.00 cm height) were used to measure the soil cohesion (SC). After sealing, the soil samples were transferred to the laboratory which was well air-dried, and followed by crushing and sieving. Root density and 17 soil physical and chemical indicators were used to evaluate soil degradation and soil quality.
All soil samples were measured and analyzed in the summer and autumn of 2018. According to the United States Department of Agriculture classification of soil particle size, soil particle size was described in terms of the percentages of gravel (2–5 mm), sand (0.05–2 mm), silt (0.002–0.05 mm) and clay (<0.002 mm). The different fractions were determined using the pipette method after the removal of organic matter using hydrogen peroxide (6% and 0.2 mL) and heat treatment with sodium hexametaphosphate (120 °C for 1 h) as the dispersing agent [42]. Disc infiltration experiments were performed four times at pressure heads of −9, −6, −3, and 0 cm. The non-linear regression method [43] was used to calculate hydraulic conductivity (HC) based on the theoretical analysis of the 3D quasi-steady-state water flux under the infiltrometer [44]. The quadruple direct shear apparatus was used to test the saturated soil cohesion strength (LH-DDS-4, Nanjing TKA Technology Co., Ltd., Shanghai, China). All shear tests were conducted under four normal stresses (σ = 50, 100, 150 and 200 kPa) in triplicate for each pressure, and the shearing rate was set at 0.8 mm/min. Failure was taken as the maximum shear stress attained, or in the absence of a peak condition, and the shear test was usually stopped at a horizontal displacement of about 6 mm (ASTM D3080, 2004) [45,46]. Finally, the soil cohesion (SC) was calculated according to the Mohr–Coulomb shear strength criterion equation:
τ = SC + Ptanφ,
where τ (kPa) is the shear strength, SC (kPa) is the soil cohesion, P (kPa) is the normal stress acting on the failure surface and φ (°) is the angle of internal friction.
A pH-meter model was used to measure the soil pH in a 1:2.5 soil-to-water ratio. The K2Cr2O7 wet oxidation method was used to determine the soil organic matter (OM), and the value of soil organic matter was 1.724 times that of soil organic carbon. The soil samples were repeatedly treated with 1 mol/L CH3COONH4 (pH 7.0) to make an NH4+ saturated soil, and excess CH3COONH4 was washed away with 95% C2H6O. Then, distillation was carried out by rapid Kjeldahl distiller, and distilled NH3 was absorbed by H3BO3. Finally, titration was performed by standard acid, and the amount of soil cation exchange was calculated [47]. A colorimetric method was used for determination of the contents of total nitrogen (TN), available nitrogen (AN) and total phosphorus (TP) in soil extracts based on a Flow Injection Analysis System (FIAS 400 PerkinElmer, Inc, CT, USA) equipped with an AS90 Autosampler (PerkinElmer). The Olsen’s method was used for colorimetric determination of the content of available phosphorus (AP) in 0.5 mol NaHCO3 (pH 8.5) [48]. The content of available potassium (AK) was determined by using flame atomic absorption spectrophotometry [49]. Root density (kg m−3) was measured by hand-washing the soil monolith (5 cm in depth, width and length) and drying for 24 h at 60 °C [50].

2.3. Assessment of Soil Quality Index (SQI)

The SQI was determined by using a statistical model approach to define a MDS mainly based on principal component analysis (PCA) as described below [37,41,51]. The SQI was calculated in three steps: (i) selecting the MDS; (ii) scoring the MDS indicators; (iii) calculating the SQI value by integration of the indicator score. Within each principal component (PC), factor loadings within 10% of absolute-value variation in the highest factor are considered highly weighed [52]. In the case of more than one indicator in one PC, other indicators should be removed by the Pearson’s correlation analysis to maintain only the highest weighted indicator [38]. After selection of the MDS indicators, each soil indicator was transformed into numerical values from 0 to 1 using nonlinear scoring function [53]. The sigmoidal function was described by Equation (2):
S = a / [ 1 + ( x / x 0 ) b ,
where S indicates the score of soil indicator; a, the maximum score (a = 1); x, the value of the indicator; x0, mean value of each soil indicator; b, the equation’s slope value. The slope values (b) (−2.5 and 2.5) were used to plot a ‘more is better’ or ‘less is better’ curve, respectively [54]. After numerical score conversion, the soil indicators were integrated into SQI by using Equation (3):
SQI = i = 1 n S i · K i ,
where n indicates the parameter number; Si, the membership value calculated from the Equation (1); Ki, the weighting factor derived from the PCA outcome. In the case of no correlated indicators within a PC, weighting factors are equal to the total variance percentage explained by the PC standardized to unity [53].

2.4. Statistical Analysis

The SPSS 21.0 software was used for all statistical analyses, and the Origin Pro 8.0 software was used for data processing and plotting. The Kolmogorov–Smirnov (KS) test was conducted to determine the normality distribution of the data. If the significance value of the KS test was >0.05, then the distribution of the data was considered not significantly different from normal. The differences in soil indicators and SQI in the three different development stages of collapsing gullies or spatial locations were determined at p < 0.05 by using one-way analysis of variance (ANOVA) and least-significant difference (LSD). Pearson correlation analysis was performed for PCA and correlation matrices among soil indicators. The overall SQI and MDS-scored soil quality indicators were further analyzed by ANOVA to reveal the effect of the collapsing gully erosion on soil quality.

3. Results

3.1. Soil Physical and Chemical Indicators under Different Collapsing Gullies and Non-Erosion Slopes

Table 2 shows the overall statistical data for the 9 soil physical properties. A close comparison with the non-erosion slope in this region revealed lower BD (1.33, 1.23, and 1.32 kg m−3 at IG (initial stage), AG (active stage), and SG (stable stage), respectively) and higher CP (44.57, 42.96, and 42.89% at IG, AG and SG) in the collapsing gullies, and the capillary porosity and bulk density showed an opposite trend. However, there was no significant difference between the collapsing gullies and non-erosion slope area in BD, CP, gravel content (GR) and hydraulic conductivity (HC). Soil texture analysis indicated that soils in this region had the greatest silt content (51.56–57.26%, lower clay content (16.38–29.29%) and sand content (16.68–29.26%). Clay content was significantly lower in AG (20.58%) than in the non-erosion slope. The gravel content of non-erosion slopes (20.00%) was lower than that of collapsing gullies, and gravel content was highest in AG (27.78%), followed by IG (23.19%) and SG (22.02%). Soil cohesion was significantly higher in the non-erosion slopes than in the collapsing gullies at active and stable stages (p < 0.05), with no significant difference observed in the collapsing gullies at the initial stage. Soil hydraulic conductivity (HC) showed a slight change between the collapsing gullies (0.15 and 0.16 cm min−1) and non-erosion slope area (0.14 cm min−1).
Soil nutrient loss and erosion degree or erosion stage were correlated with each other (R2 > 0.5, p < 0.05). A greater soil loss led to a greater loss in the nutrient pool. TN and TP as well as AN, available phosphorus (AP) and AK tended to be significantly lower in the three collapsing gullies than in the non-erosion slope (p < 0.05) (Table 3). TN also showed a significant difference among the three collapsing gullies. OM content showed no significant differences between the non-slope erosion (13.64 g kg−1) and the collapsing gullies at the initial stage (10.61 g kg−1), but with a significant increase when compared with the active stages (6.80 g kg−1) of the collapsing gullies. The loss of nutrients and organic matter mainly occurred during the active stage of the collapsing gully. The cation exchange capacity (CEC) showed the same trend as soil organic matter between the non-erosion slope and the collapsing gullies (Table 3). There was no obvious change in soil pH in this study area between the collapsing gullies and non-erosion slope.

3.2. Soil Physical and Chemical Indicators at Different Spatial Locations of Collapsing Gullies

Compared with soil in the upper catchment and slope areas in the collapsing gullies, the soil was loose in the scour channel, with a lower bulk density and soil cohesion, but higher porosity. Specifically, the total porosity was 12.42%, 12.00%, 2.34% and 4.97% higher in the scour-channel than in the upper catchment and three slope positions (upper, middle and lower), respectively (Table 4). The porosity of the scour-channel greatly affects the hydraulic conductivity (HC), leading to a similar distribution of hydraulic conductivity. The soil texture was higher in silt (53.09%−56.14%) and sand (20.38%–26.50%). The clay content was significantly lower in the scour channel than in the upper catchment and slope areas, and showed a gradual increase from upper catchment to lower slope. However, the gravel content exhibited a significant decreasing trend from upper catchment (37.51%) to scour channel (6.37%).
Soil chemical properties in the five positions are presented in Table 5. The spatial distribution of soil nutrients (TN, TP, AN, and AP), pH, and CEC presented no obvious regular changes in the five positions. However, available potassium and soil organic matter showed an obvious increase from upper catchment (45.54 mg kg−1 and 7.65 g kg−1) to lower slope (54.44 mg kg−1 and 9.77 g kg−1), with the lowest values observed in the scour channel relative to the slope areas, due to the reason that soil layers were covered by vegetation and the root exudate could indirectly increase the soil organic matter content [22]. The values of root density (RD) was highest in the lower slope and lowest in the scour channel (Figure 3).

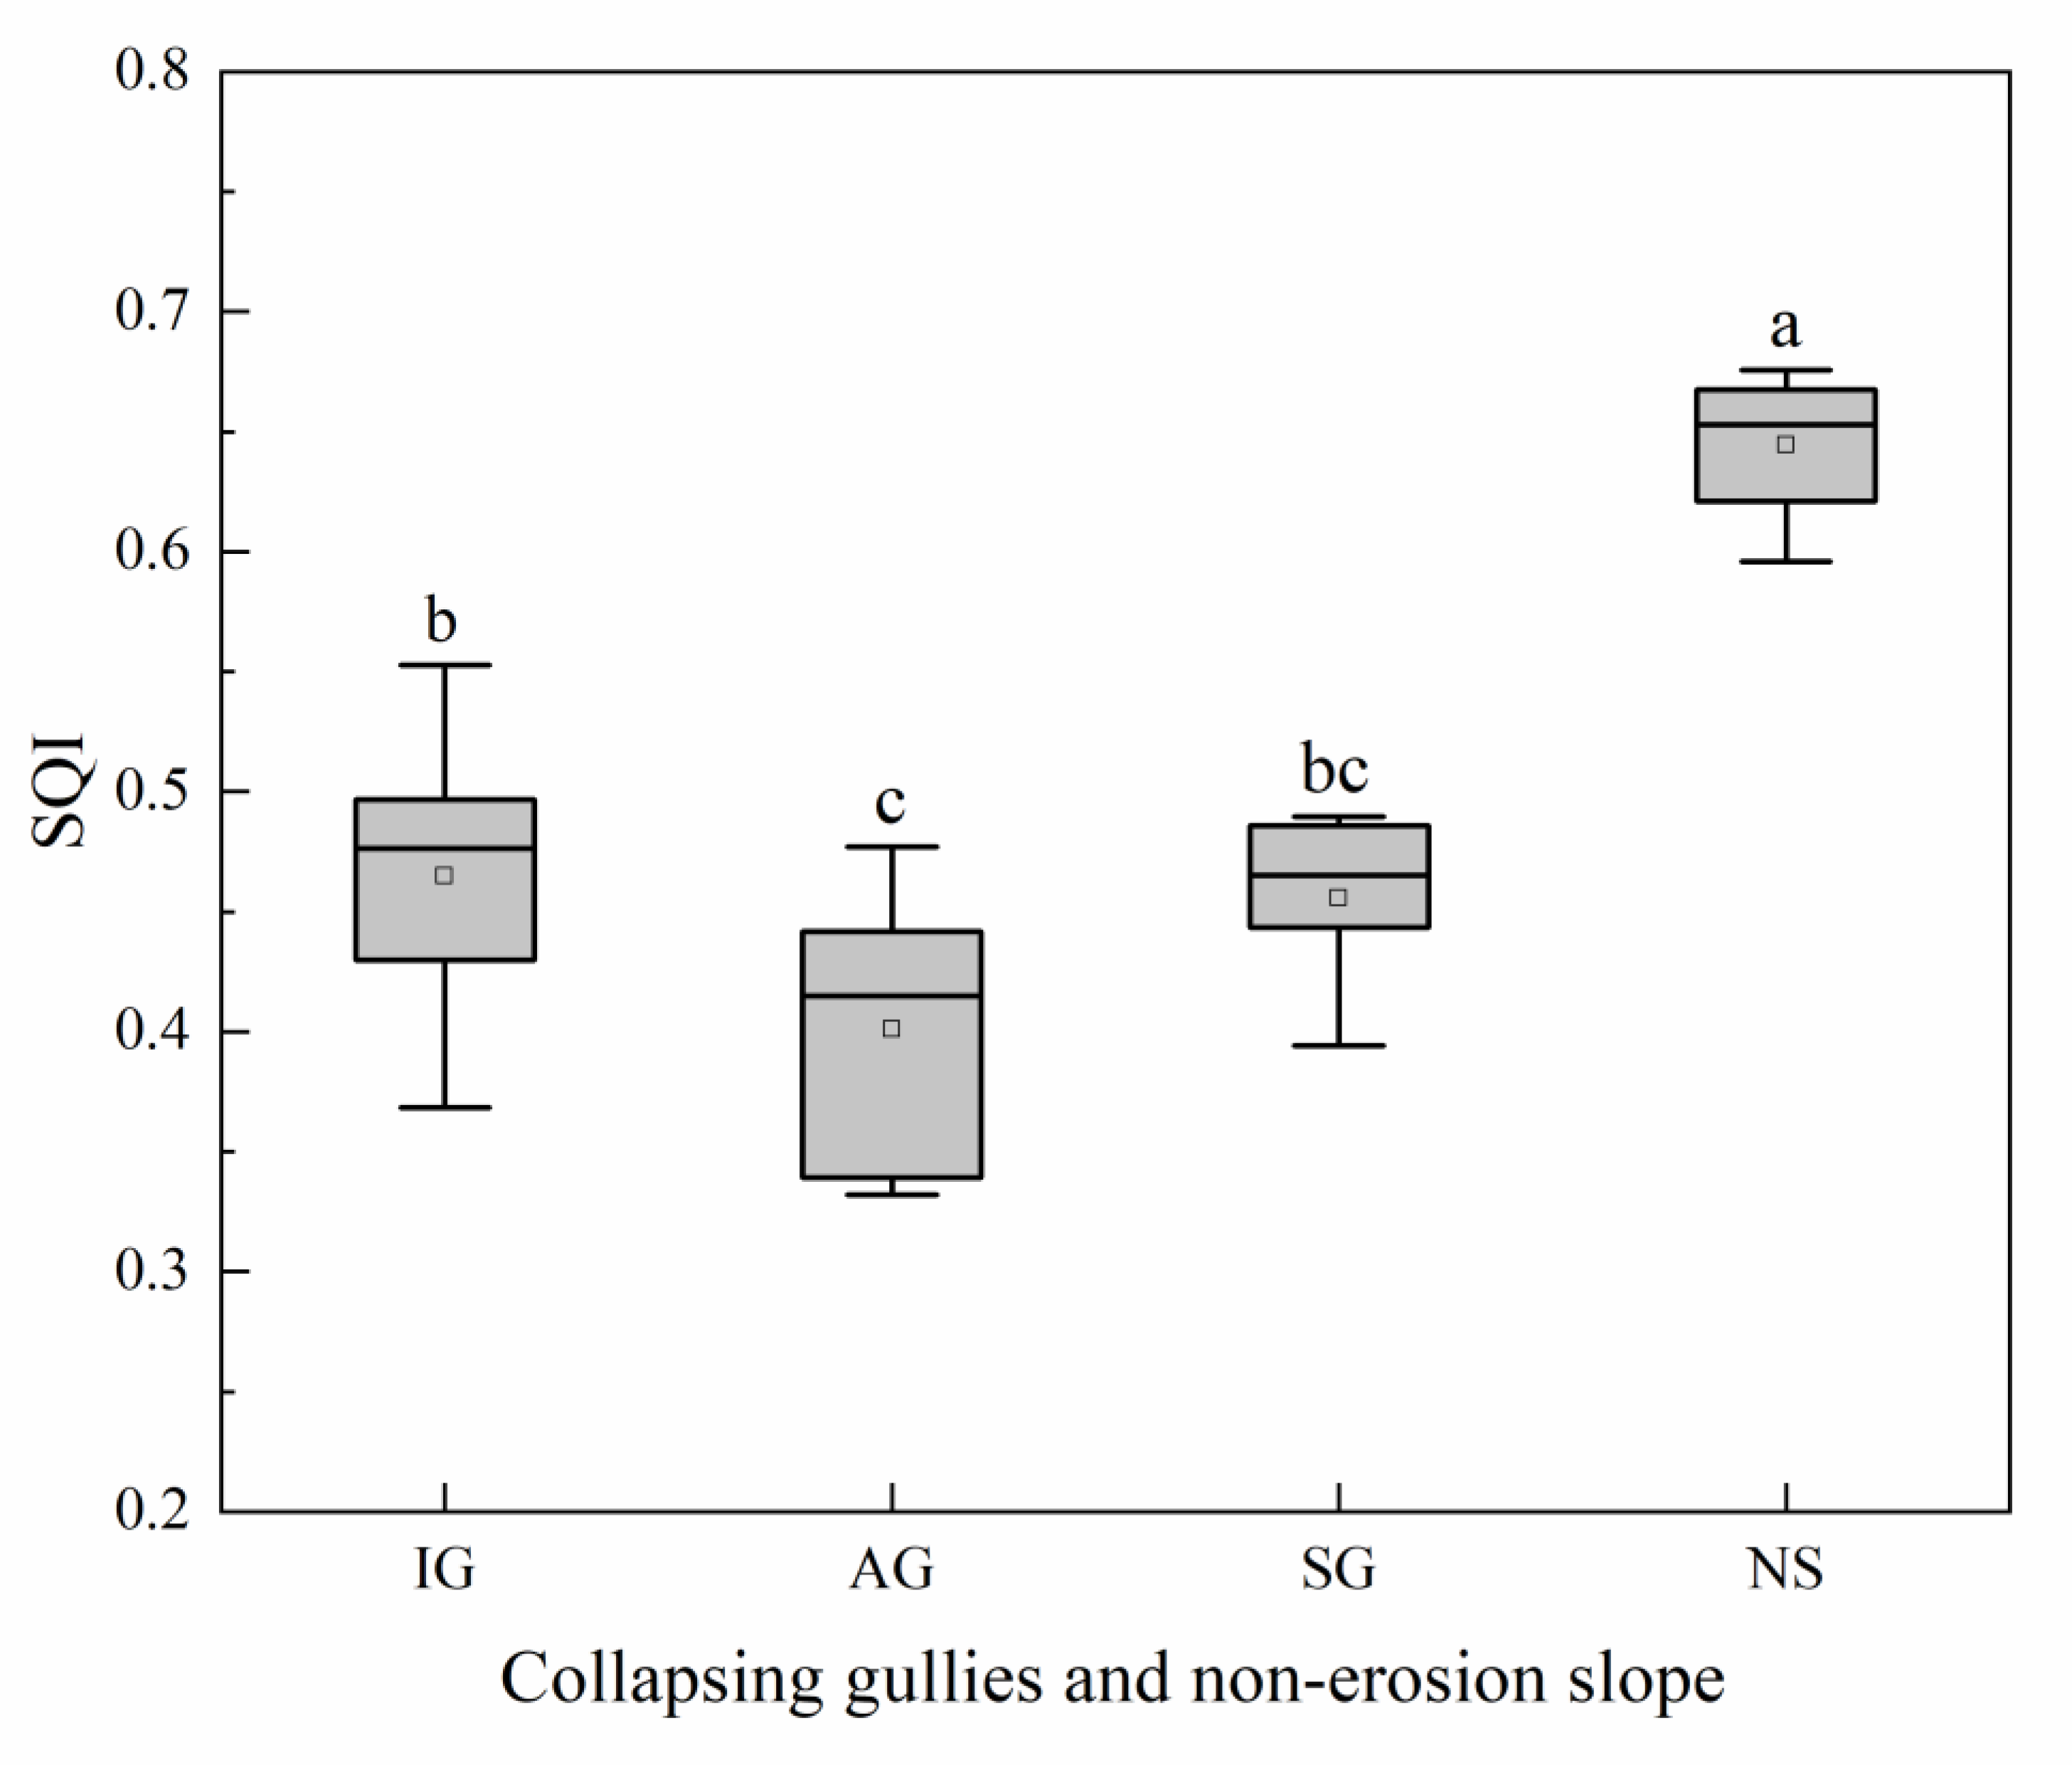
3.3. Assessment of SQI according to PCA

The 17 soil indicators measured and root density in the experiment were grouped by principal component analysis (Table 6). Based on the Kaiser criterion, when the eigenvalue of lower than 1 appeared at PC6, five was the minimal number of components to maintain [55,56]. The first five PCs all showed the eigenvalue ≥1 and accounted for 80.77% of the total variance. Individually, the five PCs explained 35%, 21%, 11%, 8% and 5% of the total variance. The highly weighted indicators included TN, TP, AN, and CEC in the first principal component (PC1), with the greatest contribution to the component (i.e., P) for their highest factor loading (absolute value) within a 10% variation in the variable value. The redundant variables were determined by correlation analysis within each PC (Table 7) and only TP was retained in the MDS. In the second component (PC2), clay content (CL), soil cohesion (SC) and RD were highly correlated and SC, with the highest component loading. Considering the key role of root density is neither physical nor chemical, this parameter was still maintained in the MDS. In PC3, PC4 and PC5, CP, sand content (SA) and pH were retained for the MDS. TN was selected for the MDS due to its lowest sum of correlation. Finally, the MDS was determined by TN, TP, pH, CP, SA, SC and RD.
The MDS was determined by PCA, the scores of each soil index in the MDS were calculated by using a linear score function, and the weight of each soil quality indicator was determined for the minimum data set (MDS). Equation (2) was used to determine the SQI values for each treatment after the S values were obtained for each indicator in the MDS by linear score function. In Figure 4, it can be seen that the highest SQI value in the study area was present in the non-erosion slope area, with the mean values of SQI (0.64) being significantly higher than in the other collapsing gullies. The lowest mean SQI value (0.40) was observed at the active stage of the collapsing gully, and soil degradation was higher in the active gully due to the reason that the soil underwent severe erosion and destabilization of the gullies with the transport of fertile topsoil. Furthermore, the mean SQI values showed no significant difference in the initial stage (0.46) and stable stage (0.45) of the collapsing gullies because of slight erosion.
However, a reduction was observed in the SQI value from the upper slope to the scour channel (Figure 5). The SQI values ranged from 0.44 to 0.68 in upper slope and middle slope, with the average value (0.52) being the highest in the different spatial positions of the collapsing gully. The SQI value was slightly lower in the lower slope (average of 0.49) than in the upper and middle slope, but slightly higher than in the upper catchment (average of 0.47), probably due to the lower vegetation coverage in the upper catchment than in the whole slope area. The lowest SQI mean value was obtained for the scour channel (0.39), an average decrease of 17–25% compared to that of the other spatial positions.

3.4. Key Indicators Associated with Collapsing Gullies and Spatial Locations

The soil physical and chemical indicators used for SQI analysis were presented in a radar diagram for determining quantitative patterns of these indicators between collapsing gullies and non-erosion slope area (Figure 6) as well as in different spatial locations (Figure 7). The different collapsing gullies or spatial locations were indicated by the lines crossing the 7 axes, with better soil quality and low soil degradation being shown by the values at the periphery of the web in contrast to low soil quality and high soil degradation as indicated by increased proximity to the origin. The highest values were observed in the non-erosion slope area for the seven indicators (Figure 6), indicating that soil quality-related physical and chemical properties underwent different degrees of degradation in the collapsing gullies versus the non-erosion slopes. This analysis showed that the limiting factors in the initial stage of the collapsing gully were TP, TN, pH and CP, in contrast to RD, SC and SA as the key contributors to SQI. Meanwhile, the limiting factors to SQI in the active stage of the collapsing gully were TN, RD and SC. When the collapsing gully changed from active to stable, the soil quality generally showed a good trend, resulting in the key soil indicators of TN, RD, SC and SA for the stable gully.
Additionally, in different spatial positions of the collapsing gullies, TP was the limiting factor to the SQI value in the upper catchment, with far lower contribution than in any other positions. The overall soil quality was the same in the upper slope and middle slope, with each key indicator contributing similarly to the SQI value. With the decrease of topography, RD and SC were limiting factors in the lower slope and scour channel, but SA was the key contributor to the SQI in the lower slope, with a higher contribution than in any other positions. Except for TP and pH, the contribution of key indicators was lower in the scour channel than in any other spatial parts. Overall, the soil quality degraded more rapidly in the scour channel than in the other spatial positions.

4. Discussion

4.1. Soil Properties in Different Collapsing Gullies

Gully erosion is a serious and progressive process, contributing obviously to soil quality degradation [57]. Previous studies have shown that ephemeral gully erosion had obvious influence on the soil physical and chemical properties, leading to progressive reduction of soil quality index with increasing ephemeral gully erosion [27]. In this study, significant differences were observed in the physical and chemical indicators of soils in the three erosion stages, indicating that the development of collapsing gullies plays an important role in soil properties. Chen et al. [22] found that non-collapsible soils had better physical and chemical characteristics like higher amounts of cations and greater cohesive force to resist the shear force, which were consistent with the results of this study. Additionally, the research results also showed that the non-erosion slope had a significantly higher value than the collapsing gully in most soil chemical properties (TN, AN, TP, AP, AK, OM and CEC) and some soil physical properties (BD, CL and SC), indicating that soil physical and chemical quality could be improved by high vegetation coverage and proper soil condition of a non-erosion slope. Jonasson and Michelsen found that plant root and soil microbes immobilized nutrients efficiently, and nutrients such as nitrogen and phosphorus are closely related leaves and fine root biomass of shrubs. This implies that changes of roots and microbes could be important for the supply of plant available nutrients [58].
The soil surface was most seriously degraded at the active stage of the collapsing gully, with a certain depth of soil being removed in the erosion process. In the three stages of the collapsing gully, the active stage showed the lowest values in the soil properties of AN, AP, OM, CEC and SC (Table 3). Xia et al. [59] found that the nutrient contents (soil organic matter, total N and available N, P, K) were much lower in the regions strongly influenced by collapsing gully erosion. Compared with the non-influenced or weakly influenced regions, the strongly influenced region exhibited a very obvious decrease in SOM and total N (5.23 and 0.56 g kg−1, respectively), probably due to poor consolidation and lower vegetation cover of disturbed soil. Previous studies have also shown that gradually reduced erosion or ecological recovery could significantly improve the soil physical properties and nutrients [60,61]. In this study, soil nutrients were found higher in SG than in the other stages. The gravel content was highest in AG, lower in IG and SG, and lowest in NS (Table 4), which were consistent with the results of Xia et al. [59]. However, significant differences were observed in the clay content, with significantly higher clay content in NS and IG than in AG and SG, probably due to severe soil erosion and the loss of fine particles, which were contrary to the study by Xia et al. [59]. Hydraulic conductivity decreased in the non-erosion slope, probably due to higher clay content and root density. Deng et al. [62] reported that the higher the content of fine soil particles, the lower the hydraulic conductivity will be.

4.2. Effects of Spatial Position on Soil Properties in the Collapsing Gully

Spatial variations in soil fertility and texture can be induced by soil erosion along slope positions [63]. Generally, fine soil particles washed from high-altitude topsoil are deposited at low altitudes, and the detached fine particles were preferentially transported to the scour channel, with coarser sand particles being accumulated on the soil surface [64,65]. In this study, an increasing trend was observed in the clay content, coupled with a decreasing trend in the sand content and gravel content from upper catchment to lower slope (Table 4), which were in agreement with the results of Geng et al. [63]. Roots can reduce soil erosion through their chemical bonding and physical binding effects to increase soil stability [66,67]. In Figure 3, it can be seen that the root density gradually increased from US to LS, which was in line with the results of Slobodian et al. [68] and Geng et al. [63]. The scour channel was distinct from the other spatial positions in the soil properties. Our results demonstrated that soil physical properties that influence the soil texture were subject to further degradation when closer to the scour channel, leading to the lowest bulk density and the largest porosity in the scour channel. Poesen et al. [4] reported that water infiltration rate may be significantly larger through the gully bottom due to the development of more permeable horizons in the gully channel, which was supported by the finding of significantly larger hydraulic conductivity in the scour channel than in the other spatial positions in the present study (Table 4).
The variation in soil nutrients can facilitate the understanding of the overall soil quality under different spatial positions in the erosion process [69]. Due to little vegetation cover, the soil nutrient content is slightly lower in the upper catchment than in the other positions. In this study, it is an increasing trend of soil nutrients (TN, AP, and OM) from US to LS (Table 5 and Figure 3), which were similar to the findings of Ni et al. [70] and Cihacek et al. [71]. The present research was also consistent with the studies by Pan and Bergsma [72] and Pierson and Mulla [73] in the effects of spatial position on soil nutrients. A large amount of soil nutrients and fine particles can be carried to the lower slope by runoff flow, so soil nutrient showed an increasing trend from US to LS. Deng et al. [62] and Ni et al. [70] found that many plant nutrient elements are involved in the chemical composition of fine particles, implicating that the binding of soil organic matter can be enhanced by finer soil particles. As shown in Table 4 and Figure 7, the clay content was slightly higher in the lower slope than in the other spatial positions, and so was the nutrient content (TN, AN and OM). This result was different from the study in the black soil region of China by Zhang et al. [74], who reported that the soil nutrient content showed a decrease in the first 20 cm topsoil layer on the slopes and bottom slopes relative to the ridge areas. The soil organic matter values were found to be lower in the scour channel, suggesting the reduction in the resistance of the soil to concentrated flow erosion, leading to decreased soil quality [75,76]. Therefore, the improvement of soil nutrient and organic matter will reduce its susceptibility to degradation under the influence of gully erosion.

4.3. SQI and Key Indicators

The synthetic SQI is important for making sound decisions in soil degradation research. SQI is the result of the selection of the most appropriate properties form the minimum number of soil indicators with a critical influence on soil functions. The present study showed that SQI mainly depends on TN, TP, pH, CP, SA, SC, and RD. Previous studies have shownd that TN and TP are the potential indicators of soil quality [77,78], with a slightly higher weighting value and more contribution to SQI. Obade et al. [79] and Rodrigue and Burger [80] have also reported a significant correlation of soil porosity and texture with soil quality. It is the same for the root density and the development trend of vegetation coverage. With the decrease of root density, a significant reduction was observed in the organic matter and other nutrients in the soil derived from root exudates, resulting in a decrease in soil quality and productivity. pH can directly reflect the soil chemical environment, and SC is an important indicator for the resistance of soil to erosion and an important parameter of soil quality, which in principle corresponded to the results of Wang et al. [81], De Baets et al. [66,82] and Doran and Parkin [83].
Collapsing gully erosion causes serious soil degradation. The highest loss in soil quality was observed in the active stage (AG) of the collapsing gully, leading to the lowest mean SQI value (0.40). Compared to the non-erosion slope (0.64), IG (0.46) and SG (0.45) showed no significant difference in the SQI values. Ollobarren et al. [26] mentioned that the SQI value was highest (0.752) in regions not influenced by erosion, and ranged from 0.628 to 0.665 (average of 0.648) in areas subject to ephemeral gully erosion. In this study, the SQI value was very similar from upper catchment to lower slope, but the lowest (0.39) in the scour channel, which is in agreement with several previous studies [25,26,30]. Collectively, the soil quality is seriously degraded by collapsing gully erosion, leading to a lower SQI value when compared with other research areas.

5. Conclusions

In the subtropical hilly region of China, collapsing gully erosion can obviously degrade the soil quality as compared with the non-erosion slope area. The degradation was closely related to the erosion stages as well as the spatial positions of the collapsing gully. Soil chemical indicators, especially the soil nutrients, showed significant differences between the collapsing gullies and non-erosion slope area. The major loss occurred in the nutrients and organic matter in the active stage of the collapsing gully. Soil physical properties were more susceptible than soil nutrients to collapsing gully erosion in the different spatial locations of the collapsing gully. In the cases studied, SQI was mainly dependent on the soil physical characteristics (CP, SA and SC), chemical characteristics (TN, TP and pH), and root density. When compared with the non-erosion slope area, the SQI showed a decrease of 27.85%, 37.78% and 29.29% from IG to AG and SG in the collapsing gully, respectively. In the spatial positions of the collapsing gully, the SQI mean value was lowest in the scour channel (0.39), and not significantly different in the upper catchment and the other slope locations. Above research results indicated that more measures should be taken to protect the soil nutrients (TN and TP) and soil physical properties (SC, SA and CP) in the active stage or the scour channel of the collapsing gullies.
Our study indicated that the SQI method was a useful and practical tool to evaluate soil quality for its quantitative flexibility and accuracy. This study was beneficial for implementing ecological restoration practices and management in degraded collapsing gully areas and other gully areas. However, the soil quality of collapsing gully areas was affected by comprehensive factors from soil environment. Then, more research needs to be done on the soil biological properties (e.g., microbial biomass, active enzymes, etc.) to enrich the knowledge of SQI concerning the collapsing gully erosion.

Author Contributions

S.F. analyzed the data and wrote the manuscript; H.W. and S.N. analyzed soil samples; J.W. designed research goals and wrote the manuscript; C.C. conducted the field investigation.

Funding

This research was funded by the National Key Research and Development Program of China (2017YFC0505404) and the National Natural Science Foundation of China (41771304, 41630858).

Conflicts of Interest

The authors declare no conflicts of interest.

References

  1. Morgan, R.P.C. Soil Erosion and Conservation; John Wiley & Sons: New Jersey, NJ, USA, 2015. [Google Scholar]
  2. Boardman, J. Soil erosion science: Reflections on the limitations of current approaches. Catena 2006, 68, 73–86. [Google Scholar] [CrossRef]
  3. Betts, H.D.; De Rose, R.C. Digital elevation models as a tool for monitoring and measuring gully erosion. Int. J. Appl. Earth Obs. Geoinf. 1999, 1, 91–101. [Google Scholar] [CrossRef]
  4. Poesen, J.; Nachtergaele, J.; Verstraeten, G.; Valentin, C. Gully erosion and environmental change: Importance and research needs. Catena 2003, 50, 91–133. [Google Scholar] [CrossRef]
  5. Zgłobicki, W.; Poesen, J.; Cohen, M.; Del Monte, M.; García-Ruiz, J.M.; Ionita, I.; Niacsu, L.; Machová, Z.; Martín-Duque, J.F.; Nadal-Romero, E.; et al. The Potential of Permanent Gullies in Europe as Geomorphosites. Geoheritage 2019, 11, 217–239. [Google Scholar] [CrossRef]
  6. Zeng, Z.X. Observation collapse erosion development and its control in Baoliu landscape. Soil Water Conserv. Fujian 1992, 1, 18–23. [Google Scholar]
  7. Chen, X.A.; Yang, J.; Xiong, Y.; Xiao, S.S. Research on the soil characteristics and factors of collapsing erosion in the red soil zone. J. Hydraul. Eng. 2013, 44, 1175–1181. [Google Scholar]
  8. Xu, J.X. Benggang erosion: The influencing factors. Catena 1996, 27, 249–263. [Google Scholar]
  9. Jiang, F.S.; Huang, Y.H.; Wang, M.K.; Lin, J.S.; Zhao, G.; Ge, H.L. Effects of rainfall intensity and slope gradient on steep colluvial deposit erosion in Seast China. Soil Sci. Soc. Am. J. 2014, 78, 1741–1752. [Google Scholar] [CrossRef]
  10. Lin, J.S.; Huang, Y.H.; Wang, M.K.; Jiang, F.S.; Zhang, X.B.; Ge, H.L. Assessing the sources of sediment transported in gully systems using a fingerprinting approach: An example from South-east China. Catena 2015, 129, 9–17. [Google Scholar] [CrossRef]
  11. Lin, J.S.; Huang, Y.H.; Zhao, G.; Jiang, F.S.; Wang, M.K.; Ge, H.L. Flow-driven soil erosion processes and the size selectivity of eroded sediment on steep slopes using colluvial deposits in a permanent gully. Catena 2017, 157, 47–57. [Google Scholar] [CrossRef]
  12. Zhang, X.J. The practice and prospect of hill collapsing improving and development in southern China. Water Resour. 2010, 4, 17–22. [Google Scholar]
  13. Zhong, B.; Peng, S.; Zhang, Q.; Ma, H.; Cao, S. Ecological economics for the restoration of collapsing gullies in Southern China. Land Use Policy 2013, 32, 119–124. [Google Scholar] [CrossRef]
  14. Xia, J.W.; Cai, C.F.; Wei, Y.J.; Wu, X.L. Granite residual soil properties in collapsing gullies of south China: Spatial variations and effects on collapsing gully erosion. Catena 2019, 174, 469–477. [Google Scholar] [CrossRef]
  15. Luk, S.H.; Yao, Q.Y.; Gao, J.Q.; Zhang, J.Q.; He, Y.G.; Huang, S.M. Environmental analysis of soil erosion in Guangdong Province: A Deqing case study. Catena 1997, 29, 97–113. [Google Scholar] [CrossRef]
  16. Liang, Y.; Ning, D.H.; Pan, X.Z. The red soil region of Southern landfall erosion characteristics and treatment of. J. Soil Water Conserv. 2009, 1, 31–34. [Google Scholar]
  17. Jiang, F.S.; Zhan, Z.Z.; Chen, J.L.; Lin, J.S.; Wang, M.K.; Ge, H.L. Rill erosion processes on a steep colluvial deposit slope under heavy rainfall in flume experiments with artificial rain. Catena 2018, 169, 46–58. [Google Scholar] [CrossRef]
  18. Deng, Y.S.; Cai, C.F.; Xia, D.; Ding, S.W.; Chen, J.Z.; Wang, T.W. Soil Atterberg limits of different weathering profiles of the collapsing gullies in the hilly granitic region of southern China. Solid Earth 2017, 8, 499–513. [Google Scholar] [CrossRef] [Green Version]
  19. Tao, Y.; He, Y.B.; Duan, X.Q.; Zou, Z.Q.; Lin, L.R.; Chen, J.Z. Preferential flows and soil moistures on a Benggang slope: Determined by the water and temperature co-monitoring. J. Hydrol. 2017, 553, 678–690. [Google Scholar] [CrossRef]
  20. Wei, Y.J.; Wu, X.L.; Li, X.Y.; Xia, J.W.; Cai, C.F.; Hassanikhah, A. A novel and facile method for characterizing shrinkage geometry along the granitic soil profile. Soil Sci. Soc. Am. J. 2018, 82, 20–30. [Google Scholar] [CrossRef]
  21. Xia, D.; Deng, Y.S.; Wang, S.L.; Ding, S.W.; Cai, C.F. Fractal features of soil particle-size distribution of different weathering profiles of the collapsing gullies in the hilly granitic region, South China. Nat. Hazards 2015, 79, 455–478. [Google Scholar] [CrossRef]
  22. Chen, J.L.; Zhou, M.; Lin, J.S.; Jiang, F.S.; Huang, B.F.; Xu, T.T.; Wang, M.K.; Ge, H.L.; Huang, Y.H. Comparison of soil physicochemical properties and mineralogical compositions between non-collapsible soils and collapsed gullies. Geoderma 2018, 317, 56–66. [Google Scholar] [CrossRef]
  23. Deng, Y.S.; Xia, D.; Cai, C.F.; Ding, S.W. Effects of land uses on soil physic-chemical properties and erodibility in collapsing-gully alluvial fan of Anxi County, China. J. Integr. Agric. 2016, 15, 1863–1873. [Google Scholar] [CrossRef] [Green Version]
  24. Xu, M.; Zhao, Y.; Liu, G.; Wilson, G.V. Identification of soil quality factors and indicators for the Loess Plateau of China. Soil Sci. 2006, 171, 400–413. [Google Scholar]
  25. Tang, W.; Liu, H.; Liu, B. Effects of gully erosion and gully filling on soil degradation in the black soil region of Northeast China. J. Mt. Sci. 2013, 10, 913–922. [Google Scholar] [CrossRef]
  26. Ollobarren, P.; Capra, A.; Gelsomino, A.; Spada, C.L. Effects of ephemeral gully erosion on soil degradation in a cultivated area in Sicily (Italy). Catena 2016, 145, 334–345. [Google Scholar] [CrossRef]
  27. Xu, M.; Li, Q.; Wilson, G. Degradation of soil physicochemical quality by ephemeral gully erosion on sloping cropland of the hilly Loess Plateau, China. Soil Tillage Res. 2016, 155, 9–18. [Google Scholar] [CrossRef]
  28. Capra, A.; Porto, P.; Scicolone, B. Relationships between rainfall characteristics and ephemeral gully erosion in a cultivated catchment in Sicily (Italy). Soil Tillage Res. 2009, 105, 77–87. [Google Scholar] [CrossRef]
  29. Qin, W.; Zhu, Q.; Zhao, L.; Kuang, G. Topographic characteristics of ephemeral gully erosion in loess hilly and gully region based on RS and GIS. Trans. CSAE 2010, 26, 58–64. [Google Scholar]
  30. Liu, H.U.; Zhang, T.Y.; Liu, B.Y.; Liu, G.; Wilson, G. Effects of gully erosion and gully filling on soil depth and crop production in the black soil region, northeast China. Environ. Earth Sci. 2013, 68, 1723–1732. [Google Scholar] [CrossRef]
  31. Paz-Ferreiro, J.; Fu, S. Biological Indices for Soil Quality Evaluation: Perspectives and Limitations. Land Degrad. Dev. 2016, 27, 14–25. [Google Scholar] [CrossRef]
  32. Bone, J.; Barraclough, D.; Eggleton, P.; Head, M.; Jones, D.T.; Voulvoulis, N. Prioritising soil quality assessment through the screening of sites: The use of publicly collected data. Land Degrad. Dev. 2014, 25, 251–266. [Google Scholar] [CrossRef]
  33. Pulido Moncada, M.; Gabriels, D.; Cornelis, W.; Lobo, D. Comparing aggregate stability tests for soil physical quality indicators. Land Degrad. Dev. 2015, 26, 843–852. [Google Scholar] [CrossRef]
  34. Griffiths, B.S.; Ball, B.C.; Daniell, T.J.; Hallett, P.D.; Neilson, R.; Wheatley, R.E.; Osler, G.; Bohanec, M. Integrating soil quality changes to arable agricultural systems following organic matter addition, or adoption of a ley-arable rotation. Appl. Soil Ecol. 2010, 46, 43–53. [Google Scholar] [CrossRef]
  35. Andrews, S.S.; Karlen, D.L.; Mitchell, J.P. A comparison of soil quality indexing methods for vegetable production systems in northern California. Agric. Ecosyst. Environ. 2002, 90, 25–45. [Google Scholar] [CrossRef]
  36. Andrews, S.S.; Karlen, D.L.; Cambardella, C.A. The soil management assessment framework: A quantitative soil quality evaluation method. Soil Sci. Soc. Am. J. 2004, 68, 1945–1962. [Google Scholar] [CrossRef]
  37. Mandal, U.K.; Warrington, D.N.; Bhardwaj, A.K.; Bar-Tal, A.; Kautsky, L.; Minz, D.; Levy, G.J. Evaluating impact of irrigation water quality on a calcareous clay soil using principal component analysis. Geoderma 2008, 144, 189–197. [Google Scholar] [CrossRef]
  38. Vasu, D.; Singh, S.K.; Ray, S.K.; Duraisami, V.P.; Tiwary, P.; Chandran, P.A.; Nimkar, M.; Anantwar, S.G. Soil quality index (SQI) as a tool to evaluate crop productivity in semi-arid Deccan plateau, India. Geoderma 2016, 282, 70–79. [Google Scholar] [CrossRef]
  39. Raiesi, F. A minimum data set and soil quality index to quantify the effect of land use conversion on soil quality and degradation in native rangelands of upland arid and semiarid regions. Ecol. Indic. 2017, 75, 307–320. [Google Scholar] [CrossRef]
  40. Vincent, D.P.O.; Lal, R. Towards a standard technique for soil quality assessment. Geoderma 2016, 265, 96–102. [Google Scholar]
  41. Zhang, Y.H.; Xu, X.L.; Li, Z.W.; Liu, M.X.; Xu, C.H.; Zhang, R.F.; Luo, W. Effects of vegetation restoration on soil quality in degraded karst landscapes of southwest China. Sci. Total Environ. 2019, 650, 2657–2665. [Google Scholar] [CrossRef]
  42. ISSAS. Soil Physical and Chemical Analysis; Shanghai Science and Technology Press: Shanghai, China, 1978. (In Chinese) [Google Scholar]
  43. Logsdon, S.D.; Jaynes, D.B. Methodology for determining hydraulic conductivity with tension infiltrometers. Soil Sci. Soc. Am. J. 1993, 57, 1426–1431. [Google Scholar] [CrossRef]
  44. Wooding, R.A. Steady infiltration from a shallow circular pond. Water Resour. Res. 2010, 4, 1259–1273. [Google Scholar] [CrossRef]
  45. Terzaghi, K. The shear resistance of saturated soils. Int. Conf. Soil Mech. Found. Eng. 1936, 1, 54–56. [Google Scholar]
  46. ASTM D3080-90. Standard Test Method for Direct Shear Test of Soils under Consolidated Drained Conditions; ASTM: West Conshohocken, PA, USA, 2004. [Google Scholar]
  47. Nelson, D.W. Total carbon, organic carbon and organic matter. Methods Soil Anal. 1982, 9, 961–1010. [Google Scholar]
  48. Horta, M.D.C.; Torrent, J. The Olsen P method as an agronomic and environmental test for predicting phosphate release from acid soils. Nutr. Cycl. Agroecosyst. 2007, 77, 283–292. [Google Scholar] [CrossRef]
  49. Sims, J.T. Comparison of mehlich 1 and mehlich 3 extractants for P, K, Ca, Mg, Mn, Cu and Zn in Atlantic coastal plain soils1. Commun. Soil Sci. Plant Anal. 1989, 20, 1707–1726. [Google Scholar] [CrossRef]
  50. Böhm, W. Methods of Studying Soot Systems; Springer: Berlin, Germany, 1979. [Google Scholar]
  51. Li, Q.; Xu, M.; Liu, G.; Zhao, Y.; Tuo, D. Cumulative effects of a 17-year chemical fertilization on the soil quality of cropping systemin the loess hilly region, China. J. Plant Nutr. Soil Sci. 2013, 176, 249–259. [Google Scholar] [CrossRef]
  52. Brejda, J.J.; Karlen, D.L.; Smith, J.L.; Allan, D.L. Identification of regional soil quality factors and indicators: II. Northern Mississippi Loess Hills and Palouse Prairie. Soil Sci. Soc. Am. J. 2000, 64, 2125–2135. [Google Scholar] [CrossRef]
  53. Andrews, S.S.; Mitchell, J.P.; Mancinelli, R.; Karlen, D.L.; Hartz, T.K.; Horwath, W.R.; Pettygrove, G.S.; Scow, K.M.; Munk, D.S. On-farm assessment of soil quality in California’s Central Valley. Agron. J. 2002, 94, 12–13. [Google Scholar] [CrossRef]
  54. Bastida, F.; Moreno, J.L.; Hernandez, T.; Garcia, C. Microbiological degradation index of soils in a semiarid climate. Soil Biol. Biochem. 2006, 38, 3463–3473. [Google Scholar] [CrossRef]
  55. Masto, R.E.; Chhonkar, P.K.; Singh, D.; Patra, A.K. Alternative soil quality indices for evaluating the effect of intensive cropping, fertilisation and manuring for 31 years in the semi-arid soils of India. Environ. Monit. Assess. 2008, 136, 419–435. [Google Scholar] [CrossRef] [PubMed]
  56. Kaiser, H.F. The Application of Electronic Computers to Factor Analysis. Educ. Psychol. Meas. 1960, 20, 141–151. [Google Scholar] [CrossRef]
  57. Lal, R. Soil Erosion Impact on Agronomic Productivity and Environment Quality. Crit. Rev. Plant Sci. 1998, 17, 319–464. [Google Scholar] [CrossRef]
  58. Jonasson, S.; Michelsen, A. Nutrient cycling in subarctic and arctic ecosystems, with special reference to the Abisko and Torneträsk region. Ecol. Bull. 1996, 45, 45–52. [Google Scholar]
  59. Xia, D.; Ding, S.W.; Long, L.; Deng, Y.S.; Wang, Q.X.; Wang, S.L.; Cai, C.F. Effects of collapsing gully erosion on soil qualities of farm fields in the hilly granitic region of South China. J. Integr. Agric. 2016, 12, 201–213. [Google Scholar] [CrossRef]
  60. Zhang, C.; Xue, S.; Liu, G.B.; Song, Z.L. A comparison of soil qualities of different revegetation types in the Loess Plateau, China. Plant Soil 2011, 347, 163–178. [Google Scholar] [CrossRef]
  61. Tang, G.Y.; Gao, C.J.; Li, K. Effects of vegetation restoration on the amelioration of degraded soil in a dry-hot valley. Acta Ecol. Sin. 2015, 35, 5157–5167. [Google Scholar]
  62. Deng, Y.S.; Cai, C.; Xia, D.; Ding, S.W.; Chen, J.Z. Fractal features of soil particle size distribution under different land-use patterns in the alluvial fans of collapsing gullies in the hilly granitic region of southern China. PLoS ONE 2017, 12, e0173555. [Google Scholar] [CrossRef]
  63. Geng, R.; Zhang, G.H.; Ma, Q.H.; Wang, H. Effects of landscape positions on soil resistance to rill erosion in a small catchment on the Loess Plateau. Biosyst. Eng. 2017, 160, 95–108. [Google Scholar] [CrossRef]
  64. Li, Z.W.; Zhang, G.H.; Geng, R.; Wang, H. Spatial heterogeneity of soil detachment capacity by overland flow at a hillslope with ephemeral gullies on the Loess Plateau. Geomorphology 2015, 248, 264–272. [Google Scholar] [CrossRef]
  65. Shi, Z.H.; Fang, N.F.; Wu, F.Z.; Wang, L.; Yue, B.J.; Wu, G.L. Soil erosion processes and sediment sorting associated with transport mechanisms on steep slopes. J. Hydrol. 2012, 454–455, 123–130. [Google Scholar] [CrossRef]
  66. De Baets, S.; Poesen, J.; Gyssels, G.; Knapen, A. Effects of grass roots on the erodibility of top soils during concentrated flow. Geomorphology 2006, 76, 54–67. [Google Scholar] [CrossRef]
  67. Zhang, G.H.; Tang, K.M.; Sun, Z.; Zhang, X.C. Temporal variability in rill erodibility for two types of grasslands. Soil Res. 2014, 52, 781–788. [Google Scholar] [CrossRef]
  68. Slobodian, N.; Rees, K.V.; Pennock, D. Cultivation induced effects on belowground biomass and organic carbon. Soil Sci. Soc. Am. J. 2002, 66, 924–930. [Google Scholar] [CrossRef]
  69. Kosmas, C.; Danalatos, N.G.; Gerontidis, S. The effect of land parameters on vegetation performance and degree of erosion under Mediterranean conditions. Catena 2000, 40, 3–17. [Google Scholar] [CrossRef]
  70. Ni, S.J.; Zhang, J.H. Variation of chemical properties as affected by soil erosion on hillslopes and terraces. Eur. J. Soil Sci. 2010, 58, 1285–1292. [Google Scholar] [CrossRef]
  71. Cihacek, L.J.; Swan, J.B. Effects of erosion on soil chemical properties in the north central region of the United States. J. Soil Water Conserv. 1994, 49, 259–265. [Google Scholar]
  72. Pan, J.; Bergsma, E. Determination of soil erosion class using soil infiltration rate and soil shear resistance. J. Soil Water Conserv. 1995, 4, 122–128. [Google Scholar]
  73. Pierson, F.B.; Mulla, D.J. Aggregate stability in the Palouse region of Washington: Effect of landscape position. Soil Sci. Soc. Am. J. 1990, 54, 1407–1412. [Google Scholar] [CrossRef]
  74. Zhang, S.; Jiang, L.; Liu, X.; Zhang, X.; Fu, S.; Dai, L. Soil nutrient variance by slope position in a Mollisol farmland area of Northeast China. Chin. Geogr. Sci. 2015, 26, 508–517. [Google Scholar] [CrossRef]
  75. Knapen, A.; Poesen, J.; Govers, G.; Gyssels, G.; Nachtergaele, J. Resistance of soils to concentrated flow erosion: A review. Earth Sci. Rev. 2007, 80, 75–109. [Google Scholar] [CrossRef]
  76. Tisdall, J.M.; Oades, J.M. Organic matter and water-stable aggregates in soils. J. Soil Sci. 1982, 33, 141–163. [Google Scholar] [CrossRef]
  77. Andrews, S.S.; Carroll, C.R. Designing a soil quality assessment tool for sustainable agroecosystem management. Ecol. Appl. 2001, 11, 1573–1585. [Google Scholar] [CrossRef]
  78. Karlen, D.L.; Hurley, E.G.; Andrews, S.S.; Cambardella, C.A.; Meek, D.W.; Duffy, M.D.; Mallarino, A.P. Crop rotation effects on soil quality at three northern corn/soybean locations. Agron. J. 2006, 98, 484–495. [Google Scholar] [CrossRef]
  79. Obade, V.D.P.; Lal, R. Soil quality evaluation under different land management practices. Environ. Earth Sci. 2014, 72, 4531–4549. [Google Scholar] [CrossRef]
  80. Rodrigue, J.A.; Burger, J.A. Forest soil productivity of mined land in the midwestern and eastern coalfield regions. Soil Sci. Soc. Am. J. 2004, 68, 833–844. [Google Scholar] [CrossRef]
  81. Wang, J.K.; Li, S.Y.; Zhang, X.D.; Wei, D.; Chi, F.Q. Spatial and temporal variability of soil quality in typical black soil area in Northeast China in 20 years. Chin. J. Eco-Agric. 2007, 15, 19–24. [Google Scholar]
  82. De Baets, S.; Poesen, J.; Knapen, A.; Galindo, P. Impact of root architecture on the 23 erosion-reducing potential of roots during concentrated flow. Earth Surf. Process. Landf. 2007, 32, 1323–1345. [Google Scholar] [CrossRef]
  83. Doran, J.W.; Parkin, T.B. Defining and Assessing Soil Quality; SSSA Special Publication: Madison, WI, USA, 1994; pp. 1–21. [Google Scholar]
Figure 1. Sampling sites in the subtropical hilly region of Southern China. IG, Initial stage of the collapsing gully; AG, active stage of the collapsing gully; SG, stable stage of the collapsing gully; NS, non-erosion slope.
Sustainability 11 03369 g001
Figure 2. Five spatial locations were divided from top to bottom in the active stage of the collapsing gully. (1) Upper catchment; (2) upper slope; (3) middle slope; (4) lower slope; (5) scour channel.
Sustainability 11 03369 g002
Figure 3. Root density in the different spatial positions of the collapsing gullies. UC: upper catchment; US: upper slope; MS: middle slope; LS: lower slope; SC: scour channel. Different small letters indicate significant differences at p < 0.05.
Sustainability 11 03369 g003
Figure 4. Soil quality index (SQI) variation from different collapsing gullies and non-erosion slope. IG: initial stage of the collapsing gully; AG: active stage of the collapsing gully; SG: stable stage of the collapsing gully; NS: non-erosion slope. Different small letters indicate significant differences at p < 0.05.
Sustainability 11 03369 g004
Figure 5. SQI variation in different spatial positions of collapsing gullies. UC: upper catchment; US: upper slope; MS: middle slope; LS: lower slope; SC: scour channel. Different small letters indicate significant differences at p < 0.05.
Sustainability 11 03369 g005
Figure 6. The evolution of the aforementioned key indicators in different development stages of collapsing gullies and the non-erosion slope. IG: initial stage of the collapsing gully; AG: active stage of the collapsing gully; SG: stable stage of the collapsing gully; NS: non-erosion slope. TN: total nitrogen (g kg−1); TP: total phosphorus (g kg−1); CP: capillary porosity (%); SA: sand content (%); SC: soil cohesion (kPa); RD: root density (g cm−3).
Sustainability 11 03369 g006
Figure 7. The evolution of the aforementioned key indicators in different spatial locations of collapsing gullies. UC: upper catchment; US: upper slope; MS: middle slope; LS: lower slope; SC: scour channel. TN: total nitrogen (g kg−1); TP: total phosphorus (g kg−1); CP: capillary porosity (%); SA: sand content (%); SC: soil cohesion (kPa); RD: root density (g cm−3).
Sustainability 11 03369 g007
Table 1. Basic characteristics of collapsing gullies and non-erosion slopes.
CodeLongitude and LatitudeErosion CharacteristicHeight of the Gully Wall (m)Slope Gradient (%)Length (m)Maximum Width of the Channel (m)Coverage of Tree Layer (%)Coverage of Surface Layer (%)
IG26°11′18″ N; 115°10′37″ EInitial stage of the collapsing gully;
Splash erosion, interrill erosion, rill erosion, headward erosion.
8.39–4029.14.04176
AG26°11′27″ N; 115°10′34″ EActive stage of the collapsing gully;
Splash erosion, interrill erosion, rill erosion, headward erosion, gravity erosion.
15.05–3180.111.24362
SG26°11′37″ N; 115°10′30″ EStable stage of the collapsing gully;
Splash erosion, interrill erosion, rill erosion.
10.512–2951.07.35960
NS26°11′42″ N; 115°10′47″ ENon-erosion slope.12–305884
Notes: IG: initial stage of the collapsing gully; AG: active stage of the collapsing gully; SG: stable stage of the collapsing gully; NS: non-erosion slope.
Table 2. Soil physical properties of the sampling sites in the study area.
Physical PropertiesCodeNSIGAGSG
MeanStdMeanStdMeanStdMeanStd
Bulk density (kg m−3)BD1.39 a0.091.33 a0.111.23 a0.181.32 a0.08
Capillary porosity (%)CP42.58 a2.1444.57 a4.6142.96 a2.3442.89 a1.21
Total porosity (%)OP52.00 ab2.6654.06 a6.2156.46 a5.8456.73 a2.82
Clay content (%)CL28.34 a2.6424.44 a4.0020.58 b1.6219.59 b1.98
Silt content (%)SI51.56 ab4.2954.02 a2.4157.26 a3.7352.84 ab1.91
Sand content (%)SA20.10 b2.7921.53 b2.0122.16 b3.6027.57 a1.65
Gravel content (%)GR20.00 a5.3523.19 a12.7527.78 a13.9322.02 a8.77
Soil cohesion (kPa)SC14.45 a4.5311.81 a2.498.08 b1.958.87 b1.36
Hydraulic conductivity (cm min−1)HC0.14 a0.010.15 a0.020.15 a0.040.16 a0.02
Notes: Std: standard deviation; NS: non-erosion slope; IG: initial stage of the collapsing gully; AG: active stage of the collapsing gully; SG: stable stage of the collapsing gully. Different small letters in the same row indicate significant differences at p < 0.05.
Table 3. Soil Chemical properties of the sampling sites in the study area.
Chemical PropertiesCodeNSIGAGSG
MeanStdMeanStdMeanStdMeanStd
Total nitrogen (g kg−1)TN0.36 a0.020.27 c0.030.23 d0.010.32 b0.02
Total phosphorus (g kg−1)TP0.10 a0.010.05 bc0.010.06 b0.010.06 b0.01
Available nitrogen (mg kg−1)AN59.59 a5.0431.44 b6.6227.57 b8.9350.06 a12.12
Available phosphorus (mg kg−1)AP12.83 a2.399.82 b1.238.35 b3.0212.67 a2.79
Available potassium (mg kg−1)AK58.96 a1.8543.71 b10.8048.61 b7.1453.77 b5.50
Soil organic matter (g kg−1)OM13.64 a3.7210.61 a3.776.80 c2.379.50 ab1.73
pHpH4.30 a0.064.20 b0.094.26 a0.324.49 a0.23
Cation exchange capacity (cmol kg−1)CEC8.71 a0.715.73 b1.185.19 b1.156.28 b1.06
Notes: Std: standard deviation; NS: non-erosion slope; IG: initial stage of the collapsing gully; AG: active stage of the collapsing gully; SG: stable stage of the collapsing gully. Different small letters in the same row indicate significant differences at p < 0.05.
Table 4. Mean values of the soil physical properties in different spatial positions.
Physical Properties
TreatmentCodeBDCPOPCLSISAGRSCHC
Upper catchmentUC1.39 a42.12 b52.82 c20.81 a55.42 a23.77 a37.51 a10.75 a0.15 ab
Upper slopeUS1.39 a42.38 ab52.26 c21.07 a54.18 a24.75 a31.80 a9.51 a0.16 a
Middle slopeMS1.35 a44.34 a58.03 a22.71 a53.09 ab24.20 a26.58 ab10.95 a0.16 a
Lower slopeLS1.18 b42.66 ab56.57 ab23.48 a56.14 a20.38 b23.32 b8.95 a0.14 ab
Scour channelSC1.16 b45.88 a59.38 a18.16 a55.34 a26.50 a6.37 c6.74 ab0.18 a
Notes: BD: bulk density (kg m−3); CP: capillary porosity (%); OP: total porosity (%); CL: clay content (%); SI: silt content (%); SA: sand content (%); GR: gravel content (%); SC: soil cohesion (kPa); HC: hydraulic conductivity (cm min−1). Different small letters in the same column indicate significant differences at p < 0.05.
Table 5. Mean values of the soil chemical properties in different spatial positions.
TreatmentChemical Properties
CodeTNTPANAPAKOMpHCEC
Upper catchmentUC0.26 ab0.04 ab27.76 b9.63 ab45.54 b7.65 ab4.26 ab5.42 b
Upper slopeUS0.25 ab0.07 a43.24 a7.28 ab51.87 a8.66 a4.07 b5.41 b
Middle slopeMS0.28 a0.06 a40.94 a8.93 ab54.44 a9.77 a4.23 ab5.32 b
Lower slopeLS0.30 a0.06 a41.46 a11.74 a54.19 a11.05 a4.42 a5.26 b
Scour channelSC0.27 a0.06 a34.03 ab12.16 a43.03 b7.50 ab4.48 a7.44 a
Notes: TN: total nitrogen (g kg−1); TP: total phosphorus (g kg−1); AN: available nitrogen (mg kg−1); AP: available phosphorus (mg kg−1); AK: available potassium (mg kg−1); OM: soil organic matter (g kg−1); CEC: cation exchange capacity (cmol kg−1). Different small letters in the same column indicate significant differences p < 0.05.
Table 6. Principal component analysis results of selected soil variables.
Statistics ResultsPC1PC2PC3PC4PC5
Eigenvalues6.743.972.061.561.02
Percentage of variance35.4520.9110.868.215.34
Cumulative percentage35.4556.3667.2275.4380.77
Variable loading factor
TN0.790.43−0.120.04−0.30
TP0.860.14−0.05−0.110.28
AN0.830.24−0.240.07−0.16
AP0.69−0.110.350.13−0.12
AK0.610.22−0.47−0.11−0.18
OM0.510.69−0.22−0.12−0.06
pH0.19−0.370.120.01−0.81
CEC0.760.300.280.080.09
BD−0.010.62−0.570.050.15
CP−0.12−0.060.800.060.21
OP−0.01−0.400.660.32−0.03
CL0.270.79−0.05−0.470.12
SI−0.33−0.770.03−0.440.03
SA0.01−0.150.030.95−0.17
GR−0.500.12−0.65−0.180.23
SC0.050.88−0.11−0.280.01
HC0.09−0.150.400.74−0.03
RD0.290.79−0.32−0.160.08
Notes: bold factors are considered highly weighted. TN: total nitrogen (g kg−1); TP: total phosphorus (g kg−1); AN: available nitrogen (mg kg−1); AP: available phosphorus (mg kg−1); AK: available potassium (mg kg−1); OM: soil organic matter (g kg−1); CEC: cation exchange capacity (cmol kg−1); BD: bulk density (kg m−3); CP: capillary porosity (%); OP: total porosity (%); CL: clay content (%); SI: silt content (%); SA: sand content (%); GR: gravel content (%); SC: soil cohesion (kPa); HC: hydraulic conductivity (cm min−1).
Table 7. Pearson’s correlation test results for the most highly weighed variables with a high loading on one factor in principal components (PC) PC1, PC2, PC3, PC4 and PC5.
TNTPANpHCECCPCLSASCRD
Correlation coefficients
TN1
TP0.5981
AN0.8590.671
pH0.256−0.1160.0961
CEC0.6160.6770.570.0761
CP−0.209−0.168−0.191−0.090.0541
CL0.4840.4780.337−0.3630.385−0.2111
SA0.029−0.1970.0690.2110.0320.064−0.6021
SC0.4180.2230.248−0.2740.343−0.1770.852−0.3771
RD0.560.4150.465−0.3580.337−0.3410.76−0.2950.6981
Correlation sum5.0293.9442.9762.3722.1511.7933.2141.6721.6981
Significance level (p)
TNNA
TP0.007NA
AN0.0000.002NA
pH0.2900.6350.696NA
CEC0.0050.0010.0110.756NA
CP0.3900.4920.4330.7150.827NA
CL0.0360.0390.1590.1260.1040.387NA
SA0.9050.4200.7790.3860.8960.7950.006NA
SC0.0750.3590.3060.2560.1500.4690.0000.112NA
RD0.0130.0770.0450.1320.1580.1530.0000.2210.002NA
Notes: TN: total nitrogen (g kg−1); TP: total phosphorus (g kg−1); AN: available nitrogen (mg kg−1); CEC: cation exchange capacity (cmol kg−1); CP: capillary porosity (%); CL: clay content (%); SA: sand content (%); SC: soil cohesion (kPa); HC: hydraulic conductivity (cm min−1); RD: root density (g cm−3).

