Article

Comparison between Daytime and Nighttime Scenery Focusing on Restorative and Recovery Effect

1
Department of Urban Planning and Design, Hongik University, Seoul 04066, Korea
2
Landscape Architecture Program, Virginia Tech, Blacksburg, VA 24061, USA
3
Department of Landscape Architecture, Korea National College of Agriculture and Fisheries, Jeonju 54874, Korea
*
Authors to whom correspondence should be addressed.
Sustainability 2019, 11(12), 3326; https://doi.org/10.3390/su11123326
Submission received: 26 March 2019 / Revised: 1 June 2019 / Accepted: 7 June 2019 / Published: 16 June 2019
(This article belongs to the Special Issue Psychology of Sustainability and Sustainable Development)

Abstract

:
The overall purpose of this study was to investigate psycho-physiological variations in human bodies by observing visual images of daytime and nighttime scenery to focus on restorative and recovery effects. Unlike previous studies that have focused on the natural versus built environments, this study aims to compare restorative and recovery potentials between daytime and nighttime. The experiment was conducted by showing a total of 12 images to 60 participants in order to measure the brain response with an electroencephalogram (EEG). As measures of the psychological impact of the images, perceived restorative and recovery scales were used. The self-reported data indicates that daytime sceneries are rated more positively than nighttime sceneries in terms of restorative and recovery effects. According to the EEG results, restorative and recovery feelings have negative relationships with the relative theta band, while positive relationships are shown with the relative alpha band. The correlation analysis between EEG bands and brain regions showed a significant correlation (p < 0.05) with 46 pairs for the daytime scenery stimuli and 52 pairs for the nighttime scenery stimuli. Through the results of the study, we conclude that daytime and nighttime scenery affect restorative feelings and the human brain response through both verbal and non-verbal methods.

1. Introduction

1.1. Background

From an environmental aesthetics point of view, aesthetic gratification results in a positive emotional response. The preference for landscapes is understood as providing a strong incentive for human activity from an evolutionary perspective. The first reactions to the environment—emotional reactions—are essential to human survival and function [1,2,3,4].
This study explores the effects of perception of landscapes in daytime and nighttime scenery as a restorative quality. As an intriguing medium for peoples’ perceptions of a landscape, the aspects of environmental composition play an important role [5,6,7,8]. According to Partin et al. [9], integrated landscape assessments address the interdependent values that hold a direct relationship between co-analysis and other factors. The capacity of human cognition and thought is based on a process that is consistent with a particular environment, rather than a neutral or universal-purpose process. In other words, it has the characteristic of coordinating with the environmental influence in information processing by functioning efficiently in the material world [10].
Restorative and recovery characteristics of viewing landscapes can reduce a person’s psychological and physical stress and restore their health to its original state [11,12,13,14]. Landscapes with these characteristics can lead to recreational experiences, which recharge depleted concentration levels and lead to the reflection of an individual’s inner world [12]. The restorative and recovery characteristics are known to be inherent mainly in natural scenery. The argument that natural landscapes contain more restorative and recovery qualities than artificial landscapes can be understood in two dimensions: evolutionary and cultural perspectives [15]. From an evolutionary point of view, this is related to the fact that human information processing has evolved to suit natural environments, as long-term human evolution has mainly taken place in natural landscapes. Thus, while the information found in urban environments puts a strain on human information processing, natural environments relieve these burdens. From a cultural point of view, human civilization has all always relied on the destruction of nature, even though it began on the basis of its abundance. Thus, in any civilized society, the preciousness of nature is established through cultural awareness, and this cultural learning appears as a natural preference to the value of nature’s restorative and recovery characteristics. Both of the above aspects suggest that the restorative and recovery qualities inherent in natural scenery have a positive effect on human health, regardless of peoples’ personal or sociocultural differences. According to research studies to date, the restorative and recovery effects of natural scenery are experienced by various social and cultural groups, indicating that these characteristics have a universal and fundamental effect on the human experience of landscapes [3,15,16,17,18,19,20,21,22].
The question arises here of whether the effect found above is due to the restorative and recovery characteristics of landscapes in general or specific to the type of landscape (natural or artificial). This is not clear because most of the research to date has compared natural and artificial landscapes. In order to clarify this, Van den Berg et al. [23] controlled the effect of the type of landscape (natural or artificial landscape) and investigated the effect of the restorative and recovery characteristics of the landscape, and found that the greater the restorative and recovery characteristics of the landscape, the higher the preference for the landscape. These findings specifically demonstrate that restorative and recovery characteristics of landscapes create a positive landscape experience, regardless of the type of landscape or the sociocultural differences of human beings. Despite these implications, no study has been conducted to verify the effect of the restorative and recovery characteristics of landscapes at nighttime. If the restorative and recovery characteristics of landscapes are verified as measurement tools that can identify the characteristics of nighttime scenery, it is possible to understand the nighttime scenery from a multi-level point of view, and to come up with a variety of ways to develop design guidelines for nighttime landscapes.
Landscape preference and restorative quality evaluation methods can be divided into non-verbal and verbal evaluation methods. The non-verbal evaluation method analyzes external expressions of emotions, such as facial expressions, voices, and gestures, or measures physiological reactions using scientific experimental equipment. A verbal evaluation method is a method of describing one’s emotional state using self-reporting questionnaires or adjectives [24]. Environmental psychology researchers have consistently focused on the restorative potential of natural environments rather than urban environments and have often used verbal evaluation methods, such as video and photographic experiments that employ subjective measures in the laboratory [25]. There are several research studies on restorative and recovery effects of landscapes using both non-verbal and verbal evaluation methods. Ulrich [18] measured psychological and physiological changes to images of nature (green vegetation), water and nature, and urban environments. This study used psychological measurement tools, such as the “Semantic Scale” [26], which consists of 36 items grouped into four factors—dominance, wakefulness, attention or interest, and stability—and the “Zuckerman Inventory of Personal Reaction” [27] which groups emotions into five factors—fear and arousal, positive affect, anger or aggression, attentiveness, and sadness. Physiological measurement tools were used, such as alpha waves of electroencephalography (EEG), which is most sensitive to psychological changes, electrocardiographs (EKG), and blood pressure (BVP). In this experiment, Ulrich showed that the two scenes containing nature produced a positive psychological change compared to the urban scenery, and that the alpha wave also increased in the order of urban scenery, nature scenery, and lastly water scenery with nature. Similarly, Chan measured psychological and physiological changes using photographs of native landscapes that could potentially restore attention based on four factors of the attention restoration theory (ART) from a Kaplan et al. [12]. The perceived restorative scale (PRS), developed in Hartig et al. [28], was used as a psychological measurement tool, and EKG, EEG, and BVP were used as physiological measurement tools. Most of these studies adopted EEG measurement as a non-verbal evaluation method.
Regarding EEG usability as a landscape measurement tool, with the development of mobile EEG devices, research on architectural spaces or outdoor environments has started to be actively carried out. Previous studies using EEG in the field of space planning provided implications for architectural and outdoor environmental planning, focusing on environmental settings, specific building elements, and areas of user interest in the architectural field. These are classified into three trends: (1) measurement of user influence on specific elements of indoor environments [29]; (2) tools for determining specific architectural elements [30,31]; and (3) analysis of visual attention with the user’s areas of interest [32]. Many EEG studies on aspects of environments have shown the generally beneficial effects of green spaces or specific colors and environments in producing preference or restorative effects from natural landscapes. However, there have been no sufficient research studies involving a comparative analysis of daytime and nighttime scenery. Accordingly, this study used EEG to evaluate daytime and nighttime scenery related to the perceived restorative qualities and various environmental settings. Not only were the differences between daytime and nighttime scenery explored, but also the landscape types of each image were compared to verify the usability of EEG in landscape evaluation.
The purpose of this study is to investigate the effects of daytime and nighttime scenery on the psychological and physiological changes to the human body, focusing on restorative and recovery effects. To do this, we use a visual stimulus with a sensory perception ability of 87% of human senses. As a non-verbal evaluation method, we attempt to use EEG technology, which is directly related to peoples’ perceptions of an environment. Through this study, we intend to build fundamental data on what kind of invisible emotional benefits regarding restorative and recovery effects can be given to humans through psychological and physiological changes that occur when viewing daytime and nighttime images under the same conditions.

1.2. Landscape Preference and Landscape Restorative and Recovery Potential

Landscape preference, beyond aesthetic meanings, has a positive effect on physiological and psychological recovery and mental health [33,34]. Based on the commonality of landscape preferences, natural landscapes have been shown to be very high in aesthetic satisfaction and refilling effects [35]. In particular, Ulrich [11] showed that a nature-like environment with high visibility was related to positive emotions. Moreover, preferences related to behavior were explained by environmental psychologists, and attitude changes to landscape preference and behavioral induction were examined using socio-psychological theory [36]. That is, the study of landscape-to-human interaction can predict how the landscape is perceived and the relationship between intended behavior and experience in the specific landscape [37]. Ivarsson and Hagerhall [38] posited that the restorative effects of the landscape, which include recovery potential, are affected by preferences. Thus, landscape preference is adjusted by an internal assessment of potential restorative or recovery effects.
The theoretical background for the restorative and recovery characteristics of a landscape is the attention restoration theory (ART) [12] and the psychophysiological stress recovery theory (PSRT) [39]. PSRT describes stress release in various aspects, such as psychology and menstruation, whereas ART refers to the restorative and recovery effects of the landscape based on information processing and cognitive functions [38]. According to ART, the attention required in daily life is intentional and requires a lot of energy, resulting in a depletion of concentration that has a negative effect on human perception, emotions, and behavior, which can be restored by viewing a landscape or an activity with restorative and recovery characteristics. It can also be considered as an environment in which you can participate in activities without any specific intention. This implies that the restorative and recovery effects have positive relationships with staying in a preferred environment. Hence, the restorative and recovery qualities of landscapes can be measured with subjective indicators, such as aesthetics, attractiveness, and peacefulness [12,40,41]. A previous study [12] demonstrates that these qualities are subdivided into four elements: (1) “being away”; (2) “extent”; (3) “fascination”; and (3) “compatibility”. The higher the perceived intensity of these four factors, the greater the recreational and restorative effects induced by the landscape.
“Being away” refers to physical or mental distance from daily life that requires intentional concentrations and efforts. These feelings arise when new and unfamiliar landscapes are experienced. However, if the sense of responsibility and duty is not present, the feeling of being elsewhere does not occur. An escape from daily life is a prerequisite. “Fascination” is the most important element of the four factors as it causes involuntary attention of the landscape experience. Since involuntary attention does not require any mental energy, rest has an effect of recharging attention. “Extent” is related to the spatial margin of the landscape- the harmony with elements inside and outside the landscape. Overall, “extent” consists of scope and connectedness. Scope encompasses the perception of the spatial margin of experience and the person’s experience through movement. Connectedness refers to the perception that the elements of landscape are in coherence with each other and are connected without being heterogeneous to the environment. “Compatibility” entails the activities and functions of individuals that are predicted within the landscape. It is the perception of how the conditions, such as the characteristics and needs of the landscape, correspond with the purpose and intention of the experiencer. The general consensus on ART research demonstrates the effects of restorative and recovery of landscape in two dimensions: (1) a specific dimension, including psychology, physiology, and cognition; (2) a comprehensive dimension, focusing on landscape preferences. Existing research that examines the restorative characteristics and comprehensive landscape preferences reveals a positive relationship between restorative and recovery effects with preferences [4,23,42,43,44].
In contrast to ART, typical environments with a lot of recovery environmental factors are considered as natural environments in PSRT [12]. Several studies have shown that in environments where natural elements predominate over artificial elements, the recovery quality tends to be more prevalent [35]. Therefore, it is possible to draw more attention to natural environments than urban environments [23]. The achievement of attention recovery through recovery environments facilitate psychological benefits, such as stress relief and emotional enhancement [45,46].
Existing research on landscape preference and restorative potential have focused on confirming whether natural scenery has a higher preference rather than built-environment scenery [42,43,47]. Unlike previous studies that focused on the positive effects of the natural environment, this study identifies perceived restorative and recovery potentials between daytime and nighttime sceneries.

1.3. Research Hypotheses

In the current study, we aim to investigate the effects of viewing daytime and nighttime scenery by comparing EEG data and reported levels of perceived restorative and recovery scale. The specific research hypotheses in relation to the objective of this study goes as follows:
  • H1: Daytime scenes will be rated more positively than nighttime scenes in terms of self-reported perceived restorative and recovery scale.
  • H2: The signals and power spectrum of participants’ EEG will show significantly different results on daytime and nighttime sceneries.
  • H3: There will be a significant correlation between the EEG band depending on the region of the brain.

2. Methods and Data

2.1. Participants

A total of 62 participants (31 males and 31 females) with an average age of 31 took part in this study. The inclusion criteria for this study required participants on the following criteria: (1) no brain or psychiatric disorders; (2) no ophthalmic disease; (3) normal blood pressure without history of heart diseases; (4) no medication taken for any treatment during the study period; (5) physically and mentally healthy with no anxiety in enclosed areas. The data was collected from 60 participants (30 males and 30 females) excluding two participants who had noises in the brain waves due to movements during the measurement process. Our research protocol and survey instrument were approved by the Institutional Review Board of Virginia Tech.

2.2. Experimental Images

All photos for this study were taken during the same season on Virginia Tech’s campus. It consists of six sets. Each set has two photos of daytime and nighttime scenery. Photo set one depicts an enclosed setting near stairs, photo set two an open setting, set three an enclosed setting surrounded by building, set four an enclosed setting surrounded by trees, set five a crooked path setting, and set six an enclosed setting surrounded by architectural features.
All photos were intended for a natural environment where there is no expectation of deliberate negative or positive emotions. Table 1 illustrates the images that were used for the experiment.

2.3. Research Procedure

In order to measure the EEG data of the participants, we purposefully designed the laboratory in order to block any noises and external exposure. This was done in order to have the participants fully immersed in the experiment. To minimize the influence of surrounding colors, a white board was installed on three sides of the participants’ desks. Before starting the experiment, we encouraged participants to have mental stability in an experimental environment unfamiliar to them. The research team explained the entire experimental process in advance.
When participants calibrate their EEG devices, he or she adjusts their postures for five minutes, seats on the chair, and selects the breathing option. First, background brain waves—the spontaneous electrical activity of cerebral cortical neurons—were measured with eyes opened and recorded for 1 min and 30 s without external stimulation proceeded by a resting period. Second, after a two-minute break, participants observed six daytime scenery photographic stimuli for two minutes (appearing for 10 s after a 10 s interval for each photo) while the EEG captured their emotional response to the stimuli. The participants observed the nighttime scenery stimuli for two minutes- in the same way that participants observed the daytime scenery stimuli- after a two-minute break. Third, participants were asked to review all 12 slides and rate them on four dimensions (see below Figure 1). Each slide was presented for 20 s. Subjective responses were provided on a paper questionnaire. The EEG output was directly recorded by the computer. Finally, participants filled out a debriefing questionnaire indicating their demographic data.

2.4. Outcome Measures

2.4.1. Questionnaire for Subjective Preferences

Restorative and recovery potential, according to different landscapes, have been mainly studied by self-reporting methods [11]. We selected four subjective questions to capture the subjective preferences to photographic stimuli. First two items are questions related to Perceived Restorative Scale, which was developed based on ART [12]. As mentioned above, the restorative quality described by ART involves four dimensions: being away, fascination, extent, and compatibility [48]. Among them, we chose two concepts: (1) being away (“it is a place where you can think of exciting things while relaxing away from tired daily life”) and (2) fascination (“this place is wide enough to find new things that stimulate one’s curiosity.”), with both items ranked on a Likert-scale ranging from “Not at all (1)” to “Extremely likely (10)”. The scores of these two items were added together to calculate the perceived restorative scale score for each slide.
The two remaining items were designed to the dimensions of the recovery scale. To this end, we borrowed a questionnaire from [43] used to ask participants about the possibility of recovery of the scenes in the slides: (1) attention (“it feels like I can recover my attention when I’m here.”) and (2) relieve stress (“it is likely that all the tension will be released here.”). Again, both items were ranked on a Likert-scale ranging from “Not at all (1)” to “Extremely likely (10)”. The sum of these two items’ scores was used as the recovery scale score.

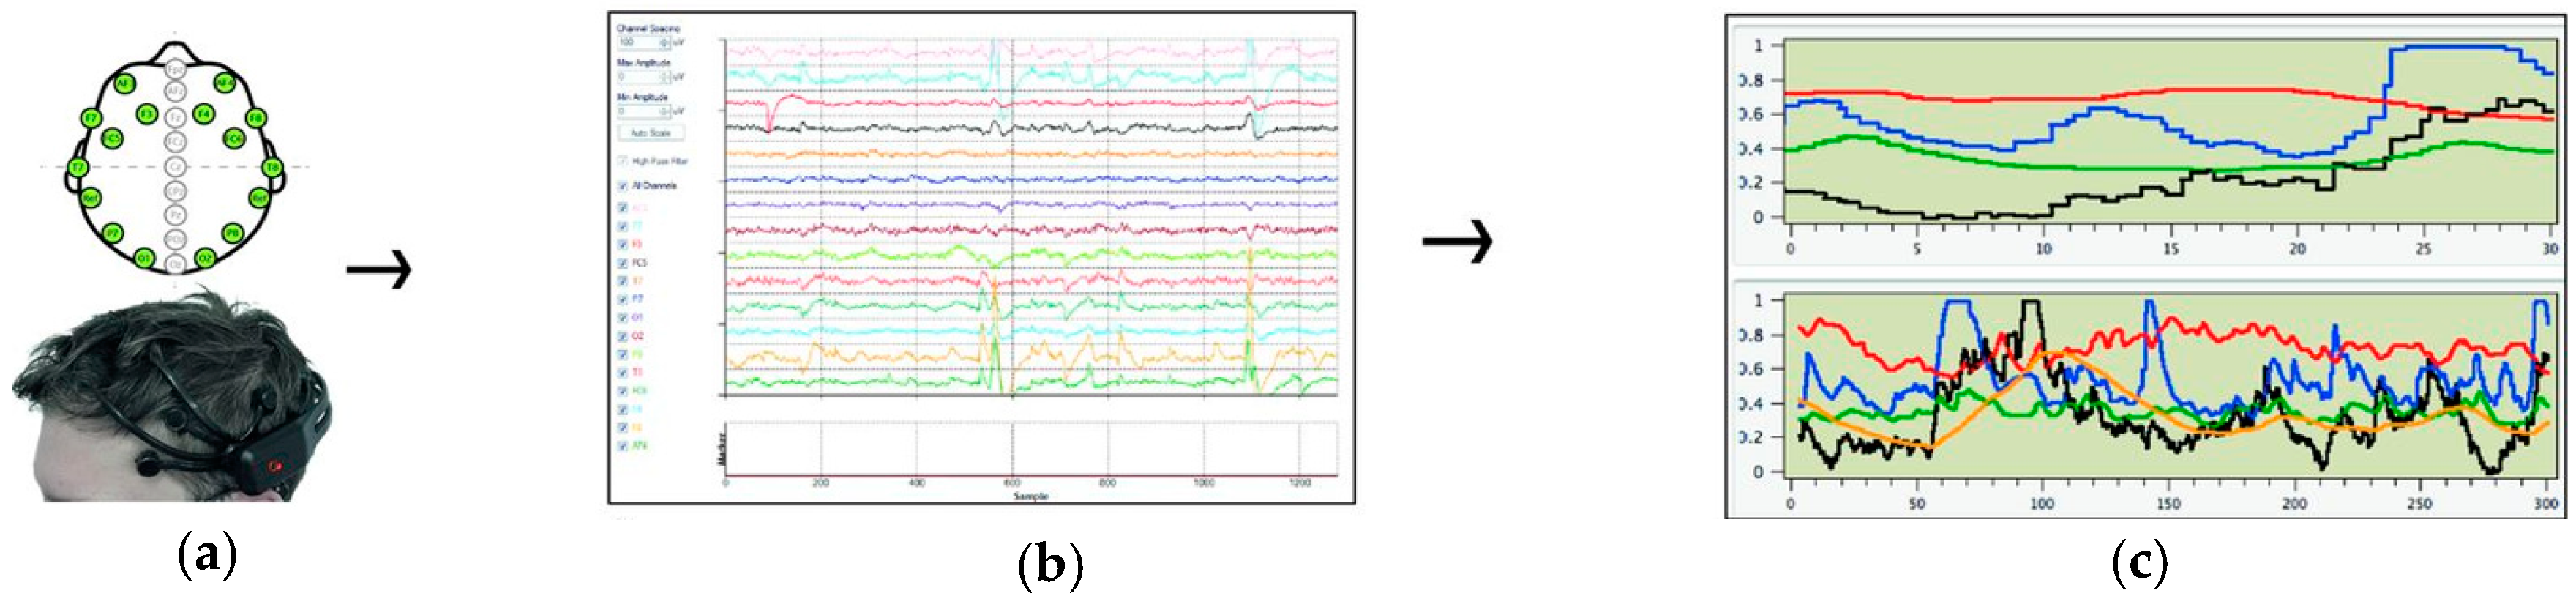
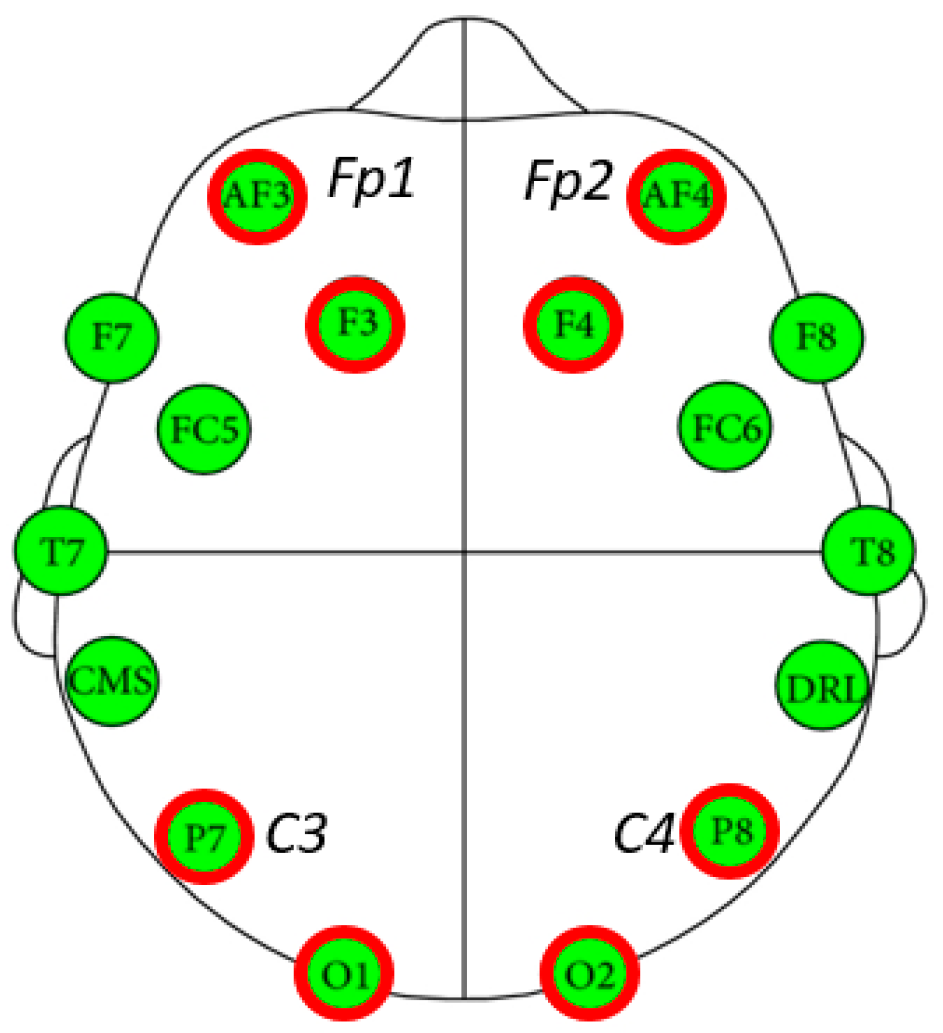
2.4.2. EEG outcome Measures

We selected the Emotiv EPOC EEG device for this study. It consists of 14 sensors that take readings from activation sites located on the surface of the brain. It also includes a two-axis gyroscope to detect the wearer’s head motion and orientation [49]. Visual stimuli were presented on a 19-inch LCD monitor. Two software, Emotiv Test Bench and OpenVibe, were used to capture raw EEG outputs from the headset (Figure 2).
In order to capture four main independent bands: (1) relative theta (4–8Hz), which indicates deep sleep, restfulness, and conversely excitement or agitation when delta waves are suppressed; (2) relative alpha (8–15 Hz), which indicates relaxed alertness, restful and meditative states; (3) relative beta (15–30 Hz), which indicates wakefulness, alertness, mental engagement and conscious processing of information; (4) relative gamma (from 30 Hz and up), which indicates creating a unity of conscious perception. EEG data of left and right prefrontal (Fp1, Fp2), left and right frontal lobe (F3, F4), left and right parietal lobe (P3, P4), and left and right occipital lobes (O1, O2) were extracted from data of 14 channels (Figure 3). The relative power value for each frequency were derived after calculating the absolute power of each frequency of each band using the power spectrum of each frequency.
The changes in the relative power values of each band were analyzed to examine the participants’ brain responses to day and night visual stimuli. The average EEG frequency in this study is the background EEG value (the average value of the primary EEG for white photo stimulation) minus the average of the EEG for photo stimulation.

2.5. Data Analysis

All of the data we tested were analyzed by using SPSS 20.0. We derived the descriptive statistics from the participants’ survey and EEG frequency results. A paired t-test was carried out to verify survey results and changes by frequency ranges of EEG depending on different environmental settings. A correlation analysis was used to investigate the brain regions that are synchronized to photographic stimuli.

3. Results

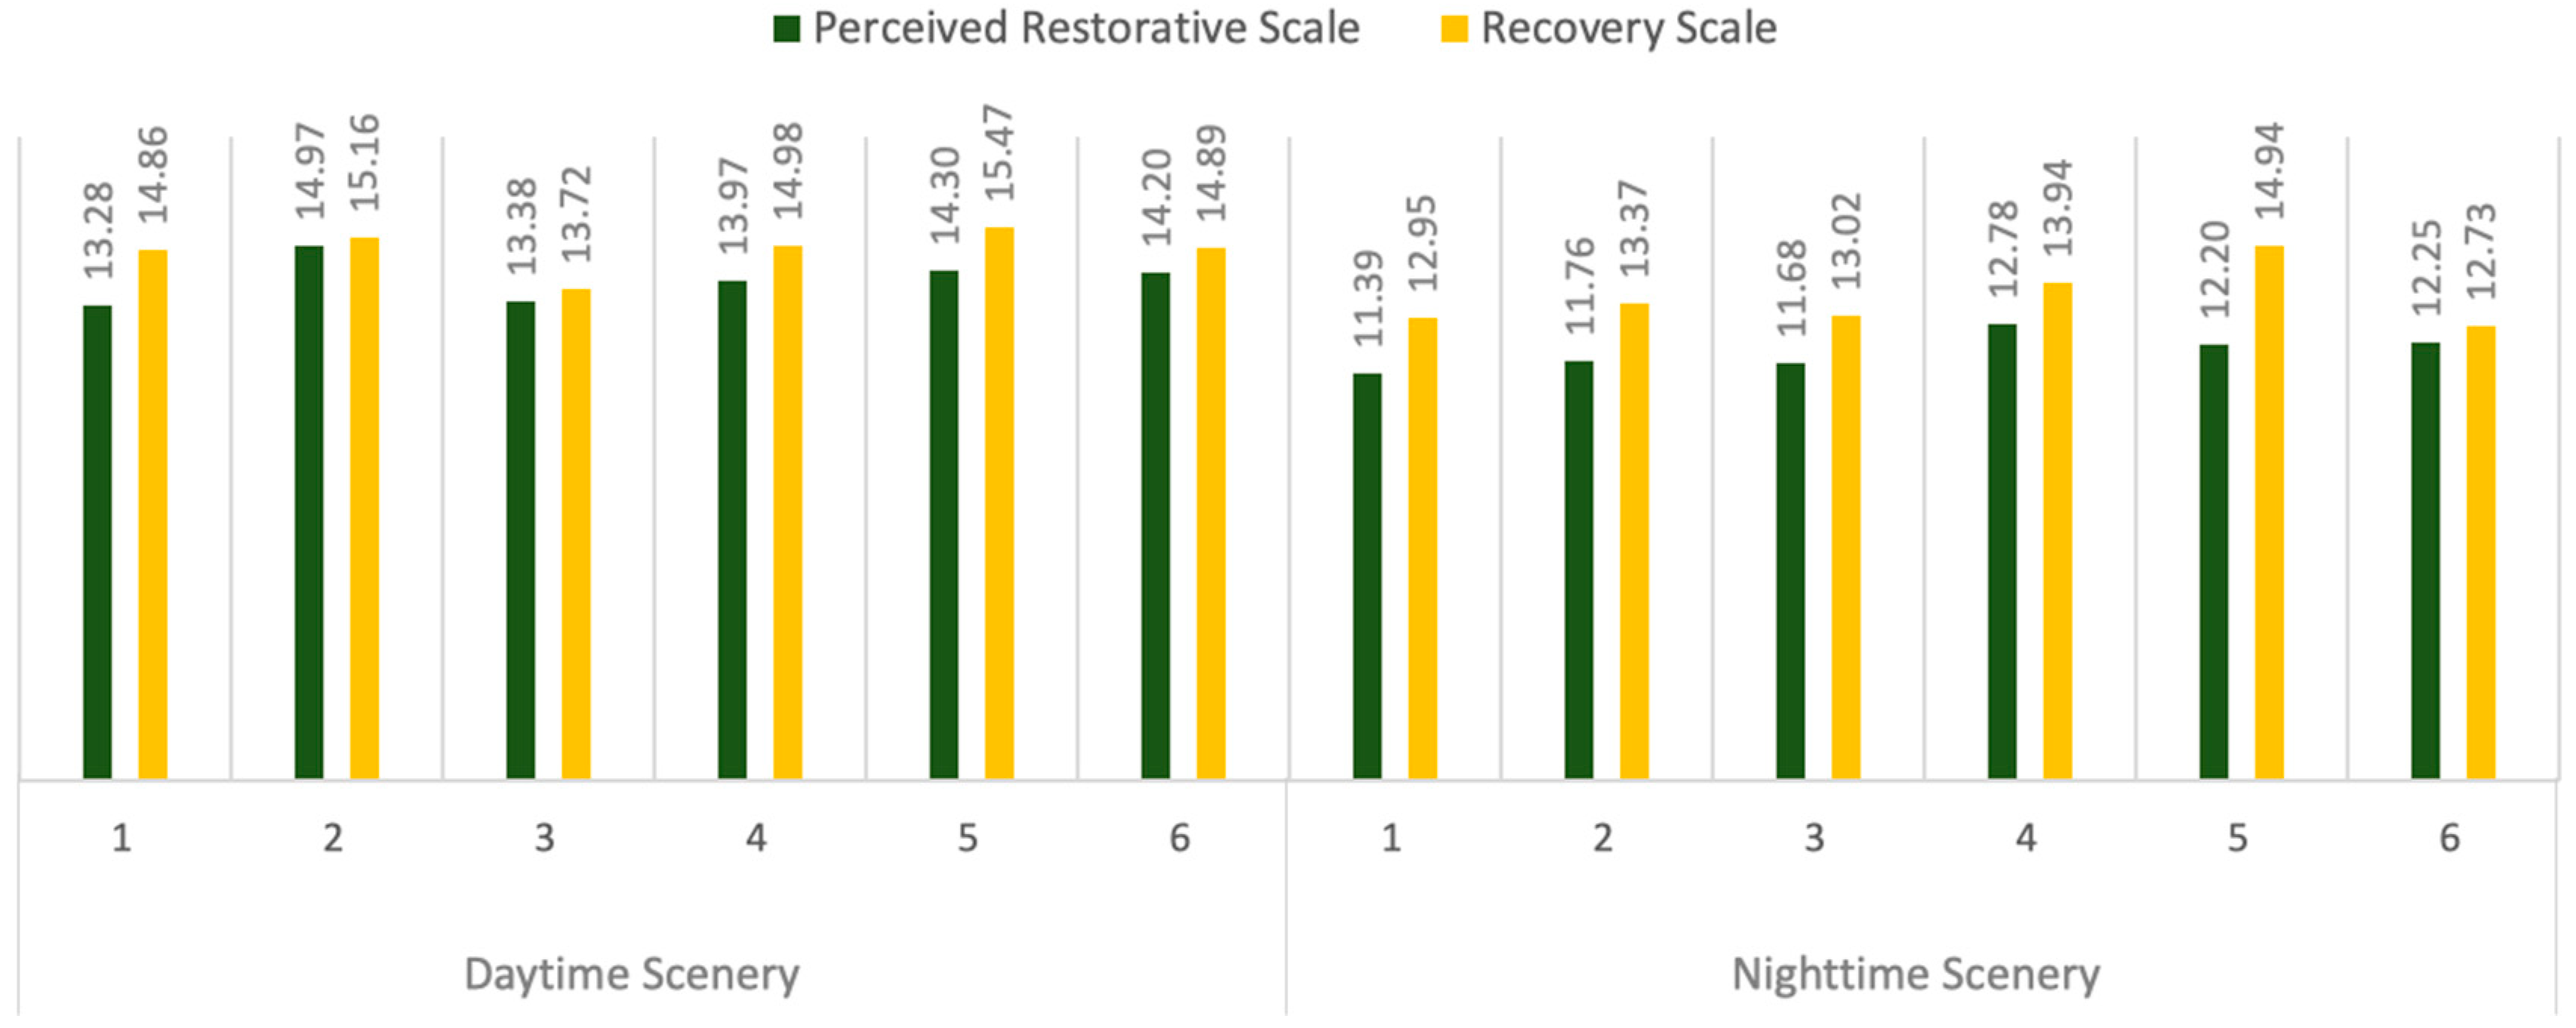
3.1. Subjective Preferences

Figure 4 illustrates the results of the self-reported level of perceived restorative and recovery scale for each photograph. For daytime scenery, the distribution of self-reported perceived restorative scale was between 13.28 (1. enclosed setting near stairs) and 14.97 (2. open setting) while the recovery scale ranged from 13.72 (3. enclosed setting surrounded by buildings) to 15.47 (5. crooked path setting). In contrast, the perceived restorative scales of nighttime were between 11.39 (1. enclosed setting near stairs) to 12.25 (4. enclosed setting surrounded by trees) while the recovery scale ranged from 12.73 (6. enclosed setting surrounded by architectural features) to 14.94 (5. crooked path setting). The highest mean in perceived restorative scale for daytime scenery was in photo set 2 (open setting). The highest mean in recovery scale for daytime scenery was in photo set 5 (crooked path setting).
Comparing the average between the two groups, the level of perceived restorative and recovery scales, in general, were higher in daytime scenery. The results of the paired sample t-test showed that both of the daytime scenery’s perceived restorative (t = 6.12, p < 0.01) and recovery scales (t = 5.11, p < 0.01) were significantly higher than the perceived restorative and recovery scales of nighttime scenery (Table 2). Beyond the daytime-nighttime comparison, the self-reported data indicates that natural scenes are rated more positively than urban scenes, which is consistent with the existing findings in the literature [52].

3.2. Activity of EEG Bands

There was a difference in the mean of all EEG bands (Table 3) but not all were statistically significant. The band with the most active average changes of EEG was the relative theta band. Daytime scenery stimuli activated theta band more than nighttime scenery stimuli. The relative alpha band was increased with the daytime scenery stimuli while it decreased with the nighttime scenery stimuli. In the case of the relative beta band, the average EEG for the nighttime scenery did not change much. However, the relative beta band’s average EEG decreased for the daytime scenery stimuli. For the relative gamma band, both daytime and nighttime scenery stimuli showed a tendency to decrease- therefore, not as active in comparison to other bands. The average EEG of the relative gamma band for the daytime scenery stimuli showed a greater decrease in comparison to the nighttime scenery stimuli.

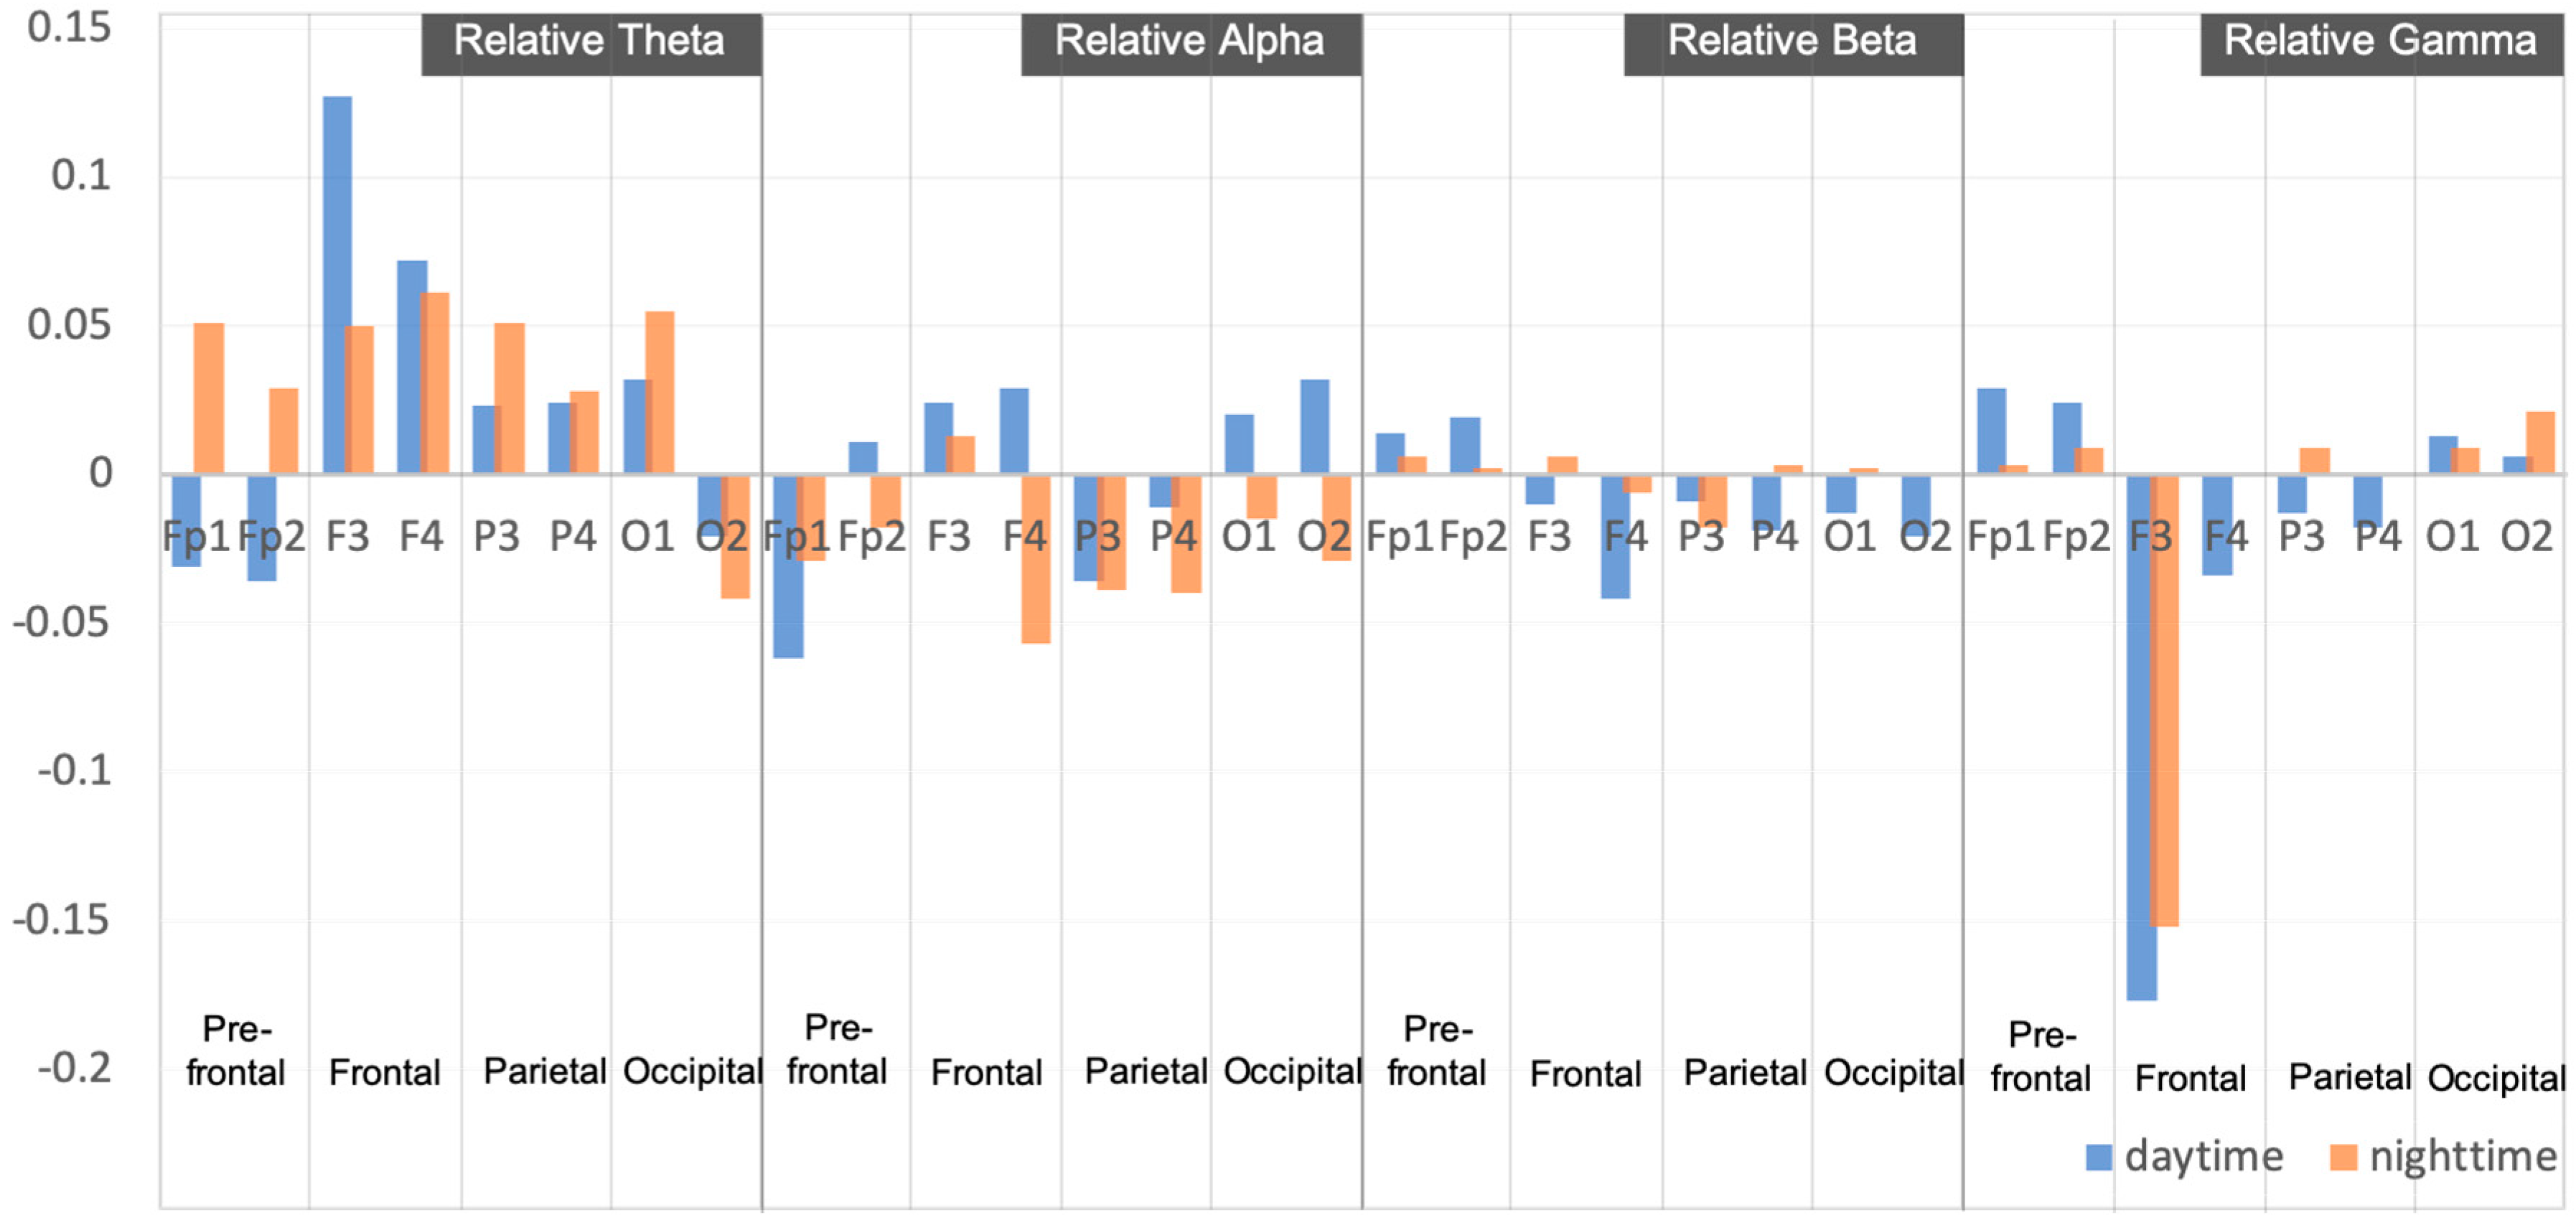
3.3. Comparison of EEG Activity on the Brain Region

Table 4 and Figure 5 indicate changes in EEG activity and the statistical significance of EEG averages from the results of the paired sample t-test. Each electrode for measuring EEG was placed according to the brain region.
The average EEG of daytime scenery stimuli and nighttime scenery stimuli varied depending on the band and the region of the brain. The average EEG in the relative theta band of the daytime scenery stimuli decreased in the prefrontal (Fp1, Fp2) and occipital (O2) channel compared with the background frequency while the average EEG of the other channels increased. More specifically, we found EEG as most active in the frontal lobe region. The average EEG of the nighttime scenery stimuli showed an increase in all channels except for the occipital lobe (O2). Both daytime and nighttime scenery stimuli showed differences in EEG activation between the frontal lobe (F3, F4), parietal lobe (P3, P4), and occipital lobe (O1). Our results show a significant difference in the prefrontal lobe region (Fp1, Fp2), which tends to show activity when the subject is processing new information whereas the activity is significantly decreased when the subject is familiar with the task.
For the relative alpha bands, the average EEG decreased in the most channels. The mean EEG of nighttime scenery stimuli was lower than that of daytime scenery stimuli. In the case of daytime scenery stimuli, mean value of the relative alpha band was increased only in the frontal lobe (F3, F4) and occipital lobe (O1, O2). In the parietal lobes (P3, P4), the mean EEG of relative alpha waves were decreased in both daytime and nighttime sceneries. In contrast, the degree of activation was opposite in the occipital lobes (O1, O2).
For the relative beta bands, the degree of change tends to be insignificant compared to other EEG bands. Channels with opposite tendencies for the mean EEG between two stimuli were located in the frontal lobe (F3), parietal lobe (P4), and occipital lobe (O1). The mean of the frontal lobe (Fp1, Fp2) region increased, while the frontal lobe (F4), parietal lobe (P3), and occipital lobe (O2) channels decreased. The average EEG of nighttime scenery stimuli did not change in the occipital area.
In the case of the relative gamma band, the average EEG on both prefrontal (Fp1, Fp2) and occipital (O1, O2) regions simultaneously increased while the frontal regions (F3, F4) decreased. In particular, the mean of F3 channel in the relative gamma band showed greater decrease compared to the other band channels.
We found differences in the average value between the two stimuli in the occipital region (P3, P4). The mean of the daytime landscape stimuli decreased, and the average value of the nighttime scenery stimuli increased. Channels with significant statistical differences were Fp1 (t = 0.172, p < 0.1), F4 (t = 2.049, p < 0.5), and O2 (t = 3.858, p < 0.01) in the relative theta band, Fp1 (t = 0.172, p < 0.1), Fp2 (t = 0.172, p < 0.1), and F4 (t = 2.409, p < 0.5) in the relative alpha band, Fp2 (t = 1.962, p < 0.5) in the relative beta band, and F3 (t = 0.240, p < 0.5) in the relative gamma band.

3.4. Correlation Analysis of EEG Bands

3.4.1. Daytime Scenery Stimuli

To investigate the regions of the brain synchronized to process information on daytime stimuli, we analyzed the correlation between the EEG means measured in the prefrontal, frontal, parietal and posterior lobes of the EEG bands. We identified several areas that indicated a significant statistical correlation (|r| > 0.5).
There were three parts that had strong correlations at |r| > 0.9. Among them, two places indicate a negative correlation- which means when one part is activated, the other part is inversely inactivated: the prefrontal lobe of beta band—the prefrontal lobe of theta band (r = −0.982, p < 0.01) and the frontal lobe of gamma band—the prefrontal lobe of theta band (r = −0.922, p < 0.01). In contrast, the prefrontal lobe of gamma band and the prefrontal area of beta band (r = 0.959, p < 0.01) showed a strong positive correlation. They were activated simultaneously with any external stimulation. It is notable that the brain region with a strong correlation (|r| > 0.9) to the daytime scenery stimuli has generally appeared in the prefrontal and frontal lobe.
Among all the EEG bands, the relative alpha band has the most correlations of left—right side of the brain with a level of significance at |r| > 0.7: the parietal lobe of alpha band—the frontal lobe of alpha band (r = 0.701, p < 0.01), the occipital lobe of alpha band—the frontal lobe of alpha band (r = 0.708, p < 0.01), the occipital lobe of alpha band—the parietal lobe of alpha band (r = 0.793, p < 0.01). Among the occipital lobe of the EEG bands, the parietal lobe of alpha band—the occipital lobe of gamma band (r = −0.714, p < 0.01) showed a strong correlation with |r| > 0.7 in the daytime scenery stimuli. Finally, 46 of the 120 pairs showed statistically significant correlations (p < 0.05) with the daytime scenery stimuli (see detail in Table 5).

3.4.2. Nighttime Scenery Stimuli

There was only one area with a strong correlation at |r| > 0.9 in the nighttime scenery stimuli: the prefrontal lobe of beta band—the prefrontal lobe of theta band (r = −0.944, p < 0.01). The areas of high correlation with |r| > 0.8 were the prefrontal lobe of gamma band—the prefrontal lobe of theta band (r = −0.733, p < 0.01) and the prefrontal lobe of gamma band—the prefrontal of beta band (r = 0.812, p < 0.01). Among all the EEG bands, the relative alpha band had the most amount of statistical correlations. The correlation showed a significant level (|r| > 0.7) with the nighttime scenery stimuli the frontal lobe of alpha band—the prefrontal lobe of alpha band (r = 0.828, p < 0.01), the parietal lobe of alpha band—the frontal lobe of alpha band (r = 0.706, p < 0.01), and the occipital lobe of alpha band—the parietal lobe of alpha band (r = 0.778, p < 0.01).
The number of statistically significant correlations (p < 0.05) was higher for the nighttime scenery stimuli than for the daytime scenery stimuli. This implies that participants are more likely to need the various areas of the brain in order to process the nighttime scenery stimuli in comparison to the daytime scenery stimuli. Overall, 52 of the 120 pairs showed significant correlations (p < 0.05) with the nighttime scenery stimuli (see detail in Table 6).

4. Discussion

This study analyzed the relationship between daytime and nighttime scenery upon various environmental settings focusing on the restorative and recovery effect.
The results of both self-reported retroactive and recovery scales indicate that daytime scenery is rated more positively than nighttime scenery. Slides which include more natural environment composition tend to draw more attention than the built environment among the six photo-sets with different environmental settings.
Summarized results of participants’ EEG responses on daytime scenery and nighttime scenery stimuli are as follows. First, compared to other brain wave bands, activation of the relative theta band was more prominent. Generally, the theta band is related to emotional processing. Klimesch [53] and Hutchingson [54] reported that the theta band is involved in a deeply internalized, quiet state of physical, emotional, and mental activities while Levine [55] pointed out that it contributes to creativity and learning abilities. Based on these results, it can be inferred that both daytime and nighttime scenery stimuli act as a stimulant to invoke emotions. The relative alpha band was activated by the daytime scenery stimuli while decreased in activity with the nighttime scenery stimuli. Researchers who studied EEG changes with visual stimuli have reported that an increase in the bottom-up visual attention leads to a significant decrease of the alpha wave [56,57,58,59,60]. Our findings indicate that the nighttime scenery stimuli led to more visual attention than the daytime scenery stimuli. This consistent with existing studies that also confirms a positive relationship between restorative, recovery effects and alpha wave [3,18,33,47,61]. The changes in the relative beta band are also consistent with findings from the changes of the relative alpha band. The daytime scenery stimuli decreased the activity in the relative beta band in comparison to the nighttime scenery stimuli. When presenting a task requiring attention to the subject, brain wave changes described as asynchronous or ∂-blocking phenomenon occurs and a beta wave which is a rapid wave appears [62,63]. This can be seen as supporting the results of previous studies that the nighttime landscape stimuli lead to heightened attention and concentration in the human brain [64]. As both daytime and nighttime sceneries became a stimulating factor, the activity in relative beta bands and gamma bands decreased. This indicates that daytime nor nighttime sceneries did not negatively affect participants, such as a cause of stress or anxiety. According to Fitzgibbon et al. [65], the gamma wave increases when performing tasks requiring a high degree of perception, and Tao et al. [66] also posited that this could be a useful measurement criterion for measuring cognitive impairment. In other words, these two stimuli were not tasks requiring high cognitive ability or calculation--reasoning ability.
Second, our results show the relative theta band of nighttime scenery stimuli was activated while the daytime scenery stimuli was decreased. The prefrontal lobe usually becomes active when processing new information, otherwise, its activity significantly reduced when the task becomes familiar [67]. This implies that participants were more familiar with daytime scenery than nighttime scenery as well as a strong prediction that there is a negative relationship between the restorative, recovery effects and the activation of prefrontal lobe. Future research should focus on finding explicit reasons for this negative relationship. The averages of all channels in the parietal lobe decreased in both the daytime and nighttime scenery stimuli in the case of the relative alpha. Simons et al. [68] reported that the parietal lobes are responsible for emotional responses and high sensitivity photos lead to a reduction in the alpha power of parietal lobe. Although it cannot be exactly ascertained whether the landscape stimuli affected participants, there is a possibility that both stimuli served as a factor in mediating their emotional responses. The occipital lobe is a visual center associated with the role of looking at objects, and the brain waves of two scenery stimuli show opposite results. Our findings show EEG activation with daytime scenery stimuli and decreased activation with nighttime scenery stimuli. In the case of the relative beta and gamma band, the prefrontal region was most active in comparison to other regions. However, among them, the F3 channel of the relative gamma band showed the greatest decrease for both stimuli. Future research needs to further investigate the causal links for this phenomenon.
Finally, three brain regions were strongly correlated at |r| > 0.9 in the daytime scenery stimuli. Only one brain region was strongly correlated at |r| > 0.9 in the nighttime scenery stimuli. All of the regions were related to the prefrontal lobe, and also had a high correlation with the prefrontal lobe in both the daytime and nighttime scenery stimuli. The relative alpha bands had the most frequent correlations at |r| > 0.7 between both the daytime and nighttime stimuli in comparison to other bands. 52 pairs showed significant correlations (p < 0.05) in the nighttime scenery stimuli while 46 pairs in the daytime scenery stimuli. The participants required regions of the brain to simultaneously activate when processing information about nighttime scenery stimuli. Since restorative and recovery effects pursue the status of being away from intended attention, this result is consistent with the self-reported restorative and recovery scale.

5. Conclusions

This study is an investigative study to examine characteristics of the restorative and recovery effects of daytime and nighttime scenery. The subjective data indicates that daytime sceneries are rated more positively than nighttime sceneries in terms of restorative and recovery effects. This also confirms restorative theory indicating a positive psychological effect of nature-environment scenes. In the case of EEG data, both the daytime and nighttime scenery stimuli activated the relative theta band more than other bands. For the relative alpha band, it was activated by the daytime scenery stimuli, which decreased with nighttime sceneries. This result is consistent with previous studies demonstrating a positive relationship between restorative, recovery feeling and the alpha wave. Specifically, there were significant differences on prefrontal and frontal lobes. From our analysis, 46 pairs of EEG bands and brain regions showed significant correlation with the daytime scenery stimuli (p < 0.05) while 53 pairs of nighttime scenery stimuli showed significant correlations (p < 0.05). Participants use simultaneous regions of the brain when engaging in task that entails processing new information, particularly when presented with the nighttime stimuli. This, as our results demonstrate, is negatively associated with perceived feelings of restoration and recovery.
Our findings indicate that daytime and nighttime scenery affect emotions and human brain response in terms of their restorative and recovery effects. This study measured the perceptions broadly with daytime and nighttime landscape photographic stimulations, using both verbal and non-verbal methods. The methods utilized in this study presents a useful research design for evaluating environmental elements that cause restorative and recovery effects.
This study describes the initial evidence that EEG responses are different depending on daytime or nighttime sceneries. However, there are certain limitations. The first is that there were not enough environmental settings to conduct experiments, even though we used the representative environmental settings within the Virginia Tech campus effectively. Second, there is a possibility that the presentation of the scenery in a static way, such as a photograph, does not capture the dynamic characteristics of the scenery, thus falling short of capturing the meaning and feelings of the actual scenery. In a real environmental setting, a contrast from a laboratory setting, results may show a slightly different outcome. Even accounting for these two limitations, the findings from this study demonstrate the evaluative potential of incorporating EEG with subjective measures, which opens up new possibilities for future research on landscape evaluation.

Author Contributions

All authors have contributed to the intellectual content of this paper. The first author, S.C., developed the flow of this study. He was also responsible for all statistical analysis. M.K. contributed to discussion part. S.H. and Y.K. substantially contributed to the research design and wrote the manuscript and contributed to interpretation of all results and discussion.

Funding

This research was supported by a grant (Grant 18CTAP-C129890-02) from Land, Infrastructure and Transportation R&D Program (Science Technology Promotion Research Project) funded by Ministry of Land, Infrastructure and Transport of Korean government. This work was supported by 2019 Hongik University Research Fund.

Conflicts of Interest

The authors declare no conflict of interest.

References

  1. Appleton, J. Landscape evaluation: The theoretical vacuum. Trans. Inst. Br. Geogr. 1975, 66, 120–123. [Google Scholar] [CrossRef]
  2. Appleton, J. The Experience of Landscape; Wiley: Chichester, UK, 1996. [Google Scholar]
  3. Hartig, T. Nature experience in transactional perspective. Landsc. Urban Plan. 1993, 25, 17–36. [Google Scholar] [CrossRef]
  4. Kaplan, R. The nature of the view from home: Psychological benefits. Environ. Behav. 2001, 33, 507–542. [Google Scholar] [CrossRef]
  5. Lu, D.; Burley, J.; Crawford, P.; Schutzki, R.; Loures, L. Quantitative methods in environmental and visual quality mapping and assessment: A Muskegon, Michigan watershed case study with urban planning implications. In Advances in Spatial Planning; IntechOpen: London, UK, 2012. [Google Scholar]
  6. Partin, S.; Burley, J.B.; Schutzki, R.; Crawford, P. Concordance between Photographs and Computer Generated 3D Models in a Michigan Highway Transportation Setting. Anhalt University of Applied Sciences, Wichmann: Köthen, Germany. 2012, pp. 482–489. Available online: http://193.25.34.143/landschaftsinformatik-4.2.6/fileadmin/user_upload/_temp_/2012/Proceedings/Buhmann_2012_56_Partin_et_al.pdf (accessed on 7 June 2019).
  7. Joliet, F.; Landon, W.; Yu, W.; Burley, J.B. The silent language of artistic representations in landscape: Alentejo (Portugal), Yellowstone (USA) and Kaifeng (PR of China). Int. J. Energy Environ. 2011, 5, 618–628. [Google Scholar]
  8. Mo, F.; Le Cléach, G.; Sales, M.; Deyoung, G.; Burley, J. Visual and environmental quality perception and preference in the People’s Republic of China, France, and Portugal. Int. J. Energy Environ. 2011, 5, 549–555. [Google Scholar]
  9. Mazure, A.; Burley, J. An aesthetic, economic, and ecological equation/theories for predicting environmental quality: Including a GIS-based remote access application. In Proceedings of the Our Shared Landscape: Integrating Ecological, Socio-Economic and Aesthetics Aspects in Landscape Planning and Management, Ascona, Switzerland, 26 May 2005; pp. 68–69. [Google Scholar]
  10. Kaplan, R.; Kaplan, S.; Ryan, R. With People in Mind: Design and Management of Everyday Nature; Island Press: London, UK, 1998. [Google Scholar]
  11. Ulrich, R.S. View through a window may influence recovery from surgery. Science 1984, 224, 420–421. [Google Scholar] [CrossRef]
  12. Kaplan, R.; Kaplan, S. The Experience of Nature: A Psychological Perspective; CUP Archive: Cambridge, UK, 1989. [Google Scholar]
  13. Han, K.-T. A reliable and valid self-rating measure of the restorative quality of natural environments. Landsc. Urban Plan. 2003, 64, 209–232. [Google Scholar] [CrossRef]
  14. Hull IV, R.B.; Michael, S.E. Nature-based recreation, mood change, and stress restoration. Leis. Sci. 1995, 17, 1–14. [Google Scholar] [CrossRef]
  15. Kyoung, Y.-Y. Beneficial effect of forest landscape on relieving stress based on psychological and physiological measures. J. Korean Inst. Landsc. Archit. 2003, 31, 70–82. [Google Scholar]
  16. Yi, Y. Characteristic analysis of natural landscape: Based on the assessments of naturalness by landscape professionals and laypersons. J. Korean Inst. Landsc. Archit. 2004, 31, 1–14. [Google Scholar]
  17. Yi, Y.-K.; Yi, P.-I. The Impact of Landscape Type on Urban Office Workers’ Stress and Cognitive Performance-Comparison between Natural and Urban Landscape. J. Korean Inst. Landsc. Archit. 2006, 33, 1–11. [Google Scholar]
  18. Ulrich, R.S. Natural versus urban scenes: Some psychophysiological effects. Environ. Behav. 1981, 13, 523–556. [Google Scholar] [CrossRef]
  19. Ulrich, R.S. Visual landscapes and psychological well-being. Landsc. Res. 1979, 4, 17–23. [Google Scholar] [CrossRef]
  20. Parsons, R.J. Recovery from Stress during Exposure to Videotaped Outdoor Environments; The University of Arizona: Tucson, AZ, USA, 1991. [Google Scholar]
  21. Parsons, R.; Tassinary, L.G.; Ulrich, R.S.; Hebl, M.R.; Grossman-Alexander, M. The view from the road: Implications for stress recovery and immunization. J. Environ. Psychol. 1998, 18, 113–140. [Google Scholar] [CrossRef]
  22. Ulrich, R.S. Influences of passive experiences with plants on individual well-being and health. Role Hortic. Hum. Well-Being Soc. Dev. 1992. Available online: http://tci.ncl.edu.tw/cgi-bin/gs32/gsweb.cgi?o=dnclret&s=id=%22RF10006648536%22.&searchmode=basic&tcihsspage=tcisearch_opt2_search (accessed on 15 June 2019).
  23. Van den Berg, A.E.; Koole, S.L.; Van der Wulp, N.Y. Environmental preference and restoration:(How) are they related? J. Environ. Psychol. 2003, 23, 135–146. [Google Scholar] [CrossRef]
  24. Park, J.-M.; Yoon, C.-S.; Park, E.-S. A Study on the characteristics of preferred housing interior image and sensibility of university students. J. Korean Hous. Assoc. 2011, 22, 97–106. [Google Scholar] [CrossRef]
  25. Roe, J.J.; Aspinall, P.A.; Mavros, P.; Coyne, R. Engaging the brain: The impact of natural versus urban scenes using novel EEG methods in an experimental setting. Environ. Sci. 2013, 1, 93–104. [Google Scholar] [CrossRef]
  26. Küller, R. A semantic test for use in cross-cultural studies. Man-Environ. Syst. 1979, 9, 253–256. [Google Scholar]
  27. Zuckerman, M. Development of a situation-specific trait-state test for the prediction and measurement of affective responses. J. Consult. Clin. Psychol. 1977, 45, 513. [Google Scholar] [CrossRef]
  28. Hartig, T.; Kaiser, F.G.; Bowler, P.A. Further Development of a Measure of Perceived Environmental Restorativeness; Institutet för bostads-och urbanforskning: Uppsala, Sweden, 1997. [Google Scholar]
  29. Tilley, S.; Neale, C.; Patuano, A.; Cinderby, S. Older people’s experiences of mobility and mood in an urban environment: A mixed methods approach using electroencephalography (EEG) and interviews. Int. J. Environ. Res. Public Health 2017, 14, 151. [Google Scholar] [CrossRef] [PubMed]
  30. Lee, H.-J.; Choi, Y.-R.; Chun, C.-Y. Effect of indoor air temperature on the occupants’ attention ability based on the electroencephalogram analysis. J. Archit. Inst. Korea 2012, 28, 217–225. [Google Scholar]
  31. Kim, J.-Y.; Lee, H.-S. A study on interior wall color based on measurement of emotional responses. Korean J. Sci. Emot. Sensib. 2009, 12, 205–214. [Google Scholar]
  32. Hwang, Y.-S.; Kim, S.-Y.; Kim, J.-Y. An analysis of youth EEG based on the emotional color scheme images by different space of community facilities. Korean Inst. Inter. Des. J. 2013, 22, 171–178. [Google Scholar]
  33. Ulrich, R.S.; Simons, R.F.; Losito, B.D.; Fiorito, E.; Miles, M.A.; Zelson, M. Stress recovery during exposure to natural and urban environments. J. Environ. Psychol. 1991, 11, 201–230. [Google Scholar] [CrossRef]
  34. Ottosson, J.; Grahn, P. The role of natural settings in crisis rehabilitation: How does the level of crisis influence the response to experiences of nature with regard to measures of rehabilitation? Landsc. Res. 2008, 33, 51–70. [Google Scholar] [CrossRef]
  35. Herzog, T.R.; Maguire, P.; Nebel, M.B. Others Assessing the restorative components of environments. J. Environ. Psychol. 2003, 23, 159–170. [Google Scholar] [CrossRef]
  36. Ajzen, I.; Fishbein, M. Understanding Attitudes and Predicting Social Behavior; Prentice Hall: Upper Saddle Riever, NJ, USA, 1980. [Google Scholar]
  37. Natori, Y.; Chenoweth, R. Differences in rural landscape perceptions and preferences between farmers and naturalists. J. Environ. Psychol. 2008, 28, 250–267. [Google Scholar] [CrossRef]
  38. Ivarsson, C.T.; Hagerhall, C.M. The perceived restorativeness of gardens–Assessing the restorativeness of a mixed built and natural scene type. Urban For. Urban Green. 2008, 7, 107–118. [Google Scholar] [CrossRef]
  39. Ulrich, R.S. Aesthetic and affective response to natural environment. In Behavior and the Natural Environment; Springer: Berlin, Germany, 1983; pp. 85–125. [Google Scholar]
  40. Kaplan, S. The restorative benefits of nature: Toward an integrative framework. J. Environ. Psychol. 1995, 15, 169–182. [Google Scholar] [CrossRef]
  41. Herzog, T.R.; Black, A.M.; Fountaine, K.A.; Knotts, D.J. Reflection and attentional recovery as distinctive benefits of restorative environments. J. Environ. Psychol. 1997, 17, 165–170. [Google Scholar] [CrossRef]
  42. Purcell, T.; Peron, E.; Berto, R. Why do preferences differ between scene types? Environ. Behav. 2001, 33, 93–106. [Google Scholar] [CrossRef]
  43. Staats, H.; Kieviet, A.; Hartig, T. Where to recover from attentional fatigue: An expectancy-value analysis of environmental preference. J. Environ. Psychol. 2003, 23, 147–157. [Google Scholar] [CrossRef]
  44. Herzog, T.R.; Bosley, P.J. Tranquility and preference as affective qualities of natural environments. J. Environ. Psychol. 1992, 12, 115–127. [Google Scholar] [CrossRef]
  45. Lee, S.H.; Hyun, M.H. The factor structure of the Korean version of the Perceived Restorativeness Scale (PRS). Korean J. Health Psychol. 2003, 8, 229–241. [Google Scholar]
  46. Lee, S.; Hyun, M. The comparison of natural environment and restorative environment in stress-buffering effects. Korean J. Psychol 2004, 9, 609–632. [Google Scholar]
  47. Hartig, T.; Kaiser, F.G.; Bowler, P.A. Psychological restoration in nature as a positive motivation for ecological behavior. Environ. Behav. 2001, 33, 590–607. [Google Scholar] [CrossRef]
  48. Ohly, H.; White, M.P.; Wheeler, B.W.; Bethel, A.; Ukoumunne, O.C.; Nikolaou, V.; Garside, R. Attention restoration theory: A systematic review of the attention restoration potential of exposure to natural environments. J. Toxicol. Environ. Health Part B 2016, 19, 305–343. [Google Scholar] [CrossRef]
  49. Kim, J.-H.; Kim, J.-Y.; Kim, S.-H. A Study on the Attention Concentration Properties in Convergent Exploration Situations in Cafe Space-Focusing on Gaze and Brain wave Data Analysis. Korean Inst. Inter. Des. J. 2016, 25, 30–40. [Google Scholar] [CrossRef]
  50. Emotiv Homepage. Available online: https://www.emotiv.com/ (accessed on 28 May 2019).
  51. Mavros, P.; Coyne, R.; Roe, J.; Aspinall, P. Engaging the brain: Implications of mobile EEG for spatial representation. In Proceedings of the 30th International Conference on Education and Research in Computer Aided Architectural Design in Europe, Prague, Czech Republic, 12–14 September 2012; Volume 2, pp. 657–665. [Google Scholar]
  52. White, M.; Smith, A.; Humphryes, K.; Pahl, S.; Snelling, D.; Depledge, M. Blue space: The importance of water for preference, affect, and restorativeness ratings of natural and built scenes. J. Environ. Psychol. 2010, 30, 482–493. [Google Scholar] [CrossRef]
  53. Klimesch, W. Memory processes described as brain oscillations in the EEG-alpha and theta bands. Psycoloquy 1995, 6. Available online: https://psycnet.apa.org/record/2000-03258-002 (accessed on 15 June 2019).
  54. Hutchinson, M. Mega Brain: New Tools and Techniques for Brain Growth and Mind Expansion; Beech Tree; William Morrow: New York, NY, USA, 1986. [Google Scholar]
  55. Levine, P.H. Transcendental meditation and the science of creative intelligence. Phi Delta Kappan 1972, 54, 231–235. [Google Scholar]
  56. Vecchiato, G.; Astolfi, L.; Tabarrini, A.; Salinari, S.; Mattia, D.; Cincotti, F.; Bianchi, L.; Sorrentino, D.; Aloise, F.; Soranzo, R.; et al. EEG analysis of the brain activity during the observation of commercial, political, or public service announcements. Comput. Intell. Neurosci. 2010, 2010, 6. [Google Scholar] [CrossRef] [PubMed]
  57. Reeves, B.; Thorson, E.; Rothschild, M.L.; McDonald, D.; Hirsch, J.; Goldstein, R. Attention to television: Intrastimulus effects of movement and scene changes on alpha variation over time. Int. J. Neurosci. 1985, 27, 241–255. [Google Scholar] [CrossRef] [PubMed]
  58. Miller, W. A view from the inside: Brainwaves and television viewing. J. Q. 1985, 62, 508–514. [Google Scholar] [CrossRef]
  59. Weinstein, S.; Appel, V.; Weinstein, C. Brain-activity responses to magazine and television advertising. J. Advert. Res. 1980. Available online: https://psycnet.apa.org/record/1980-33676-001 (accessed on 15 June 2019).
  60. Mulholland, T.; Runnals, S. Increased occurrence of EEG alpha during increased attention. J. Psychol. 1962, 54, 317–330. [Google Scholar] [CrossRef]
  61. Chang, C.-Y.; Chen, P.-K.; Hammitt, W.E.; Machnik, L. Psychophysiological responses and restorative values of wilderness environments. In Proceedings of the Science and Stewardship to Protect and Sustain Wilderness Values: Eighth World Wilderness Congress Symposium, Anchorage, AK, USA, 30 September–6 October 2005; Proceedings RMRS-P-49. Watson, A., Sproull, J., Dean, L., Eds.; US Department of Agriculture, Forest Service, Rocky Mountain Research Station: Fort Collins, CO, USA, 2007; Volme 49, pp. 479–484. [Google Scholar]
  62. Fernández, T.; Harmony, T.; Rodríguez, M.; Bernal, J.; Silva, J.; Reyes, A.; Marosi, E. EEG activation patterns during the performance of tasks involving different components of mental calculation. Electroencephalogr. Clin. Neurophysiol. 1995, 94, 175–182. [Google Scholar] [CrossRef]
  63. Kim, S.-H.; Choi, K.-W.; Lee, S.-R.; Jung, I.-C. The Study of Cognitive Functional Difference and EEG Spectrum Difference among Sasang Constitutions. J. Orient. Neuropsychiatry 2007, 18, 89–100. [Google Scholar]
  64. Kim, M.; Cheon, S.; Kang, Y. Use of Electroencephalography (EEG) for the Analysis of Emotional Perception and Fear to Nightscapes. Sustainability 2019, 11, 233. [Google Scholar] [CrossRef]
  65. Fitzgibbon, S.; Pope, K.; Mackenzie, L.; Clark, C.; Willoughby, J. Cognitive tasks augment gamma EEG power. Clin. Neurophysiol. 2004, 115, 1802–1809. [Google Scholar] [CrossRef]
  66. Tao, J.X.; Ray, A.; Hawes-Ebersole, S.; Ebersole, J.S. Intracranial EEG substrates of scalp EEG interictal spikes. Epilepsia 2005, 46, 669–676. [Google Scholar] [CrossRef] [PubMed]
  67. Son, Y.-J.; Lim, J.-H. Effect of Pilates Gymball Exercises on the Electroencephalogram and Cognitive Function in Mentally Disabled Persons. Phys. Korea 2017, 29, 227–233. [Google Scholar] [CrossRef] [Green Version]
  68. Simons, R.F.; Detenber, B.H.; Cuthbert, B.N.; Schwartz, D.D.; Reiss, J.E. Attention to television: Alpha power and its relationship to image motion and emotional content. Media Psychol. 2003, 5, 283–301. [Google Scholar] [CrossRef]
Figure 1. Research procedure.
Sustainability 11 03326 g001
Figure 2. Process of collecting EEG data: Emotiv EPOC records EEG signals from 14 sensors position according to the 10–20 international system: Raw EEG [(a) The electrodes location] signals are then ‘translated’ and classified in four different emotional states; (b) Output from Emotiv; (c) Output sample using Testbench software from Emotiv Control Panel and Affective suite (EEG data belongs to the authors) [50,51].
Sustainability 11 03326 g002
Figure 3. EEG measurements: The main 8 EEG areas used in this study (marked with a red boundary) [50].
Sustainability 11 03326 g003
Figure 4. Self-reported level of restorative and recover scale depending on landscape type.
Sustainability 11 03326 g004
Figure 5. Comparison of EEG activity on the brain region (n = 60), (unit: mV).
Sustainability 11 03326 g005
Table 1. Experimental images.
Set1: enclosed setting near stairsSet2: open settingSet3: enclosed setting surrounded by buildings
DaytimeSustainability 11 03326 i001Sustainability 11 03326 i002Sustainability 11 03326 i003
NighttimeSustainability 11 03326 i004Sustainability 11 03326 i005Sustainability 11 03326 i006
Set4: enclosed setting surrounded by treesSet5: crooked path settingSet6: enclosed setting surrounded by architectural features
DaytimeSustainability 11 03326 i007Sustainability 11 03326 i008Sustainability 11 03326 i009
NighttimeSustainability 11 03326 i010Sustainability 11 03326 i011Sustainability 11 03326 i012
Table 2. Paired T-test of self-reported level of restorative and recover scale (n = 60).
Daytime SceneryNighttime Scenerytp
Perceived Restorative Scale14.20 ± 1.3014.85 ± 1.436.120.000 **
Recovery Scale14.89 ± 1.2513.15 ± 1.675.110.000 **
** p < 0.01; A higher score indicates a more positive outcome.
Table 3. The result of EEG activities depending on bands. (n = 60), (unit: mV).
BandMean of EEG Frequency (SD)
(Background Stimuli—Photo Stimuli)
tp
DaytimeNighttime
Relative Theta0.024 ± 0.1880.036 ± 0.160−0.2180.267
Relative Alpha−0.020 ± 0.194−0.027 ± 0.1021.4290.403
Relative Beta−0.010 ± 0.097−0.001 ± 0.086−1.1360.162
Relative Gamma−0.021 ± 0.132−0.013 ± 0.101−1.3050.268
Values are presented as mean ± SD.
Table 4. Comparison of EEG activity on the brain region. (n = 60), (unit: mV).
Band Mean Value of the EEG (SD)
(Background Stimuli—Photo Stimuli)
tp
DaytimeNighttime
Relative ThetaFp1−0.031 ± 0.0950.051 ± 0.1010.1720.000 **
Fp2−0.036 ± 0.1930.029 ± 0.1941.1990.235
F30.127 ± 0.2500.050 ± 0.217−0.0380.970
F40.072 ± 0.2250.061 ± 0.1672.0490.045 *
P30.023 ± 0.2180.051 ± 0.1490.7480.458
P40.024 ± 0.0180.028 ± 0.141−0.3370.737
O10.032 ± 0.1720.055 ± 0.1260.9160.363
O2−0.021 ± 0.097−0.042 ± 0.1403.8580.000 **
Relative AlphaFp1−0.062 ± 0.62−0.029 ± 0.1140.1720.000 **
Fp20.011 ± 0.145−0.018 ± 0.0971.1990.015 *
F30.024 ± 0.0950.013 ± 0.110−0.0380.970
F40.029 ± 0.100−0.057 ± 0.1062.0490.045 *
P3−0.036 ± 0.107−0.039 ± 0.1010.7480.458
P4−0.011 ± 0.078−0.040 ± 0.063−0.3370.737
O10.020 ± 0.071−0.015 ± 0.0130.9160.363
O20.032 ± 0.066−0.029 ± 0.1053.8580.864
Relative BetaFp10.014 ± 0.9420.006 ± 0.105−0.2420.809
Fp20.019 ± 0.0950.002 ± 0.0911.9620.035 *
F3−0.010 ± 0.0870.006 ± 0.1010.5570.580
F4−0.042 ± 0.081−0.006 ± 0.1040.3690.714
P3−0.009 ± 0.104−0.018 ± 0.8370.2240.824
P4−0.019 ± 0.0980.003 ± 0.8390.5910.557
O1−0.013 ± 0.1050.002 ± 0.008−1.2640.211
O2−0.021 ± 0.098−0.001 ± 0.0730.3780.707
Relative GammaFp10.029 ± 0.1280.003 ± 0.1120.1930.847
Fp20.024 ± 0.1140.009 ± 0.116−7.1630.762
F3−0.177 ± 0.117−0.152 ± 0.1320.2400.011 *
F4−0.034 ± 0.126−0.001 ± 0.0750.3630.718
P3−0.013 ± 0.1390.009 ± 0.093−0.3250.746
P4−0.018 ± 0.1010.000 ± 0.014−7.6930.800
O10.013 ± 0.0900.009 ± 0.1083.7280.435
O20.006 ± 0.1100.021 ± 0.098−0.8730.386
** p < 0.01, * p < 0.05.
Table 5. Correlation analysis of EEG bands with the daytime scenery stimuli.
Correlation
12345678910111213141516
Relative ThetaPrefrontal1
Frontal0.318 **1
Parietal0.1370.480 **1
Occipital−0.0100.258 **0.712 **1
Relative AlphaPrefrontal−0.310 **−0.464−0.1550.0551
Frontal−0.233−0.419−0.477 **−0.2250.601 **1
Parietal−0.208 *−0.233 *−0.315 **−0.260 *0.607 **0.701 **1
Occipital−0.242 *−0.334 *−0.126 **−0.2130.439 **0.708 **0.793 **1
Relative betaPrefrontal−0.982 **−0.299 *−0.464−0.0720.156−0.0610.1740.1321
Frontal−0.266 *−0.631 **−0.453 **−0.0710.258 *−0.231−0.481−0.0210.404 **1
Parietal−0.102−0.310 *−0.143 *−0.238 *−0.229 **−0.315 **−0.463 **−0.308 **0.1480.529 **1
Occipital0.1980.162−0.062−0.226 **−0.495 **−0.322 **−0.324 *−0.321 **−0.2090.1400.505 **1
Relative gammaPrefrontal−0.922 **−0.472 *0.039−0.195−0.013−0.0130.0890.1490.959 **0.319 **0.130−0.1481
Frontal−0.080−0.414 **−0.145−0.342 **−0.213−0.300 **−0.409 *−0.221 *0.1400.1620.396 *0.1080.1141
Parietal0.168−0.117−0.134−0.111−0.400 **−0.572 **−0.454 **−0.417 **−0.074−0.028 **0.583 **0.315 *0.1050.443 *1
Occipital0.209−0.137−0.143−0.343 *−0.443 **−0.558 **−0.413 **−0.714 **−0.0080.0940.360*0.212 *−0.0150.351 **0.497 **1
** p < 0.01, * p < 0.05.
Table 6. Correlation analysis of EEG bands with nighttime scenery stimuli.
Correlation
12345678910111213141516
Relative ThetaPrefrontal1
Frontal0.662 **1
Parietal0.447 **0.558 **1
Occipital0.1700.2920.796 **1
Relative AlphaPrefrontal−3.297 **−0.388 **−0.321 **−0.207 *1
Frontal−0.554 **−0.278−0.371 *−0.299 *0.828 **1
Parietal−0.199−0.126−0.170−0.1950.641 **0.706 **1
Occipital−0.093−0.102−0.203−0.0290.691 **0.634 **0.778 **1
Relative betaPrefrontal−0.944 **−0.490 **−0.247 *−0.0710.1280.1460.1210.332 *1
Frontal−0.444 **−0.536 **−0.360 **−0.058−0.071−0.207−0.316 **−0.1720.316 **1
Parietal0.120−0.004−0.385 **−0.011−0.332 **−0.417 **−0.587 **−0.514 **0.2320.360 **1
Occipital0.0240.096−0.313 *−0.054−0.355 **−0.376 **−0.569 **−0.769 **0.2110.375 *0.575 **1
Relative gammaPrefrontal−0.731 *−0.314 **−0.305 *−0.0220.0520.067−0.189−0.0220.812 **0.474 **0.3970.0981
Frontal−0.071−0.597 **−0.091−0.063−0.174−0.584−0.502−0.1850.0220.233 *0.4960.1830.1251
Parietal−0.201−0.029−0.317 **−0.319*−0.101−0.378−0.322 **−0.476 **0.304 *0.429 **0.552 **0.461 **0.361 *0.361 *1
Occipital0.0500.265 *−0.042 *−0.342 **−0.355 *−0.312 *−0.370 **−0.797 **−0.0430.1090.526 **0.576 **−0.0760.1040.582 **1
** p < 0.01, * p < 0.05.

