Abstract
In the context of the recent labor shortages in Eastern European countries, Romania included, companies, organizations and decision makers need to strongly address the issue of labor motivation for increasing worker performance and also for attracting the scarce labor resources. The main goal of the research is to explore new determinants of work motivation, such as regional sustainability and also individual factors related to individual expectations. Therefore, the responsive methodology used for this purpose implies a multilevel econometric modelling, in which the first level regards individuals, and the second one consists in development regions. Moreover, the role of individual factors is tested using Vroom’s theory of expectations and filling a gap in the existing literature on work motivation in developing, post-communist economies. The main findings prove that one dimension of sustainability, namely social sustainability has a significant impact on work motivation, alongside with four dimensions of individual factors. Economic and environmental sustainability have no significant impact on work motivation in the case of Romanian workers.
1. Introduction
Work motivation is a crucial aspect for the companies and organizations as a way to increase performance, productivity and employees’ satisfaction. This is particularly important for the companies in developing economies, struggling to attract and maintain their employees, in the context of labor shortages. Currently, in some Eastern European countries, such as Romania, labor markets are affected by imbalances generated by labor shortages, but also as a consequence of long-term structural reforms. The Romanian labor market is one of the largest in the Eastern Europe, second only to the Polish one in terms of the size of labor force. After the change in the political regime and the switch from planned to market economy in 1989, the country’s economy and society suffered a number of changes that significantly affected the quality and the dimension of the labor force [1]. A large number of labor market reforms and the restructuring of economic sectors, alongside with the possibility of working abroad, put the Romanian labor market in a quite unstable situation. Currently the Romanian economy faces a severe shortage in both high skilled and low skilled employees in many sectors, such as health, construction or manufacturing (see the debate on labour shortage in the Romanian media: http://business-review.eu/news/romanian-paradox-staff-shortages-despite-high-number-of-unemployed-187128). Therefore, labor is becoming more and more a scarce resource and it is therefore crucial to take strong measures to decrease labor fluctuation at the company level, and also at the macro and meso (regional) level.
As proven by many results in the literature, also further reviewed in this paper, in the context of an increasing support and interest for sustainable development, a stable labor force is needed and work motivation is considered a strong trigger for an engaged worker. Most of the previous studies in the field have primarily analyzed the motivation in the developed countries, in the context of stable labor markets. The developed theories have mainly investigated the individual factors that lead to higher work motivation and improves workers’ job satisfaction. The current study is at the intersection of regional development, sustainability and human resources analysis, as we aim at understanding the determinants of work motivation and the role of contextual factors in the case of a developing country.
The main objective of the paper is to estimate the effects of regional sustainable development on the level of work motivation among Romanian employees based on a staged multi-level logistic regression model utilizing the hierarchical nature of the data. The first level of the analysis refers to individuals, while the second one regards Romanian development regions.
The research uses the data derived from a national representative motivation survey, collected in 2018. The hypothesis that will be tested during this research are developed in connection to the three dimensions of sustainability: social, environmental and economic, as follows:
Hypothesis 1:
A higher level of social regional sustainability contributes to a higher level of work motivation among Romanian employees.
Hypothesis 2:
A higher level of environmental regional sustainability contributes to a higher level of work motivation among Romanian employees.
Hypothesis 3:
A higher level of economic regional sustainability contributes to a higher level of work motivation among Romanian employees.
The novelty of the paper the threefold: we firstly aim at testing Vroom’s theory [2] of expectations in the context of a developing, post-communist and post-transition country. Secondly, we study the role of contextual factors, such as those related to regional sustainable development on work motivation, filling the gap in the existing literature on work motivation. Finally, we apply a multilevel modelling procedure, including in the same research setting both regional factors and individual factors, specific for satisfaction analysis. This approach is supported by the use of a recent dataset on Romanian workers.
The structure of the paper is as follow: the second section describes the theoretical framework that sustains the research, focused on work motivation theories in the context of sustainable regional development. The third section presents the methodological approach and describes the data and variables used in the econometric modelling. Section four presents the results and discusses the main findings, while the final section concludes the paper.
2. Literature Review and Theoretical Framework
This paper is at the intersection of sustainable development and human resources analysis, and therefore the literature reviewed in this section covers the most relevant concepts in the two domains. Firstly, we focused on sustainability, as a multidimensional concept, able to impact work satisfaction of individual workers.
According to The Brundtland Commission’s report [3], sustainable development is defined as “development that meets the needs of the present without compromising the ability of future generations to meet their own needs”. Sustainable development is defined as the combination of three different dimensions: economic, social, and environmental [4]. The junction of the three dimensions was named by Hall and Wagner [5] as the “triple bottom line”. As a result, sustainable development needs a broad view of social, environmental, and economic outcomes; a long-term perspective, concerned with the interests and rights of future generations as well as of people today; an inclusive approach. Kahn [4] defined the main components of the three dimensions of sustainability as follows (Table 1):

Table 1.
The paradigm of sustainable development in Agenda 21.
Morelli [6] believes that a sustainable environment should ensure an equilibrium between, on one hand, the capacity of the society of satisfying its own needs and on the other hand the protection of the environment. According to Sutton [7], the sustainable environment is defined as “the ability to maintain things or qualities that are valued in the physical environment”.
Social sustainability implies the existence of a balance between the needs and the rights of people or better said “a quality of societies” [8]. A society that has been sustainably developed from the social point of view, should provide the access to education, healthcare, transportation—a set of values that have to be transmitted to the generations to come. Littig and Griessler [8] consider that there are three indicators that can measure the social sustainability: the satisfaction of the primary needs (having access to education, healthcare, a job, etc.), equality, solidarity and tolerance toward the minorities.
Economic sustainability can be defined as the capacity of an economy to produce goods and services using the available resources in an efficient manner [9]. Bansal [10] demonstrates that the companies’ purposes of maximizing the profit or large targets do not get along with respecting the environment objectives and social equity because the companies typically take short term or mid-term decisions.
The human factor and the companies’ behavior have an essential role in the sustainable development of an economy, as demonstrated, among others, by Blundell [11]. This premise of our research is supported by some of the recent results, briefly presented in the remaining part of this section. Therefore, according to the Occupational Safety and Health Administration [12] employers are only truly sustainable when they ensure the safety, health, and welfare of their workers”. Practically the companies can be sustainable if they aim to protect the environment and ensure the health and well-being of their most important asset, the work force. Gallup study [13] revealed that 85% of the employees, function below their potential and don’t feel engaged at work. As a result, corporations should ensure attractive jobs for the employees, including a friendly environment, but also a good communication system within the company, especially that the empirical studies indicate a direct connection between motivation and performance. [14]
The definition of work motivation has evolved and a number of different approaches coexists in the literature. Whiseand and Rush [15] defined motivation as the wish of an individual doing something in a way of being capable of satisfying his own needs. For Wegner and Miller [16], motivation is an external factor that stimulates the individuals of taking different actions in order to reach a certain purpose. Fuller et al. [17] define motivation as the intensity, direction and persistence of one to reach a specific goal. In Saraswathi’s [18] point of view motivation represents the effort of the employee of reaching the company’s targets and implicitly, his own. On account of the elements presented above, we can identify three key elements for defining worker motivation: effort, objective, and needs [19].
Motivation can be both subjective and objective, as reported in the seminal work of White [20]. The subjective one depends on each individual, as “individuals are intrinsically motivated when they seek enjoyment, interest, satisfaction of curiosity, self-expression, or personal challenge in the work” [21]. The objective motivation is linked to the environment which the individual is interacting with and was defined as: “the engagement in the work in order to obtain some goal that is apart from the work itself” [22].
In the same line, Vroom [2] analyzed the behavior of the individual at the workplace and developed the novel theory of expectancy which relies on four hypothesis: (1) people join an organization having some expectations, needs, motivations, and experiences; (2) the behavior of the individual at the workplace is the result of a rational, conscious choice; (3) people are expecting different things from the workplace—a better salary, security, advance opportunities, etc.; (4) people choose between multiple alternatives—jobs—in order to maximize the benefits. The expectancy theory based on these hypothesis has three key elements: hope, instrumentality, and valence. The novelty of this theory is linked to the perception of the motivation. Vroom [2] is analyzing the” process” of motivation and the way in which it occurs, in comparison with other theories which take into account only the content of the motivation. The motivation theory developed by Vroom [2] has not been tested so far on Eastern European, former communist workers. This theory is at the core of our paper, as we aim at testing it in the Romanian context, trying to capture all its dimensions.
Vroom’s theory was further developed by many researchers. More recently, Lunenburg [23] considers that a person is motivated in the way which “effort will lead to acceptable performance (expectancy), performance will be rewarded (instrumentality), and the value of the rewards is highly positive (valence)”.
The valence is related to the rewards [24], while the motivational force is referring to a force that is leading the individual towards some behavior alternatives [25]. Instrumentality and valence are following the work results and they both have two types of behavior: intrinsic and extrinsic.
Chiang and Jang [26] have adapted the expectancy theory dividing the instrumentality and valence in instrumentality/valence extrinsic/intrinsic for capturing the impact of the intrinsic and extrinsic components. Expectancy was measured using four items: If I work very hard, my job performance will significantly improve / If I work very hard, I will get a lot more accomplished / If I put more effort into my job, my productivity will improve significantly / If I put more effort into my job, I will definitely be regarded as an effective employee. Extrinsic instrumentality was measured using four items: Performing well in my job will definitely result in my getting good pay, getting monetary bonuses, getting pay increases, having more opportunities for promotion. Intrinsic instrumentality was measured using four items: performing well in my job will definitely result in my having more responsibility and control over my job, taking on more challenging work tasks, having feelings of accomplishment, feeling very good about myself. Extrinsic valence was measured using four items: good salary/wage, more monetary bonuses, more pay increases, interesting work, and opportunities for advancement/promotion. Intrinsic valence was measured using four items: more responsibility/control over my job, more challenging work tasks, full use my skills and abilities, feelings of accomplishment, personal growth and development.
Starting with the elements of the social dimension, the employee’s motivation can be analyzed considering the worker’s attitude towards the work place as follows: commitment, job involvement and job satisfaction, as reported by the most recent evidence [27,28].
Lekic et al. [29] demonstrated that an unsatisfied employee will have a low work productivity while a satisfied employee will work more efficiently and will be more dedicated to his/her duties. Johnson and McIntye [30] believe that engagement and devotion towards a company are dependent on the degree of satisfaction at the work place which includes: safety of the work place, the salary, additional benefits, training and taking part in the decision making process. These findings have been confirmed by many other studies, among which: [30,31,32,33,34]. Latham [34], considers that the relationship between work achievement and satisfaction is a reciprocal-conditioned process, and the satisfaction can be the cause and the effect in the same time. Vroom [2] calculated the coefficient of correlations between the two variables (0.64) and came to the conclusion that satisfied employees: “have greater opportunity to influence decisions that have effects on them”. Fitzpatrick [35] argues that deferred compensation (to retirement) is inefficient when aims to increase employees productivity.
The bond between the work environment sustainability and the employees’ motivation may have as a starting point Pinder’s idea [27], “values have a key role in human behavior and work in particular”. Pinder [27] thinks that there is a difference between values (the general values) and the values at the work place, which lay at the basis of the employee’s behavior. Regarding the sustainability, this means that an individual will make decisions according to his own set of values and persistence (for example protecting the environment) is included in his system of needs.
More recent studies have shown that the employees are in general interested in developing a sustainable economic and social environment [36,37]. Bastien and Hung [38] analyzed the connection between the sustainable development and the intrinsic and extrinsic motivation of the employees from a company which was following a long term policy of sustainability. These emphasized three factors which influence the motivational level among the employees: satisfaction, working environment and performance. Each factor was sub divided into smaller categories: satisfaction consists in: pleasure, curiosity, personal challenge, values, and duty; working environment is defined by communication, sense of belonging, and sense of usefulness; performance covers company’s interests, customers’ values, and pride. The author came to the conclusion that a company that promotes a sustainable development policy ensures that the employees have: a pleasant work environment, a good communication with the managers, stability at the work place and the company’s value are the same with the employees’. Susanne and Torets [39] consider that the most important pillar of sustainable development which influences the most the employees’ motivation is the social one, following the one connected to the environment.
Milos and Zaneta [40] have analyzed based on a questionnaire the degree of motivation of the employees from the services sector of two neighboring countries: Austria and Slovakia. The starting hypothesis was tied to the degree of development of the two countries: “the differences in present living conditions in both countries shows that there are significant differences in the motivation level of service sector employees (GDP per capita in Austria 29,115 €, GDP per capita in Slovakia 15,501 €)”. The results showed that among the two counties there are no significant differences of motivating the service sector employees. Among the influencing factors, however, the respondents from the two counties have mentioned the following elements: the salary, additional benefits, employer recognition, the work environment, the advancement opportunities, etc.
Worth mentioning that studies on work motivation in Central and Eastern Europe are rather scarce, and the case of Romania is even less covered. In Romania, thus far, there are no studies that are evidentiary to the relationship between the sustainable development and the employees’ motivation. The majority of the studies regarding the motivation in Romania are intending to identify the main motivational factors at the work place, divided into the domain of activity and the sectors of activity: public/private [40,41,42,43,44,45]. Dumitrescu and Stanciu [46] believe that for a company, sustainability implies: employee’s satisfaction (People), sustainable profit in the long-term (Profit), and a durable planet with less pollution (Planet).
In the context of a large body of literature on both sustainability and work motivation, the paper aims at testing the Vroom’s theory of the expectations in the case of Romanian employees. This research tests the potential impact of the five components –expectations, the extrinsic instrumentality, the extrinsic instrumentality, the extrinsic and intrinsic valence- on the motivation of the Romanian employees’, based on the studies of Chiang and Jang [25] and Vroom [2]. Moreover, beside the individual level, the regional dimension of sustainability is also included as a factor for explaining motivation, in a multilevel research setting.
3. Methodology
In order to capture the overall degree of work satisfaction, data were gathered from a national representative survey among adults aged 15–64, who at the time of the research had the status of employees. The data were collected between the 13th and 23rd of March 2018 using a stratified probabilistic multi-stage sample of 301 employees. The strata were created using the following criteria: regional structure, structure based on sector of activity, structure based on gender and structure based on residency. The data were collected using 84 locations across Romanian regions.
The explanatory regional level variables (the second level in our analysis) were selected so that they adequately cover the three dimensions of sustainability previously described: social, environment and economic sustainability. The sources for all regional level variable used within the three dimensions are the National Institute of Statistics of Romania and Eurostat.
The large number of variables used in the modelling procedure are described by each level in Table 2. The variable selection was exhaustive, as we try to explain both individual and regional level of motivation, and we also intend to capture the five dimensions of motivation. We rely in selecting the variables on the results existing in the literature and we include them in different models specifications, as described in the next section.
Table 2.
Indicators used in multilevel modelling.
The motivational factors as described in Vroom expectancy theory are of crucial relevance to our research; they and are quantified using survey items measured on a 5-point Likert scale, as follows: 1 equals little important and 5 equals highly important:
Expectancy was measured using four items: If I work very hard, my job performance will significantly improve /If I work very hard, I will get a lot more accomplished/ If I put more effort into my job, my productivity will improve significantly/If I put more effort into my job, I will definitely be regarded as an effective employee.
Extrinsic instrumentality was captured based on the following four items: Performing well in my job will definitely result in my getting good pay, getting monetary bonuses, getting pay increases, having more opportunities for promotion.
Intrinsic instrumentality was covered by the next items: Performing well in my job will definitely result in my having more responsibility and control over my job, taking on more challenging work tasks, having feelings of accomplishment, feeling very good about myself.
Extrinsic valence was measured using: Good salary/wage, more monetary bonuses, more pay increases, interesting work, opportunities for advancement/promotion.
Finally, intrinsic valence was measured using four items: More responsibility/control over my job, More challenging work tasks, Full use my skills and abilities, Feelings of accomplishment, personal growth and development.
Using the above mentioned variables from the survey, the five indicators are developed based on Principal Components Analysis (PCA), as presented in the next section.
3.1. Multi-level Econometric Modelling
The methodology used in this research paper is stepwise starting with the construction of the aggregate indicators using Principal Components Analysis (PCA) and simple equal weights aggregation. The PCA is used to construct the two dimensions of motivation and the same technique is used to construct the three aggregate dimensions of sustainability. The five dimensions of Vroom’s theory are constructed as averages of individual items (for each dimension four individual items are included in the process). The internal consistency of the individual indicators used for constructing the PCs was assessed using Cronbach’s alpha and, additionally, the Kaiser-Meyer-Olkin test and Bartlett’s test were used to assess the appropriateness of using factor analysis (the results are available upon request).
After obtaining the needed aggregate indicators, the next methodological stage was focused on the estimation process of the multilevel models. The command xtmelogit under STATA 15 was used for this purpose.
Consequently, in the next phase, in order to identify the main determinants of work satisfaction of Romanian employees, a multilevel logistic regression analysis based on the hierarchical nature of the data (individuals within regions), which includes the individual-level variables, and then explores whether each region-level independent variable is significantly associated with higher levels of job satisfaction, was used. The conceptual framework of employees’ overall level of work motivation model is presented in Figure 1.
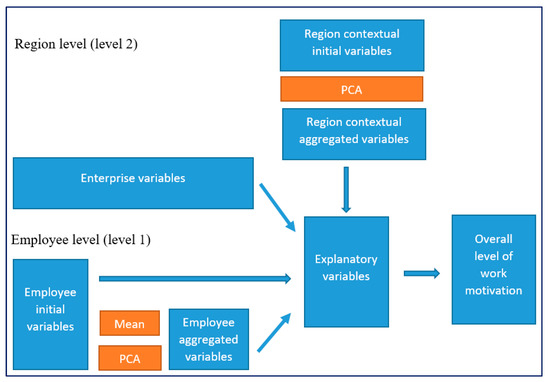
Figure 1.
Conceptual framework of employees’ overall level of work motivation.
In order to analyses the between-region variation in the overall level of work motivation different types of two-level models were used. The first stage was to estimate a baseline random intercept model with no explanatory variables, in order to identify whether a multi-level approach was appropriate. The null or empty two level model with only an intercept and region effects has the following form:
The intercept is shared by all regions, while the random effect is specific to region j. The baseline random intercept model with no explanatory variables was estimated using maximum likelihood estimation using adaptive quadrature. The log odds are the logarithm of the odds (i.e., the ratio between a probability value (Phi) and its complementary).
The second stage involved constructing a model with first-level (i.e., individual-level) variables in an attempt to understand their effects and thus to test the impact of individual characteristics. The second level, represents the inclusion of the contextual factors into the model and the factors related to the three dimensions of sustainability: social, environmental and economic were included. Therefore, the final logit random intercept model specification including both, individual level explanatory variables and their interactions, and region level explanatory variables, is the following (Durrant and Steele [47]; Williams and Horodnic [48]):
where: is the overall intercept, is the cluster specific effect, is the contextual effect, Xij is the vector containing individual level explanatory variables and their interactions, Xj is the vector containing region level explanatory variables and uj is the group (random) effect. The log odds are the logarithm of the odds (i.e., the ratio between a probability value (Phi) and its complementary).
β0 is interpreted as the log-odds that y = 1 when x = 0 and u = 0 and is referred to as the overall intercept in the linear relationship between the log-odds and x. If we take the exponential of β0, exp(β0), we obtain the odds that y = 1 for x = 0 and u = 0. As in the single-level model, β1 is the effect of a 1-unit change in x on the log-odds that y = 1, but it is now the effect of x after adjusting for (or holding constant) the group effect u. If we are holding u constant, then we are looking at the effect of x for individuals within the same group so β1 is usually referred to as a cluster-specific effect. Exp(β1) can be interpreted as an odds ratio, comparing the odds that y = 1 for two individuals (in the same group) with x-values spaced 1 unit apart.
While β0 is the overall intercept in the linear relationship between the log-odds and x, the intercept for a given group j is (β1 + uj) which will be higher or lower than the overall intercept depending on whether uj is greater or less than zero. Therefore, uj is the group (random) effect, group residual, or level 2 residual. The response probabilities can be expressed as follows:
Several models were estimated in order to provide alternative perspectives on the overall level of job satisfaction. Moreover, we tried to overcome the issues of multi-collinearity, as the five components of Vroom’s theory could be correlated among each other, and also some the region-level variables could be correlated.
4. Empirical Results and Discussion
4.1. Descriptive Results
From the total of 301 respondents, almost 21% are located in the Bucharest-Ilfov development region, and 13% are located in the North-West and Centre development regions. Only 8% of the respondents are located in the South-East-Oltenia development region. The gender distribution revealed that most of them are males (53.5%), and 32.2% are between 36 and 45 years old. The majority of them live in the urban area (69.7%) and work in companies from the services sector (44.1%), and only 23.9% have answered that they work in the manufacturing industry. Almost half of them (44.9%) completed their education at 17–19 years old, while almost 24% of the employees have as length of service between 1 and 3 years. 21.9% of employees come from micro-enterprises, 32.9% from small enterprises, 23.6% from medium companies while 21.6% from large companies. As far as the salary is regarded, a large proportion of the interviewed employees have a monthly salary under the threshold of 2500 (525 Euro) lei and only 27% of them earned between 2500 (525 Euro) and 5000 lei (1050 Euro). In what the education is regarded, almost 41.2% of the respondents are skilled workers, while 21.3% are specialists with higher education.
Regarding the satisfaction with the current working place, almost 74.4% of the employees declare that they are satisfied and very satisfied while 2.3% declare themselves as being totally satisfied. 45.2% of the respondents declare that they are satisfied with their monthly salary while 33.6% declare a neutral satisfaction level.
In terms of motivation, the overall level of work motivation is relatively high at national level. 93% of the interviewed Romanian employees declare themselves as being satisfied and very satisfied with their jobs and admit that when they are highly motivated, they definitely spend more effort on the job, enhance the quality of their job performance, increase the productivity on the job, and are willing to increase their involvement in the completion of the required tasks (Table 3).
Table 3.
The level of work motivation by region of development.
The results of the Kruskal-Wallis test reveal that there is a highly statistically significant difference in the overall level of work motivation between the development regions, with a significantly higher level in the South East region.
Eleven of the explanatory variables were constructed by aggregating a number of sixty-one individual variables using PCA, but also simple arithmetic mean in the case of the Vroom’s five components. More details about the aggregation process are available in the Table 4 presented in the following section.
Table 4.
Description of the aggregate explanatory variables.
4.2. Discussion Based on the Results of the Estimated Models
Taking into consideration the correlation and model specification aspects earlier mentioned, the estimation process included twelve estimated models. The empirical results of the baseline random intercept model, with no explanatory variables, used for proofing whether this multilevel technique is adequate, revealed that the log-odds of the share of employees satisfied and very satisfied with their jobs in an average ‘average’ region is estimated to be .
The between-region variance of the log-odds of work motivation overall level is estimated as 0.752 with a standard error of 0.673. In order to test the significance of the between-region variance, a Wald test was applied. The high value of the test (Chi-square test = 5.42 with a p-value = 0.0099) revealed that there is there is a significant variation between development regions in the proportion of those satisfied and very satisfied with their jobs.
Taking into account the between-region variance of 0.752, the variance partition coefficient (VPC) is 18.6% (the VPC is calculated as 0.752/(0.752 + 3.29) = 0.186, thus 18.6% of the residual variation in the propensity of being satisfied with the job is attributable to unobserved region characteristics), indicating that almost 13% of the variance in receiving envelope wages can be attributed to differences between regions.
After testing that the multilevel mixed-effects models are the appropriate ones, the second step is to build a model only with individual level characteristics. Since the five components of Vroom are highly correlated, sequential models have been estimated. The correlation matrix of the main motivational factors identified using PCA analysis as well as the five components of Vroom’s theory is displayed in Appendix B. In the third step, both first-level and second-level (region-level) variables were included, in order to explain the effects at both levels (Williams and Horodnic [48]). Table 5 and Table 6 report the results of the random intercept models that only include the individual-level variables for models I-VII and also including region level predictors for models VIII-XI and the fixed effects model (model XII).
Table 5.
Multilevel mixed-effects logistic regression models of the work motivation of Romanian employees (Models I–VII).
Table 6.
Multilevel mixed-effects logistic regression models of the work motivation of Romanian employees (Models VIII-XII).
Important to note is that the empirical results for the individual level variables pointed out the lack of significance for the association between gender, age, occupation, seniority, residence, degree of satisfaction and the last employee performance evaluation and the activity sector. However, variables such as satisfaction level with salary and company size significantly influenced the overall level of work motivation. Those satisfied with the level of their salary are significantly more likely to be also satisfied with their jobs, while compared with employees from large companies, employees from micro, small or medium enterprises are more inclined to have a higher level of work motivation.
The second relevant result is that the satisfaction level associated with the last performance evaluations tend to lead to a decrease in the overall level of work motivation; this could be explained by the fact that employees lack the confidence in the results and effects of such evaluations.
When analyzing the two aggregated motivational factors, from the perspective of Romanian employees, one notes that only the second motivation factor—job stability—significantly influences the level of work motivation. Therefore, job stability on the first place and secondly a good salary, are both of significant importance from the perspective of Romanian employees.
It is worth to mention that the motivational factors such as the attractive package of benefits, the perspective of hierarchical advancement and an adequate logistical support (business phone, car, or laptop) do not exhibit any influence on the level of the overall work motivation. Analyzing the potential influence of the five components of Vroom’s theory on the overall level of work motivation, it can be highlighted the positive and statistically significant impact of expectancy, extrinsic instrumentality, intrinsic instrumentality and intrinsic valence. On the other hand, the extrinsic valence does not manifest any impact on the overall level of motivation. Therefore, the Romanian employees are convinced that if they work hard, the job performance will improve, they will get a lot more accomplished, the productivity will improve and this will increase also the overall level of motivation. They also consider that attaining a good performance level in the job will definitely result in getting a better pay, getting monetary bonuses, getting pay increases, having more opportunities for promotion and also in having more responsibility and control in taking on more challenging work tasks, having feelings of accomplishment and will also increase the self-esteem.
Since model IV exhibited the largest variance at a regional level (61.33%) among individual characteristics models (the variance partition coefficient measures the proportion of the total residual variance that is due to between-group variation). Figure 2 reports the residual level-2 region effects (with only the individual characteristics) supporting the hypothesis that there are important differences among regions. A region whose confidence interval does not overlap the line at zero (representing the mean log-odds of work motivation in all regions) differs significantly from the region average at the 5 per cent significance level (Williams and Horodnic [49]).
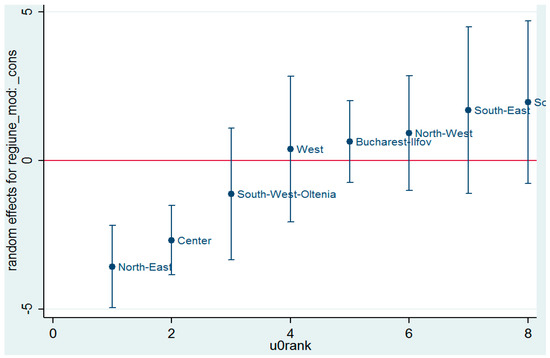
Figure 2.
Region-level effects taking into consideration individual-level variables (model IV).
In this case, some of the confidence intervals include zero and only North-East and Center regions are those regions that actually do not overlap with 0.
The three regions with the lowest probability of being satisfied at the job (largest negative values of ûj) are North-East development region, Center development region and South-West development region, while the three with the highest response probability (largest positive values of ûj) indicating a significantly higher level of work motivation compared with the general regional average are North-West development region, South-East development region and South-Muntenia development region.
In order to test the main hypotheses of the research and having in mind that the region-level variables taken into account are correlated, seven alternative models (models I–VII) were estimated for to providing new and more detailed perspectives concerning the overall level of work motivation among Romanian employees and the influence of the sustainability dimensions on it.
Analyzing the empirical results of all seven alternative models, it can be highlighted that in several models the level of work motivation seems to differ by gender and that women tend to be more dissatisfied with their jobs than men. Another finding, supported by the results obtained across all models is that the level of satisfaction related to the received salary significantly and positively impacts the overall level of work motivation, and thereby persons displaying a higher level of salary satisfaction tend to be also more satisfied with their jobs. Also consistent across all models is the fact that the employees from micro, small and medium companies tend to be more satisfied than the large companies’ employees.
Regarding the influence of activity sector, the results point that the employees from services tend to be more motivated with their jobs compared with those from wholesale trade. What it is interesting is that the level of satisfaction associated with the results of the evaluations made over the past 3 years tend to decrease the overall level of work motivation, the relationship being negative and statistically significant across all models.
Analyzing the impact of motivational factors from the perspective of Romanian employees on the overall level of work motivation, it can be highlighted that only the second one associated mostly with job stability and a good potential salary seems to significantly impact the level of motivation in all models, revealing that for Romanian employees, job stability is a mandatory requirement. Also noteworthy is that all four variables related to the components of Vroom’s theory are statistically significant in all models. The extrinsic instrumentality proved to be an important factor in increasing the overall level of work motivation, the Romanian employees being convinced that if they will perform well at the job, this will result in getting a good pay, getting monetary bonuses, getting pay increases and having more opportunities for promotion.
Finally, in order to assess the impact of the three dimensions of regional sustainability on the work motivation level and to directly address the research hypothesis, four new models (models VIII to XI) were constructed (the social sustainability dimension includes two principal components which were included in two different models) by augmenting the previous models. Even though the environmental sustainability dimension and the economic sustainability dimension have a positive impact it is not statistically significant. On the other hand, from the perspective of the Romanian employees, the social sustainability dimension is important, both variables associated with it having positive and statistically significant coefficients in the models. Therefore, if the unemployment rate and the rate of early leavers has lower values in a certain region that can be linked to an increase in the level of work motivation.
As a consequence, we can conclude that there is enough evidence in order to support our first hypothesis, stating that the regional social sustainability has an important and positive impact on the overall work satisfaction of the employees working in that area. On the other hand, there is not enough proofs to support the second and the third hypothesis and therefore one can conclude that both the economic regional sustainability and the environmental regional sustainability do not impact significantly the overall work motivation of the employees.
In Table 5 and Table 6 bellow, from the eleven models with random effects, the first two models were used to describe the influence of the individual level and company level variables. These are followed by five models augmented with each of the five components of Vroom’s theory and finally the last four were augmented with the regional sustainability components:
Model I includes the following independent variables: Gender, Age, Occupation, Seniority, Satisfaction level with Salary, Satisfaction level with evaluation, Residence, Company size, Activity sector.
Model II includes the following independent variables: Gender, Age, Occupation, Seniority, Satisfaction level with Salary, Satisfaction level with evaluation, Residence, Company size, Activity sector, Motivation Factor 1, Motivation Factor 2.
Model III includes the following independent variables: Gender, Age, Occupation, Seniority, Satisfaction level with Salary, Satisfaction level with evaluation, Residence, Company size, Activity sector, Motivation Factor 2, Vroom’s Factor (Expectancy).
Model IV includes the following independent variables: Gender, Age, Seniority, Satisfaction level with Salary, Satisfaction level with evaluation, Residence, Company size, Activity sector, Motivation Factor 2, Vroom’s Factor (Extr.instr).
Model V includes the following independent variables: Gender, Age, Seniority, Satisfaction level with Salary, Satisfaction level with evaluation, Residence, Company size, Activity sector, Motivation Factor 2, Vroom’s Factor (Intr.instr).
Model VI includes the following independent variables: Gender, Age, Seniority, Satisfaction level with Salary, Satisfaction level with evaluation, Residence, Company size, Activity sector, Motivation Factor 2, Vroom’s Factor (Extr.valence).
Model VII includes the following independent variables: Gender, Age, Seniority, Satisfaction level with Salary, Satisfaction level with evaluation, Residence, Company size, Activity sector, Motivation Factor 2, Vroom’s Factor (Intr.valence).
Model VIII includes the following independent variables: Gender, Age, Seniority, Satisfaction level with Salary, Satisfaction level with evaluation, Residence, Company size, Activity sector, Motivation Factor 2, Vroom’s Factor (Extr. instr, Intr. instr), Social Sustainability Comp 1.
Model IX includes the following independent variables: Gender, Age, Seniority, Satisfaction level with Salary, Satisfaction level with evaluation, Residence, Company size, Activity sector, Motivation Factor 2, Vroom’s Factor (Extr. instr, Intr. instr), Social Sustainability Comp 2.
Model X includes the following independent variables: Gender, Age, Seniority, Satisfaction level with Salary, Satisfaction level with evaluation, Residence, Company size, Activity sector, Motivation Factor 2, Vroom’s Factor (Expectancy, Extr. instr), and Environmental Sustainability.
Model XI includes the following independent variables: Gender, Age, Seniority, Satisfaction level with Salary, Satisfaction level with evaluation, Residence, Company size, Activity sector, Motivation Factor 2, Vroom’s Factor (Expectancy, Extr. instr, Intr. valence), Economic Sustainability
We estimated a regional fixed effects model (Model XII in Table 6) as a robustness check and also to identify the individual-level variables with significant impact on employees’ job satisfaction. The empirical results of the fixed effects model confirmed the lack of significance for gender, age, occupation, seniority, residence and the activity sector and revealed the lack of significance for the degree of satisfaction with the received salary. On the other hand, it is worth to mention the significant impact of the degree of satisfaction of the last employee performance evaluation, company size on the overall level of work motivation. The results of the Model XII confirmed the impact of job stability, as the second motivation factor on the level of work motivation, while from the Vroom’s theory components, the model confirmed only the positive and statistically significant impact of expectancy and extrinsic instrumentality.
5. Conclusions and Policy Implications
In this paper we have employed a multi-level modelling approach for understanding the determinants of work motivation, using individual factors, as described in Vroom’s theory (as updated by Chan) and contextual factors, covered by three dimensions of sustainability. Our main findings show that individual factors and also regional social sustainability have a significant influence on work motivation of Romanian employees. The lack of significant effects of environmental sustainability on work motivation may be due to the limited measurement of this factor, as the two measures of environmental sustainability used in this research deal with sanitation while the relevant measure of environmental sustainability may be more related to the sustainability of resources. Also regional economic sustainability has no direct significant effect on Romanian workers motivation, which seems to be better connected with individual factors. Four out of the five components of Vroom’s theory of expectations have a positive and statistically significant impact on work motivations: expectancy, extrinsic instrumentality, intrinsic instrumentality and intrinsic valence. On the other hand, the extrinsic valence does not manifest any impact on the overall level of motivation.
The results could be relevant at a micro level, for employers or human resources managers. They should target the strategies for attracting and motivating workers on monetary bonuses and wages, which are the key factors for motivating the employees in Romania. Also, Romanian workers are convinced that working hard is the way for increasing their performance and work motivation. One important result of the research is that job stability is an important factor that positively affects work motivation: in a sustainable working environment, people are more motivated if they have a stable, secure job.
At a regional level, public authorities and decision makers could include social sustainability as a key factor for motivating workers. North-East development region, Center development region and South-West development region have the lowest level of work motivation, while in other regions the level of motivation is higher. Our findings show that factors such as regional unemployment or poverty rate, imbedded into the social dimension of sustainability impact the individuals’ work motivation.
The results of this study, based on a recently collected dataset are particularly relevant for the Eastern European countries facing labor force shortages and labor market imbalances. This is the case for Romania, a country with a labor market strongly affected by labor migration [50], struggling to attract workers into the labor market. Therefore, the findings could be also useful when developing strategies for increasing labor supply and for attracting Romanian migrants working abroad to the country of origin.
Author Contributions
All the authors have contributed to the whole development of the manuscript: designing the research, performing the calculations, writing the text, discussing the results, and obtaining the conclusions.
Funding
The research published in this article has been supported by the Romanian government through CERTRAN project—The Upgrade of the Research Capacity in Economics through Development of a Transdisciplinary Research Infrastructure.
Conflicts of Interest
The authors declare no conflict of interest.
References
- Popescu, M.E.; Roman, M. Vocational training and employability: Evaluation evidence from Romania. Eval. Progr. Plan. 2018, 67, 38–46. [Google Scholar] [CrossRef] [PubMed]
- Vroom, V.H. Work and Motivation; Wiley: New York, NY, USA, 1964. [Google Scholar]
- Report of the World Commission on Environment and Development: Our Common Future (The Brundtland Commission’s Report); Oxford University Press: New York, NY, USA, 1987.
- Kahn, M. Concepts, definitions, and key issues in sustainable development: The outlook for the future. In Proceedings of the 1995 International Sustainable Development Research Conference, Manchester, UK, 27–28 March 1995; Keynote Paper. pp. 2–13. [Google Scholar]
- Hall, J.; Wagner, M. Integrating Sustainability into Firms’ Processes: Performance Effects and the Moderating Role of Business Models and Innovation. Bus. Strategy Environ. 2012, 21, 183–196. [Google Scholar] [CrossRef]
- Morelli, J. Environmental Sustainability: A Definition for Environmental Professionals. J. Environ. Sustain. 2011, 1, 2. [Google Scholar] [CrossRef]
- Sutton, P. A Perspective on Environmental Sustainability. In Victorian Commissioner for Environmental Sustainability. Melbourne, Australia. 2004. Available online: http://www.green-innovations.asn.au/A-Perspective-on-Environmental-Sustainability.pdf (accessed on 14 June 2019).
- Littig, B.; Griessler, E. Social Sustainability: A Catchword between Political Pragmatism and Social Theory. Int. J. Sustain. Dev. 2005, 8, 65–79. [Google Scholar] [CrossRef]
- Harris, J.M. Sustainability and Sustainable Development. Int. Soc. Ecol. Econ. 2003, 1, 1–12. [Google Scholar]
- Bansal, P. The Corporate Challenges of Sustainable Development. Acad. Manag. Exec. 2002, 16, 122–131. [Google Scholar] [CrossRef]
- Blundell, R.; Macurdy, T. Labor Supply: A Review of Alternative Approaches. Handb. Labor Econ. 1999, 3, 1559–1695. [Google Scholar]
- Occupational Safety and Health Administration (OSHA). Sustainability in the Workplace: A New Approach for Advancing Worker Safety and Health. Available online: www.osha.gov/sustainability (accessed on 14 June 2019).
- Crabtree, S. Global Productivity Hinges on Human Capital Development. 2018. Available online: www.gallup.com/workplace/236207/global-productivity-hinges-human-capital-development.aspx (accessed on 14 June 2019).
- Casey, D.; Sieber, S. Employees, sustainability and motivation: Increasing employee engagement by addressing sustainability and corporate social responsibility. Res. Hosp. Manag. 2016, 6, 69–76. [Google Scholar] [CrossRef]
- Whiseand, P.; Rush, G. Supervising Police Personnel: Back to Basics; Prentice Hall: New Jersey, NJ, USA, 1988. [Google Scholar]
- More, H.W.; Wegner, F.W.; Miller, L.S. Effective police supervision., Cincinnati; Anderson Publishing Co.: Cincinnati, OH, USA, 2003. [Google Scholar]
- Fuller, M.A.; Valacich, J.S.; George, J.F. Information Systems Project Management: A Process and Team Approach. Upper Saddle River; Pearson Prentice Hall: New Jersey, NJ, USA, 2008. [Google Scholar]
- Saraswathi, S. A Study on Factors that Motivate IT and Non-IT Sector Employees: A Comparison. Int. J. Res. Comput. Appl. Manag. 2011, 1, 72–77. [Google Scholar]
- Kian, T.; Yusoff, W.; Rajah, S. Motivation for generations’ cohorts: An organizational justice perspective. Int. J. Manag. Sci. 2014, 11, 536–542. [Google Scholar]
- White, R.W. Motivation Reconsidered: The Concept of Competence. Psychol. Rev. 1959, 66, 297–333. [Google Scholar] [CrossRef] [PubMed]
- Amabile, T.M. Motivational Synergy: Toward new Conceptualizations of Intrinsic and Extrinsic Motivation in the Workplace. Hum. Resour. Manag. Rev. 1993, 3, 185–201. [Google Scholar] [CrossRef]
- Lunenburg, F. Expectancy Theory of Motivation: Motivating by Altering Expectations. Int. J. Manag. Bus. Adm. 2011, 15, 1. [Google Scholar]
- Regis, H.P.; Falk, J.A.; Dias, S.C. Expectancy Theory; International Encyclopedia of Organization Studies, Sage Publications, Inc.: Thousand Oaks, CA, USA, 2008. [Google Scholar]
- Ghoddousi, P.; Bahrami, N.; Chileshe, N.; Hosseini, M.R. Mapping site-based construction workers motivation: Expectancy theory approach. Constr. Econ. Build. 2014, 14, 60–77. [Google Scholar] [CrossRef]
- Chiang, C.F.; Jang, S.C. An expectancy theory model for hotel employee motivation. Int. J. Hosp. Manag. 2008, 27, 313–322. [Google Scholar] [CrossRef]
- Caramelli, M.; Briole, A. Employee stock ownership and job attitudes: Does culture matter? Hum. Resour. Manag. Rev. 2017, 17, 290–304. [Google Scholar] [CrossRef]
- Pinder, C. Work Motivation in Organizational Behaviour; Psychology Press: New York, NY, USA, 2008. [Google Scholar]
- Maestas, N.; Mullen, K.J.; Powell, D.; Wachter, T.; Wenger, J.B. The American Working Conditions Survey Data: Codebook and Data Description; TL-269-APSF; RAND Corporation: Santa Monica, CA, USA, 2017. [Google Scholar]
- Lekic, S.; Bogetic, S.; Bubanja, M.V. Educated and satisfied worker—Foundation of modern and successful company. J. Eng. Manag. Comp. 2014, 4, 27–33. [Google Scholar] [CrossRef]
- Johnson, J.J.; McIntye, C.L. Organizational culture and climate correlates of job satisfaction. Psychol. Rep. 1998, 82, 843–850. [Google Scholar] [CrossRef]
- Strauss, K.; Griffin, M.A.; Parker, S.K.; Mason, C.M. Building and Sustaining Proactive Behaviours: The Role of Adaptivity and Job Satisfaction. J. Bus. Psychol. 2015, 30, 63–72. [Google Scholar] [CrossRef]
- Nazir, S.; Shafi, A.; Qun, W.; Nazir, N.; Tran, Q.D. Influence of organizational rewards on organizational commitment and turnover intentions. Empl. Relat. 2016, 38, 596–619. [Google Scholar] [CrossRef]
- Locke, E.A.; Latham, G.P. Building a practically useful theory of goal setting and task motivation. Am. Psychol. 2002, 57, 705–717. [Google Scholar] [CrossRef] [PubMed]
- Latham, G.P. Work Motivation: History, Theory, Research, and Practice; Sage: Thousand Oaks, CA, USA, 2007. [Google Scholar]
- Fitzpatrick, D.M. How Much Are Public School Teachers Willing to Pay for Their Retirement Benefits? Am. Econ. J. Econ. Policy Am. Econ. Assoc. 2015, 7, 165–188. [Google Scholar] [CrossRef][Green Version]
- Bartik, D.; Hoeltl, A.; Brandtweiner, R. The Leverage of Corporate Environmental Protection Concepts on Employee Motivation. WIT Trans. Ecol. Environ. 2013, 173, 55–66. [Google Scholar]
- Temminck, E.; Mearns, K.; Fruhen, L. Motivating Employees towards Sustainable Behavior. Bus. Strategy Environ. 2015, 24, 402–412. [Google Scholar] [CrossRef]
- Bastien, F.; Hung, T. Sustainable Development and Intrinsic and Extrinsic Employee Motivation a Case Study Conducted in Brocard. 2016. Available online: http://www.diva-portal.org/smash/get/diva2:956312/FULLTEXT01.pdf (accessed on 14 June 2019).
- Susanne, K.P.; Torets, R. How do Ecological, Economic and Social Sustainability Influence on Employee Motivation? A Case Study of a German Company in the Solar Energy Sector. 2016. Available online: http://www.diva-portal.se/smash/get/diva2:502565/FULLTEXT01.pdf (accessed on 14 June 2019).
- Milos, H.; Zaneta, B. Comparison of Motivation Level of Service Sector Employees in the Regions of Slovakia and Austria. Procedia Econ. Financ. 2015, 23, 348–355. [Google Scholar]
- Neagu, O.; Teodoru, M.; Macarie, S. Motivational Practices Used by Employers from the Satu Mare County: A Comparative Approach. Studia Univ. Vasile Goldiș Arad Econ. Ser. 2014, 24, 4. [Google Scholar]
- Matei, L.; Fataciune, M. The Fundaments of Applying the Concept of Public Service Motivation in the South-Eastern European States. National and European Values of Public Administration in the Balkans, eds. Econ. Publ. House 2011, 318–326. [Google Scholar]
- Casuneanu, C. The Romanian employee motivation system: An empirical analysis. Int. J. Math. Models Methods Appl. Sci. 2011, 5, 931–938. [Google Scholar]
- Păceșilă, M. The relationship between motivational theories and the current practices of motivating NGO’s human resources in Romania. Manag. Res. Pract. 2014, 6, 5–20. [Google Scholar]
- Zamfir, A.M.; Mocanu, C.; Grigorescu, A. Resilient entrepreneurship among European higher education graduates. Sustainability 2018, 10, 2594. [Google Scholar] [CrossRef]
- Dumitrescu, L.; Stanciu, O.; Tichindelean, M.; Vinerean, S. Achieving Employee Satisfaction by Pursuing Sustainability Practice. Stud. Bus. Econ. Lucian Blaga Univ. Sibiu 2013, 81, 36–45. [Google Scholar]
- Durrant, G.B.; Steele, F. Multilevel modelling of refusal and non-contact inhousehold surveys: Evidence from six UK Government surveys. J. R. Stat. Ser. A 2009, 172, 361–381. [Google Scholar] [CrossRef]
- Williams, C.C.; Horodnic, I. Evaluating the prevalence of the undeclared economy in Central and Eastern Europe: an institutional asymmetry perspective. Eur. J. Ind. Relat. 2015, 21, 389–406. [Google Scholar] [CrossRef]
- Williams, C.C.; Horodnic, I. Evaluating the illegal employer practice of underreporting employees’ salaries. Br. J. Ind. Relat. 2016, 55, 83–111. [Google Scholar] [CrossRef]
- Roman, M.; Goschin, Z. Romanian Immigrants Worldwide: What makes them Return Home? J. Ident. Migr. Stud. 2012, 6, 2. [Google Scholar]
© 2019 by the authors. Licensee MDPI, Basel, Switzerland. This article is an open access article distributed under the terms and conditions of the Creative Commons Attribution (CC BY) license (http://creativecommons.org/licenses/by/4.0/).