Article

Numerical Simulation Modeling of a GSHP and WSHP System for an Office Building in the Hot Summer and Cold Winter Region of China: A Case Study in Suzhou

1
Department of Civil Engineering, Xi’an Jiaotong-Liverpool University, Suzhou 215123, China
2
Department of Architecture, Xi’an Jiaotong-Liverpool University, Suzhou 215123, China
*
Author to whom correspondence should be addressed.
Sustainability 2019, 11(12), 3282; https://doi.org/10.3390/su11123282
Submission received: 16 May 2019 / Revised: 7 June 2019 / Accepted: 8 June 2019 / Published: 14 June 2019
(This article belongs to the Collection Green Building Technologies)

Abstract

:
This paper studies the long-term performance of a Ground Source Heat Pump (GSHP) system and a Water Source Heat Pump (WSHP) system for an office building in Suzhou, which is a hot summer and cold winter climate region of China. The hot summer and cold winter region is the most urbanized region of China and has subtropical monsoon climate, therefore, Heating, Ventilation, and Air Conditioning (HVAC) systems are in great demand. Due to the fact that 42.5% of Suzhou’s total area is covered by lakes and rivers, the city has an abundance of surface water resources. Based on Suzhou’s meteorological data and the thermal characteristics of the building envelope, an office building model was created and the dynamic cooling and heating load was calculated using Transient System Simulation (TRNSYS) simulation software. Two numerical HVAC modeling systems were created: a GSHP system for which the data of an in-situ Thermal Response Test (TRT) was used and a WSHP system for which the Tai Lake water temperature was used. Simulating the performance of both systems over a 20-year period, the two systems were analyzed for their Coefficient of Performance (COP), heat source temperature variation, and energy consumption. The results show that the GSHP system causes ground heat accumulation, which reduces the system’s COP and increases energy consumption. The study also revealed that compared with the GSHP system, the WSHP system has a more stable long-term performance for buildings in Suzhou.

1. Introduction

The Ground Source Heat Pump (GSHP) system is one of the most popular renewable energy technologies for space heating and cooling of residential and public buildings. This is due to its high Coefficient of Performance (COP), low energy consumption, and environmentally friendly performance [1,2,3,4]. This is mainly because small temperature differences can minimize the energetic value of the heat flux with respect to the energetic value [5,6,7]. For this reason, low exergy designs such as high temperature cooling or low temperature heating systems decrease the exergy demand and maximize coefficient of performance of the systems in buildings [6,8,9,10,11,12,13,14]. However, in regions where there is an imbalance between air conditioning cooling demand in summer and the heating demand in winter, GSHP heat exchangers are designed according to the higher load needed. Continuous running of the GSHP system with an uneven heating and cooling load, causes an imbalance in the ground thermal due to the heat exchange between the annual heat rejection to the ground and the annual heat extraction from the ground; hence, the performance and reliability of the GSHP system decreases gradually [2,15,16,17,18,19,20,21,22,23].
The GSHP system has been widely used for newly designed buildings in China over recent years such that the area using a geothermal system for heating will reach 500 million square meters by 2020 [24]. The different types of geothermal heat pump potentials need to be investigated in hot summer and cold winter regions of China to ascertain their cooling dominated characteristics [25].
In regions where adequate surface water is available, the Water Source Heat Pump (WSHP) system can utilize lakes, rivers, and oceans to provide quality heat sources [26,27,28]. A study by Cornell University showed that cold water could be pumped directly from a lake for cooling campus buildings [29]. Schibuola and Scarpa proposed installing a WSHP system using lagoon water for supplying the heating, ventilation, and air conditioning (HVAC) for a hotel in the historical center of Venice. Performance of the WSHP system was shown to be superior to a corresponding air source heat pump and a traditional HVAC system based on a condensing boiler and an air-cooled chiller [30]. Chiang et al. performed computer simulation to evaluate WSHP system and Air Source Heat Pump (ASHP) system for a hospital project in Taiwan and concluded that WSHP system is superior to ASHP system. The real operation data were recorded and indicated that the computer simulation could well predict the COP and energy consumption of the heat pump system [31].
This paper studies the situation in the city of Suzhou, Jiangsu province of Southeast China, which has a subtropical monsoon climate with four distinct seasons and high humidity. Suzhou is the so-called water city of China, since 42.5% of its total area is covered by lakes and rivers. Because of Suzhou’s special weather conditions, HVAC systems are in high demand, especially for cooling in the summer. As an efficient renewable energy resource, the GSHP system has been introduced in many newly designed buildings in the Suzhou area. However, local designers rarely consider surface water as a heat resource, mainly because of lack of research on the design and performance of WSHP systems in this area. To fill this research gap, this study simulates the performance of two geothermal heat pump system models of an office building in Suzhou with considering the local climate impacts: a GSHP system for which data of in-situ thermal response test (TRT) is used and a WSHP system for which surface temperature water of Tai Lake is used.
Based on Suzhou’s meteorological data and the building envelope thermal characteristics, an office building model is created in the dynamic simulation software Transient System Simulation (TRNSYS) and the heating and cooling load of the building is calculated. A lake water WSHP system and a corresponding GSHP system are created for supplying heating and cooling for the building in TRNSYS. A 20-year operation of these two systems was simulated. The simulation result of the COP, the heat source and outlet temperature variation, and the energy consumption are analyzed for these two systems. The outcome of the research could provide the valuable reference for local geothermal heat pump system design as well as for other cities in the hot summer and cold winter region of China.

2. Method

2.1. The Building Model and Load Calculation

An office building with two floors is drawn in Google Sketchup to create the 3D building model, as shown in Figure 1. The area of the building is 1153.04 m2, the height is 8.4 m, and the window-wall ratios are listed in Table 1. The office building is located in Suzhou city, which is in the hot summer and cold winter region of China. In order to control and standardize the heat transfer through the building envelope, the thermal property parameters of the building envelope are designed using the baseline values of the Chinese national standard “Design Standard for Energy Efficiency of Public Buildings (GB 50189-2015)” [32]. This method for creating a reference building model using baseline of design standard for studying energy efficient building design has been used by many researchers [33,34,35]. The main parameters are listed in Table 2.
The 3D building model is input to Multizone Building Modeling (TRNbuild), which is a part of the TRNSYS program in which multi-zone 3D buildings can be imported and building data and parameters can be defined. TRNSYS is a graphically based software environment that is flexibly used to simulate the behavior of transient systems [36]. It has been successfully used and verified in various studies to analyze the performance of GSHP systems for all types of buildings in different areas in the world [35,37,38,39]. The system model for calculating the heating and cooling load for the office building is created in TRNSYS simulation model, as illustrated in Figure 2. The necessary components are added and linked in the model. Component Type 56 (Building) represents the office building and the building’s data is set up within it [36].
The Suzhou weather data of a typical meteorological year is imported by Meteonorm 7.0 through the Type 15-2 (weather data) component of the TRNSYS simulation model [36]. A typical meteorological year for Suzhou is illustrated in Figure 3, which shows typical air temperature characteristics for a hot summer and cold winter climate region of China.
According to the weather conditions in Suzhou, the cooling supply usually starts from the middle of May and goes through to the end of September and the heating supply usually starts from the beginning of December and goes through to the middle of March. People usually use natural ventilation during transition seasons. The cooling and heating seasonal schedules are set to component Type 515 (Cooling and heating seasonal schedule) of the TRNSYS simulation model [36]. In addition, according to GB50189-2015 [32], the air-conditioning control for the office building model is set at 26 °C in the summer and 18 °C in the winter [32].
According to GB 50189-2015 [32] for an office building, the personal occupancy density is 0.1 person/m2, fresh air per person is 30 m3/h, the lighting power density is 9 W/ m2, and the equipment power density is 13 W/m2. All these parameters are set in the TRNSYS simulation model. For the office building, people normally work 8 hours a day from 9:00 am to 5:00 pm except weekends and holidays, so the lighting and office equipment working schedules are set accordingly in the TRNSYS simulation model.
Other components necessary for processing data and information to calculate the load include: Type 33 (Psychometrics) for calculating the corresponding wet bulb temperature and percent relative humidity in order to obtain the dry bulb temperature and relative humidity from weather data; Type 69 (Sky Temp) for calculating the effective sky temperature of long-wave radiation exchange; and Type 24 (Integrator) for calculating the accumulated energy demand of different zones as well as the total accumulated energy demand of the building [36,40].
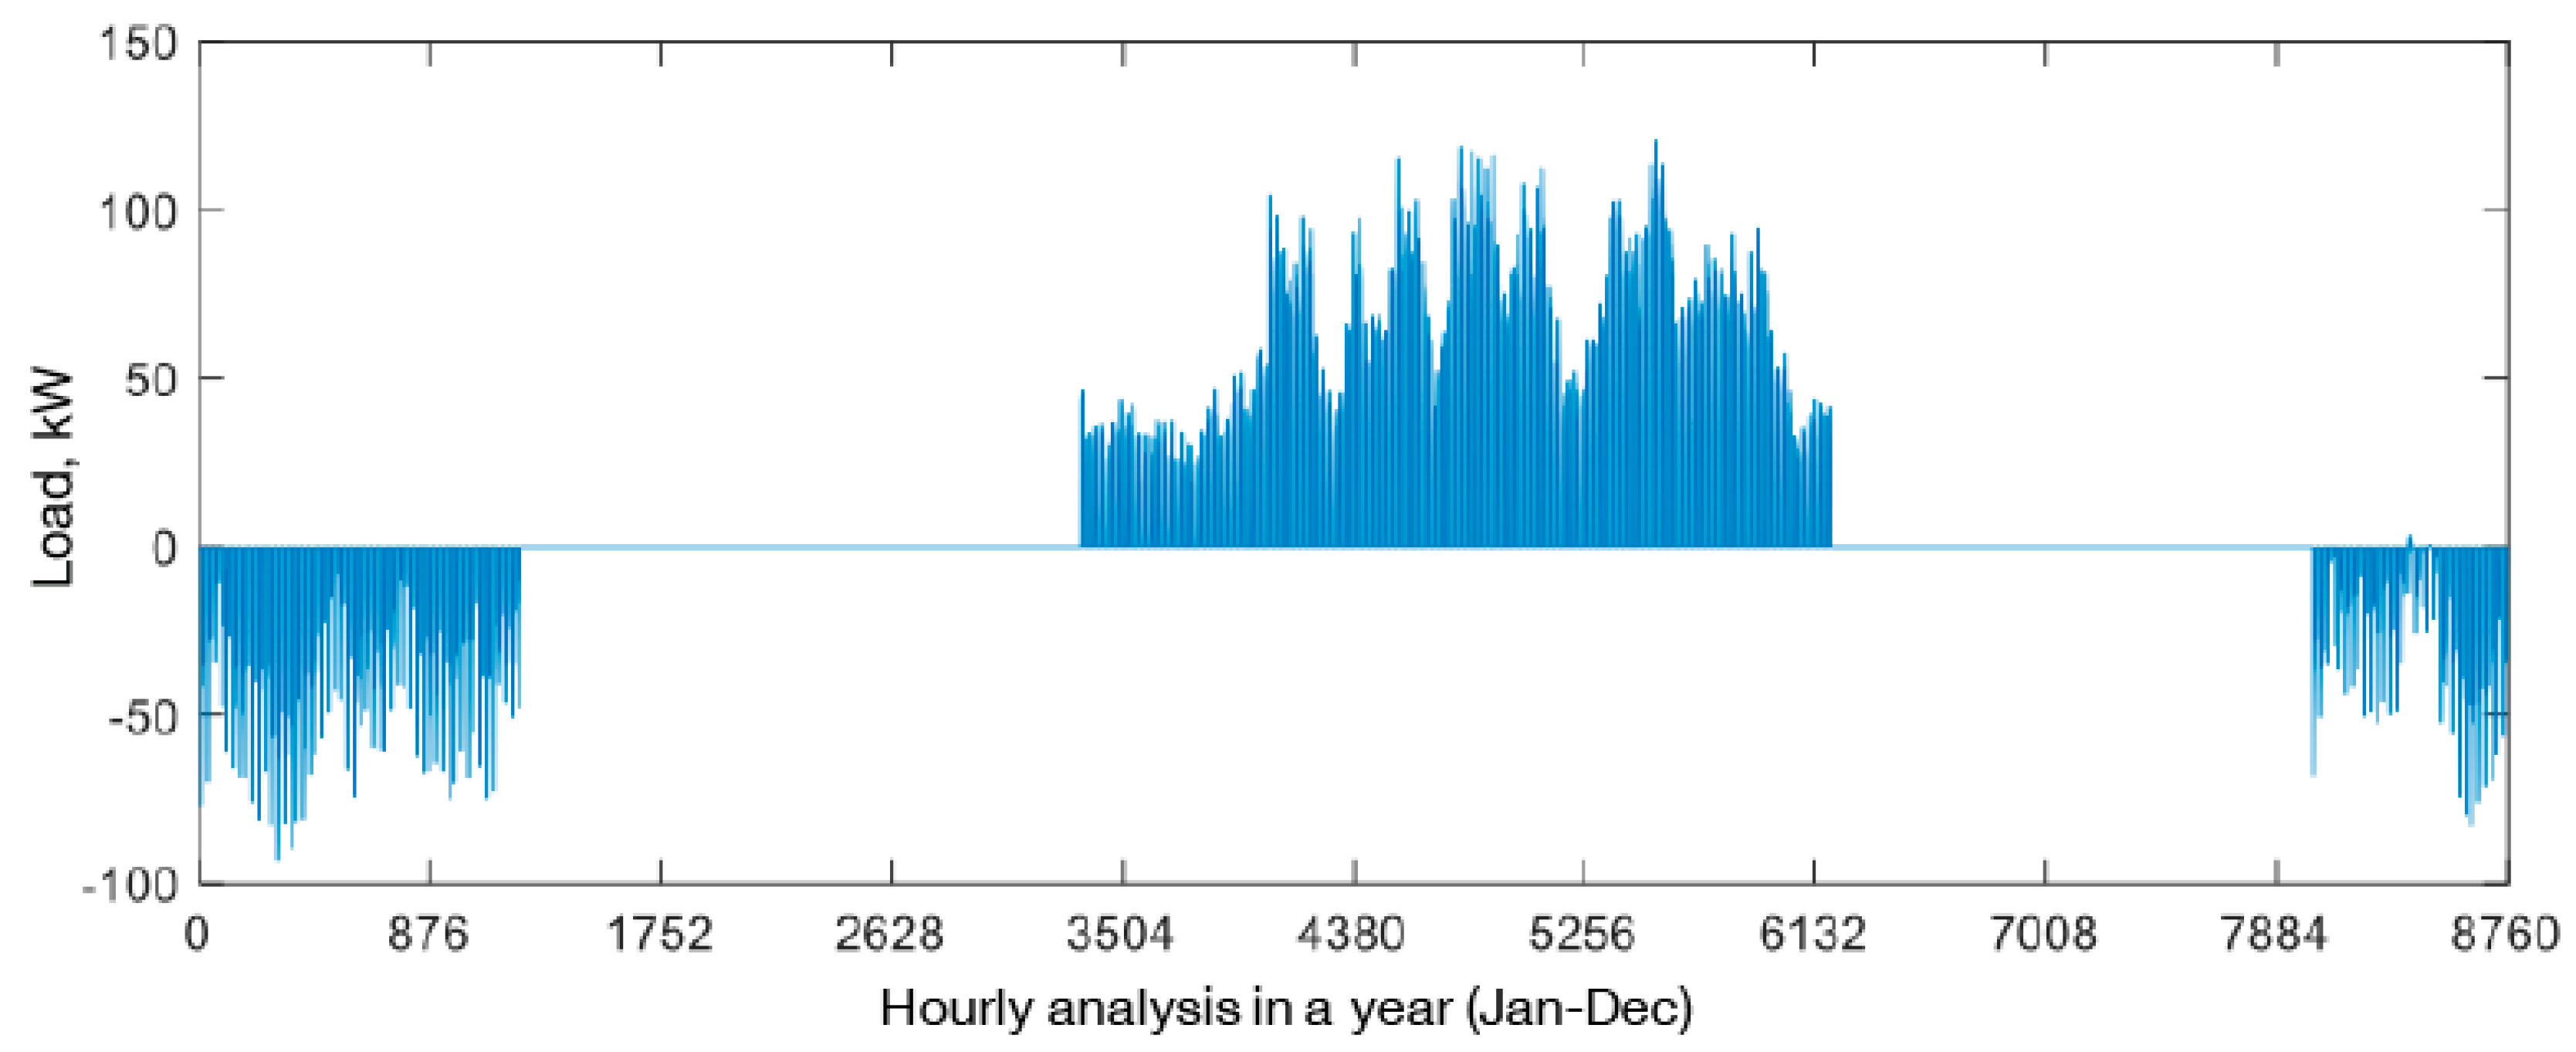
The yearly dynamic heating and cooling load of the office building is calculated and results are shown in Figure 4 and Table 3. As can be seen, the yearly accumulated cooling load is 70,673 kwh, and heating load is 24,735 kwh. By calculating the simulation result, it is found that the heating and cooling load imbalance ratio is about 65% in this case.

2.2. TRNSYS Simulation Model of the GSHP System

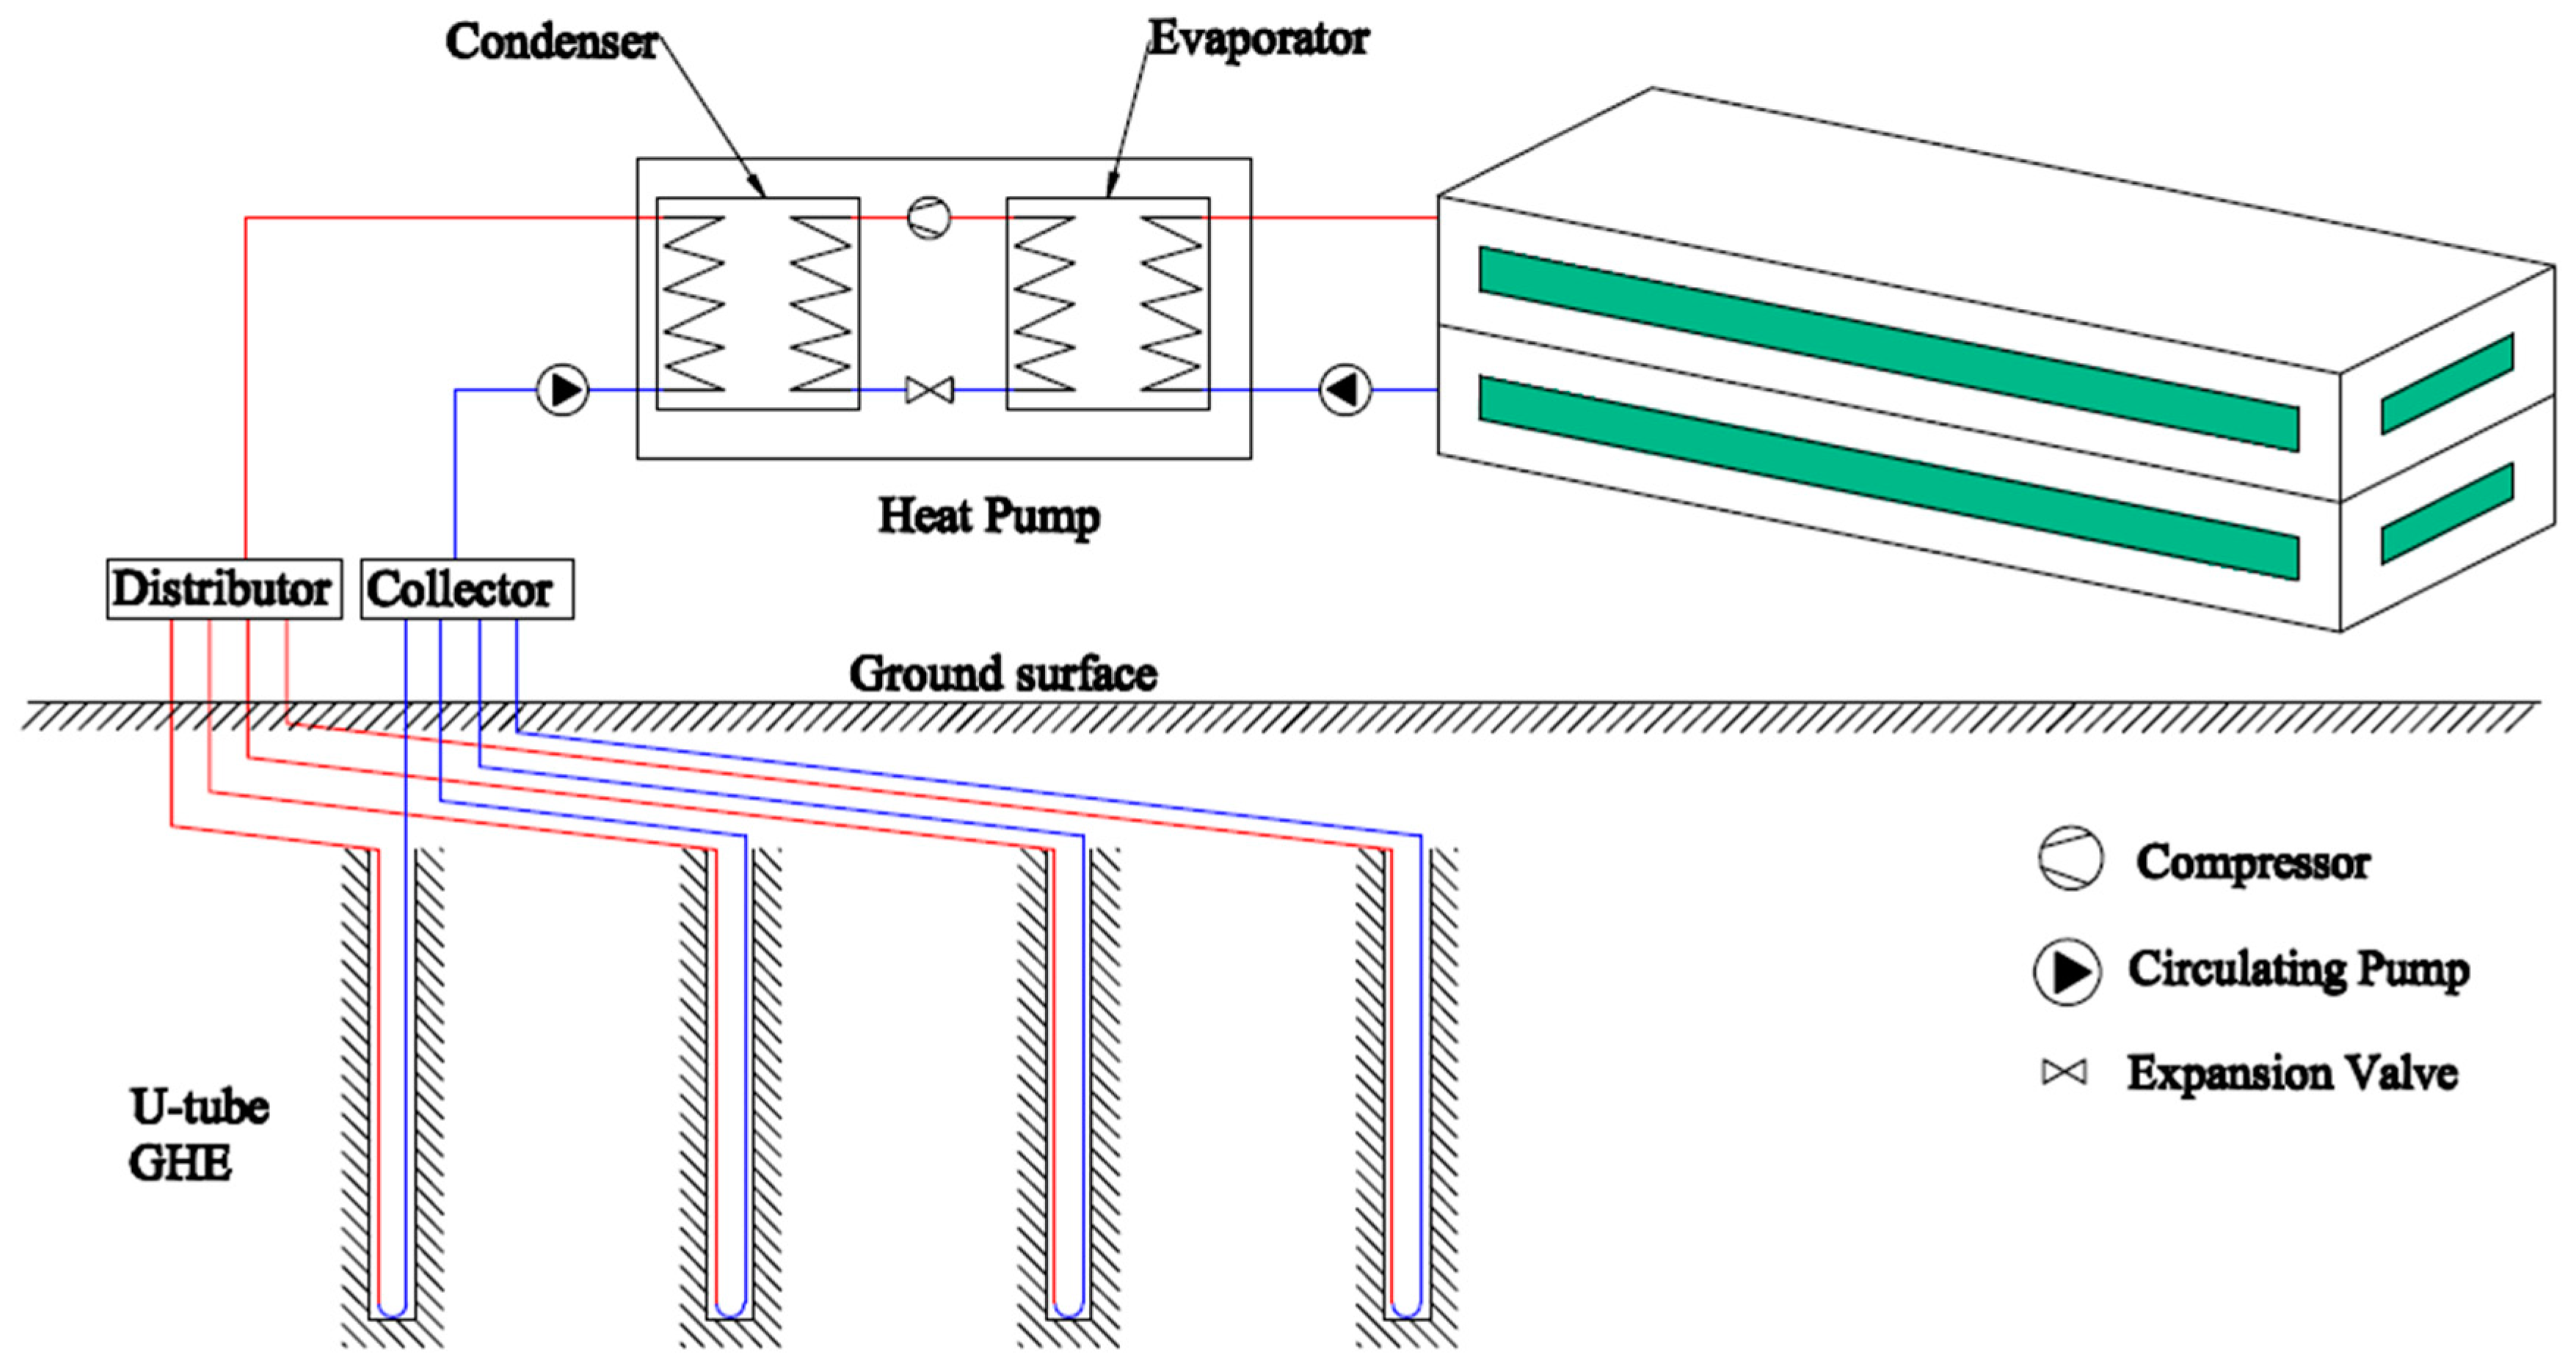
The TRNSYS simulation model of the GSHP system is designed to supply space cooling and heating of the office building. Since the maximum cooling load is more than the maximum heating load, the GSHP system is designed based on the cooling load in order to fulfill the cooling demand. According to the schematic of the GSHP system’s design shown in 
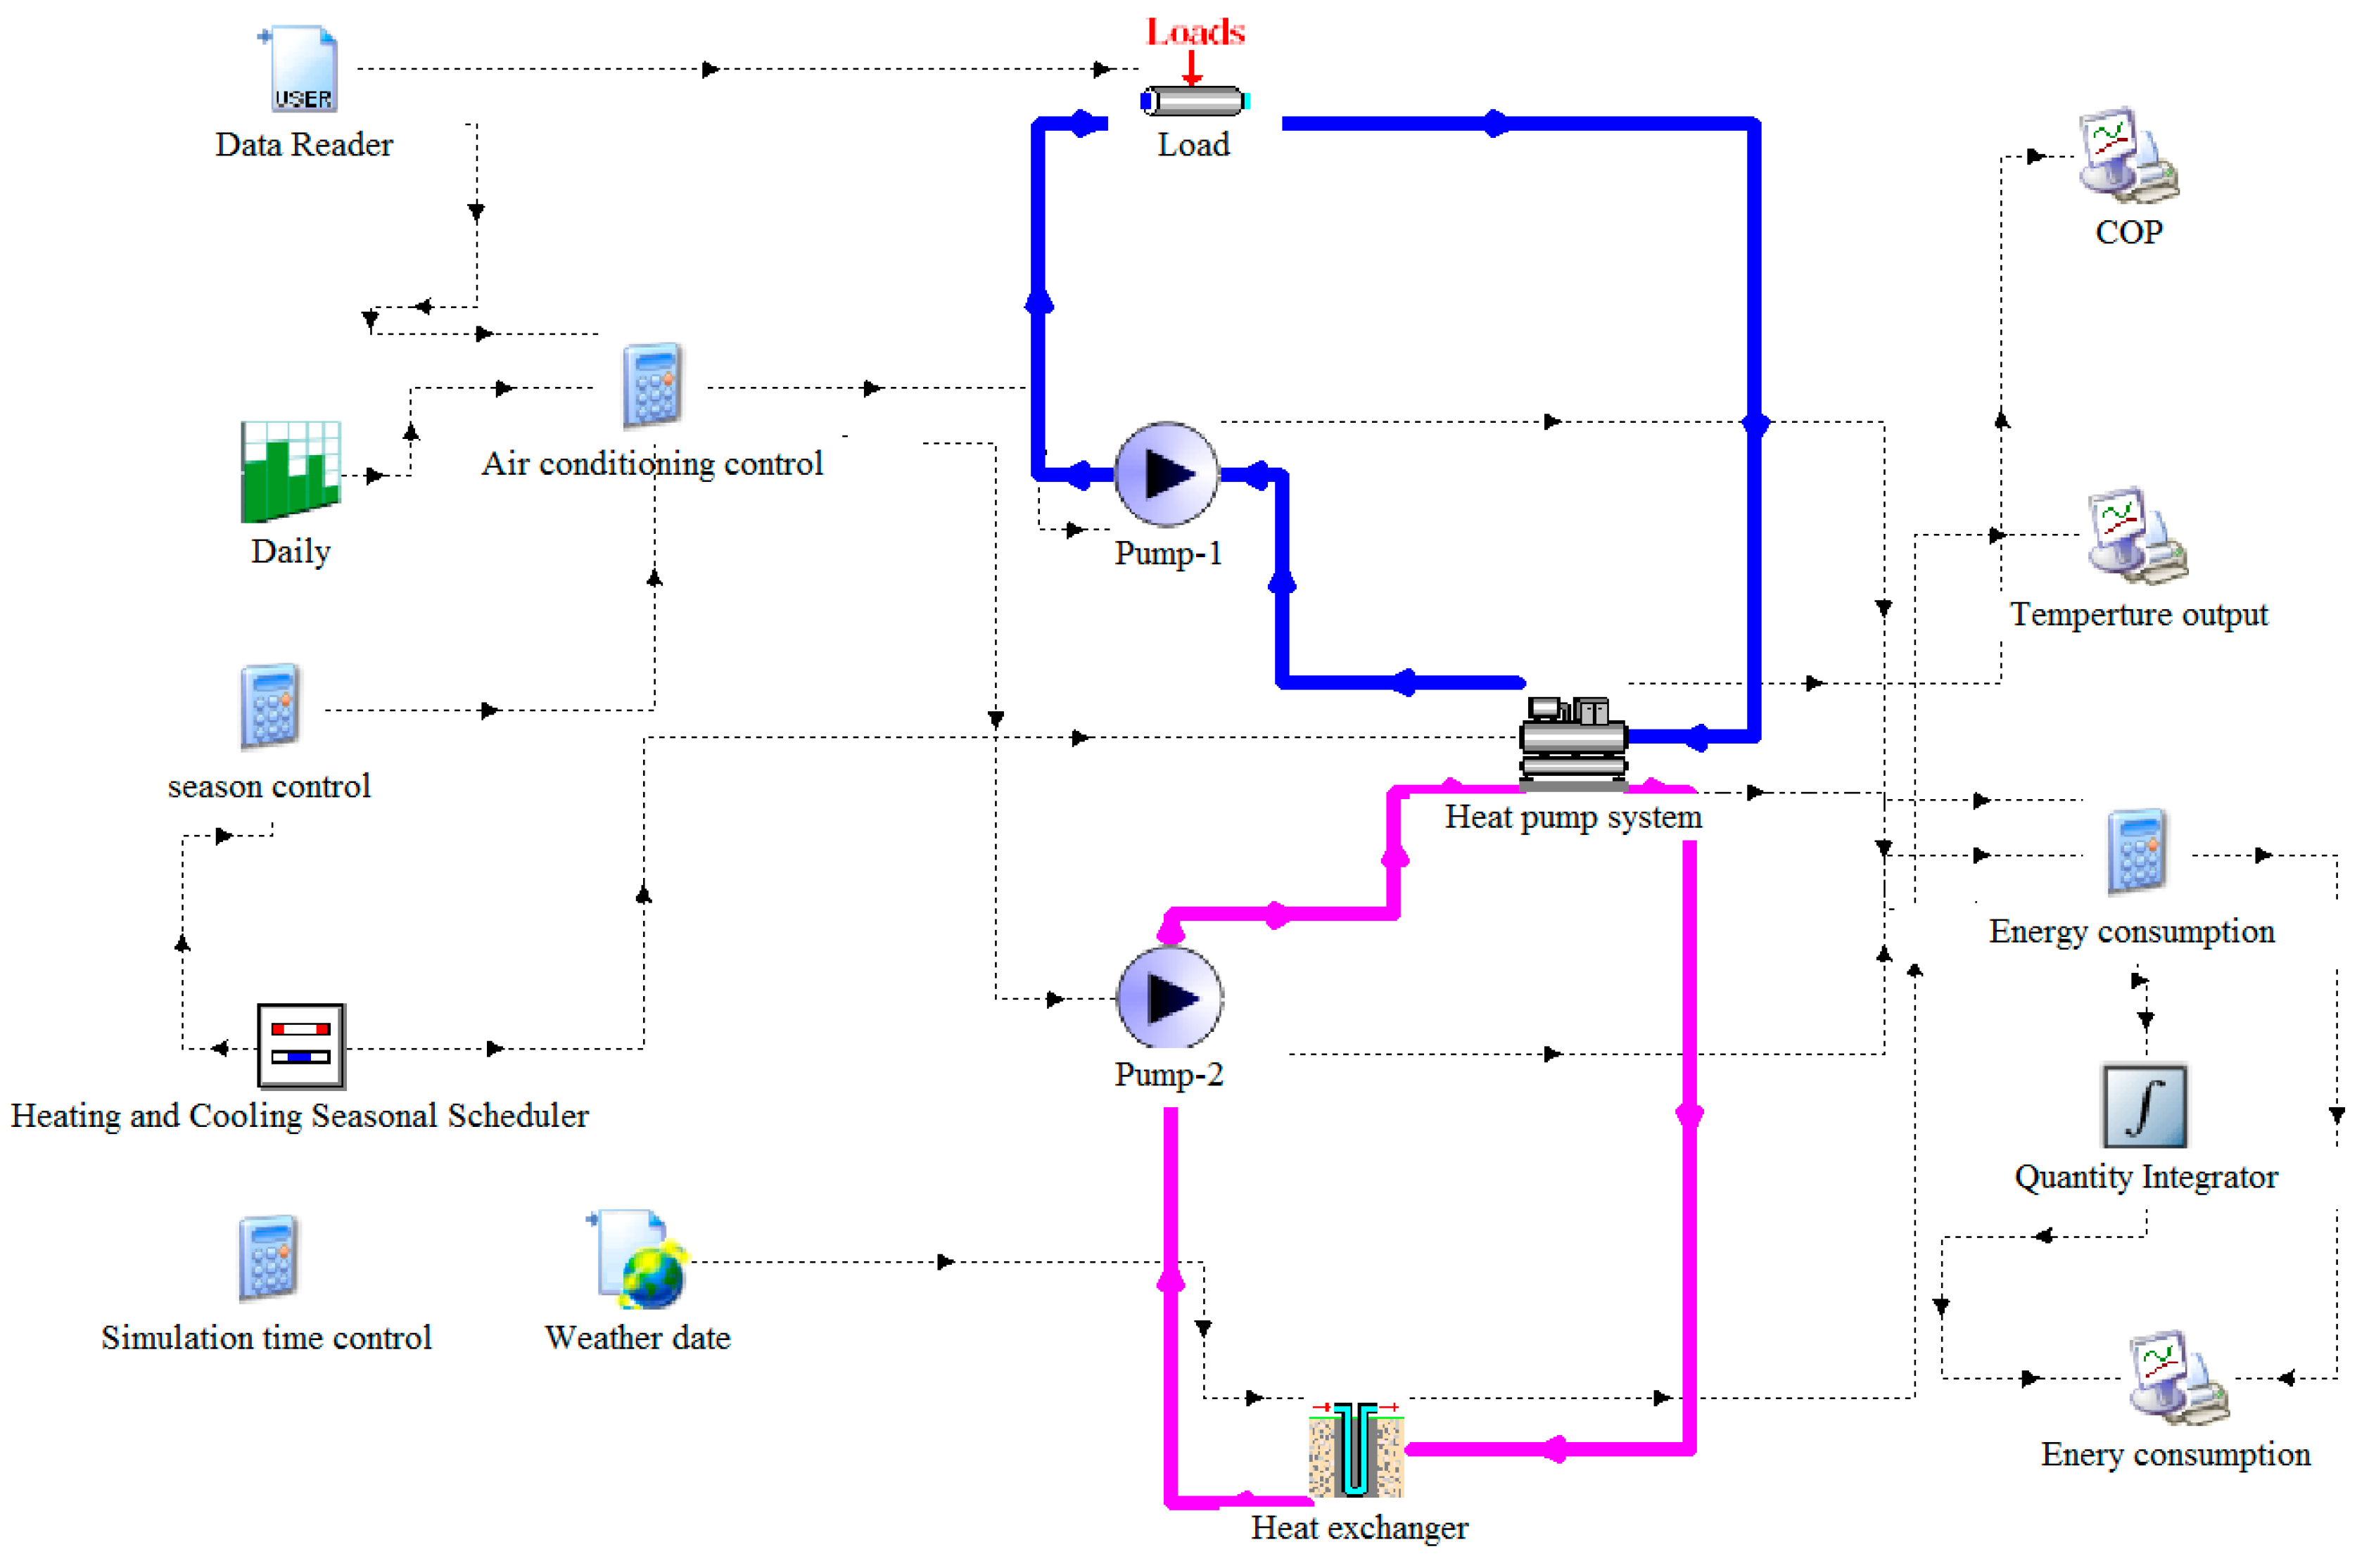
Figure 5, the simulation model of the GSHP system is created in TRNSYS as shown in Figure 6.
The heat pump is selected based on the value of the maximum calculated cooling load. The main parameters of the heat pump are listed in the Table 4 and the component Type-225 (Heat Pump system) represents the water-water heat pump in the TRNSYS simulation model [36].
Two single speed pumps component Type114 (Water pump) are designed in both load side and source side to model a constant speed pump capable of maintaining a constant fluid outlet mass flow rate [35]. The main parameters of the pumps are shown in Table 5.
The GSHP system’s heat exchangers are designed to fulfill the need for the cooling load. To represent a heat exchanger, component Type 557 (Heat Exchanger) is used in this model to be thermally connected to the ground [36]. This component, described as the vertical U-tube, is compiled using a Duct Ground Heat Storage (DST) calculation model developed by Hellstrom, which is able to exchange heat with a heat transfer medium within the ground and give a very accurate analysis calculation [41]. The ground thermal properties data of the heat exchanger design of this model are obtained from an in-situ thermal response test (TRT) of the ground thermal properties conducted in Suzhou. The TRT of the ground thermal property results can be found in the Appendix A. The main heat exchanger design parameters are listed in Table 6.
The in-ground heat exchange is calculated by the equation according to the Chinese national standard “The Technical Code of Ground Source Heat Pump System for Engineering Design, GB50366-2009” [42], the equation is expressed as follows:
Q = Q × ( 1 + 1 E E R )
where:
  • Q is heat released to the ground, kW
  • Q is heat pump cooling capacity, kW
  • EER is the heat pump’s energy efficiency ratio of cooling
The borehole length is calculated using the following equation [32]:
L = Q × 1000 u n i t   l i n e a r   m e t e r   h e a t   e x c h a n g e   c a p a c i t y
The storage volume is calculated in TRNSYS according to the following equation [36]:
Storge   volume = π × Number   of   Boreholes × Borehole   Depth × ( 0.525 × Borehole   spacing ) 2
Component Type 682 (Load) represents the building’s heating and cooling load calculated for the system; and component Type 15-2 (Weather Data) serves the purpose of reading Suzhou weather data imported by Meteonorm 7.0 and making it available to other components. Some other necessary components for the calculation, controlling and processing of data are created and connected in the TRNSYS simulation model of the GSHP system shown above.

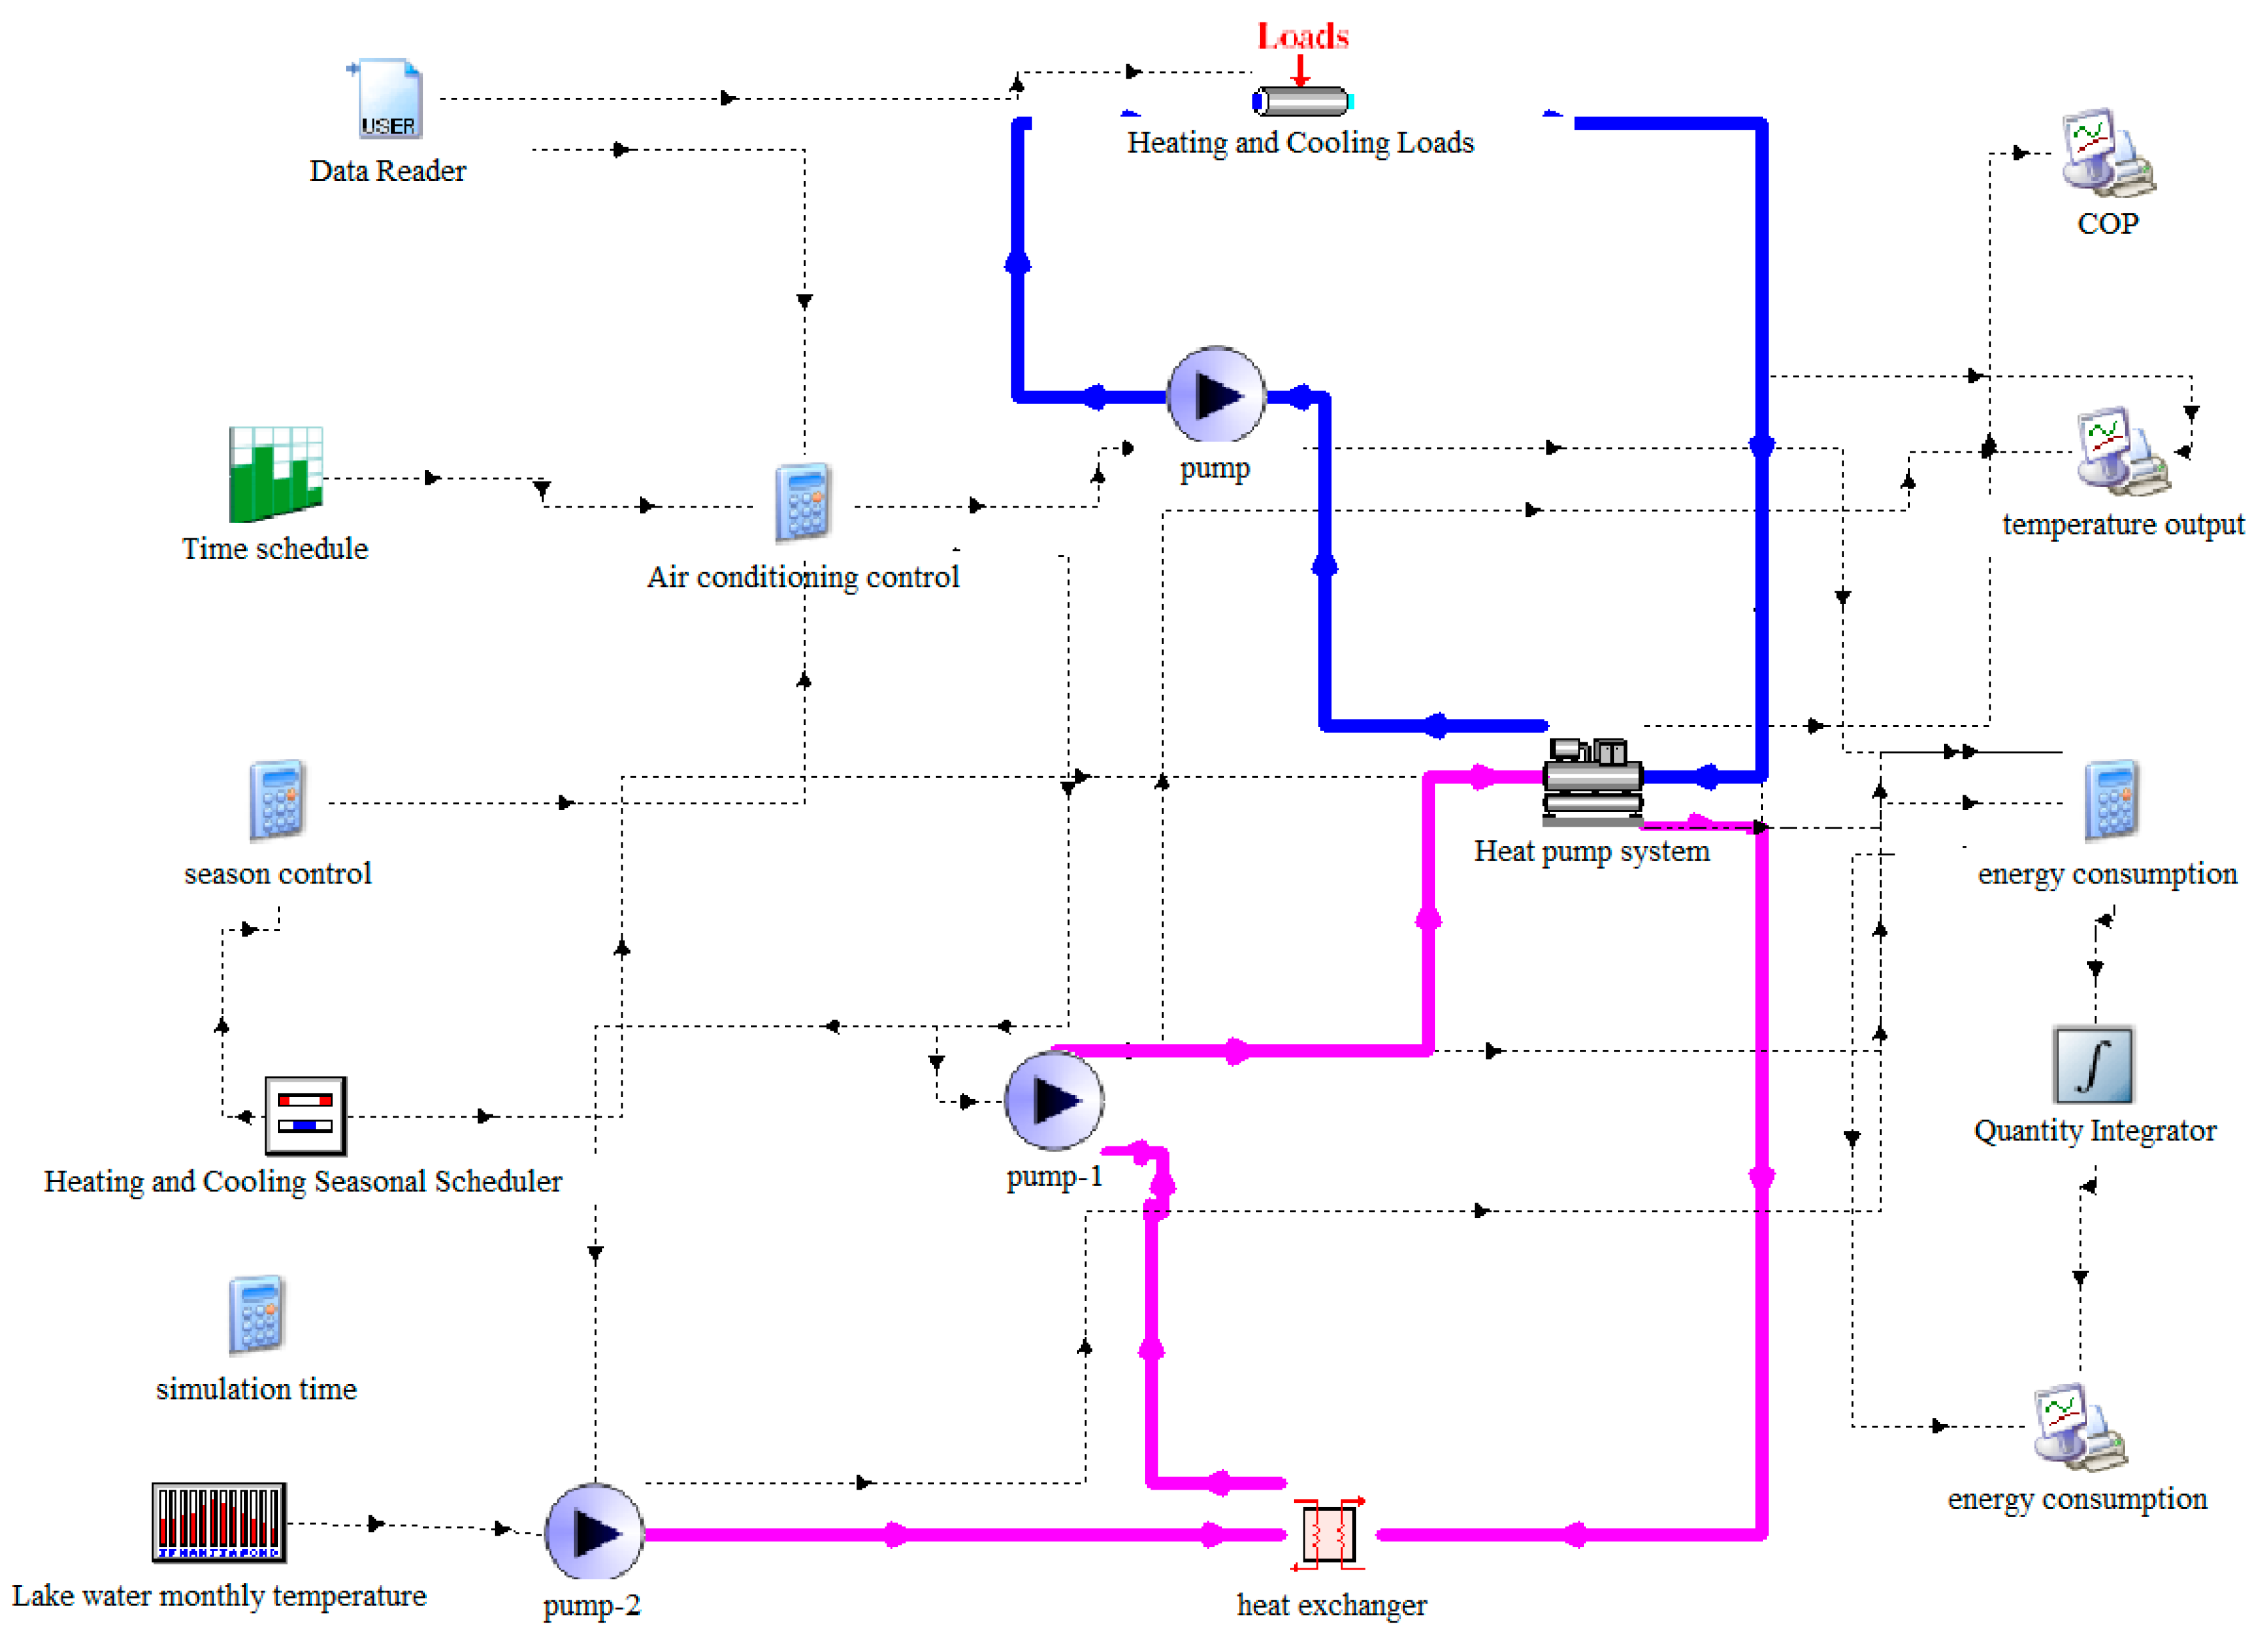
2.3. TRNSYS Simulation Model of the WSHP System

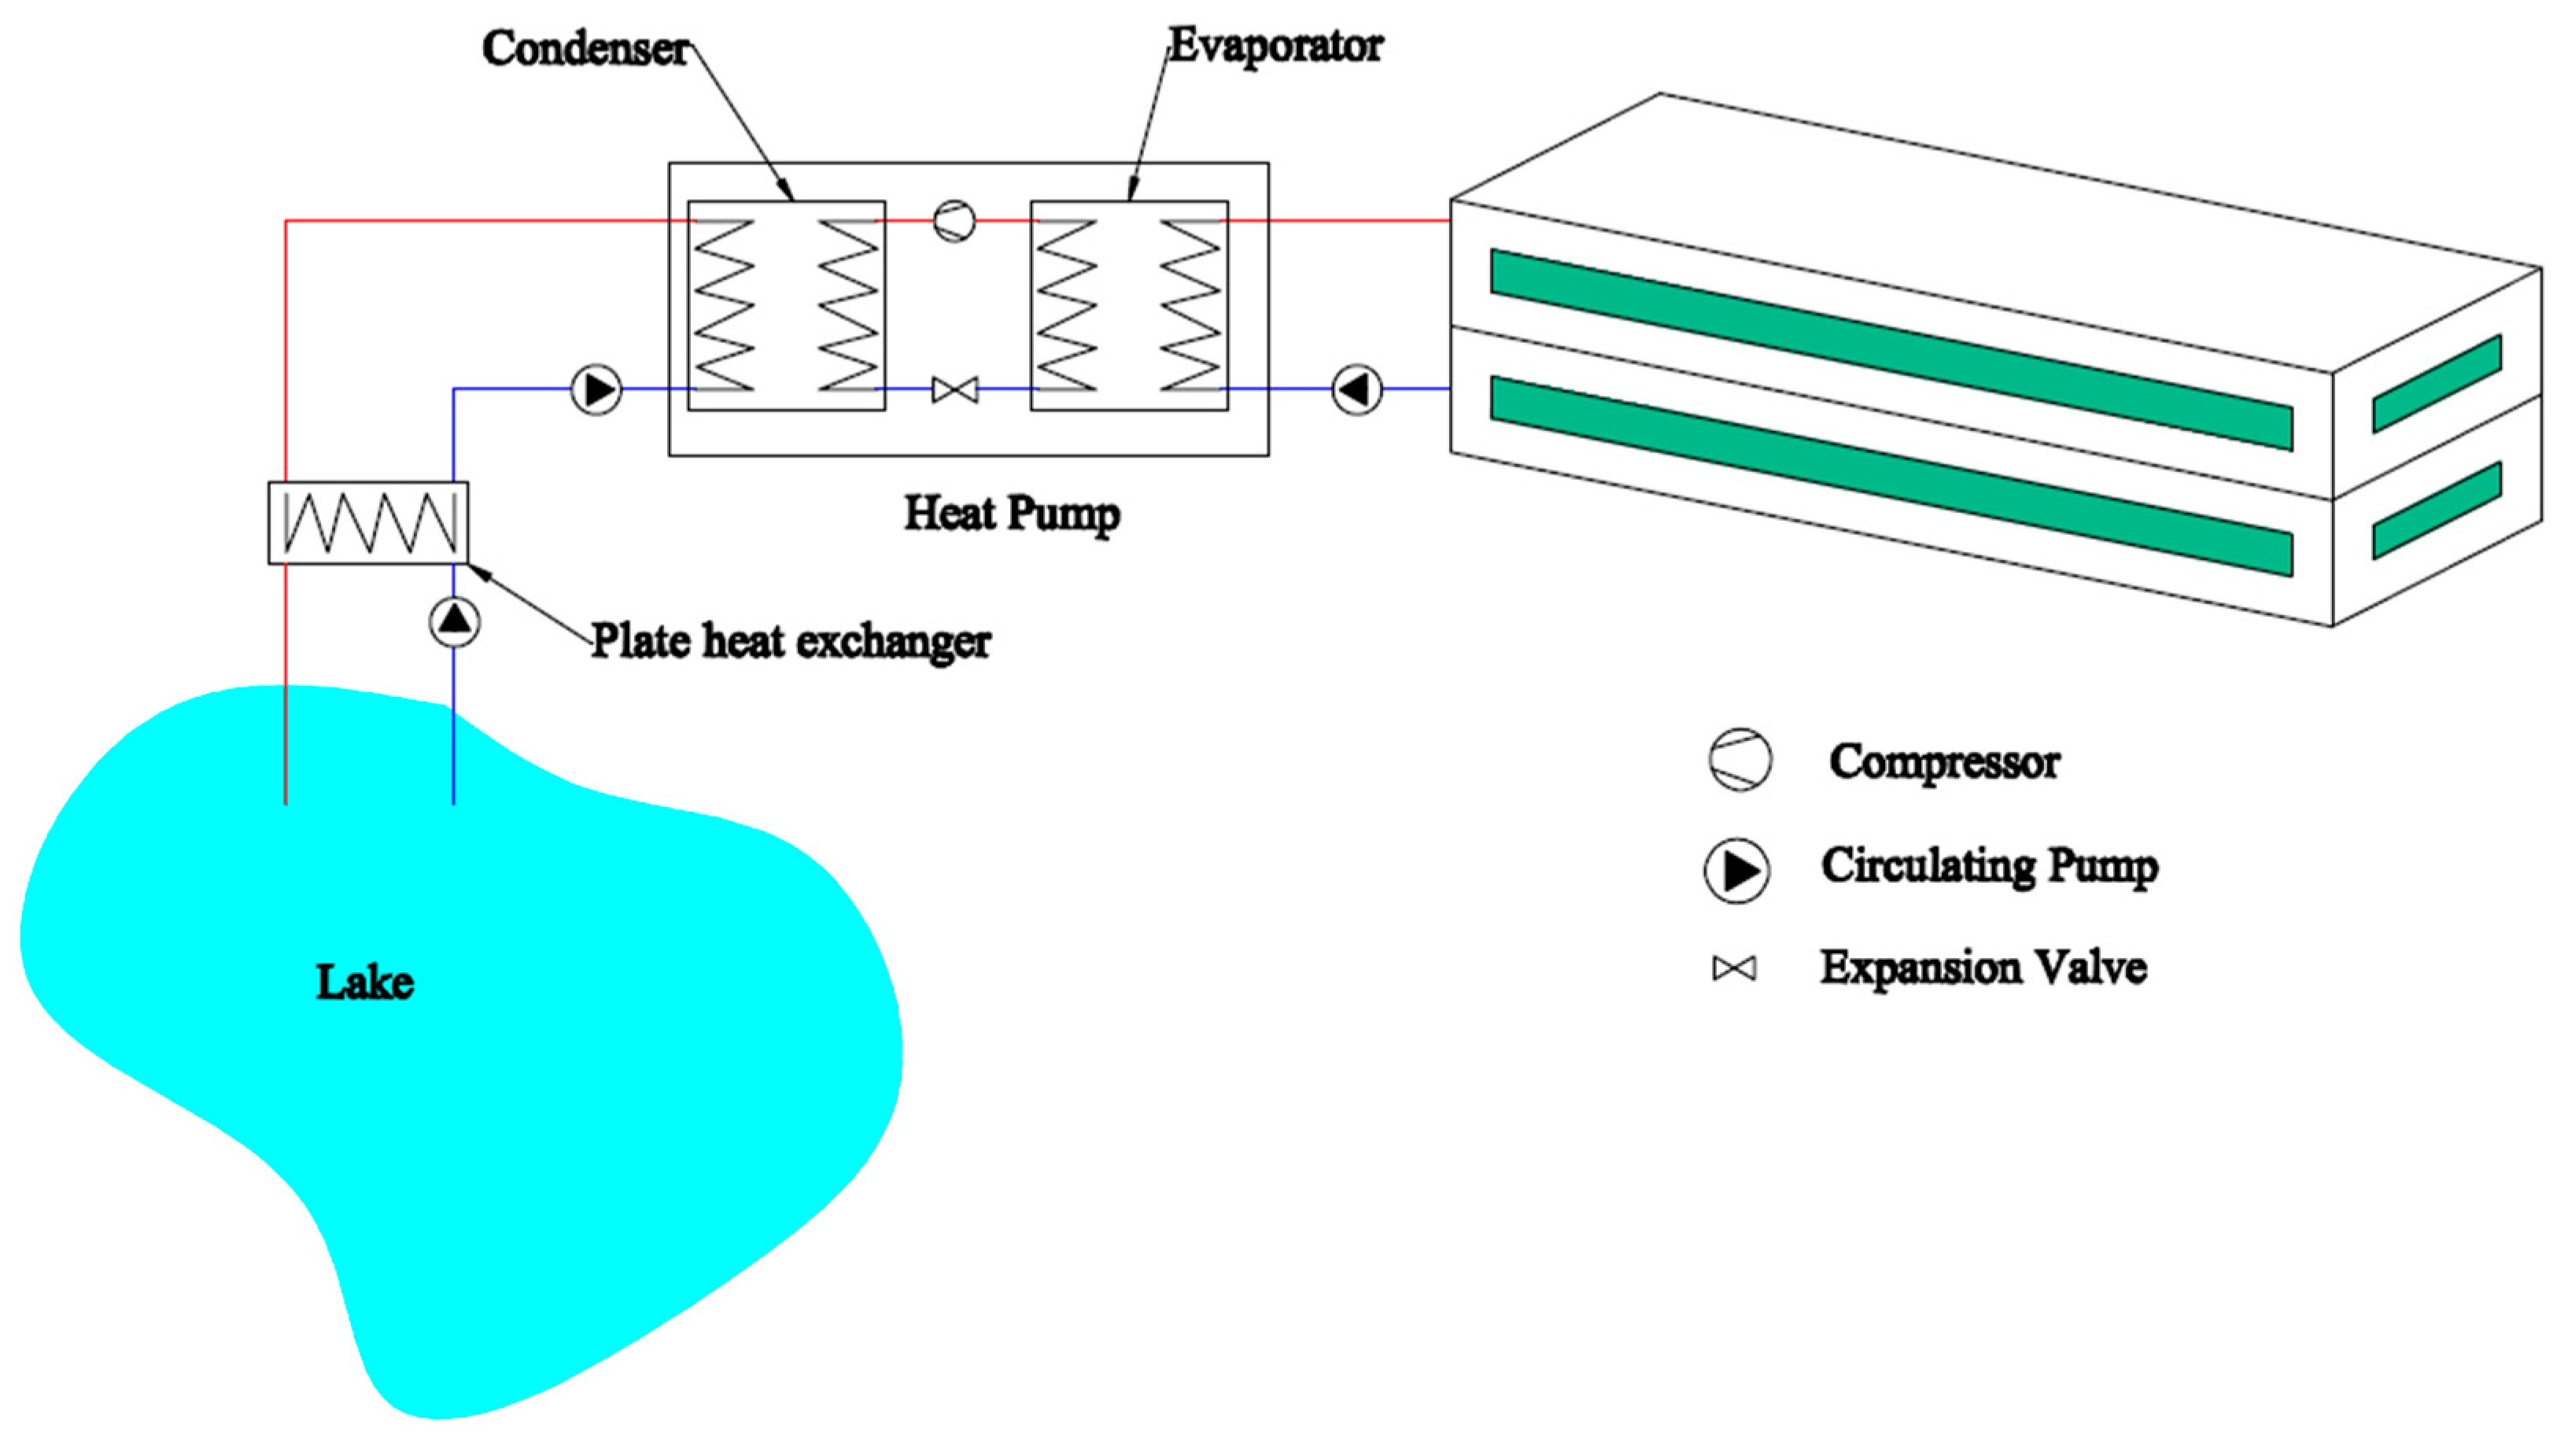
TRNSYS simulation model of the WSHP system is designed to supply space cooling and heating to the office building. The cooling load is more than the heating load, so the WSHP system is designed based on the cooling load in order to fulfill the cooling demand. According to the schematic design of the WSHP system as shown in Figure 7, the simulation model of the WSHP system is created in TRNSYS, as shown in Figure 8.
The heat pump is selected based on the value of the maximum cooling load calculated from the building calculation model. Component Type-225 (Heat Pump System) represents the water-water heat pump in the TRNSYS simulation model [35]. The main parameters of the heat pump unit are listed in Table 7.
Three single speed pumps component Type114 (water pump) are designed: one on the load side, one on the source side, and one for pumping the water from the lake. The pumps’ main parameters are shown in Table 8.
The counter flow plate heat exchanger component Type 5 (heat exchanger) is designed in the lake side of the WSHP simulation model in TRNSYS [36]. The coefficient of heat transfer of the plate heat exchanger is 6500 W/k. The design of the plate heat exchanger based on logarithmic mean temperature difference (LMTD) is expressed as [43,44]:
Δ t m = ( t h i t c o ) ( t h o t c i ) ln t h i t c o t h o t c i
F = Q / β K Δ t m / 3.6
Q = V ρ c p ( t c i t c o ) / 3.6
m = Q c p   ( t c i t c o )
where:
  • Δ t m is the log mean temperature °C
  • t h i is the hot fluid inlet temperature °C
  • t h o is the hot fluid outlet temperature °C
  • t c i is the cold fluid inlet temperature °C
  • t c o is the cold fluid outlet temperature °C
  • F is the heat exchange area m2
  • K is the coefficient of heat transfer of the plate heat exchanger W/m2K
  • Q is the heat load of heat exchanger W
  • V is the volume flow rate m3
  • c p is water specific heat capacity
  • m is the mass flow rate kg/h
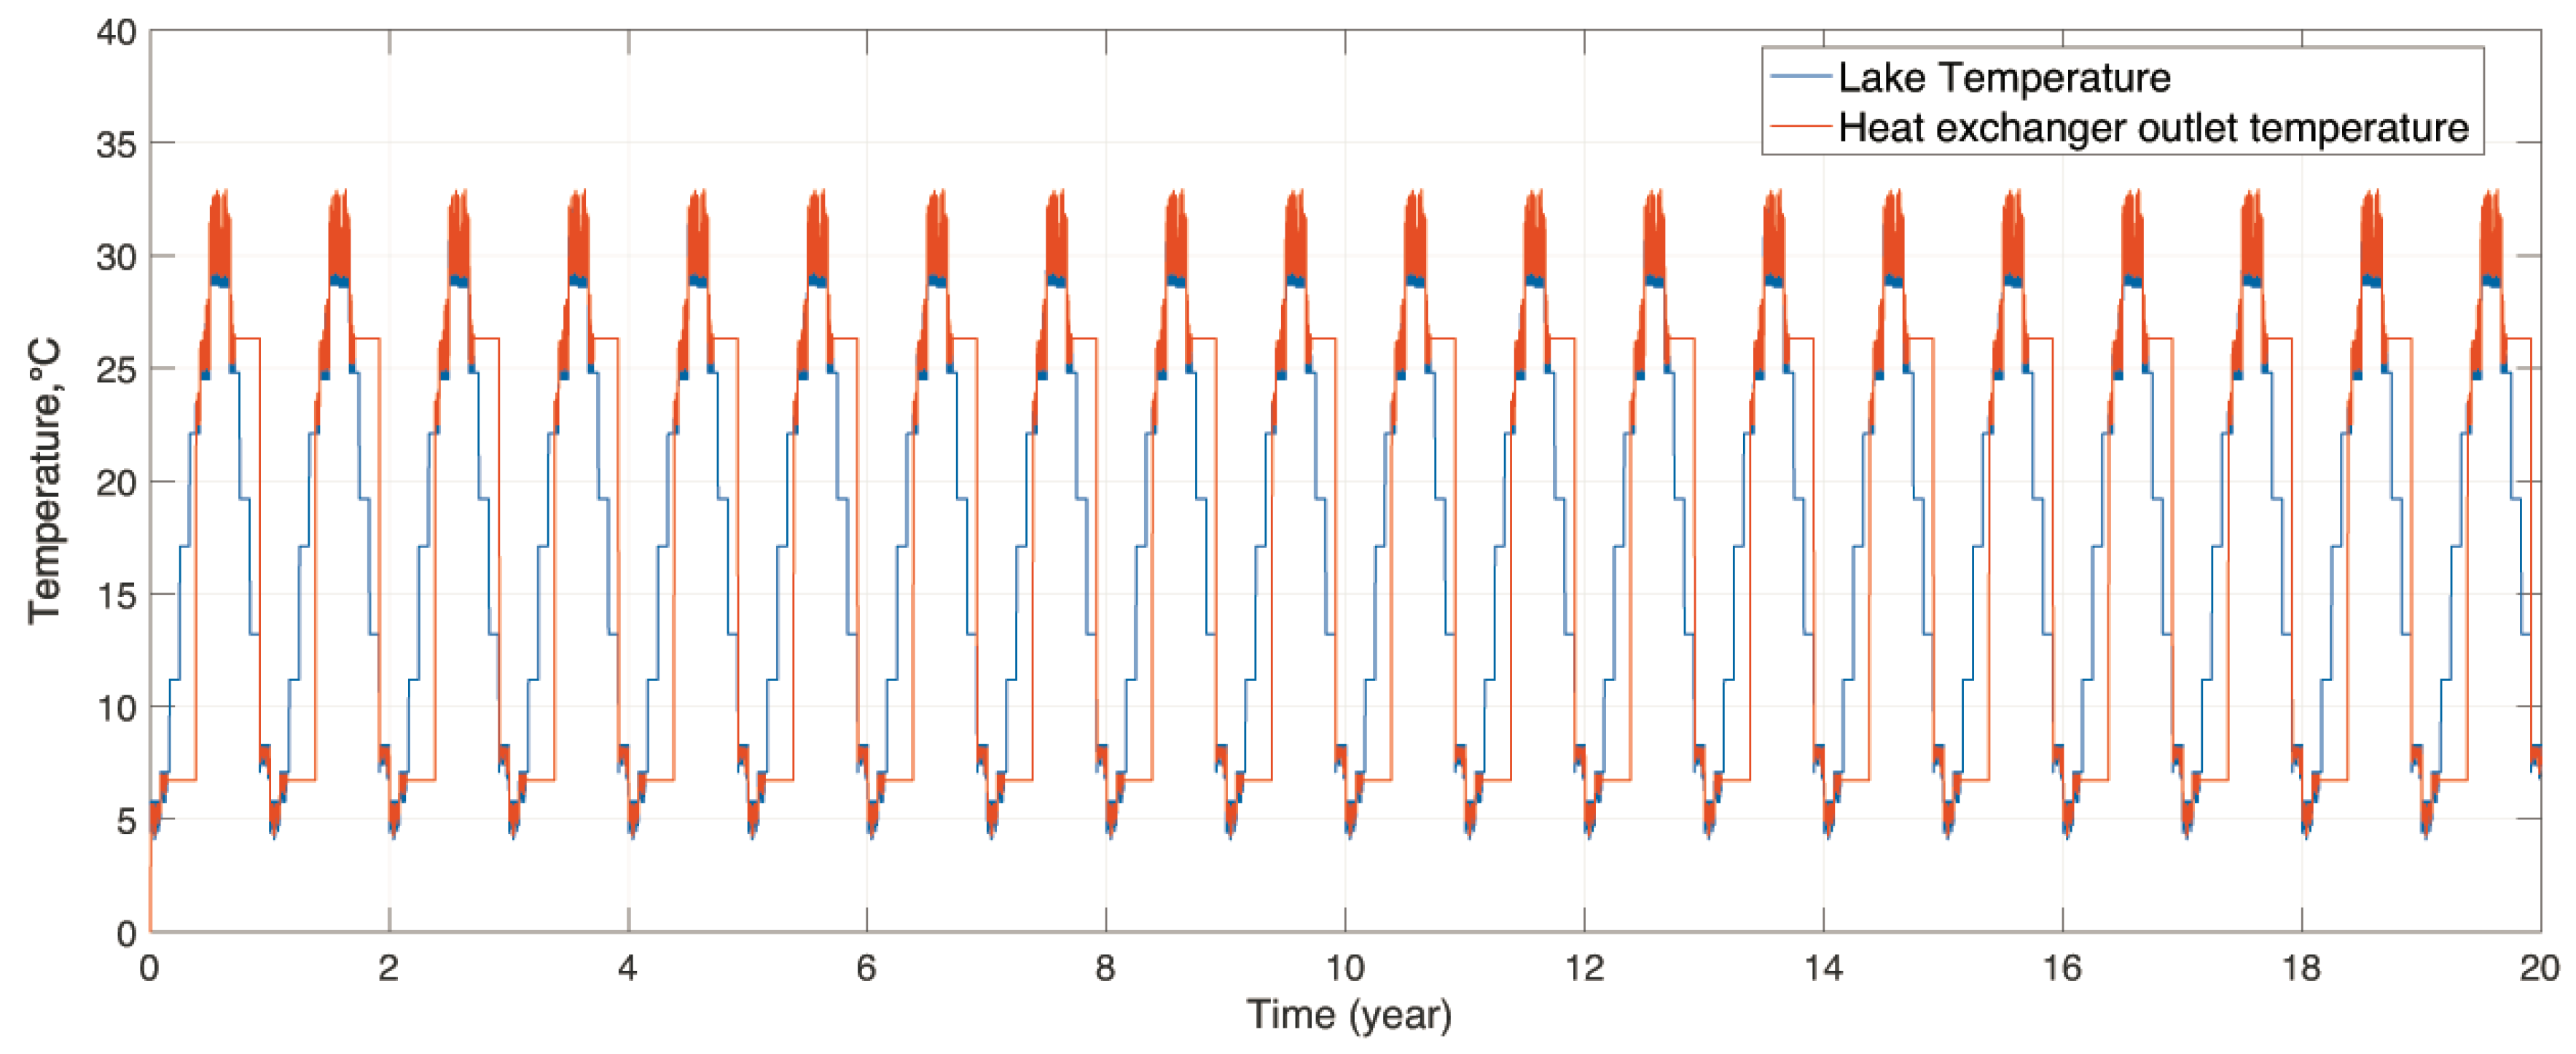
Suzhou’s Tai lake was selected as the water heat source of the WSHP system for the simulation model. The lake is located in the west of Suzhou, the water area is about 2358 km2, and the average depth is about 1.89 m. The data of the lake’s annual monthly temperature at a depth of 0.5 m is reported by Jiangsu Water Resources [45]. The water temperature at a depth of 0.55 m, 1.00 m, 1.45 m, and 1.90 m were tested throughout the year [46]. In the winter and the spring, the water temperature at 0.55 m deep is about 1 °C lower than at 1.45 m deep, while in the summer and autumn the water temperature at 0.55 m is about 0.5 °C lower than at 1.45 m [46]. The water heat exchangers are therefor designed to be 1.45 m under the water for the WSHP simulation model. The lake’s monthly temperatures at 1.45 m are adjusted accordingly and shown in Table 9.
The monthly water temperature of the lake is imported to the simulation model by component Type 518 (Water Monthly Temperature). Component Type 682 (Load) represents the building’s heating and cooling load calculated for the system [36]; other necessary components for calculating, controlling, and processing data are created and connected in the WSHP simulation model.

3. Simulation Result and System Performance Analysis

3.1. Coefficient of Performance (COP)

A one-year simulation is firstly conducted to analyze the system’s performance over its first year of operation.
As can been seen from Figure 9, the GSHP system generally has a higher performance than the WSHP system during the first year of operation from 1st December to 15th March in winter and 15 May to 30 September in summer. During the first operation year, the GSHP system kept a very high COP level during the summer and the WSHP system has a relatively lower COP during very hot days in the summer.
The TRNSYS simulation models for both the GSHP system and the WSHP system conducted the simulations over a 20-year operation period.
Figure 10 illustrates the 20-years operation performance of the GSHP and WSHP systems. As can be seen, the GSHP system’s summer cooling COP decreases gradually during the 20-year operation. According to the calculation results, the average COP for cooling in summer of the GSHP system is 6.58 in the first year, and the average COP for cooling in summer decreases to 5.50 in the 20th year. Compared with the GSHP system, the WSHP system’s COP value is stable throughout the 20-year operating period. The average COP for cooling in summer is 5.84 in the first year and keeps the same value in the 20th year. Therefore, considering a building normally operates more than 40 years in the real world, the GSHP system’s COP will be much lower than that of the WSHP system.

3.2. Heat Source Temperature Influence

The GSHP system’s source side outlet temperature and the ground temperature are shown in Figure 11. As can be clearly seen, both source side outlet temperature and the ground temperature increase gradually every year. In the beginning of the operation, the ground initial temperature is 18.6 °C and the source side outlet temperature is 18.6 °C. After operating for 20 years, the ground temperature is 26.19 °C and the source side outlet temperature is 25.74 °C. The ground temperature increased 7.59 °C, which causes serious ground heat accumulation around heat exchangers. The ground heat accumulation is the major reason for the system’s efficiency decline. In contrast to GSHP system, it can be seen from Figure 12 that the WSHP system’s outlet temperature and water temperature stay constant throughout the 20-year operation period. The water temperature is not therefore influenced by the heat released to the body of water because the lake has a huge water area and water mobility enables the water to recover the heat more quickly than the ground. Compared to the GSHP system, the WSHP system using water as the heat source in Suzhou is more reliable.

3.3. Heat Pump Unit Energy Consumption

Figure 13 illustrates the heat pump energy consumption of the GSHP system and the WSHP system over a 20-year operation period. As can be seen, the GSHPs’ heat pump energy consumption gradually increases. According to the simulation results, the accumulated energy consumption of the GSHP heat pump is 14,893.25 kWh in the first year of operation, while in the 20th year of operation the accumulated energy consumption is 16,587.7 kWh. For the WSHP system, the yearly energy consumption stays constant at 16,577.35 kwh over the 20-year operation period. Compared with the GSHP system, the WSHP system’s energy consumption is higher in the beginning, but as the GSHP system’s heat pump energy consumption increases every year, its energy consumption is higher than the WSHP system after operating for 20 years. Therefore, the GSHP system has no advantage over the WSHP system after operating over the long term in Suzhou.

4. Discussion

4.1. Ground Thermal Imbalance of the GSHP System

The results show that the ground temperature around the heat exchanger rises every year due to the heat imbalance between the heat released in summer and the heat absorbed in winter. As a result of this, the GSHP system’s COP is decreasing all the time, which means that the heat imbalance between the GSHP system and the soil causes “ground heat accumulation”. Xia et al. [47] conducted a long-term comprehensive analysis of the variation in the underground thermal environment and verified a heat imbalance from both the system side and underground side of a large scale GSHP system in a cold winter and hot summer climate zone in China. The real monitoring results found that during the transitions seasons, the natural thermal recovery will not be sufficient for maintaining the underground heat balance in the case where a GSHP system runs for a long period [47]. Therefore, the simulation result is valid. Auxiliary cooling measures, such as cooling towers, are suggested to be used to balance the excess cooling load when designing a GSHP system in the Suzhou area.

4.2. The Coefficient of Performance Analysis

As can been seen from Figure 10 and Figure 12 and Table 9, the COP of WSHP is influenced by the water temperature. The COP declines during hot temperature in summer because the shallow water temperature is influenced by air temperature when the air temperature is very high, especially in July and August. Shallow water bodies mainly absorb heat through solar radiation, heat convection, the earth’s thermal conductivity, and evaporation heat transfer [48]. Gong et al. concluded that for shallow bodies of water, when the water temperature is around 12–20 °C, the WSHP system’s COP is high [49]. Wang et al. studied the temperature variation of the water in depths less than 5 m and found that the thermal stratification phenomenon of water during summer is minimal and the water temperature was strongly influenced by the local ambient temperature [49]. On the other hand, for the GSHP system, it can be seen from Figure 9 and Figure 10, which in the first year of operation the COP value is very high throughout the operation time, especially in summer. However, after long term operation, the COP gradually decreases due to ground heat accumulation around the heat exchangers, while the ground temperature increases year by year. Therefore, considering that the normal operating time for a building is more than 40 years, the GSHP system’s COP will be much lower than the WSHP system’s COP. In conclusion, comparing the COP of the GSHP system and the WSHP system over the long term, the WSHP system performs better and is more reliable in the Suzhou area.

4.3. Energy Assumption and Cost-Effective Analysis

As the COP decreases, the system needs more energy to supply the same amount of heat to the building. As can be seen from Figure 10 and Figure 13, the relationship between the COP and energy consumption for the GSHP system is that as the COP decreases every year, the energy consumption increases accordingly; for WSHP system, the COP and energy are stable throughout the 20 years of operation. In addition to studying the technical benefits of installing a WSHP system instead of a GSHP system in hot summer and cold winter climate zones that have adequate surface water resources, researchers have also conducted studies on the cost effectiveness of GSHP and WSHP systems. Wang et al. studied the investment and maintenance cost of a GSHP system and a WSHP system in Wuhan, with the results showing that the initial investment for a WSHP system is about 36% lower and the maintenance cost is 15% lower than that for a GSHP system [50]. Furthermore, in relation to the ground heat accumulation problem, according to GB 50366-2009 [42], a GSHP system in hot summer and cold winter areas should use auxiliary refrigeration equipment such as cooling towers, which means that the initial investment would be even higher and the energy consumption greater. In conclusion, for long-term operations in the Suzhou area, a WSHP system has low energy consumption and more economical benefits than a GSHP system.

5. Conclusions

This paper analyzed the numerical modeling simulation long term performance of a GSHP system and a WSHP system for an office building in Suzhou, China. Based on Suzhou’s meteorological data and the building envelope thermal property parameters, an office building model was created by using TRNbuild of TRNSYS and the dynamic cooling and heating load was calculated. Models for a WSHP system and a GSHP system were created using TRNSYS and a 20-year operation period of the two systems was simulated. The simulation results of the COP, the heat source temperature variation, and the energy consumption were analyzed for these two systems. Results of the analysis showed that the performance of the WSHP system is influenced by the local ambient temperature, especially during hot summer. The COP and energy consumption of the WSHP system are higher than the GSHP system at the beginning of the systems’ operation. However, the long-term performance of the WSHP system is superior to the GSHP system over a 20-year operation period. For the GSHP system, the ground temperature increase of 7.59 °C causes serious ground heat accumulation around the heat exchangers. The COP of the GSHP system reduced by 16.4%, while the energy consumption increased year by year. In conclusion, the WSHP system has a more stable long-term performance than the GSHP system in the Suzhou area. The outcome of this research could provide the valuable reference for local geothermal heat pump system design as well as for other cities in the hot summer and cold winter region of China.
In addition to the crucial findings of this research, some technical limitations remain to be explored through further studies. A public building was selected with a focus on annual weather data and average lake temperature. However, since climate change and global warming impacts not only building energy loads but also actual surface lake temperatures through heavy rainfall and surrounding soil temperature variations, further studies should consider the sensitivity of lake temperature variations over a long-term period. This is especially important where surrounding environment variations are relatively sensitive and highly weighted to lake thermal conditions compared to ground source temperatures. Future studies should consider the impacts of climate change, global warming and rainfall variations on building energy performance in relation to ground resource and water resource heat pump systems.

Author Contributions

Conceptualization, W.M. and M.K.K.; methodology, W.M. and M.K.K.; validation, W.M.; formal analysis, W.M. and M.K.K.; investigation, W.M. and M.K.K.; resources, J.H. and M.K.K.; Software, W.M.; writing original draft preparation, W.M. and M.K.K.; writing—review and editing, J.H. and M.K.K.; supervision, M.K.K.

Funding

This research received no external funding.

Conflicts of Interest

The authors declare no conflict of interest.

Appendix A. Results of TRT

Thermal response tests (TRTs) were conducted by Fullshare Energy Co., Ltd. in Suzhou according to the “Technical code for ground-source heat pump system (GB50366-2009)“ [42], and “Technical specification for buries plastic pipeline of water supply engineering and Closed-loop Ground-source Heat Pump System Design and Installation Standard” [51]. The test borehole and buried tube heat exchanger (BHE) installation parameters are listed in Table A1, while the test results of ground thermal properties are listed in Table A2.
Table A1. Test borehole and buried tube heat exchanger (BHE) installation parameters.
BoreholeTypeSingle-U
Borehole depth (m)100
Backfill materialOriginal soil backfill
PipeOuter diameter (mm)32
Thickness (mm)3.0
MaterialHDPE
Table A2. Test result of ground thermal properties.
Ground Initial Temperature (°C)Ground Thermal Conductivity (W/mk)Ground Heat Capacity (kJ/m3K)Backfill Thermal Conductivity (W/mK)Unit Linear Meter Heat Release/Extraction (W/m)
18.61.9726331.9756/37

References

  1. Yang, H.; Cui, P.; Fang, Z. Vertical-borehole ground-coupled heat pumps: A review of models and systems. Appl. Energy 2010, 87, 16–27. [Google Scholar] [CrossRef]
  2. Bouheret, S.; Bernier, M. Modelling of a water-to-air variable capacity ground-source heat pump. J. Build. Perform. Simul. 2018, 11, 283–293. [Google Scholar] [CrossRef]
  3. Liu, X.; Lu, S.; Hughes, P.; Cai, Z. A comparative study of the status of GSHP applications in the United States and China. Renew. Sustain. Energy Rev. 2015, 48, 558–570. [Google Scholar] [CrossRef]
  4. Ni, L.; Dong, J.; Yao, Y.; Shen, C.; Qv, D.; Zhang, X. A review of heat pump systems for heating and cooling of buildings in China in the last decade. Renew. Energy 2015, 84, 30–45. [Google Scholar] [CrossRef]
  5. Bejan, A. Advanced Engineering Thermodynamics, 4th ed.; Electronic Resource; John Wiley & Sons Inc.: Hoboken, NJ, USA, 2017. [Google Scholar]
  6. Torio, H.; Schmidt, D. Development of system concepts for improving the performance of a waste heat district heating network with exergy analysis. Energy Build. 2010, 42, 1601–1609. [Google Scholar] [CrossRef]
  7. Shukuya, M. Exergy: Theory and Applications in the Built Environment; Green Energy and Technology; Springer: London, UK, 2013. [Google Scholar]
  8. Kim, M.K.; Leibundgut, H.; Choi, J.H. Energy and exergy analyses of advanced decentralized ventilation system compared with centralized cooling and air ventilation systems in the hot and humid climate. Energy Build. 2014, 79, 212–222. [Google Scholar] [CrossRef]
  9. Meggers, F.; Pantelic, J.; Baldini, L.; Saber, E.M.; Kim, M.K. Evaluating and adapting low exergy systems with decentralized ventilation for tropical climates. Energy Build. 2013, 67, 559–567. [Google Scholar] [CrossRef]
  10. Meggers, F.; Ritter, V.; Goffin, P.; Baetschmann, M.; Leibundgut, H. Low exergy building systems implementation. Energy 2012, 41, 48–55. [Google Scholar] [CrossRef]
  11. Kim, M.K.; Liu, J.Y.; Cao, S.J. Energy analysis of a hybrid radiant cooling system under hot and humid climates: A case study at Shanghai in China. Build. Environ. 2018, 137, 208–214. [Google Scholar] [CrossRef]
  12. Baldini, L.; Kim, M.K.; Leibundgut, H. Decentralized cooling and dehumidification with a 3 stage LowEx heat exchanger for free reheating. Energy Build. 2014, 76, 270–277. [Google Scholar] [CrossRef]
  13. Kim, M.K.; Leibundgut, H. Advanced Airbox cooling and dehumidification system connected with a chilled ceiling panel in series adapted to hot and humid climates. Energy Build. 2014, 85, 72–78. [Google Scholar] [CrossRef]
  14. Kim, M.K.; Baldini, L. Energy analysis of a decentralized ventilation system compared with centralized ventilation systems in European climates: Based on review of analyses. Energy Build. 2016, 111, 424–433. [Google Scholar] [CrossRef]
  15. Fan, R.; Gao, Y.; Hua, L.; Deng, X.; Shi, J. Thermal performance and operation strategy optimization for a practical hybrid ground-source heat-pump system. Energy Build. 2014, 78, 238–247. [Google Scholar] [CrossRef]
  16. Qi, Z.; Gao, Q.; Liu, Y.; Yan, Y.Y.; Spitler, J.D. Status and development of hybrid energy systems from hybrid ground source heat pump in China and other countries. Renew. Sustain. Energy Rev. 2014, 29, 37–51. [Google Scholar] [CrossRef]
  17. Liao, P.-C.; Zhang, K.; Wang, T.; Wang, Y. Integrating bibliometrics and roadmapping: A case of strategic promotion for the ground source heat pump in China. Renew. Sustain. Energy Rev. 2016, 57, 292–301. [Google Scholar] [CrossRef]
  18. Byrne, P.; Miriel, J.; Lenat, Y. Modelling and simulation of a heat pump for simultaneous heating and cooling. Build. Simul. 2012, 5, 219–232. [Google Scholar] [CrossRef] [Green Version]
  19. Wang, Y.; Wong, K.K.; Liu, Q.H.; Jin, Y.T.; Tu, J. Improvement of energy efficiency for an open-loop surface water source heat pump system via optimal design of water-intake. Energy Build. 2012, 51, 93–100. [Google Scholar] [CrossRef]
  20. Montagud, C.; Corberán, J.M.; Ruiz-Calvo, F. Experimental and modeling analysis of a ground source heat pump system. Appl. Energy 2013, 109, 328–336. [Google Scholar] [CrossRef]
  21. Kaneko, S.; Uchida, Y.; Shrestha, G.; Ishihara, T.; Yoshioka, M. Factors affecting the installation potential of ground source heat pump systems: A comparative study for the Sendai Plain and Aizu Basin, Japan. Energies 2018, 11, 2860. [Google Scholar] [CrossRef]
  22. Shrestha, G.; Uchida, Y.; Ishihara, T.; Kaneko, S.; Kuronuma, S. Assessment of the installation potential of a ground source heat pump system based on the groundwater condition in the Aizu Basin, Japan. Energies 2018, 11, 1178. [Google Scholar] [CrossRef]
  23. Zhao, Z.C.; Shen, R.; Feng, W.; Zhang, Y.; Zhang, Y. Soil thermal balance analysis for a ground source heat pump system in a hot-summer and cold-winter region. Energies 2018, 11, 1206. [Google Scholar] [CrossRef]
  24. Zhu, J.L.; Hu, K.Y.; Lu, X.L.; Huang, X.X.; Liu, K.T.; Wu, X.J. A review of geothermal energy resources, development, and applications in China: Current status and prospects. Energy 2015, 93, 466–483. [Google Scholar] [CrossRef]
  25. Luo, J.; Lou, Z.; Xie, J.; Xia, D.; Huang, W.; Shao, H.; Xiang, W.; Rohn, J. Investigation of shallow geothermal potentials for different types of ground source heat pump systems (GSHP) of Wuhan city in China. Renew. Energy 2018, 118, 230–244. [Google Scholar] [CrossRef]
  26. Mitchell, M.S.; Spitler, J.D. Open-loop direct surface water cooling and surface water heat pump systems—A review. HVAC&R Res. 2013, 19, 125–140. [Google Scholar]
  27. Ahmad, T.; Chen, H.; Shair, J. Water source heat pump energy demand prognosticate using disparate data-mining based approaches. Energy 2018, 152, 788–803. [Google Scholar] [CrossRef]
  28. Zhao, Z.; Zhang, Y.; Mi, H.; Zhou, Y.; Zhang, Y. Experimental research of a water-source heat pump water heater system. Energies 2018, 11, 1205. [Google Scholar] [CrossRef]
  29. Peer, T.; Joyce, W.S. Lake-source cooling. ASHRAE J. 2002, 44, 37–39. [Google Scholar]
  30. Schibuola, L.; Scarpa, M. Experimental analysis of the performances of a surface water source heat pump. Energy Build. 2016, 113, 182–188. [Google Scholar] [CrossRef]
  31. Chiang, C.-Y.; Yang, R.; Yang, K.-H.; Lee, S.-K. Performance analysis of an integrated heat pump with air-conditioning system for the existing hospital building application. Sustainability 2017, 9, 530. [Google Scholar] [CrossRef]
  32. MOHURD. The Design Standard for Energy Efficiency of Public Buildings; Ministry of Housing and Urban-Rural Development of China: Beijing, China, 2015.
  33. Yong, S.-G.; Kim, J.-H.; Gim, Y.; Kim, J.; Cho, J.; Hong, H.; Baik, Y.-J.; Koo, J. Impacts of building envelope design factors upon energy loads and their optimization in US standard climate zones using experimental design. Energy Build. 2017, 141, 1–15. [Google Scholar] [CrossRef]
  34. Xu, J.; Kim, J.-H.; Hong, H.; Koo, J. A systematic approach for energy efficient building design factors optimization. Energy Build. 2015, 89, 87–96. [Google Scholar] [CrossRef]
  35. Razavi, S.H.; Ahmadi, R.; Zahedi, A. Modeling, simulation and dynamic control of solar assisted ground source heat pump to provide heating load and DHW. Appl. Therm. Eng. 2018, 129, 127–144. [Google Scholar] [CrossRef]
  36. Klein, S.A.; Beckman, W.A.; Mitchell, J.W.; Duffie, J.A.; Duffie, N.A.; Freeman, T.L. Transient System Simulation Tool, Version 17, User Manual; Solar Energy Laboratory University of Wisconsin-Madison: Madison, WI, USA, 2010. [Google Scholar]
  37. Madani, H.; Claesson, J.; Lundqvist, P. A descriptive and comparative analysis of three common control techniques for an on/off controlled Ground Source Heat Pump (GSHP) system. Energy Build. 2013, 5, 1–9. [Google Scholar] [CrossRef]
  38. Liu, Z.; Li, Y.; Xu, W.; Yin, H.; Gao, J.; Jin, G.; Lun, L.; Jin, G.H. Performance and feasibility study of hybrid ground source heat pump system assisted with cooling tower for one office building based on one Shanghai case. Energy 2019, 173, 8–37. [Google Scholar] [CrossRef]
  39. Emmi, G.; Zarrella, A.; De Carli, M.; Galgaro, A. An analysis of solar assisted ground source heat pumps in cold climates. Energy Convers. Manag. 2015, 106, 660–675. [Google Scholar] [CrossRef]
  40. Vassileva, N.; Georgiev, A.; Popov, R. Simulation study of hybrid ground-source heat pump system with solar collectors. Bulg. Chem. Commun. 2016, 48, 71–76. [Google Scholar]
  41. Hellstrom, G. Duct Ground Heat Storage Model, Manual for Computer Code; Department of Mathematical Physics of University of Lund: Lund, Sweden, 1989. [Google Scholar]
  42. Ministry of Housing and Urban-Rural Development of the People’s Republic of China The Technical Code of Ground Source Heat Pump System for Engineering Design GB50366-2009; Ministry of Housing and Urban-Rural Development of the People’s Republic of China: Beijing, China, 2009.
  43. U.S. Department of Energy. Thermodynamics, Heat Transfer and Fluid Flow; DOE Fundamentals Handbook; Department of Energy: Washington, DC, USA, 2016.
  44. Nitsche, M.; Gbadamosi, R.O. Chapter 2: Calculation of the temperature differences LMTD and CMTD. In Heat Exchanger Design Guide; Butterworth Heinemann: Oxford, UK, 2016; pp. 21–35. [Google Scholar]
  45. Chen, S.; Lu, J.; Shen, J. Tai Lake Water Body Temperature Variation Pattern Preliminary Study; Jiangsu Water Resources: Nanjing, China, 2009; pp. 38–39. [Google Scholar]
  46. Zhao, L.; Zhu, G.; Chen, Y.; Li, M.; Zhu, M.; Yao, X.; Cai, L. Thermal stratification and its influence factors in a large-sized and shallow Lake Taihu. Adv. Water Sci. 2011, 22, 844–850. [Google Scholar]
  47. Xi, J.; Li, Y.; Liu, M.; Wang, R.Z. Study on the thermal effect of the ground heat exchanger of GSHP in the eastern China area. Energy 2017, 141, 56–65. [Google Scholar] [CrossRef]
  48. Gong, G.; Zhang, X.; Lu, L.; Zeng, L. Discussion on method of designed reference water temperature in winter for water source heat pump system. Build. Sci. Chin. 2016, 32, 128–133. [Google Scholar]
  49. Zhang, J.; Su, S.; Liu, L.; Zhou, C.; Shi, L. TRNSYS Simulation of Hybrid Ground Source Heat Pump System Based on Cooling Conditions, in International Forum on Energy, Environment Science and Materials (IFEESM 2015); Atlantis Press: Shenzhen, China, 2015; pp. 456–461. [Google Scholar]
  50. Wang, W.; Liu, Y. Research of adaptability of different types of GHP in Wuhan. Contam. Control Air-Cond. Technol. 2014, 1, 80–82. [Google Scholar]
  51. International Ground Source Heat Pump Association, Oklahoma State University. Closed-Loop Geothermal Heat Pump Systems, Design and Installation Standard; International Ground Source Heat Pump Association, Oklahoma State University: Stillwater, OK, USA, 2016. [Google Scholar]
Figure 1. Three-dimensional (3D) office building model.
Sustainability 11 03282 g001
Figure 2. Transient System Simulation (TRNSYS) simulation model for calculating the building’s heating and cooling load.
Sustainability 11 03282 g002
Figure 3. Suzhou typical meteorological year outdoor dry-bulb and wet-bulb temperature.
Sustainability 11 03282 g003
Figure 4. Cooling and heating load of the office building.
Sustainability 11 03282 g004
Figure 5. Schematic diagram of Ground Source Heat Pump (GSHP) system.
Sustainability 11 03282 g005
Figure 6. TRNSYS simulation model of the GSHP system.
Sustainability 11 03282 g006
Figure 7. Schematic diagram of Water Source Heat Pump (WSHP) system.
Sustainability 11 03282 g007
Figure 8. TRNSYS simulation model of the WSHP system.
Sustainability 11 03282 g008
Figure 9. COP of the GSHP system and the WSHP system during the first year of operation.
Sustainability 11 03282 g009
Figure 10. GSHP and WSHP system’s COP over a 20-year operation period.
Sustainability 11 03282 g010
Figure 11. Source side outlet and ground temperature of GSHPs over a 20-year operation period.
Sustainability 11 03282 g011
Figure 12. Heat exchanger outlet temperature and lake temperature of WSHP over a 20-year operation period.
Sustainability 11 03282 g012
Figure 13. GSHP system’s heat pump energy consumption over 20-year operation period.
Sustainability 11 03282 g013
Table 1. Window-wall ratio of the office building.
Window-Wall Ratio
SouthwardNorthwardEastwardWestward
41.01%41.01%10.08%10.08%
Table 2. Main thermal design parameters of the building envelope.
Heat Transfer Coefficient of External Wall [W/(m2 k)]Heat Transfer Coefficient of Roof [W/(m2 k)]Heat Transfer Coefficient of External Windows [W/(m2 k)]Solar Heat Gain Coefficient of External Windows
0.6 0.42.30.4
Table 3. Results of the cooling and heating load of the office building.
Accumulated Cooling Load (kWh)Maximum Cooling Load (kW)Accumulated Heating Load (kWh)Maximum Heating Load (kW)Imbalance Ratio
70,673120.6824,73592.9265.00%
Table 4. Main parameter of the heat pump unit.
Cooling Capacity (kW)Cooling Energy Efficiency Ratio (EER)Heating Capacity (kW)Heating Coefficient of Performance (COP)
1406.381584.70
Table 5. Main parameters of the pumps.
Load Side Water PumpSource Side Water Pump
Flow Rate (m3/h)Pump Head (m)Power (kW)Flow Rate (m3/h)Pump Head (m)Power (kW)
25.0025.002.3135.0020.002.59
Table 6. Main heat exchanger design parameters.
Initial Temperature of the Ground (°C)Thermal Conductivity of the Ground (W/mk)Heat Capacity of the Ground (kJ/m3K)Thermal Conductivity of the Backfill (W/mK)Distance between Boreholes (m)
18.61.9726331.974
Borehole Depth (m)Borehole NumberPipe MaterialPipe Diameter (mm)Type
10032High-density Polyethylene (HDPE)DN32Single-U
Unit Linear Meter Heat Exchange (w/m)
52.5
Table 7. Main parameters of the heat pump unit.
Cooling Capacity (kW)Cooling EERHeating Capacity (kW)Heating COP
1406.381584.70
Table 8. Main parameters of pumps.
Load Side Water PumpSource Side Water Pump
Flow Rate (m3/h)Pump Head (m)Power (kW)Flow Rate (m3/h)Pump Head (m)Power (kW)
25.0025.002.3135.0020.002.59
Table 9. Tai lake’s annual monthly temperature, adjusted at 1.45 m under surface.
Month123456789101112
Average water temperature (°C)5.87.111.217.122.124.528.728.624.819.213.28.3

